Article

Semantic Segmentation of Key Categories in Transmission Line Corridor Point Clouds Based on EMAFL-PTv3

1
Engineering Research Center of Ministry of Education for Lightning Protection and Grounding Technology, School of Electrical Engineering and Automation, Wuhan University, Wuhan 430072, China
2
School of Electrical Engineering and Automation, Wuhan University, Wuhan 430072, China
*
Author to whom correspondence should be addressed.
Electronics 2025, 14(4), 650; https://doi.org/10.3390/electronics14040650
Submission received: 8 January 2025 / Revised: 6 February 2025 / Accepted: 6 February 2025 / Published: 8 February 2025

Abstract

:
Accurate and efficient segmentation of key categories of transmission line corridor point clouds is one of the prerequisite technologies for the application of transmission line drone inspection. However, current semantic segmentation methods are limited to a few categories, involve cumbersome processes, and exhibit low accuracy. To address these issues, this paper proposes EMAFL-PTv3, a deep learning model for semantic segmentation of transmission line corridor point clouds. Built upon Point Transformer v3 (PTv3), EMAFL-PTv3 integrates Efficient Multi-Scale Attention (EMA) to enhance feature extraction at different scales, incorporates Focal Loss to mitigate class imbalance, and achieves accurate segmentation into five categories: ground, ground wire, insulator string, pylon, and transmission line. EMAFL-PTv3 is evaluated on a dataset of 40 spans of transmission line corridor point clouds collected by a drone in Wuhan and Xiangyang, Hubei Province. Experimental results demonstrate that EMAFL-PTv3 outperforms PTv3 in all categories, with notable improvements in the more challenging categories: insulator string (IoU 67.25%) and Pylon (IoU 91.77%), showing increases of 7.06% and 11.39%, respectively. The mIoU, mA, and OA scores reach 90.46%, 92.86%, and 98.07%, representing increases of 5.49%, 2.75%, and 2.44% over PTv3, respectively, proving its superior performance.

1. Introduction

As modern social economies continue to develop, the demand for electricity steadily increases. Transmission lines and their ancillary structures, as the primary carriers of power transmission, play a vital role [1]. Ensuring their safe and stable operation is essential for maintaining the continuity and reliability of the power supply. With the continuous expansion of the power grid and the increasing complexity of the geographical environment, traditional inspection methods, primarily manual, have numerous drawbacks, including high labor intensity, low efficiency, significant subjectivity, and challenges with accurate quantification. These drawbacks make it increasingly challenging to address the complex and dynamic environments and potential hazards in transmission line corridors, rendering them insufficient to meet the urgent demand for intelligent management in modern power systems [2,3,4].
In recent years, with the development of remote sensing and artificial intelligence technology, the method of using drones equipped with Light Detection and Ranging (LiDAR) to inspect power transmission lines has been widely used [5]. As an advanced active optical remote sensing technology, LiDAR enables the rapid acquisition of high-accuracy three-dimensional (3D) point cloud data from transmission line corridors. It accurately reconstructs the physical contours and spatial layout of the transmission line corridor and its surrounding environment, providing a solid data foundation for identifying potential safety hazards and implementing refined operation and maintenance strategies [6]. Intelligent inspection applications of transmission lines based on drone-mounted LiDAR point clouds rely on segmented, visualized, and high-precision 3D spatial geographic information for support. However, the raw point cloud data consists of millions of discrete points with 3D coordinate information, which are irregular, unstructured, and disordered. The complex transmission line corridor environment, coupled with the massive volume of point cloud data, presents significant challenges for data mining and information analysis. Accurately segmenting and extracting key categories with semantic information, such as transmission lines, insulator strings, pylons, and ground, from transmission line corridor point clouds remains an urgent challenge. Automatic segmentation of point clouds into these categories is crucial for enabling subsequent tasks, such as line condition assessment, fault diagnosis, intelligent operation and maintenance decision-making, and other practical engineering applications. For instance, accurate segmentation of insulator strings aids in the timely detection of defects, such as aging and breakage [7]; accurate extraction of transmission lines facilitates the analysis of potential risks, such as changes in line sag and foreign body attachment [8], clear segmentation of pylons assists in evaluating structural stability [9,10], and precise ground segmentation provides a crucial foundation for overall scene understanding and safe distance monitoring [11].
Point cloud semantic segmentation is studied to address these challenges. It is one of the core challenges in 3D computer vision, aiming to assign semantic labels to each point in point cloud data, thereby enabling a precise understanding of complex 3D scenes [12]. In the field of power systems, research on point cloud semantic segmentation primarily focuses on extracting key objects from complex transmission line corridors. Early point cloud segmentation methods relied heavily on traditional geometric features and manually designed multi-stage processing workflows to segment and extract point clouds step by step. For instance, Hough transform-based methods were widely used for transmission line extraction by detecting linear features in point clouds [13,14,15]. Similarly, density-based clustering methods, such as Density-Based Spatial Clustering of Applications with Noise (DBSCAN), were applied to pylon detection by analyzing the spatial distribution of point clouds [16]. Ortega et al. [17] proposed a seven-stage pipeline for classifying and modeling power structures within point clouds. Their approach involved analyzing features such as intensity, echo, and height values, followed by initial point cloud classification, splitting operations, classification and labeling of wires and pylons, insulator and wire endpoint identification, and catenary modeling, resulting in a complex and cumbersome process. Chen et al. [18] designed various feature histograms to extract insulator string point clouds, enabling the identification of multiple types of insulator strings. However, their method heavily relied on prior knowledge of pylons and transmission lines to ensure accuracy, limiting generalizability. Pan et al. [19] first removed ground points based on the elevation features of transmission line point clouds and then used an improved DBSCAN algorithm based on a K-D tree to extract and segment transmission line point clouds. However, this method was significantly affected by terrain and point cloud acquisition conditions. Mohammad et al. [20] introduced a classifier-free pylon detection technique based on geometric attribute rules of point clouds. Their method involved generating masks, filtering candidates, and final determination steps. Despite this, it lacked error estimation in pylon localization, only providing approximate pylon center positions. It is evident that traditional geometric feature-based methods for point cloud segmentation and extraction, although capable of completing tasks to some extent, often require extensive manual parameter tuning, involve complex workflows, and lack flexibility and adaptability. These methods are highly sensitive to noise and variations in point cloud density, performing poorly in complex scenarios and failing to meet practical application requirements.
To address these limitations, researchers have progressively shifted to traditional machine learning methods for point cloud segmentation and extraction. These methods typically consist of two steps: feature extraction and classification. Initially, researchers manually design features to describe the local or global characteristics of the point cloud, such as point height, curvature, normal vector, and density [21]. These features are then input into classical machine learning models, such as Support Vector Machines (SVM) and Random Forests (RFs), for classification [22,23]. Huang et al. [9] employed a Random Forest classifier with smooth color features to extract pylons interwoven with vegetation. Tang et al. [24] proposed an approach based on improved Random Forest and multi-scale features, segmenting point clouds into ground, vegetation, transmission lines, and pylons through filtering, feature extraction, and selection steps. While these methods improved efficiency and reduced the complexity of procedures, their reliance on manually designed features limited their generalization ability, making them inadequate for complex scenarios. Additionally, these methods failed to effectively utilize spatial structures, restricting their ability to fully exploit the spatial information in point clouds, ultimately limiting segmentation and extraction accuracy.
With the rapid development of deep learning technologies, research on point cloud segmentation has gradually shifted from traditional machine learning methods to deep learning-based approaches. Deep learning methods can automatically learn feature representations of point clouds, avoiding the cumbersome process of manual feature design while capturing complex structures and contextual information within the data. Early deep learning methods, such as PointNet [25] and PointNet++ [26], were the first to process point cloud data directly and effectively capture local geometric features. PointNet extracts global features using multilayer perceptrons (MLP) and max pooling operations, while PointNet++ enhances local feature extraction through hierarchical feature learning. Mariona et al. [27] improved the PointNet architecture to reduce the number of parameters and enhance efficiency. They also employed data augmentation and class-balanced weighted loss strategies to address dataset imbalance, improving detection and segmentation performance for minority classes to some extent. However, their method was validated only on pylon segmentation. Yin et al. [28] utilized transfer learning and an improved PointNet++ model to segment transmission corridor point clouds into transmission lines, pylons, vegetation, and ground. Yet, their method completely misclassified ground wires as transmission lines. Li et al. [29] proposed a segmentation model and target point localization algorithm for pylons based on an improved PointNet++ but conducted experiments on a limited range of pylon types and datasets without addressing other categories in transmission line point clouds. Wang et al. [30] integrated a coordinate attention mechanism into PointNet++ and proposed an end-to-end CA-PointNet++ architecture, enhancing the accuracy and efficiency of semantic segmentation for transmission corridor point clouds. However, their work focused only on four categories: transmission lines, ground wires, pylons, and ground, and did not address smaller electrical components such as insulator strings. Zhou et al. [31] improved the RandLA-Net [32] architecture to increase segmentation accuracy for transmission lines, pylons, vegetation, and buildings within transmission corridors. Nevertheless, their method still had room for improvement in distinguishing object boundaries and fine details. These deep learning-based methods have achieved notable progress in simplifying operations and improving segmentation accuracy. However, the feature extraction capabilities of current deep learning algorithms remain insufficient, leading to limited segmentation categories for transmission corridor point clouds. Research typically focuses on transmission lines, pylons, and ground (including vegetation and buildings), while smaller electrical components like insulator strings are often neglected.
Insulator strings, which are critical components, are particularly challenging to segment due to their small size and minimal representation in point clouds. Limited by the performance of existing deep learning algorithms, these fine structures are rarely included as distinct categories in transmission point cloud segmentation tasks. They are often treated as part of pylons or transmission lines as a compromise. Most methods addressing insulator string point cloud extraction are rule-based or machine learning-based. However, these methods are typically labor-intensive, requiring complex multi-step processes and manual intervention, resulting in low efficiency and poor generalization performance.
In recent years, transformer-based methods for point cloud segmentation have utilized self-attention mechanisms to capture both global and local contextual information, significantly improving the accuracy and flexibility of semantic segmentation [33,34]. For example, Point Transformer v3 (PTv3) [35] incorporates self-attention mechanisms and innovative point cloud serialization techniques, establishing itself as the current state-of-the-art (SOTA) model in point cloud semantic segmentation. PTv3 has achieved top-tier performance across numerous public indoor and outdoor point cloud datasets.
Transmission line corridor scenes are characterized by diverse equipment types, highly variable environmental conditions, structural complexity, significant differences in object scales, background noise, and severe class imbalances. Although PTv3 has demonstrated strong performance in general point cloud segmentation tasks, its direct application to transmission line corridor point clouds has not been explored. Moreover, PTv3 does not specifically address challenges such as class imbalance and multi-scale feature extraction, which are crucial for accurately segmenting small but critical components like insulator strings. To address these limitations, this paper proposes EMAFL-PTv3, an enhanced model built upon PTv3. EMAFL-PTv3 integrates an Efficient Multi-Scale Attention (EMA) [36] module to improve feature extraction across different scales and incorporates Focal Loss [37] to mitigate the effects of class imbalance, leading to significant improvements in segmentation accuracy. Experimental results show that EMAFL-PTv3 outperforms PTv3, particularly in challenging categories such as insulator strings and pylons. The main contributions of this paper are as follows:
  • A novel end-to-end point cloud semantic segmentation model: The EMAFL-PTv3 model integrates the EMA module to enhance PTv3’s network architecture, improving its ability to extract multi-scale features from transmission line corridor point clouds. The incorporation of Focal Loss addresses class imbalance issues effectively.
  • Application and validation: The proposed EMAFL-PTv3 model is applied to a transmission corridor point cloud dataset collected from real-world locations in Hubei and other regions. The model successfully segments the dataset into five categories: insulator strings, pylons, transmission lines, ground wires, and ground, demonstrating its effectiveness and precision. The detailed explanation of these categories can be found in Appendix A.
  • Extensive comparison and ablation studies: Comprehensive comparison experiments are conducted between the proposed EMA module and other mainstream attention mechanisms. Additionally, ablation studies of the two proposed modifications are performed, demonstrating the superiority and effectiveness of the improvements introduced in this paper.

2. Methods

This section first outlines the architecture of the proposed EMAFL-PTv3 model and explains how to integrate the EMA module to enhance PTv3’s ability to extract features at different scales in complex scenes. Then, it describes in detail the structure of the EMA module and the process of introducing Focal Loss to improve the PTv3 loss function.

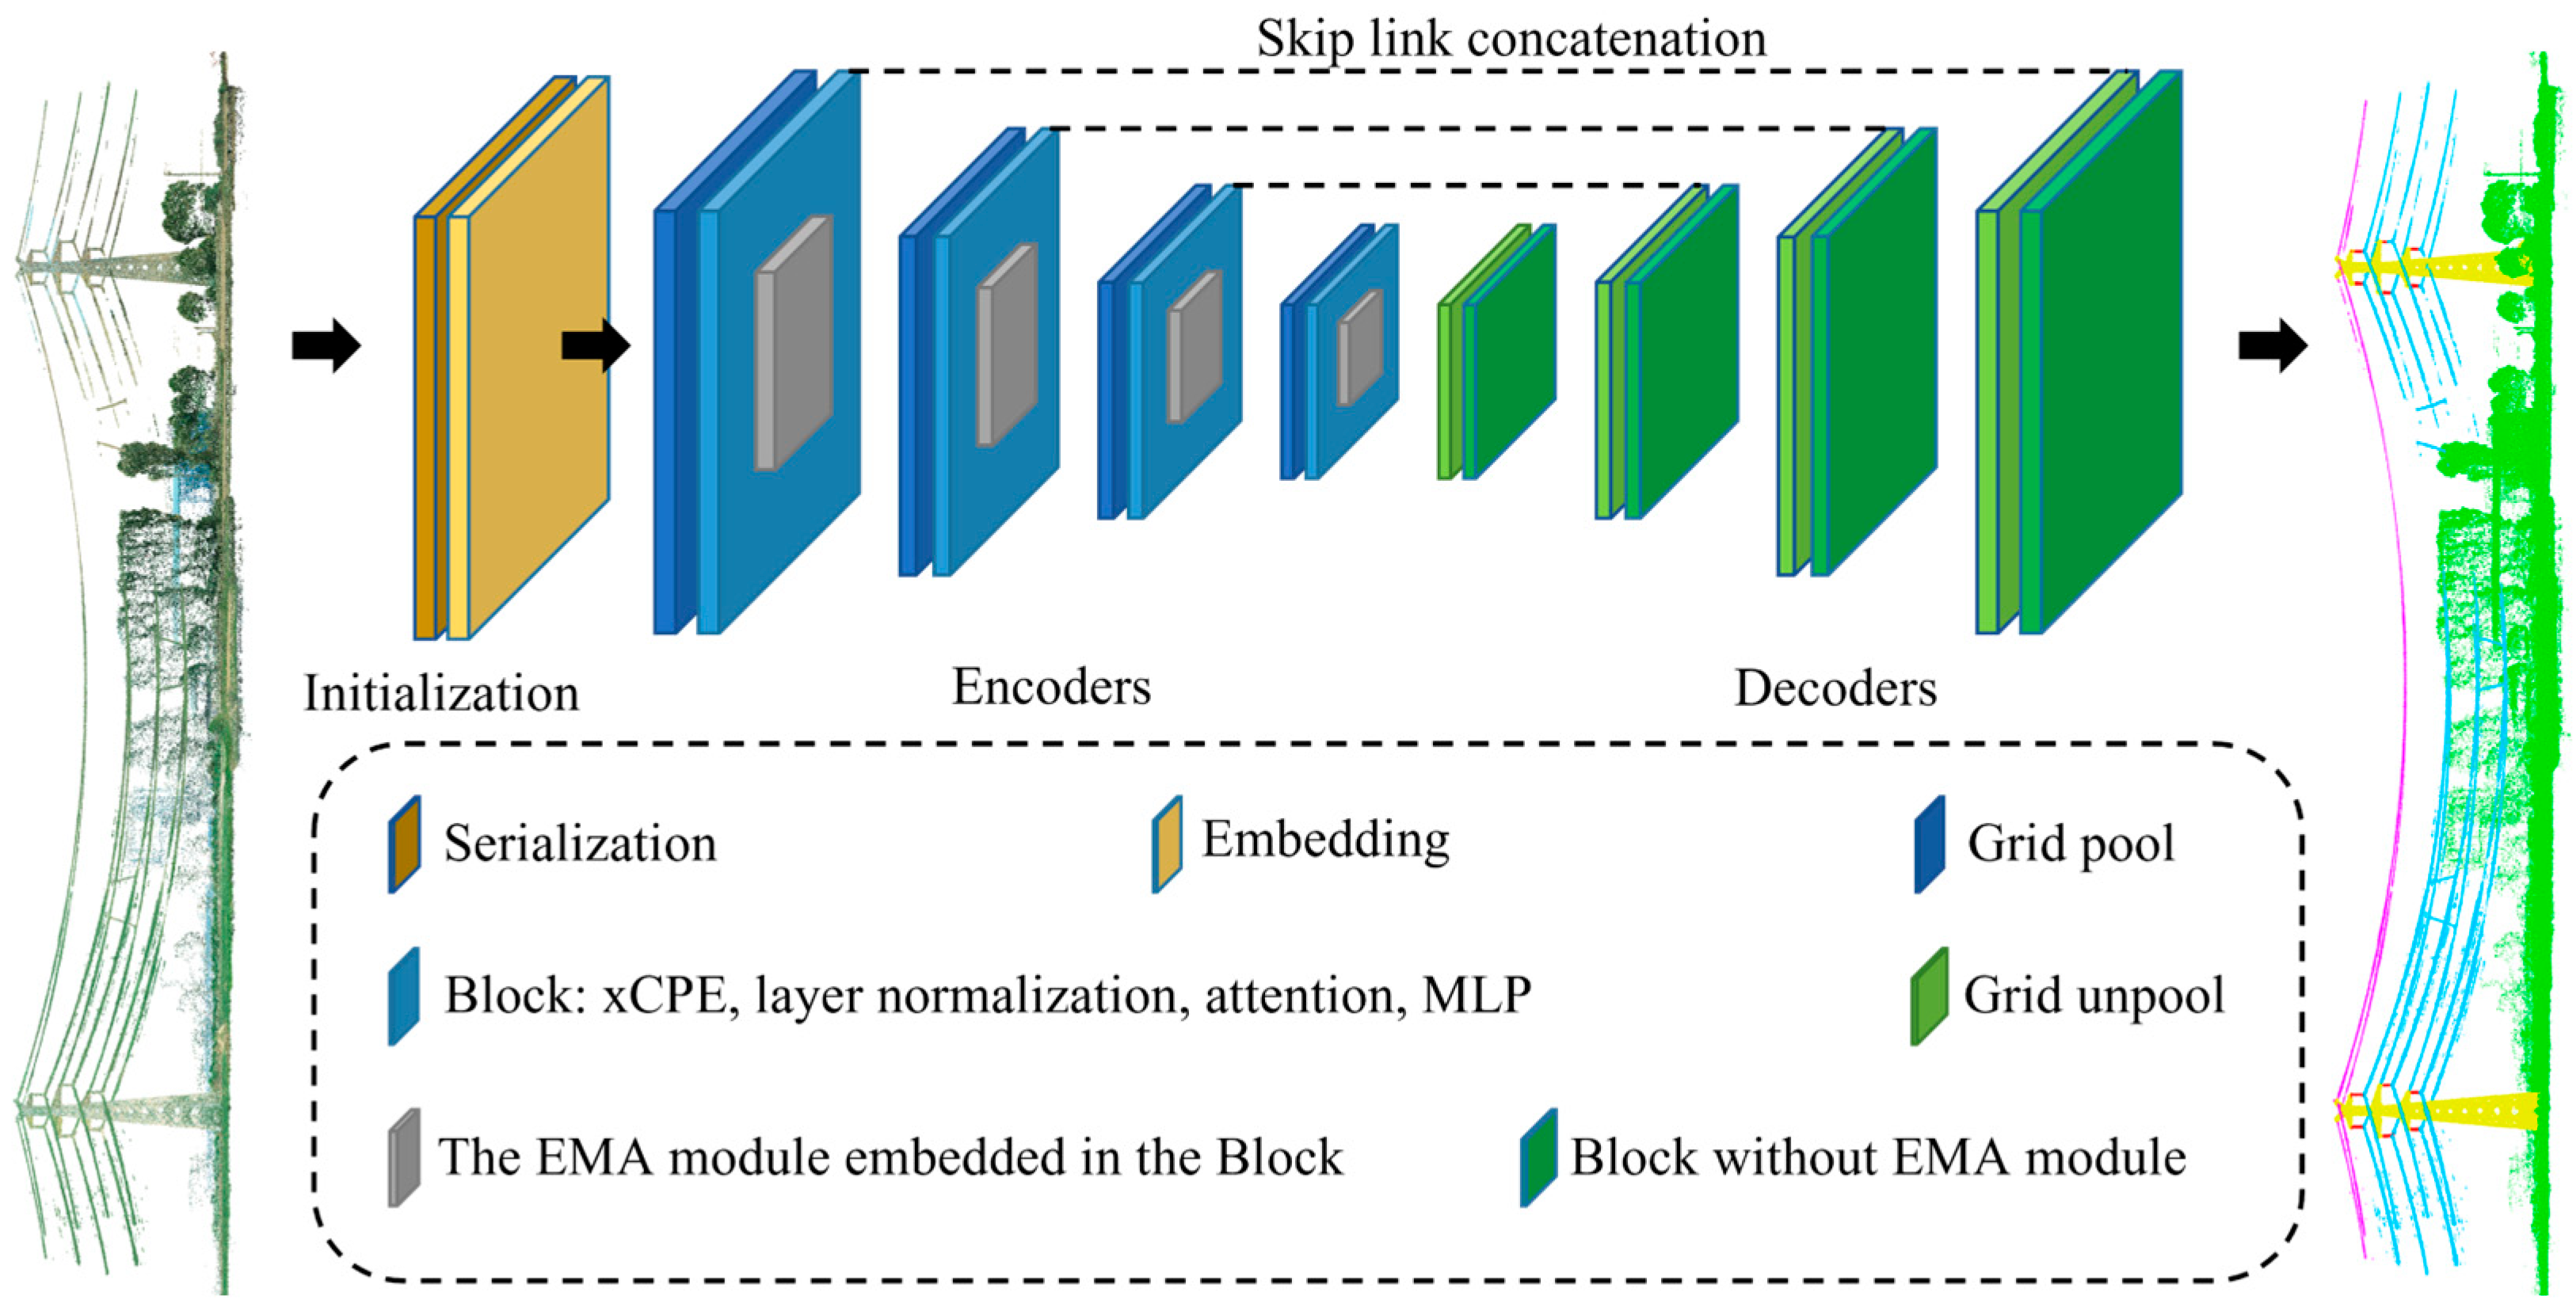
2.1. EMAFL-PTv3 Framework

In the task of semantic segmentation of transmission corridor point clouds, the sizes of different power equipment vary greatly, resulting in a huge gap in the number of point clouds of different categories. It is difficult for traditional semantic segmentation algorithms to control the computational cost while ensuring segmentation accuracy. To address this issue, the EMA module is integrated into PTv3 to improve the overall semantic segmentation performance. The overall structure of EMAFL-PTv3 is based on the U-Net [38] framework, with input point cloud data processed through multiple layers of encoders and decoders. The U-Net framework’s encoder-decoder structure, complemented by skip connections, is well-suited for capturing both fine-grained and global contextual information, which is crucial for accurately segmenting components of varying sizes within transmission line corridors. Each encoding and decoding stage includes convolutional blocks with specific depths and numbers of channels, used to progressively extract features from the point cloud. The EMA module is integrated into the encoding layer, with multi-scale features extracted through parallel 1 × 1 and 3 × 3 convolutions. The 1 × 1 convolution extracts intra-channel interactions, while the 3 × 3 convolution captures spatial information with a larger receptive field. This enables efficient extraction and fusion of multi-scale features.
Figure 1 shows the overall framework of EMAFL-PTv3. The model mainly consists of an initialization part and a cascade of 4 encoding layers and 4 decoding layers. The EMA module is integrated into the encoding layers to enhance the representation of global and local features. The output of the encoder is restored to the original resolution layer by layer in the decoder.
The processing of the original point cloud data by the EMAFL-PTv3 is as follows. Firstly, the original 3D point cloud data is preprocessed, including point cloud serialization and embedding. To preserve the neighborhood features of the points as much as possible, the Hilbert curve [35] is chosen for space-filling curve serialization due to its superior locality-preserving properties. Compared to other space-filling curves, the Hilbert curve effectively maintains the neighborhood relationships of points in the original 3D space, ensuring that spatially close points remain adjacent in the serialized 1D structure. To achieve this, the 3D coordinates of each point p are projected onto a discrete grid with a given grid size g, allowing for a transformation into a serialization code via the inverse mapping φ 1 of the Hilbert curve. Specifically, each point is assigned a 64-bit integer to store its serialization code, where the last k bits represent the position information obtained from φ 1 p / g , while the remaining leading bits encode the batch index b. The final serialization code is given by
E n c o d e ( p , b , g ) = ( b k ) φ 1 ( p / g )
where << denotes the left bit-shift operation and represents the bitwise OR operation. Sorting the points based on this serialization code ensures that spatially close points remain adjacent within each batch, preserving the spatial structure of the original point cloud data. This serialized ordering facilitates efficient processing in the subsequent network pipeline, improving feature extraction and model performance.
After the original point cloud data is serialized by the Hilbert curve, it is further converted into a high-dimensional embedded feature representation through the Embedding layer. The Embedding layer applies nonlinear mapping to the serialized 1D point cloud features, enabling the point cloud to retain not only the spatial information of adjacent points but also richer feature representations. The sparse convolution operation aggregates the information from adjacent points within a local range. Simultaneously, through normalization and activation functions, the Embedding layer strengthens and optimizes the initial features of the point cloud data, providing higher-dimensional inputs with spatial information for the subsequent encoder.
The point cloud features generated by the Embedding layer are subsequently processed by multiple GridPool operations and Block modules to extract and enhance spatial and semantic information. In the first stage of the encoder, the point cloud is first preliminarily divided and aggregated through the GridPool operation. Specifically, GridPool divides the point cloud into fixed-size grid units based on the grid size and aggregates the point features in each grid into a representative feature. The main purpose of this operation is to compress spatial information through aggregation operations, reduce the number of points, and retain local structural information. The features generated by GridPool are equivalent to preliminary downsampling of the local area of the point cloud, providing a more compact feature representation for the subsequent Block module. An EMA module is embedded in each Block module to enhance features at multiple scales. The EMA module extracts features of different scales through parallel 1 × 1 and 3 × 3 convolutions and performs cross-spatial attention calculations on the feature map. The parallel 1 × 1 and 3 × 3 convolutions in the EMA module enable efficient multi-scale feature extraction. The 1 × 1 convolution enhances point-wise feature interactions, while the 3 × 3 convolution captures spatial dependencies, improving the model’s ability to handle irregular point distributions and varying densities in transmission corridor point clouds.
Next, the features extracted by the encoder are passed to the decoder, which progressively restores the spatial resolution of the point cloud and ultimately generates semantic segmentation results. The decoder performs layer-by-layer upsampling through multiple grid unpooling operations, restoring spatial information and incorporating the encoder’s skip connections to enhance feature representation. Each decoding stage fuses multi-scale features via the Block module, enhancing features at the detail level. The features output by the decoder contains rich spatial and semantic information, enabling high-precision semantic segmentation of the point cloud.

2.2. EMA Module

The EMA module is an architecture designed to enhance feature extraction at multiple scales. It is based on a grouping structure and innovatively constructs multi-scale parallel sub-networks, effectively overcoming the limitations of traditional attention mechanisms in processing multi-scale features. In image classification and object detection tasks, EMA has been shown to significantly enhance the model’s ability to capture complex scene features while maintaining low computational resource overhead, though it is rarely applied in point cloud processing. Although PTv3 performs well in many areas, there is still room for improvement in its feature extraction capabilities when dealing with complex point cloud scenes in transmission line corridors. In view of the advantages of EMA in multi-scale feature processing, integrating it into PTv3 for point cloud processing has certain potential. Figure 2 shows the structure of the EMA module.
The EMA module processes point cloud features as follows: given an input feature map X R C   ×   H   ×   W , it is divided along the channel dimension into G sub-feature maps X = X 0 , X 1 , , X G 1 R C G   ×   H   ×   W , where C represents the number of input channels, and H and W represent the spatial dimensions of the input features. Then, attention descriptors are extracted through three parallel paths, two of which are 1 × 1 convolutions, and the others are 3 × 3 convolutions. To capture the dependencies between channels and integrate the features extracted by the two-scale convolutions, EMA performs information interaction along the channel dimension. The 1 × 1 branch encodes spatial information using two 1D global average pooling operations, while the 3 × 3 branch captures multi-scale features by stacking a single convolution kernel. Meanwhile, EMA employs a cross-spatial information aggregation method to combine the outputs of the 1 × 1 and 3 × 3 branches, encodes global spatial information using two-dimensional global pooling, and finally generates a spatial attention map. The two-dimensional global pooling expression is as follows:
z c = 1 H × W j H i W x c i , j
EMA applies the Softmax function to the two-dimensional global pooling output for a nonlinear transformation, generating the first spatial attention map. The second attention map is obtained by performing a matrix dot product calculation. Finally, EMA generates an output of the same size as the input feature map using the Sigmoid function.

2.3. Loss Function Improvement

The number of categories in the transmission line corridor point cloud dataset varies significantly. For example, point clouds of ground categories (including vegetation and buildings) account for a large proportion, while the number of insulator string point clouds is relatively small. Additionally, large blank areas exist within each span. The traditional loss function causes the model to favor categories with a large number of samples, significantly weakening the segmentation performance of a few key categories. The baseline model Ptv3 uses the weighted sum of Cross-Entropy Loss and Lovász Loss [39] to calculate the total loss, with equal weights assigned to both. For multi-category semantic segmentation tasks, the Cross-Entropy Loss is defined as follows:
C E L o s s = 1 n i = 1 n log f i ( y i )
where n is the number of points in each batch, y i is the true category of the point i , and f i ( y i ) is the predicted probability that the point belongs to the true category.
The Lovász Loss is defined as follows:
L o v a s z L o s s = 1 | C | c C Δ J c ¯ ( m ( c ) )
where | C | represents the set of categories, Δ J c ¯ ( m ( c ) ) is the Lovász extension based on the submodular loss function Δ J c , and m ( c ) is the point cloud error vector constructed for the categories, defined as follows:
m i ( c ) = 1 f i ( c ) if   c = y i f i ( c ) otherwise
where f i ( c ) is the category probability obtained by mapping the model output scores to [0, 1] using the Softmax unit.
Considering the highly imbalanced distribution of point clouds across categories in the transmission line corridor, as well as the foreground–background imbalance (with large empty regions containing no point clouds), this paper introduces Focal Loss to construct a new weighted loss function to address these issues. A modulation factor is introduced to reduce the weight loss for easily classified samples and to emphasize the focus on hard-to-classify samples.
F L o s s = α ( 1 f i ( y i ) ) γ log f i ( y i )
where α is the category weighting factor and γ is the focusing parameter.
The final loss is the weighted sum of the three components, with a higher weight assigned to Focal Loss compared to the first two.
L o s s = μ C E L o s s + η L o v a s z L o s s + ω F L o s s
where μ, η, and ω are the weights of the three loss functions, and their sum is 1.

3. Experiments and Results

3.1. Dataset

The dataset in this paper was collected using the DJI M300RTK drone equipped with the Livox L1 module to capture 110 kV and 220 kV power grid point clouds in Wuhan and Xiangyang, Hubei Province. The collected point cloud data includes 3D coordinate information (x, y, z) and color information (r, g, b). Using the open-source point cloud processing software CloudCompare 2.12.4, 40 spans of transmission line corridor point clouds were selected from the large-scale power grid point cloud and manually segmented and labeled into five categories: insulator string, pylon, transmission line, ground wire, and ground to construct the dataset. The dataset was then divided into a training set, validation set, and test set in an 8:1:1 ratio.

3.2. Experimental Environment and Parameter Settings

The experiment was conducted on the Ubuntu 22.04 operating system with Python version 3.8.19 and CUDA version 11.7, using the PyTorch 2.0.0 deep learning framework in a virtual environment for training and testing. The hardware configuration for the experiment included an Intel Core i5-10400F processor (Intel Corporation, Santa Clara, CA, USA), an NVIDIA GeForce RTX 4080 GPU (NVIDIA Corporation, Santa Clara, CA, USA), and 64 GB of memory. The experiment used 200 epochs, a batch size of 2, a grid size of 0.8, an initial learning rate of 0.006, a weight decay of 0.05, and the AdamW optimizer. The hyperparameters α and γ of Focal Loss were set to 0.5 and 2, respectively. The weights of the three loss components in the improved loss function, denoted as μ, η, and ω, were set to 0.25, 0.25, and 0.5, respectively.

3.3. Evaluation Metrics

To accurately evaluate the improvement of the proposed model in transmission corridor point cloud semantic segmentation, Intersection over Union (IoU), Mean Intersection over Union (mIoU), Mean Accuracy (mA), and Overall Accuracy (OA) are introduced as evaluation metrics.
IoU = TP TP + FP + FN
mIoU = 1 5 i = 1 5 IoU i
OA = TP + TN TP + TN + FP + FN
mA = 1 5 i = 1 5 OA i
where TP refers to the number of points correctly predicted as belonging to the target category. TN refers to the number of points correctly predicted as not belonging to the target category. FP refers to the number of points incorrectly predicted as belonging to the target category, while FN refers to the number of points incorrectly predicted as not belonging to the target category and i represents the five categories in the dataset division of this paper.

3.4. Results Analysis

To quantitatively evaluate the segmentation performance and superiority of the proposed model, the test results of EMAFL-PTv3 are compared with those of the baseline model PTv3, the previous models PTv2 and PTv1, as well as the classic point cloud semantic segmentation algorithms PointNet++ and PointNet, as shown in Table 1. PTv3 is a recently proposed state-of-the-art model for point cloud segmentation, making it a strong baseline for evaluating the improvements introduced in EMAFL-PTv3. The inclusion of PTv2 and PTv1 allows for a progressive analysis of model evolution, demonstrating the impact of successive enhancements in the segmentation framework. PointNet++ and PointNet serve as widely recognized benchmarks that many modern approaches build upon, providing a broader perspective on the advancements in point cloud segmentation. This selection ensures a comprehensive and structured comparison, highlighting both the effectiveness of our proposed model and the relative performance of different segmentation methodologies.
Table 1 presents a performance comparison of different models in the semantic segmentation task of transmission line point clouds. EMAFL-PTv3 is the model proposed in this paper, and PTv3 serves as the baseline model. The experiment evaluated the IoU for five categories: ground, ground wires, insulator strings, pylons, and transmission lines, along with overall performance metrics, including mIoU, mA, and OA.
As shown in the results, EMAFL-PTv3 achieved the best performance in all categories and overall indicators. Compared with the baseline model PTv3, the mIoU of EMAFL-PTv3 increased from 84.97% to 90.46%, mA increased from 90.11% to 92.86%, and OA increased from 95.63% to 98.07%. Especially in the insulator string and pylon categories, the IoU of EMAFL-PTv3 reached 67.25% and 91.77%, respectively, which was significantly better than PTv3’s 60.19% and 80.38%. In addition, EMAFL-PTv3 also demonstrated high segmentation accuracy in other categories, such as ground 97.34%, ground wires 97%, and transmission lines 98.97%. It shows that the EMA module added in this article can better extract point cloud features of different sizes through multi-scale convolution, and the Focal Loss added can also improve the negative impact caused by serious unevenness of power transmission point cloud categories. In contrast, PTv3 as a baseline model still shows strong competitiveness overall, and its mIoU and IoU of each category are better than PTv2 and PTv1. However, PTv2 and PTv1 performed poorly in the insulator string category, with IoUs of 20.38% and 16.19%, respectively, indicating that the early models had limited capabilities in segmenting complex small objects. The performance of traditional models PointNet and PointNet++ lag significantly behind, with mIoU only 48.11% and 36.42%, respectively. Moreover, it is almost impossible to segment insulator strings and pylons, making it difficult to handle semantic segmentation tasks of large-scale, uneven outdoor point clouds such as power transmission point clouds.
Meanwhile, to visually demonstrate the segmentation performance of the proposed model, we visualize the semantic segmentation results of one span from the test set. The model’s segmentation outputs are rendered in different colors, as shown in Figure 3. To enhance clarity, we have integrated the overall segmentation results with an enlarged comparison of key regions, including the pylon, insulator string, and transmission line intersections. In this visualization, green represents the ground, magenta indicates the ground wire, red corresponds to the insulator string, yellow denotes the pylon, and blue represents the transmission line. Additionally, we have highlighted typical segmentation errors using red circles, pinpointing challenging regions where models struggle the most.
Figure 3 compares the segmentation results of different models in the semantic segmentation task of power transmission line corridor point clouds. It includes the original point cloud, ground truth, and the segmentation outputs of five models: EMAFL-PTv3 (ours), baseline model PTv3, PTv2, PTv1, PointNet++, and PointNet. The enlarged views on the right provide detailed comparisons of the two most critical models, EMAFL-PTv3 and PTv3, against the ground truth in the intertwined regions of insulator strings, pylons, and transmission lines. These areas pose the greatest challenges for segmentation, with typical segmentation errors highlighted in red circles. As shown in Figure 3, EMAFL-PTv3 (Figure 3c) exhibits the most accurate segmentation results, closely matching the ground truth (Figure 3b). This aligns with Table 1, where EMAFL-PTv3 achieves the highest mIoU of 90.46% and OA of 98.07%, significantly outperforming the baseline model PTv3 (mIoU = 84.97%, OA = 95.63%). However, segmentation errors still exist in the connection areas between the insulator strings and transmission lines, as well as at the attachment points between the insulator strings and the crossarm. As highlighted by the red circles in Figure 3j, a considerable portion of points in the lower half of the insulator string is mistakenly classified as the adjacent transmission line, and some points in the crossarm are misclassified as part of the insulator string. Even in the best-performing model, these challenging regions contribute to the relatively lower IoU of 67.25% for the insulator string category. The baseline model PTv3 (Figure 3d) also demonstrates good segmentation performance, particularly in larger structures such as pylons (IoU = 80.38%) and transmission lines (IoU = 98.39%). However, it struggles to distinguish the lower part of the pylon from the ground, leading to misclassification in vegetation-dense areas. This issue is evident in the magnified view, as highlighted by the red circles in Figure 3k, where PTv3 incorrectly labels a significant portion of the pylon as the ground, affecting the structural integrity recognition. Additionally, its misclassification of insulator strings and ground wires is more pronounced. The performance of PTv2 and PTv1 (Figure 3e,f) further decreases, with the insulator string IoU of PTv2 being only 20.38% and PTv1 performing even worse, with 16.19%. Without the need for zoomed-in views, the segmentation errors of the pylon boundaries, insulator strings, and transmission lines become more apparent. PointNet++ and PointNet (Figure 3g,h) exhibit the poorest segmentation performance, struggling to effectively segment large-scale, non-uniform outdoor point clouds like those of transmission line corridors. In summary, the EMAFL-PTv3 model proposed in this paper performs excellently in the semantic segmentation task for transmission line corridor point clouds, accurately segmenting key categories, particularly for complex structures and small targets (e.g., insulator strings and pylons). Its segmentation performance is significantly superior to that of other models.
To further quantify the segmentation performance of EMAFL-PTv3 and the characteristics of segmentation errors observed in Figure 3, we calculated the true and predicted point counts for each category in Span I and constructed a confusion matrix, as shown in Table 2.
Table 2 presents the segmentation results of EMAFL-PTv3 on the Span I, where each cell represents the number of points in a given ground truth category (*) that were predicted as a different category (#). Overall, the model demonstrates high classification accuracy across most categories, with the OA exceeding 89% for all categories. Notably, the classification accuracy for the ground wire, pylon, and transmission lines exceeds 98%. However, some degree of misclassification is still observed between different categories, particularly between the ground and pylon. Additionally, the significant disparity in the number of points across different categories reflects the highly imbalanced nature of point cloud distributions in power transmission corridor datasets.
Specifically, the ground category contains the largest number of points, with 1,127,555 points correctly classified. However, 48,126 points were misclassified as pylons, leading to an OA of 95.90%. This misclassification may result from the spatial proximity of ground points to the base of pylons, making the transition regions between them difficult to distinguish. In contrast, the ground-wire category exhibits relatively high classification performance, with 59,239 correctly classified points and only 881 points misclassified as pylons, achieving an OA of 98.53%. The misclassification in this category primarily occurs at pylon tips where ground wires are attached, as these regions are more challenging to segment.
The insulator string category, however, exhibits lower classification performance, with an OA of 89.13%, making it one of the most misclassified categories. According to the confusion matrix, 538 insulator string points were misclassified as pylons, 145 as ground wires, and 1681 transmission line points were misclassified as insulator strings. This suggests a high degree of feature similarity between insulator strings, pylons, and transmission lines, potentially due to their similar local geometric features. Additionally, since insulator strings serve as connectors between pylons and transmission lines, their structural characteristics may contribute to the model’s difficulty in distinguishing them accurately. Moreover, insulator strings generally have small structures and lower point cloud density, which poses additional challenges for accurate recognition.
The pylon category demonstrates stable classification performance, with 288,061 points correctly classified and only 979 points misclassified as insulator strings, achieving an OA of 99.48%. Similarly, the transmission line category exhibits high classification accuracy, with an OA of 99.42% and only 1681 points misclassified as insulator strings, indicating that the model effectively recognizes this category.
Overall, EMAFL-PTv3 demonstrates strong performance in transmission line corridor point cloud segmentation, accurately distinguishing most key categories, particularly ground, ground-wire, pylons, and transmission lines. However, due to its structural characteristics, the insulator-string category remains challenging, with a high degree of misclassification, primarily with pylons and transmission lines.

4. Discussion

This section primarily discusses the performance evaluation of models incorporating different attention modules, the ablation experiments of the improved modules in the proposed EMAFL-PTv3 model, and the influence of the channel grouping number G, a key parameter in the EMA module, on model performance. Additionally, we discuss the model’s limitations and potential directions for future work.

4.1. Performance of Models Integrating Different Attention Mechanisms

To demonstrate the superiority of the proposed EMA module, comparative experiments were conducted by substituting different attention mechanisms into the PTv3 model improved with Focal Loss (PTv3 + Focal Loss). These mechanisms include Squeeze-and-Excitation (SE) Networks [40], Convolutional Block Attention Module (CBAM) [41], Efficient Channel Attention (ECA) module [42], and Coordinate Attention (CA) [43], as shown in Table 3.
Table 3 presents the performance comparison of models by incorporating different attention mechanisms into the PTv3 + Focal Loss framework. The results demonstrate the clear superiority of the EMA module, especially for small object categories like insulator strings, where it achieves an IoU of 67.25%, significantly outperforming other attention mechanisms such as SE (61.73%) and ECA (56.84%). This remarkable performance can be attributed to the EMA module’s efficient multi-scale feature capture and cross-dimension interaction strategy, which effectively mitigates feature degradation issues observed in other mechanisms. For instance, while SE focuses on global channel weighting, its channel compression operation may dilute the feature representation of small object categories like insulators, overshadowed by dominant categories such as ground or wires. Similarly, CBAM combines channel and spatial attention but tends to prioritize large objects, leading to insufficient focus on local features crucial for small objects. ECA, with its localized channel interaction, struggles to capture the complex contextual information necessary for insulators, resulting in lower performance. Beyond insulators, the EMA module also achieves the highest IoU for ground (97.34%), pylons (91.77%), and transmission lines (98.97%), reflecting its robust overall performance. In terms of comprehensive metrics, EMA + PTv3 + Focal Loss surpasses other mechanisms with mIoU (90.46%), mA (92.86%), and OA (98.07%), solidly proving the effectiveness of EMA in enhancing the semantic segmentation of transmission corridor point clouds.

4.2. Ablation Study on the Contribution of Two Proposed Improvements to Model Performance

To evaluate the specific contribution of the two improvements to the model’s performance, ablation studies were conducted, and the results are shown in Table 4.
Table 4 shows the results of the ablation studies based on the PTv3 model to evaluate the specific contribution of the introduced EMA module and Focal Loss to the model’s performance. As seen in the table, the model with the EMA module shows varying degrees of improvement in the IoU for each category compared to the baseline PTv3 model, indicating that the multi-scale convolution of the EMA module can effectively capture feature representations of targets at different scales. After introducing Focal Loss, the IoU for the less frequent categories, such as insulator string and Pylon, shows significant improvement, while the IoU for larger categories, such as ground, slightly decreases. However, the overall performance improves, demonstrating the significant role of Focal Loss in alleviating the class imbalance problem. When EMA and Focal Loss are combined, the model outperforms the baseline PTv3 in terms of IoU for all categories and overall evaluation metrics, validating the effectiveness of the proposed method.

4.3. Impact of Different Channel Grouping Numbers in the EMA Module on Model Performance

Additionally, an important parameter of the EMA module is the number of channel groups, G. The authors conducted ablation studies with no grouping, G = 16, and G = 32 in the original paper [36]. To investigate the impact of different values of G on the performance of the EMAFL-PTv3 model in this study, we conducted ablation studies with various values of G. Considering the relatively small size of the dataset, we selected G = 1(no grouping), G = 2, G = 4, G = 8, G = 16, and G = 32 for the experiments. The results are shown in Table 5.
As shown in Table 5, for most metrics, the model performs best or close to the best when the number of groups G = 1. As the number of groups G increases, most metrics show a decreasing or fluctuating trend. This suggests that, for this task, not using grouping (G = 1) may be the most beneficial choice for model performance. The reason could be that the dataset used in this study is relatively small, and the characteristics of the transmission line corridor scenario result in an imbalanced number of point clouds across different categories in the dataset. Grouping may have a greater impact on feature learning for minority categories. For example, the performance of the insulator string fluctuates significantly under different values of G, which could be because the insulator string data occupies a smaller proportion of the dataset, and grouping further weakens the model’s ability to learn its features. Additionally, the transmission line corridor scenario is a dataset with a relatively regular point cloud structure, and features in the data may have strong global dependencies. Grouping operations may disrupt these global feature relationships, making it harder for the model to learn effective feature representations. When G = 1, the model is better able to capture these global features, which helps improve performance.

4.4. Limitations and Potential Directions for Future Work

Although the proposed EMAFL-PTv3 model demonstrates significant performance improvements in segmenting transmission line corridor point clouds, there are several limitations and areas for future exploration: (1) The dataset used in this study primarily contains 110 kV and 220 kV suspension pylons, which limits the model’s generalizability to other voltage levels and pylon types. Expanding the dataset to include tension pylons, corner pylons, terminal pylons, and a broader range of insulator string types would help improve the model’s ability to handle diverse structures. Future research should focus on diversifying the dataset to evaluate the model’s adaptability to different types of transmission line corridors. (2) While this study offers valuable insights into the model’s performance under controlled conditions, it is crucial to validate the model in real-world scenarios, including varying flight altitudes, LiDAR scan resolutions, and different environmental conditions. These factors can influence data quality and, consequently, model performance. Future work could assess the robustness and generalization of the model by testing it in more complex, real-world environments to better understand its practical applications and limitations.

5. Conclusions

This paper proposes a new point cloud semantic segmentation model, EMAFL-PTv3, specifically designed for the direct and fine segmentation of large-scale transmission line corridor point clouds. It is an end-to-end deep learning model that directly generates segmentation results for five categories: ground, ground wire, insulator string, pylon, and transmission line, from the raw point cloud data. Compared to other methods with similar segmentation granularity, the proposed model does not require complicated steps or manual intervention, offering higher accuracy and robustness. Given the significant size differences among the point clouds of various transmission line corridor structures, this paper integrates the EMA module to enhance the model’s ability to extract features at different scales. Additionally, considering the severe class imbalance in the transmission line corridor point cloud dataset, Focal Loss is introduced to improve segmentation accuracy for minority categories. Experimental results show that EMAFL-PTv3 achieves the best performance across all category-specific and overall metrics. Specifically, compared to the baseline model PTv3, EMAFL-PTv3’s IoU improves by 3.35%, 5.09%, 7.06%, 11.3%, and 0.58% for ground, ground wire, insulator string, pylon, and transmission line, respectively. Meanwhile, mIoU, mA, and OA improved by 5.49%, 2.75%, and 2.44%, respectively. Future research could focus on expanding the dataset to include more diverse voltage levels and pylon types, as well as validating the model’s performance under varying real-world conditions to enhance its generalization and robustness.

Author Contributions

Conceptualization, L.L. and L.W.; methodology, L.L.; validation, L.L.; resources, L.W. and B.S.; data curation, L.L., S.W., Y.A. and S.Z.; writing—original draft preparation, L.L.; writing—review and editing, L.L. and S.W.; visualization, L.L. All authors have read and agreed to the published version of the manuscript.

Funding

This research received no external funding.

Data Availability Statement

The data presented in this study are available on request from the corresponding author. The data are not publicly available due to privacy restrictions.

Conflicts of Interest

The authors declare no conflicts of interest.

Abbreviations

The following abbreviations are used in this manuscript:
PTv3Point Transformer v3
EMAEfficient Multi-Scale Attention
IoUIntersection over Union
mIoUMean Intersection over Union
mAMean Accuracy
OAOverall Accuracy
LiDARLight Detection and Ranging
DBSCANDensity-Based Spatial Clustering of Applications with Noise
SVMSupport Vector Machine
RFRandom Forest
MLPMultilayer Perceptron
SESqueeze-and-Excitation Networks
CBAMConvolutional Block Attention Module
ECAEfficient Channel Attention
CACoordinate Attention

Appendix A

This glossary provides brief explanations of key technical terms used in this paper.
Table A1. Glossary of key technical terms.
Technical TermsDefinition
Focal Loss [37]A modified version of cross-entropy loss that reduces the impact of well-classified samples and focuses more on difficult-to-classify samples, improving performance on imbalanced datasets.
Hilbert Curve Serialization [35]A space-filling curve that preserves spatial locality when mapping 3D points into a 1D sequence, ensuring that nearby points remain close in the serialized structure.
IoU (Intersection over Union)A metric used to evaluate segmentation accuracy by measuring the overlap between predicted and ground truth regions.
mIoU (Mean Intersection
over Union)
A metric used in segmentation tasks to measure the average overlap between predicted and ground truth regions across all categories. It provides a comprehensive assessment of model performance.
mA (Mean Accuracy)The average per-class accuracy in a segmentation task calculated as the mean of the individual class accuracies. It evaluates how well the model classifies each category.
OA (Overall Accuracy)The overall percentage of correctly classified points in the dataset, providing a general measure of segmentation performance.
Ground TruthThe manually labeled or verified data used as a reference for evaluating model predictions. In point cloud segmentation, it refers to the correct classification of each point.
Transmission Line CorridorThe designated space surrounding high-voltage power transmission lines, including pylons, conductors, ground wires, as well as the ground and surrounding objects beneath the transmission lines. Maintaining this corridor is essential for safety, operational efficiency, and vegetation management.
GroundOne of the segmentation categories in this study. Refers to the terrain or surface within the transmission line corridor. In this study, ground, vegetation, and buildings within the corridor are all classified under the “Ground” category. This classification simplifies the segmentation process while maintaining scene understanding.
Ground WireOne of the segmentation categories in this study. A wire used in power transmission lines, typically positioned above conductors to protect against lightning strikes.
Insulator StringOne of the segmentation categories in this study. A series of insulating components that suspend transmission lines from pylons while preventing electrical current from flowing through the supporting structures.
PylonOne of the segmentation categories in this study. A tall tower-like structure that supports high-voltage power transmission lines, ensuring safe electrical clearance and mechanical stability.
Transmission LineOne of the segmentation categories in this study. The high-voltage conductors used to transport electricity over long distances within the transmission line corridor.

References

  1. He, T.; Zeng, Y.; Hu, Z. Research of Multi-Rotor UAVs Detailed Autonomous Inspection Technology of Transmission Lines Based on Route Planning. IEEE Access 2019, 7, 114955–114965. [Google Scholar] [CrossRef]
  2. Singh, G.; Stefenon, S.F.; Yow, K.-C. Interpretable Visual Transmission Lines Inspections Using Pseudo-Prototypical Part Network. Mach. Vis. Appl. 2023, 34, 41. [Google Scholar] [CrossRef]
  3. Xu, C.; Li, Q.; Zhou, Q.; Zhang, S.; Yu, D.; Ma, Y. Power Line-Guided Automatic Electric Transmission Line Inspection System. IEEE Trans. Instrum. Meas. 2022, 71, 3512118. [Google Scholar] [CrossRef]
  4. Li, X.; Li, Z.; Wang, H.; Li, W. Unmanned Aerial Vehicle for Transmission Line Inspection: Status, Standardization, and Perspectives. Front. Energy Res. 2021, 9, 713634. [Google Scholar] [CrossRef]
  5. Luo, Y.; Yu, X.; Yang, D.; Zhou, B. A Survey of Intelligent Transmission Line Inspection Based on Unmanned Aerial Vehicle. Artif. Intell. Rev. 2023, 56, 173–201. [Google Scholar] [CrossRef]
  6. Qin, X.; Wu, G.; Lei, J.; Fan, F.; Ye, X.; Mei, Q. A Novel Method of Autonomous Inspection for Transmission Line Based on Cable Inspection Robot LiDAR Data. Sensors 2018, 18, 596. [Google Scholar] [CrossRef]
  7. Tang, J.; Tan, J.; Du, Y.; Zhao, H.; Li, S.; Yang, R.; Zhang, T.; Li, Q. Quantifying Multi-Scale Performance of Geometric Features for Efficient Extraction of Insulators from Point Clouds. Remote Sens. 2023, 15, 3339. [Google Scholar] [CrossRef]
  8. Zengin, A.T.; Erdemir, G.; Akinci, T.C.; Seker, S. Measurement of Power Line Sagging Using Sensor Data of a Power Line Inspection Robot. IEEE Access 2020, 8, 99198–99204. [Google Scholar] [CrossRef]
  9. Huang, J.; Shen, Y.; Wang, J.; Ferreira, V. Automatic Pylon Extraction Using Color-Aided Classification from UAV LiDAR Point Cloud Data. IEEE Trans. Instrum. Meas. 2023, 72, 2520611. [Google Scholar] [CrossRef]
  10. Zu, S.; Wang, L.; Wu, S.; Wang, G.; Song, B. Power Pylon Type Identification and Characteristic Parameter Calculation from Airborne LiDAR Data. Electronics 2024, 13, 3032. [Google Scholar] [CrossRef]
  11. Huang, Y.; Du, Y.; Shi, W. Fast and Accurate Power Line Corridor Survey Using Spatial Line Clustering of Point Cloud. Remote Sens. 2021, 13, 1571. [Google Scholar] [CrossRef]
  12. Xie, Y.; Tian, J.; Zhu, X.X. Linking Points with Labels in 3D: A Review of Point Cloud Semantic Segmentation. IEEE Geosci. Remote Sens. Mag. 2020, 8, 38–59. [Google Scholar] [CrossRef]
  13. McLaughlin, R.A. Extracting Transmission Lines from Airborne LIDAR Data. IEEE Geosci. Remote Sens. Lett. 2006, 3, 222–226. [Google Scholar] [CrossRef]
  14. Liu, Y.; Li, Z.; Hayward, R.; Walker, R.; Jin, H. Classification of Airborne LIDAR Intensity Data Using Statistical Analysis and Hough Transform with Application to Power Line Corridors. In Proceedings of the 2009 Digital Image Computing: Techniques and Applications (DICTA 2009), Melbourne, Australia, 1–3 December 2009; Shi, H., Zhang, Y.C., Bottema, M.J., Lovell, B.C., Maeder, A.J., Eds.; IEEE: New York, NY, USA, 2009; p. 462. [Google Scholar]
  15. Yermo, M.; Laso, R.; Lorenzo, O.G.; Pena, T.F.; Cabaleiro, J.C.; Rivera, F.F.; Vilariño, D.L. Powerline Detection and Characterization in General-Purpose Airborne LiDAR Surveys. IEEE J. Sel. Top. Appl. Earth Obs. Remote Sens. 2024, 17, 10137–10157. [Google Scholar] [CrossRef]
  16. Shan, L.; Yue, J. Automatic Extraction Algorithm of High Voltage Pylon Based on LiDAR Point Cloud. Laser Optoelectron. Prog. 2021, 58, 2428009. [Google Scholar] [CrossRef]
  17. Ortega, S.; Trujillo, A.; Santana, J.M.; Suárez, J.P.; Santana, J. Characterization and Modeling of Power Line Corridor Elements from LiDAR Point Clouds. ISPRS J. Photogramm. Remote Sens. 2019, 152, 24–33. [Google Scholar] [CrossRef]
  18. Chen, M.; Li, J.; Pan, J.; Ji, C.; Ma, W. Insulator Extraction from UAV LiDAR Point Cloud Based on Multi-Type and Multi-Scale Feature Histogram. Drones 2024, 8, 241. [Google Scholar] [CrossRef]
  19. Pan, Y.-R.; Xia, Y.-H.; Long, L.-J.; Yang, M. Power-Line Extraction and Modelling from 3D Point Clouds Data Based on K-D Tree DBSCAN Algorithm. J. Electr. Eng. Technol. 2024, 19, 3587–3597. [Google Scholar] [CrossRef]
  20. Awrangjeb, M.; Islam, M.K. Classifier-Free Detection of Power Line Pylons from Point Cloud Data. ISPRS Ann. Photogramm. Remote Sens. Spat. Inf. Sci. 2017, 4, 81–87. [Google Scholar] [CrossRef]
  21. Weinmann, M.; Jutzi, B.; Hinz, S.; Mallet, C. Semantic Point Cloud Interpretation Based on Optimal Neighborhoods, Relevant Features and Efficient Classifiers. ISPRS J. Photogramm. Remote Sens. 2015, 105, 286–304. [Google Scholar] [CrossRef]
  22. Niemeyer, J.; Rottensteiner, F.; Soergel, U. Contextual Classification of Lidar Data and Building Object Detection in Urban Areas. ISPRS J. Photogramm. Remote Sens. 2014, 87, 152–165. [Google Scholar] [CrossRef]
  23. Zhang, J.; Lin, X.; Ning, X. SVM-Based Classification of Segmented Airborne LiDAR Point Clouds in Urban Areas. Remote Sens. 2013, 5, 3749–3775. [Google Scholar] [CrossRef]
  24. Tang, Q.; Zhang, L.; Lan, G.; Shi, X.; Duanmu, X.; Chen, K. A Classification Method of Point Clouds of Transmission Line Corridor Based on Improved Random Forest and Multi-Scale Features. Sensors 2023, 23, 1320. [Google Scholar] [CrossRef]
  25. Charles, R.Q.; Su, H.; Kaichun, M.; Guibas, L.J. PointNet: Deep Learning on Point Sets for 3D Classification and Segmentation. In Proceedings of the 2017 IEEE Conference on Computer Vision and Pattern Recognition (CVPR), Honolulu, HI, USA, 21–26 July 2017; pp. 77–85. [Google Scholar]
  26. Qi, C.R.; Yi, L.; Su, H.; Guibas, L.J. PointNet++: Deep Hierarchical Feature Learning on Point Sets in a Metric Space. In Proceedings of the 31st International Conference on Neural Information Processing Systems, Long Beach, California, USA, 4–9 December 2017; Curran Associates Inc.: Red Hook, NY, USA, 2017; pp. 5105–5114. [Google Scholar]
  27. Caros, M.; Just, A.; Segui, S.; Vitria, J. Object Segmentation of Cluttered Airborne LiDAR Point Clouds. In Artificial Intelligence Research and Development; Cortes, A., Grimaldo, F., Flaminio, T., Eds.; Ios Press: Amsterdam, The Netherlands, 2022; Volume 356, pp. 259–268. [Google Scholar]
  28. Yin, Z.; Ji, S.; Zhang, X.; Dai, J.; Yu, W.; Wu, S. Classification Model of Point Cloud Along Transmission Line Based on Group Normalization. Front. Energy Res. 2022, 10, 839273. [Google Scholar] [CrossRef]
  29. Li, X.; Li, Y.; Chen, Y.; Zhang, G.; Liu, Z. Deep Learning-Based Target Point Localization for UAV Inspection of Point Cloud Transmission Towers. Remote Sens. 2024, 16, 817. [Google Scholar] [CrossRef]
  30. Wang, G.; Wang, L.; Wu, S.; Zu, S.; Song, B. Semantic Segmentation of Transmission Corridor 3D Point Clouds Based on CA-PointNet++. Electronics 2023, 12, 2829. [Google Scholar] [CrossRef]
  31. Zhou, Y.; Feng, Z.; Chen, C.; Yu, F. Bilinear Distance Feature Network for Semantic Segmentation in PowerLine Corridor Point Clouds. Sensors 2024, 24, 5021. [Google Scholar] [CrossRef]
  32. Hu, Q.; Yang, B.; Xie, L.; Rosa, S.; Guo, Y.; Wang, Z.; Trigoni, N.; Markham, A. RandLA-Net: Efficient Semantic Segmentation of Large-Scale Point Clouds. In Proceedings of the 2020 IEEE/CVF Conference on Computer Vision and Pattern Recognition (CVPR), Seattle, WA, USA, 14–19 June 2020; pp. 11105–11114. [Google Scholar]
  33. Zhao, H.; Jiang, L.; Jia, J.; Torr, P.; Koltun, V. Point Transformer. In Proceedings of the 2021 IEEE/CVF International Conference on Computer Vision (ICCV), Montreal, BC, Canada, 11–17 October 2021; pp. 16239–16248. [Google Scholar]
  34. Wu, X.; Lao, Y.; Jiang, L.; Liu, X.; Zhao, H. Point Transformer V2: Grouped Vector Attention and Partition-Based Pooling. In Proceedings of the 36th International Conference on Neural Information Processing Systems, New Orleans, LA, USA, 28 November–9 December 2022; Curran Associates Inc.: Red Hook, NY, USA, 2024; pp. 33330–33342. [Google Scholar]
  35. Wu, X.; Jiang, L.; Wang, P.-S.; Liu, Z.; Liu, X.; Qiao, Y.; Ouyang, W.; He, T.; Zhao, H. Point Transformer V3: Simpler, Faster, Stronger. In Proceedings of the 2024 IEEE/CVF Conference on Computer Vision and Pattern Recognition (CVPR), Nashville, TN, USA, 11–15 June 2024; pp. 4840–4851. [Google Scholar]
  36. Ouyang, D.; He, S.; Zhang, G.; Luo, M.; Guo, H.; Zhan, J.; Huang, Z. Efficient Multi-Scale Attention Module with Cross-Spatial Learning. In Proceedings of the ICASSP 2023—2023 IEEE International Conference on Acoustics, Speech and Signal Processing (ICASSP), Rhodes Island, Greece, 4–10 June 2023; pp. 1–5. [Google Scholar]
  37. Lin, T.-Y.; Goyal, P.; Girshick, R.; He, K.; Dollár, P. Focal Loss for Dense Object Detection. In Proceedings of the 2017 IEEE International Conference on Computer Vision (ICCV), Venice, Italy, 22–29 October 2017; pp. 2999–3007. [Google Scholar]
  38. Ronneberger, O.; Fischer, P.; Brox, T. U-Net: Convolutional Networks for Biomedical Image Segmentation. In Proceedings of the Medical Image Computing and Computer-Assisted Intervention—MICCAI 2015, Munich, Germany, 5–9 October 2025; Navab, N., Hornegger, J., Wells, W.M., Frangi, A.F., Eds.; Springer: Cham, Switzerland, 2015; pp. 234–241. [Google Scholar]
  39. Berman, M.; Triki, A.R.; Blaschko, M.B. The Lovasz-Softmax Loss: A Tractable Surrogate for the Optimization of the Intersection-Over-Union Measure in Neural Networks. In Proceedings of the 2018 IEEE/CVF Conference on Computer Vision and Pattern Recognition, Salt Lake City, UT, USA, 18–22 June 2018; IEEE: Piscataway, NJ, USA, 2018; pp. 4413–4421. [Google Scholar]
  40. Hu, J.; Shen, L.; Sun, G. Squeeze-and-Excitation Networks. In Proceedings of the 2018 IEEE/CVF Conference on Computer Vision and Pattern Recognition, Salt Lake City, UT, USA, 18–22 June 2018; IEEE: Piscataway, NJ, USA, 2018; pp. 7132–7141. [Google Scholar]
  41. Woo, S.; Park, J.; Lee, J.-Y.; Kweon, I.S. CBAM: Convolutional Block Attention Module. In Proceedings of the Computer Vision–ECCV 2018, Munich, Germany, 8–14 September 2018; Springer: Cham, Switzerland, 2018; pp. 3–19. [Google Scholar]
  42. Wang, Q.; Wu, B.; Zhu, P.; Li, P.; Zuo, W.; Hu, Q. ECA-Net: Efficient Channel Attention for Deep Convolutional Neural Networks. In Proceedings of the 2020 IEEE/CVF Conference on Computer Vision and Pattern Recognition (CVPR), Seattle, WA, USA, 13–19 June 2020; pp. 11531–11539. [Google Scholar]
  43. Hou, Q.; Zhou, D.; Feng, J. Coordinate Attention for Efficient Mobile Network Design. In Proceedings of the 2021 IEEE/CVF Conference on Computer Vision and Pattern Recognition (CVPR), Nashville, TN, USA, 20–25 June 2021; pp. 13708–13717. [Google Scholar]
Figure 1. The overall framework of EMAFL-PTv3.
Electronics 14 00650 g001
Figure 2. The structure of the EMA module.
Electronics 14 00650 g002
Figure 3. Comparison of point cloud segmentation results of Span I from different models. Subfigures (ah) represent the original point cloud data of a span, ground truth, and segmentation results of EMAFL-PTv3 (ours), PTv3 (baseline), PTv2, PTv1, PointNet++, and PointNet, respectively. Subfigures (ik) provide zoomed-in comparisons of critical regions, including the insulator string, pylon, and transmission line intersections, for ground truth, EMAFL-PTv3, and PTv3. The red circles highlight typical segmentation imperfections.
Electronics 14 00650 g003
Table 1. Comparison of segmentation performance of different models.
ModelIoU (%)mIoU (%)mA (%)OA (%)
GroundGround WireInsulator StringPylonTransmission Line
EMAFL-PTv3 (ours)97.3497.0067.2591.7798.9790.4692.8698.07
PTv3 (baseline)93.9991.9160.1980.3898.3984.9790.1195.63
PTv297.2092.6920.3887.6895.8478.7484.6696.82
PTv195.3695.0816.1979.0394.4976.0382.6595.03
PointNet++86.7039.7000.2055.5036.4255.8476.01
PointNet93.1043.503.7034.0066.3048.1163.7584.35
Table 2. Confusion matrix of category point counts for Span I point cloud segmented by EMAFL-PTv3.
CategoriesGround #Ground Wire #Insulator String #Pylon #Transmission Line #OA (%)
Ground *1,127,5550048,1262395.90%
Ground wire *059,2390881098.53%
Insulator string *0145843053834589.13%
Pylon *0523979288,061399.48%
Transmission line *4016810289,75499.42%
* represents ground truth, # represents model predictions.
Table 3. Comparison of the performance of EMAFL-PTv3 and models integrating other attention mechanisms.
Attention MechanismIoU (%)mIoU (%)mA (%)OA (%)
GroundGround WireInsulator StringPylonTransmission Line
-95.0188.4065.7487.0496.7186.7691.3396.76
SE94.9893.8861.7383.9998.8586.6991.0696.42
CBAM97.1595.8063.0690.6298.6889.0692.7697.82
ECA97.1289.3256.8489.5198.5186.2690.3797.53
CA96.5292.0558.8688.4898.9686.9291.0897.32
EMA (ours)97.3497.0067.2591.7798.9790.4692.8698.07
Table 4. Ablation study.
ModelIoU (%)mIoU (%)mA (%)OA (%)
GroundGround WireInsulator StringPylonTransmission Line
PTv3 (baseline)93.9991.9160.1980.3898.3984.9790.1195.63
PTv3 + EMA96.9396.7563.2590.4998.5889.2091.9597.75
PTv3 + Focal Loss95.0188.4065.7487.0496.7186.7691.3396.76
PTv3 + EMA + Focal Loss (ours)97.3497.0067.2591.7798.9790.4692.8698.07
Table 5. Ablation study for values of G.
GIoU (%)mIoU (%)mA (%)OA (%)
GroundGround WireInsulator StringPylonTransmission Line
197.3497.0067.2591.7798.9790.4692.8698.07
296.9593.9461.2090.1398.7988.2091.1997.68
496.8890.7562.9689.1598.5687.6691.2697.48
897.0591.3866.5189.9098.7688.7092.6197.65
1696.6696.7957.9988.9898.2887.7490.9797.46
3297.4795.4265.6691.7899.0189.9792.6998.08
Disclaimer/Publisher’s Note: The statements, opinions and data contained in all publications are solely those of the individual author(s) and contributor(s) and not of MDPI and/or the editor(s). MDPI and/or the editor(s) disclaim responsibility for any injury to people or property resulting from any ideas, methods, instructions or products referred to in the content.

