Article

Social-Aware Link Reliability Prediction Model Based Minimum Delay Routing for CR-VANETs

1
School of Computer Science, Hubei University of Technology, Wuhan 430068, China
2
School of Computer Science and Artificial Intelligence, Wuhan University of Technology, Wuhan 430070, China
3
Chongqing Research Institute, Wuhan University of Technology, Chongqing 404100, China
*
Author to whom correspondence should be addressed.
Electronics 2025, 14(3), 627; https://doi.org/10.3390/electronics14030627
Submission received: 29 November 2024 / Revised: 27 January 2025 / Accepted: 2 February 2025 / Published: 5 February 2025
(This article belongs to the Special Issue AI in Signal and Image Processing)

Abstract

:
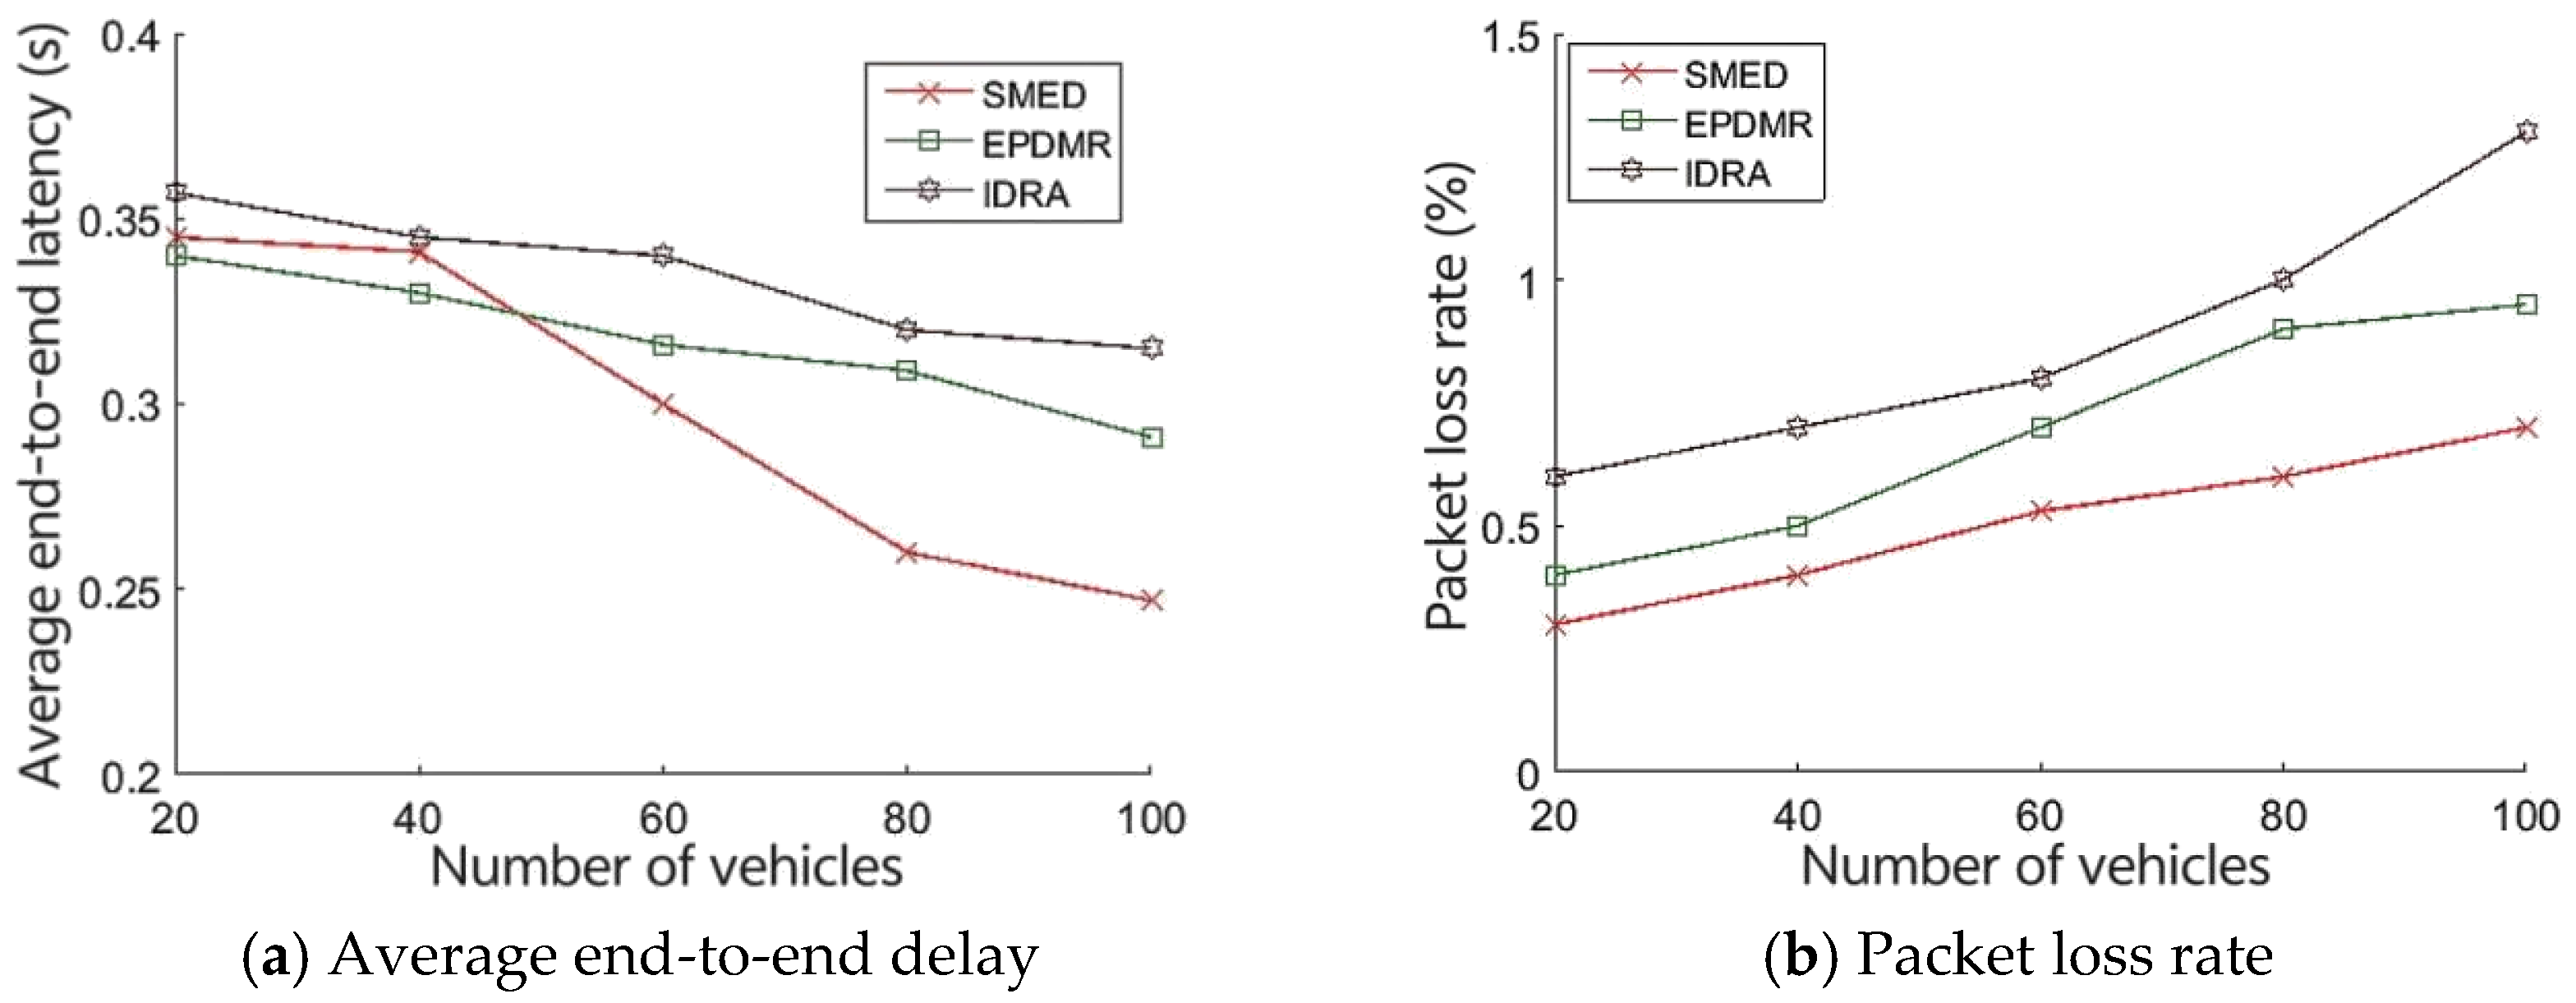
Cognitive radio vehicle ad hoc networks (CR-VANETs) can utilize spectrum resources flexibly and efficiently and mitigate the conflict between limited spectrum resources and the ever-increasing demand for vehicular communication services. However, in CR-VANETs, the mobility characteristics of vehicles as well as the dynamic topology changes and frequent disruptions of links can lead to large end-to-end delays. To address this issue, we propose the social-based minimum end-to-end delay routing (SMED) algorithm, which leverages the social attributes of both primary and secondary users to reduce end-to-end delay and packet loss. We analyze the influencing factors of vehicle communication in urban road segments and at intersections, formulate the end-to-end delay minimization problem as a nonlinear integer programming problem, and utilize two sub-algorithms to solve this problem. Simulation results show that, compared to the intersection delay-aware routing algorithm (IDRA) and the expected path duration maximization routing algorithm (EPDMR), our method demonstrates significant improvements in both end-to-end delay and packet loss rate. Specifically, the SMED routing algorithm achieved an average reduction of 11.7% in end-to-end delay compared to EPDMR and 25.0% compared to IDRA. Additionally, it lowered the packet loss rate by 24.9% on average compared to EPDMR and 32.5% compared to IDRA.

1. Introduction

As a special type of mobile ad hoc network, owing to IEEE 802.11p/DSRC technology [1], the research and development of vehicular ad hoc networks (VANETs) holds significant importance for the advancement of intelligent vehicles and intelligent transportation systems [2]. Cognitive radio technology addresses the spectrum scarcity issue in VANETs, forming cognitive radio vehicular ad hoc networks (CR-VANETs). In CR-VANETs, there are primary users (PUs) and secondary users (SUs). PUs are paying customers and have the privilege to access authorized channels for communication at any time. SUs are non-paying users or vehicles, and they can utilize the authorized channels when PUs are idle [3]. This technology enables vehicles equipped with cognitive radio devices to dynamically utilize spectrum resources allocated to PUs, thereby enhancing network efficiency.
Figure 1 presents a multi-hop vehicle-to-vehicle (V2V) communication system within an urban expressway context, considering an overlay cognitive radio (CR) network. The primary network is composed of several cellular base stations (BSs) and primary users (PUs). Each BS serves multiple PUs within its coverage area. We assume the expressway is divided into a number of segments, each fully covered by the transmission range of at least one BS. The BS with the largest coverage area for a specific road segment is selected to handle V2V communication in that segment. In CR-VANETs, the key difference from traditional VANETs is the addition of the cognitive radio functionality across the stack, which enables dynamic spectrum management and efficient utilization of the spectrum. The protocol stack can integrate various standard vehicular communication protocols (like IEEE 802.11p) with cognitive radio mechanisms for spectrum management and interference mitigation.
CR-VANETs have cognitive properties like intermittent, dynamic access to the PUs’ authorized channel. In CR-VANETs, vehicles cannot move around arbitrarily because of road structures, and vehicles usually move quickly. These factors lead to a lot of link disruptions and instability that cause some end-to-end delays. It implies the unsuitability of traditional ad hoc networks routing protocols and the necessity of improved routing protocols compatible with CR-VANETs [2].
Social attributes among users are long-term and stable relationships, which can be utilized to implement reliable routing strategies in CR-VANETs and reduce the delay caused during vehicular communications [4]. Specifically, the social attribute of PUs refers to the stable behavior patterns they tend to follow. This is because PUs, such as cell phone users and TV viewers, are either human-operated or controlled by humans, and their behaviors typically exhibit predictable and stable patterns. Moreover, the key attributes of SU vehicles focus on similarity and centrality. On one hand, a higher similarity between two vehicles leads to more frequent and prolonged encounters, which enhances link stability and reduces the likelihood of link interruptions. On the other hand, a vehicle’s centrality in the network—characterized by the number of connections it maintains or the frequency of shorter paths that pass through it—makes it more prone to relaying data, thereby ensuring the maintenance of stable communication links. Therefore, in this paper, we conduct a routing study on the characteristics of CR-VANETs and social attributes among users, utilizing the users’ social attributes to make routing decisions and minimize end-to-end delays.
Vehicles that are equipped with wireless communication devices can communicate and share information among themselves. The US Federal Communications Commission (FCC) has allocated dedicated short-range communication channels for intelligent transportation system services. However, in recent years, with the increasing number of vehicles and the growing demand for vehicular applications (such as collision avoidance, safety alerts, remote vehicle diagnostics, file downloads, web browsing, and video streaming), wireless spectrum resources are becoming increasingly limited [5,6]. To enhance the utilization of wireless spectral resources, researchers have integrated cognitive radio technology with vehicle communication to utilize limited resources more flexibly and efficiently, thus giving rise to CR-VANETs [7].
Existing research on CR-VANETs predominantly focuses on the lower layers of the protocol stack, such as the physical layer and the medium access control (MAC) layer. However, the routing scheme poses a critical bottleneck in the overall network performance, and CR-VANETs still face numerous unresolved issues. Unlike traditional cognitive scenarios, the dynamic spectrum of the cognitive environment and the mobility of vehicles frequently cause links between vehicles to disconnect, making routing decisions difficult [2]. Direct application of existing cognitive ad hoc networks or vehicular ad hoc network routing protocols to CR-VANET will lead to outdated decisions and packet loss issues [8,9]. Consequently, the design of routing strategies for CR-VANET environments is challenging.
Researchers have designed routing strategies for a fully interconnected environment in CR-VANETs, aiming to establish end-to-end connections from source vehicles to target vehicles. However, unlike traditional networks, the links between vehicles are unstable and prone to disconnections due to frequent changes in network topology, which can lead to waiting delays. The delay is one of the primary metrics to be considered when designing protocols or routing algorithms, and a low-latency network is not only a prerequisite for ensuring a good user experience in CR-VANETs but also a prerequisite for low-latency vehicular applications. Traditional cognitive ad hoc networks typically use fixed or mobile phone nodes for communication, which move slowly without considering dynamic spectrum access or the high-speed mobility characteristics of vehicles [10,11]. Therefore, routing strategies in traditional cognitive ad hoc networks are not suitable for CR-VANETs, which prompted researchers to look for long-term network characteristics that are more stable than spectrum changes and node mobility characteristics.
Social relationships in CR-VANETs reflect human interactions due to the human-centric nature of devices like vehicles, similar to those in MANETs, PSNs, and MSNs. These relationships are stable as people tend to follow consistent behaviors, encountering each other due to shared routines and interests [12,13]. Additionally, the predictable activity patterns of PUs offer insights into the available spectrum for SUs in CR-VANETs, further supporting the stability of social relationships [14]. Thus, social relationships in CR-VANETs truly reflect the relationships between people and are relatively stable with long-term characteristics, and they can be used to design reliable routing strategies in CR-VANETs. Most existing analytical models of social networks mainly consist of two components, centrality and community [15]. Centrality is defined as a metric to measure the topological importance of nodes in a network, while community indicates that individuals naturally form groups based on their social relationships. Recently, some routing strategies based on social awareness have been proposed, mainly used in cognitive ad hoc networks and VANETs, using centrality and community metrics to improve delivery performance. However, these methods only consider the social patterns of the PUs or only focus on the social characteristics of the vehicle mobility patterns, which fails to find an optimal solution in CR-VANETs, which will lead to a routing strategy. Therefore, in this paper, we introduce the concept of social attributes into CR-VANETs to explore the interrelationships between wireless devices and design routing algorithms.
This paper is based on our previous work, which focused on the social-based cognitive radio vehicular ad hoc networks model in urban scenes (SVMU). The SVMU utilized social attributes to model and predict the activity patterns of PUs and the probability of link stability. According to the SVMU, we propose the Social-based Minimum End-to-End Delay (SMED) routing algorithm for CR-VANETs in this paper. We first analyze the factors affecting inter-vehicle communication in road segments and at intersections. We compute the end-to-end delay of communication that is from the source vehicle to the destination vehicle, deduce the constraints, and formulate the routing optimization problem as a nonlinear integer programming problem. Moreover, we propose the delay-minimizing routing algorithm for the two environments of road sections and intersections, respectively. We employ routing metrics based on the social attributes of PUs and the similarity of SU vehicles and adopt the social-based minimum delay routing strategy in road segments. Furthermore, we employ routing metrics by considering the social attributes of PUs, the angle between the intersection segment and the destination vehicle, and the social attributes of SU vehicles. We take into account the interference of social attributes, intersection directions, and traffic lights with vehicle communication. Additionally, we adopt the social-based minimum delay routing strategy in intersections to achieve the objective of end-to-end delay minimization.

2. Related Work

2.1. Current Research of Social-Aware Cognitive Ad Hoc Networks Routing

Cognitive radio ad hoc networks (CRAHNs) can enable SUs to timely access the spectrum allocated to PUs. Given the intermittent connections and spectrum availability, the challenge in CRAHN is to reliably and effectively transmit messages between SUs. To address this challenge, T. Jing et al. [16] came up with SoRoute, a social-aware opportunistic routing and relay selection scheme. It first uses a new mobility model that takes into account social relationships to predict how reliable a link will be and then combines SU relationships to decide on routing and relays. Additionally, many works have not considered SUs’ activities in spectrum analysis and decision-making. Considering this issue, J. Lu et al. [17] used real data sets of cell phone usage records to estimate the likelihood of PUs’ activities. They then used PUs’ activities to figure out the spectrum opportunities between two communicating SUs. L. Zhang et al. [18] defined two new routing metrics: transmission success probability and average transmission delay. These metrics were used to estimate spectrum availability, assess the dynamic state of global statistical spectrum usage, and determine the local instant spectrum resources. According to the proposed routing metrics, two relevant routing algorithms are designed. J. Yang et al. [19] studied cooperation between the PU’s network and the SU’s network through content caching. Based on the CCRN system model, an optimization problem is formulated to maximize the transmission rate of SUs under the constraint of minimizing the data transmission rate of PUs. Recent works have extensively addressed social-based VANET link reliability estimation and prediction, which is crucial for improving network performance in vehicular communication. Notable studies in this field include Petrov et al. [20], which presents an analytical approach for estimating vehicular communication reliability for intersection control applications. Gatate et al. [21] proposed a routing mechanism based on spectrum availability. The estimation of spectrum availability and spectrum quality is based on distance and the Received Signal Strength Indicator (RSSI). Routing is executed by assigning path weights and selecting the best path with the smallest path weight.

2.2. Current Research of Social-Aware Vehicular Ad Hoc Networks Routing

Actually, routing algorithms designed for CRAHN cannot be applied to VANET. The challenge is that the unique characteristics of the vehicular environment, such as high mobility and the potential for vehicle cooperation, add complexity to maintaining stable communication links and making effective routing decisions. By identifying people’s social behaviors, the effectiveness of routing mechanisms in VANET can be enhanced. Hafeez et al. [22] introduced a fuzzy-aided social-based routing (FAST) protocol. FAST utilizes human social behaviors to improve routing decisions. To transmit data from source to destination, it uses previous traffic-related information. Y Song et al. [23] proposed a social prominence-based routing (SPBR) algorithm that can accurately identify the nature of connections between nodes. They also proposed a social universality to evaluate the social strength of nodes in the system. T Le et al. [24] proposed a socially aware routing technology that can improve fairness and throughput. To complete the task at hand, a node is selected based on the possibility of multi-hop delivery and its line length. Abdelaziz et al. [25] established a connection between VANET and OSN, assessed the honesty of drivers using their OSN data, and integrated vehicle-to-vehicle and OSN-based trust to determine the overall trust in various vehicles and their drivers. Kerrache et al. [26] proposed a trust-aware communication architecture (TACASHI) for social IoV. TACASHI provides a trust-aware social in-vehicle and vehicle-to-vehicle communication architecture for SIoV and also considers the driver honesty factor based on OSN, which is superior to previous proposals (i.e., RTM and AD-IoV).

2.3. Current Research of Cognitive Radio Vehicular Ad Hoc Network

X Tang et al. [27] proposed a network coding-based CRAHN geographic segmented opportunistic routing scheme, which calculates the forwarding set for each short-term opportunity routing segment using only local spectrum opportunities, topology information, and geometric conditions, thus better adapting to the dynamic spectrum environment and constantly changing network topology in CRAHN. J. Wang et al. [28] proposed a social-aware routing scheme for CRAHN based on cognitive radio, aiming to improve the data packet delivery rate and reduce the overhead rate. They also developed a social community division algorithm to classify SUs into intracommunity and intercommunity groups. Priyadharshini et al. [29] built a vehicular sensor network based on cognitive radio and an optimal tree routing protocol, where the cognitive radio network’s tree routing protocol effectively coordinates the tree routing module and channel allocation module. An artificial fish swarm algorithm is used to select the optimal root channel. Smida et al. [30] introduced a link efficiency and experience quality-aware routing protocol (LEQRV) to improve video stream configuration in urban vehicular ad hoc networks. LEQRV uses an enhanced greedy forwarding method to create and maintain stable, high-quality video streaming routes. It improves experience quality performance by increasing the achieved QoE score and reducing end-to-end delay and frame loss. R. Shen et al. [31] studied the power allocation problem in downlink MIMO-NOMA systems, first formulating the power allocation problem as a weighted rate maximization problem and then introducing a series of transformations based on quadratic transformation and Lagrange dual transformation to convert the original problem into a convex problem. J. Wang et al. [32] proposed a delay-tolerant routing and message scheduling (DTRM) scheme for non-real-time applications in CR-VANET, aiming to maximize delivery rate and reduce delivery overhead. J. Wang et al. [33] proposed a multi-hop forwarding scheme to minimize the end-to-end delay in CRAHN supported by cognitive radio. A low-delay forwarding strategy is proposed by considering channel availability and delay costs of relay candidates in different scenarios. In order to improve forwarding efficiency, Lee et al. [34] designed a relay selection algorithm that encourages occasional co-riding on a common path to a public intermediate point. R C et al. [35] proposed a framework model for collaborative centralized and decentralized spectrum bandwidth-aware vehicular networks to demonstrate the value of spectrum efficiency. The designed architecture addresses the challenges of spectrum depletion and high mobility. Singh et al. [36] proposed a new routing strategy for vehicular delay-tolerant networks. The proposed routing strategy selects efficient vehicular relays to complete data packet transmission and intelligently reduces packet loss to achieve timely packet delivery. Awe et al. [37] proposed and studied a classifier that uses a second-order Kalman filter tracker based on the pilot to estimate the slowly changing channel gain between the PU transmitter and the mobile SU. Reddy et al. [38] proposed an integrated solution that integrates reliability routing, estimated link failure, and selective backup routing to minimize packet loss through retransmission, reconstruction, and rerouting, while also monitoring congestion through packet rate control. Z Zhang et al. [39] designed an efficient waiting channel hopping sequence for rapid channel convergence between nearby SUs and proposed a new link metric, transmission efficiency, which characterizes the transmission distance and channel convergence delay.
In urban environments, cognitive radio vehicular networks experience significant delays, and existing research has not considered the social attributes of both PUs and SUs, failing to achieve optimal routing effects. Much of the research that considers social attributes is based on traditional cognitive ad hoc networks, where nodes are predominantly fixed or mobile at a slower pace, such as mobile phone nodes. These do not reflect the characteristics of rapid vehicle mobility and the dynamic nature of topology changes in cognitive radio vehicular networks and thus cannot be directly applied to such networks. Moreover, current routing protocols in cognitive radio vehicular networks do not aim to minimize delay, nor have they taken into account the impact of the PU’s activity and the relationships between SUs on end-to-end communication delays during vehicle communication. Additionally, urban environments have numerous intersections, which limit the direction of vehicle movement, and traffic lights at intersections also have a significant impact on inter-vehicle communication. So, vehicle communication in urban cognitive radio vehicular networks is influenced by a combination of intersection directions, traffic lights, PU interference, and link stability factors. However, existing research has not comprehensively considered all these factors in the design of routing algorithms.

3. Social-Based Link Reliability Prediction Model for CR-VANETs

In this study, we propose a model that integrates PU and SU behaviors to predict link reliability and minimize delay in vehicular networks. The assumptions for Algorithms 1 and 2 are grounded in theoretical frameworks that are commonly used in the literature [40,41], including the IEEE 802.11p standard for vehicular communication and models for sensing channel occupancy and PU activity probability. To better account for real-world dynamics, we have incorporated elements such as vehicle mobility, PU activity, and intersection scenarios into our model. These elements are modeled probabilistically using social attributes, including encounter frequency and encounter duration between vehicles, as well as the behavior of PUs.
We simulate the urban road environment and model the system with social attributes and network characteristics. This is the basis for designing an urban environment to minimize end-to-end delay routing. In our previous work [42], we designed a cognitive vehicular network model that integrates PUs’ and SUs’ social attributes and accurately predicts the probability of active PUs and link stability. We abstracted the urban road scenario as an idealized grid structure, considered the impact of PUs’ and SUs’ social attributes on vehicular communication, and designed the PU’s social model and SU’s social model according to the PUs’ and SUs’ social characteristics, respectively. Since the network model is the basis of routing algorithm design, we also establish a network model based on social attributes, including the PU’s network model and the SU’s network model, and perform link stability prediction based on social attributes. We have proved the correctness and reliability of this model in our previous work [42].
In the PUs’ social model, since PUs are human beings and the activity of each human being has a certain regularity, it can be inferred that the PUs’ activity situation in the cognitive vehicular network is consistent with the user activity situation. Previous analysis of the MIT Reality and UCSD traces [43] reveals that the activity distribution of PU closely follows a normal distribution. While other distributions, such as the folded normal, log-normal, or Rayleigh distributions, could be considered, we chose the normal distribution for its simplicity, mathematical properties, and strong fit to the data. In our previous study, we concluded that the activity of master users follows a normal distribution N ( μ , σ ) , where μ is the expectation, σ is the variance, and f x   is the probability density function, as shown in Equation (1).
f x = 1 σ 2 π e ( x μ ) 2 2 σ 2
In Equation (1), x represents time, and “activity” refers to the probability of a user being active at each specific time x , with the distribution describing how this probability varies over time. In the context of a normal distribution, a negative value usually corresponds to a data point located to the left of the mean on the distribution curve. When computing a “z-score”—a standard measure of how far a data point deviates from the mean—a negative z-score signifies that the value is below the mean. Thus, it models the symmetric behavior of activity around a mean time, with values of x (time) being both positive and negative relative to the mean.
The cumulative density equation is shown in Equation (2).
F ( x ) = x f ( t ) d t = ϕ ( x μ σ )
The probability p t 1 , t 2   d i s c r e t e   t i m e that a PU will be active from t 1 to   t 2 can be calculated as shown in Equation (3).
p ( t 1 , t 2 ) = ϕ ( t 2 μ σ ) ϕ ( t 1 μ σ ) d i s c r e t e   t i m e
Thus, the probability p t   that the PU is active in the time slot s i   can be calculated, as shown in Equation (4).
p t = ϕ ( t τ μ σ ) ϕ ( ( t 1 ) τ μ σ ) d i s c r e t e   t i m e
Then the probability that there is no available channel from   t 1   to t 2   can be obtained by Equation (3), as shown in Equation (5),
q ( t 1 , t 2 ) = ( p ( t 1 , t 2 ) ) C   d i s c r e t e   t i m e
where p ( t 1 , t 2 ) represents the probability that the PU is active from t 1   to t 2 , calculated by Equation (3), and C   is the total number of channels.
Similarity is defined as the product of encounter frequency and duration, reflecting the strength of the relationship—higher frequency and longer duration indicate stronger connections and more stable communication. Vehicles classified as “friends” based on higher similarity are more likely to establish stable communication links with a higher probability of successful data transmission. Thus, we define similarity based on the encounter frequency and the encounter time of the SU vehicle, as shown in Equation (6),
s i m ( V i , V j ) = f i j t i j V i a n d V j a r e f r i e n d s 0 e l s e
where f i j   represents the encounter frequency between V i   and   V j , and t i j represents the encounter duration between V i   and V j . Following Granovetter’s theory [44], we classify vehicle relationships into four categories based on encounter frequency and duration: (1) high frequency/long duration, (2) high frequency/short duration, (3) low frequency/short duration, and (4) low frequency/long duration. Vehicles in categories (1) and (4) are considered “friends”, while those in categories (2) and (3) are “strangers”.
We adopt the degree centrality and the betweenness centrality to measure the degree of importance of a node in the whole network, as shown in Equations (7) and (8).
d ( i ) = ε j F λ i , j i l i j + j V , j F λ i , j i l i j
The degree centrality indicates the sum of the number of links between node i and its strangers and the number of links between i and its friends. Where ε + = 1 , ε > , l i j   denotes the weight over link between V i   and V j   , F λ i   is the friend set of V i .
b c ( i ) =   j i k   j , i , k V ω j k ( i ) ω j k
In our model, the betweenness centrality is based on the number of shortest paths passing through vehicle V i . Specifically, for each source-destination node pair ( v e h i c l e   V j   and V k   ) , we count the number of shortest paths passing through node V i (denoted as ω j k ( i ) ) and divide it by the total number of shortest paths between all node pairs (denoted as ω j k ). This gives us the centrality metric for vehicle V i , reflecting its importance in facilitating communication, compared to other vehicles in the network.
We assume that the PU uses the channel in an exclusive manner, i.e., a channel can only be used by one PU. We view the occupancy state of an authorized channel as a repetitive process that alternates between the blocking and available states. The blocking state signifies that the authorized channel is currently in use, while the available state indicates that no PU is currently using the authorized channel. In each time slot, the PU is either transmitting data or remains in a quiescent state. The active and idle time lengths of the master user follow an exponential distribution with parameters λ b u s y   and λ i d l e , respectively, the time that the master user occupies the channel and does not occupy the channel is shown in Equations (9) and (10), respectively.
T b u s y = 1 λ b u s y
T i d l e = 1 λ i d l e
One important indicator of network performance is the reliability of the communication link, where link failure will result in an increased delay due to the waste of network resources. Based on the causes of link failure, these can be divided into two categories: physical failure and cognitive failure. When the distance between two nodes exceeds the transmission range   R v , the link is considered physically failed. If the communication path between vehicles V i   and V j   becomes unavailable or encounters interference, it is recognized as a cognitive failure. Typically, communication does not require continuous use of the link, but when it is necessary to maintain the link, we model this based on the scenario described in Section 2.2. The probability that the link between vehicles V i   and V j   does not experience failure is calculated by Equation (11), as shown below.
r i j k ( t ) = Y i j k ( t ) I i j k ( t )
where Y i j k ( t ) is the probability that no physical interruption occurs in the link between   V i   and V j   , I i j k ( t ) is the probability that no cognitive interruption occurs in the time slot t .
From Equation (11), the probability that a continuously available link exists between any two vehicles during the time ( t 1 , t 2 ) can be calculated as shown in Equation (12),
p v ( t 1 , t 2 ) = ( r i j k ( t ) ) t 2 t 1 τ
where r i j k ( t ) represents the probability that the link is continuously available in channel k during the time slot t .   I n   a d d i t i o n , in Equation (11), I i j k ( t ) indicates the probability that no cognitive disruption occurs, while Y i j k t represents the probability that no physical disruption occurs.
In this model, t is treated as a continuous variable when calculating the probability of link availability over time or modeling the time period during which the link is continuously available. This is applicable when considering ongoing link stability and cognitive or physical disruptions. However, when referring to specific time intervals, such as during the calculation of primary user activity or during time-slot-based calculations, t is treated as a discrete variable. We list the main symbols in Table 1.

4. Social-Aware Minimum Delay Routing for CR-VANETs

In CR-VANETs, the interference from PUs and the high mobility of vehicles lead to extreme instability in network topology. This causes transient loss of end-to-end paths, resulting in large end-to-end delays. Traditional routing protocols typically make routing decisions based on network topology or geographical information, but these routing protocols are unsuitable for VANETs due to the rapid movement of vehicles. Moreover, conventional vehicular network routing protocols do not take into account the social attributes of users, failing to achieve optimal routing. To solve the problem of large communication delays of urban road vehicles, we will discuss the SMED algorithm based on the SVMU model.

4.1. Problem Formulation

The goal of this paper is to minimize the end-to-end delay, which includes transmission delay, channel switching delay, waiting delay, and queuing delay. In this paper, transmission delay and waiting delay are mainly considered, where transmission delay includes roadway transmission delay and road intersection transmission delay, and waiting delay primarily includes waiting for red light delay and waiting for available channel delay.
Different factors affect vehicles when transmitting data in road segments and at intersections. When the vehicle is traveling in the road section, the inter-vehicle communication is affected by three factors, i.e., available channel, PU’s interference, and link interruption. When the vehicle reaches the intersection, not only do the above three factors interfere with inter-vehicle communication, but traffic signals, vehicle travel direction, and the inconsistency between data packet transmission direction and neighboring vehicle travel direction also cause interference. Aiming at the different influencing factors, this paper discusses the end-to-end delay in two scenarios: in the road section and at the intersection.

4.1.1. Delay in Road Sections

In this paper, the effective transmission time E T T is used to calculate the time required for one-hop transmission of a link.   E T T   is the ratio of the packet length to the product of the transmission power and the packet delivery rate as shown in Equation (13), which has been proven to be correct in the literature [45],
E T T = 1 ( 1 p ) r
where p is the packet error rate for a single channel and r   is the rate of packet transmission.
When the vehicle has packets to transmit and all channels are occupied by the PU, the vehicle needs to carry the packets and wait until there is an available channel. At this time, the waiting delay of waiting for the available channel will be generated, and then the waiting delay of the vehicle waiting for the available channel at t i time is shown in Equation (14),
T w c t i = E T T q ( t i , t i + E T T ) T b u s y
where t i   is the time of the start of the transmission of the hop i , and E T T is the time required for one-hop transmission, as shown in Equation (13). q ( t i , t i + E T T ) is the probability of the arrival of the PU in one-hop transmission time starting from t i time, which is obtained from Equation (5), i.e., the probability of the PU occupying the channel in one-hop transmission. Then E T T q ( t i , t i + E T T ) is the number of times the PU arrives in one hop of data transmission. T b u s y   obtained from Equation (9) is the time of the channel occupied by the PU for each arrival.
Since the delay generated when the vehicle is traveling in the road section is divided into transmission delay and waiting delay generated by waiting for available channels, the delay generated by one hop when the vehicle is transmitting data in the road section is the sum of transmission delay and waiting for available channel delay, as shown in Equation (15),
T h o p r = ( E T T p v ( t i , t i + E T T ) ( 1 q ( t i , t i + E T T ) ) + T w c t i
where p v ( t i , t i + E T T ) is the probability of link stabilization, obtained from Equation (12). q ( t i , t i + E T T ) is the probability that the PU arrives in one-hop transmission time from the moment of t i , which is obtained from Equation (5). Then ( 1 q ( t i , t i + E T T ) ) is the probability of having an available channel. E T T p v ( t i , t i + E T T ) ( 1 q ( t i , t i + E T T ) ) is the one-hop transmission delay. T w c t i   is the waiting delay when there is no available channel within one-hop transmission, which can be obtained from Equation (14).
Then the delay of the vehicle in the road section j   is the cumulative sum of the delay generated by all the hops of data transmission in the road section j , i.e., the expectation of the delay generated by the vehicle in the road section j   is shown in Equation (16),
E ( T r o a d j ) = i = 1 h j T h o p r
where   h j   is the number of hops passed in the road segment j and T h o p r is the delay generated by one hop in the road segment, which is obtained from Equation (15).
From the above equation, the total delay generated by the vehicle from the source vehicle to the target vehicle on the roadway is the sum of the delay generated on all the roadways, i.e., the delay expectation generated by the vehicle on all the roadways is shown in Equation (17),
E ( T r o a d ) = j = 1 κ E ( T r o a d j )
where κ is the number of road segments passed from the source vehicle to the target vehicle, and E ( T r o a d j ) is the expectation of the delay generated in the road segment j , which is obtained from Equation (16).

4.1.2. Delay at Intersections

When vehicles approach intersections, inter-vehicle communication is influenced not only by available channels, interference from PUs, and link stability but also by traffic signals, vehicle travel direction, and the consistency between the directions of relay vehicles and the direction of data packet transmission, which makes the situation more complex. So, the communication scenarios are divided into two types in this paper based on the signal light color: red light and green light.
(1)
The current traffic signal is red.
Available channels
When the traffic signal is red and a channel is available, the vehicle carrying the data packet must wait at the intersection. However, if there are enough neighboring vehicles and an available channel, the vehicle can forward the packet to a neighboring vehicle for data transmission. In this scenario, the delay in data transmission is solely due to the transmission delay, and there is no additional waiting time, which is referred to as scenario 1. This scenario is described in detail below.
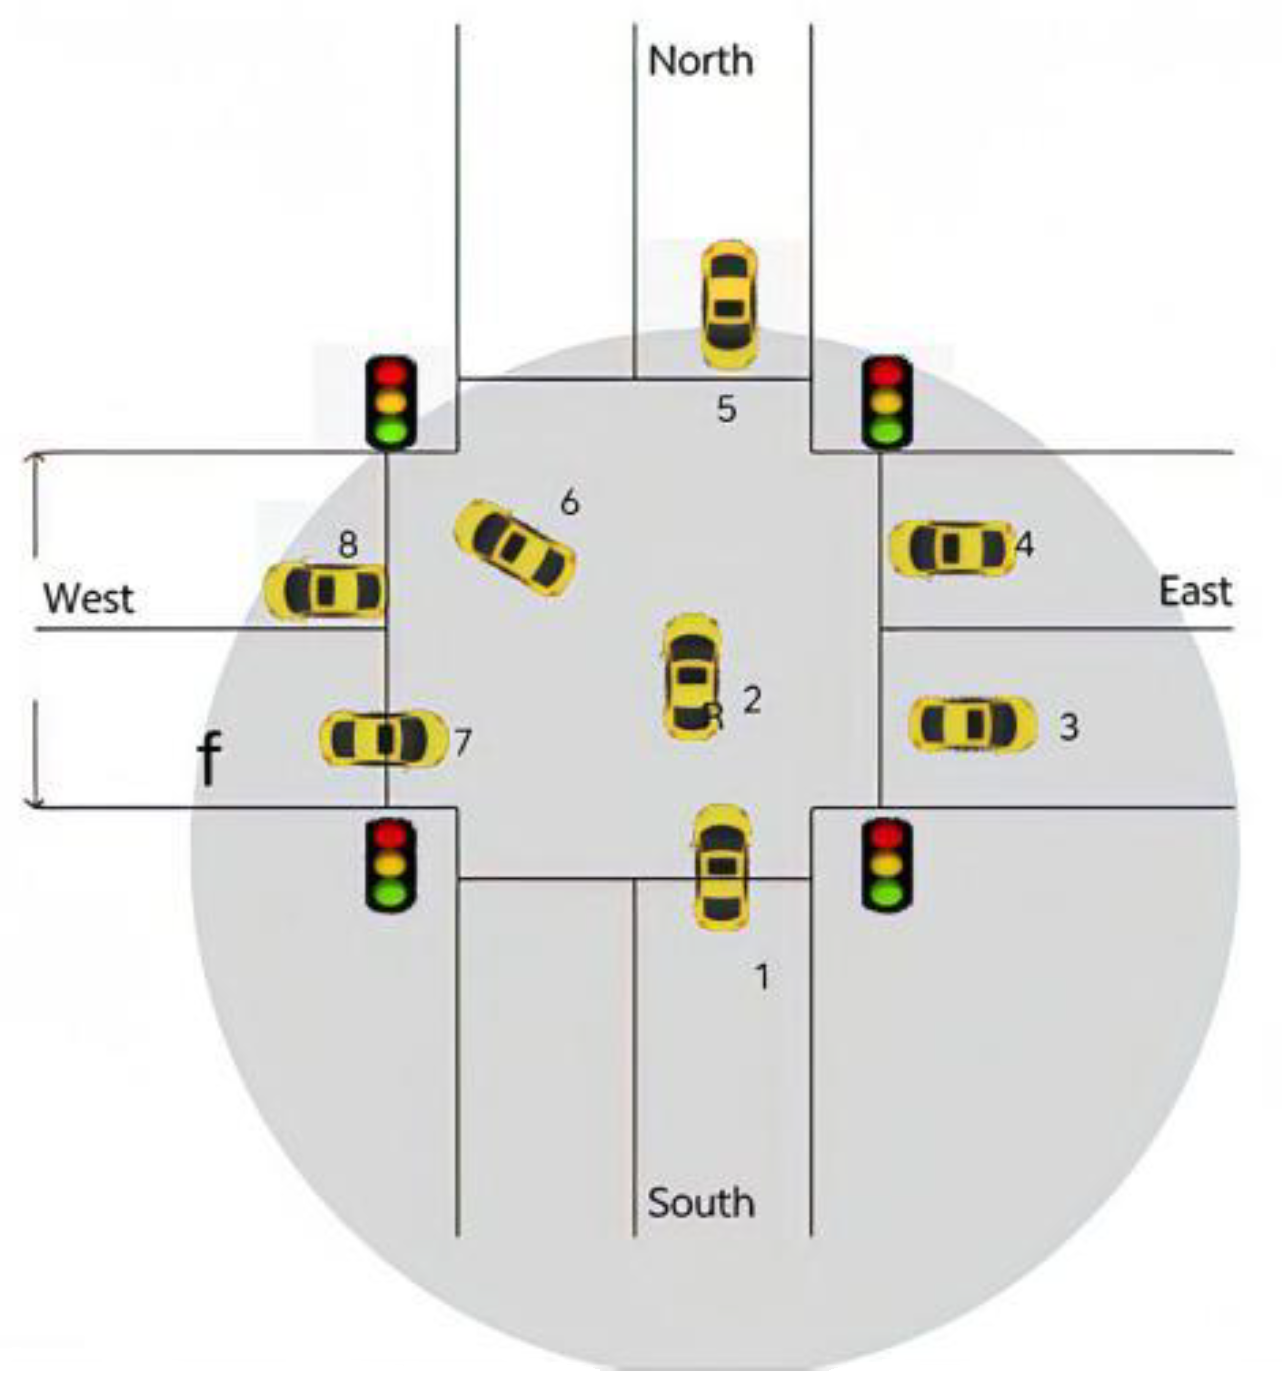
Scenario 1 analysis: as shown in Figure 2, assuming that vehicle 1 is the vehicle carrying the data packet, at this time the north–south direction traffic light is red and the east–west direction traffic light is green; the specific situation is analyzed as follows.
a. When the direction of packet transmission is straight, if vehicle 1 can send all the packets to vehicle 5 which has passed the intersection during the red light (i.e., f + v T r e d i R v , where f is the width of the intersection, v is the speed of the vehicle,   T r e d   i is the current remaining time of the red light, and   R v   is the transmission distance of the vehicle), the packets can be transmitted through one hop at this time; if vehicle 1 cannot send all the packets to vehicle 5, which has passed the intersection during the red light (i.e., f + v T r e d i > R v ), the packet can be forwarded through the intersection via multiple hops through vehicle 2, vehicle 6, vehicle 3, and vehicle 4, and the delay caused at this time is the transmission delay.
b. When the direction of vehicle movement differs from the direction of packet transmission, the vehicle may forward the packet in the same lane as the packet transmission, resulting in a transmission delay.
The above analysis shows that the delay under scenario 1 is a transmission delay, and no additional waiting delay is generated. That is, the transmission delay of the vehicle at the hop i under scenario 1 is shown in Equation (19),
d t r i = E T T p v ( t i , t i + E T T ) ( 1 q ( t i , t i + E T T ) )
where p v ( t i , t i + E T T ) is the probability that the link is stable, obtained by Equation (12). ( 1 q ( t i , t i + E T T ) ) is the probability of having an available channel, which is obtained by the calculation of Equation (5).
No available channel
When the traffic signal is red and there is no available channel, in addition to generating a transmission delay, there will be two kinds of waiting delay: when the waiting time for the red light is less than the waiting time for the available channel, the waiting delay is the waiting time for the red light time; when the waiting time for the red light is greater than the waiting time for the available channel, the waiting delay is the waiting time for the available channel time, as shown in Equations (19) and (20).
T w l 1 = P { T r e d i T w c t i } T r e d i
T w l 2 = P { T r e d i > T w c t i } T w c t i
Among them T w l 1 is the waiting delay generated when the signal light at the intersection is red and there is no available channel; the waiting time for the red light is less than the waiting time for the available channel;   T w l 2   is the waiting delay generated when the traffic signal light at the intersection is green and there is no available channel; the waiting time for the red light is greater than the waiting time for the available channel; and   T r e d   i is the remaining time of the red light at the current moment. T w c t i   calculated by Equation (14) is the delay time for waiting for the available channel. P { T r e d i T w c t i } is the probability that the waiting time for the red light is less than the waiting time for an available channel, P T r e d i > T w c t i is the probability that the waiting time for the red light is greater than the waiting time for an available channel.
(2)
The current traffic signal is green.
When the traffic signal is green, it is discussed in two cases based on the availability of available channels.
Available channels
When the traffic signal is green and there is an available channel since it is assumed in this paper that the density of vehicles is large enough and the vehicles have enough neighboring vehicles, the vehicle carrying the packet can forward the packet to the neighboring vehicles; at this time the resulting delay is the transmission delay. In this paper, this situation is called scenario 2, which will be analyzed in detail below.
Scenario 2 analysis: as shown in Figure 3, assuming that vehicle 1 is the vehicle carrying the packet, the north–south lanes are green, and the east–west directions are red. At this point, there are three scenarios to discuss.
a. When the transmission direction of the data packet is north, if the traveling direction of vehicle 1 is straight, at this time, vehicle 1 can forward the data packet to vehicle 2, vehicle 5, or select vehicle 3 or vehicle 4 as the relay vehicle, which will forward it to vehicle 5.
b. When the direction of transmission of the packet is west, vehicle 1 may forward the packet to vehicle 8, vehicle 6, and vehicle 2.
c. When the direction of transmission of the packet is east, vehicle 1 may forward the packet directly to vehicle 3 or choose to forward the packet to vehicle 2, which will forward the packet to the vehicle on the east road segment.
The above analysis shows that when the traffic signal is green and there is an available channel, the vehicle’s delay at this time is the transmission delay.
No available channels
When the traffic signal is green but there are no available channels, the vehicle must wait for the available channel, resulting in a delay that combines both the transmission delay and the waiting time for the available channel.
Combining the above discussion of the two cases (1) and (2), it can be seen that the one-hop delay at an intersection is shown in Equation (21),
T h o p i n = d t r i + T w c t i + T w l 1 + T w l 2
where d t r   i is the transmission delay in the case that the link is not interrupted and there is an available channel at the hop i , which can be calculated by Equation (18).   T w c t i   is the delay time for waiting for the available channel, which can be calculated by Equation (14). T w l 1   is the waiting delay when the intersection signal is red and there is no available channel, and the waiting time for the red light is less than the waiting time for the available channel, which is calculated by Equation (19). T w l 2 is the waiting delay when the intersection signal is green and there is no available channel, and the waiting time for the red light is greater than the waiting time for the available channel, which is calculated by Equation (20).
Then the delay generated by the vehicle at the intersection x is the cumulative sum of the delay generated by each hop transmission at the intersection, i.e., the delay expectation generated by the vehicle at the intersection x is shown in Equation (22),
E ( T i n x ) = x = 1 h x T h o p i n
where h x is the number of hops transmitted at the intersection x and T h o p   i n is the delay generated by one hop at the intersection, obtained from Equation (21).
According to the above equation, the total delay generated by the vehicle from the source vehicle to the target vehicle at the intersection is the sum of the delay generated at all intersections, i.e., the delay expectation generated by the vehicle at all intersections is shown in Equation (23),
E ( T i n ) = x = 1 χ E ( T i n x )
where χ is the number of intersections passed from the source vehicle to the target vehicle, and E ( T i n x ) is the delay incurred by the vehicle at the intersection x as calculated by Equation (22).
In summary, a vehicle’s end-to-end delay for packet transmission on an urban roadway consists of both the delay in the road segment and the delay at the intersection, i.e., the vehicle end-to-end delay expectation is shown in Equation (24),
E ( T e ) = E ( T r o a d ) + E T i n
where E ( T r o a d ) is the expectation of the road segment delay, which is obtained from Equation (17). E ( T i n ) is the intersection delay expectation, which is obtained from Equation (23).
In summary, the objective function of this paper can be derived as:
argmin { E ( T e ) }  
Constraints:
j = 1 κ h j + x = 1 χ h x h
T w c t i T w T H
j v i θ i j ( t ) + k v i θ k i ( t ) 1
Equation (25) is the objective function of this paper, which is to minimize the end-to-end delay. Where h is the total number of all vehicles between the source vehicle and the target vehicle, h j   is the number of hops passed in the road segment j , κ is the number of road segments passed from the source vehicle to the target vehicle, h x   is the number of hops transmitted at the intersection x . χ is the number of intersections passed from the source vehicle to the target vehicle. Constraint (26) represents that the number of vehicles passed between the transmissions of the packet from the source vehicle to the target vehicle should be less than the total number of vehicles between the source vehicle and the target vehicle. Constraint (27) represents that the waiting delay in one-hop transmission should be less than the waiting delay threshold, where   T w T H   is the waiting delay threshold, which is proven to be correct in the literature [46]. In constraints (28), p t denotes the link from V i   to V j   in the time slot t , and   θ k i ( t ) denotes the link from V k   to V i   in the time slot t , and this constraint indicates that a vehicle node cannot receive and send data at the same time. In conclusion, we observe that the aforementioned issue is a nonlinear integer programming problem, which is NP-hard due to its unsolvable nature. Therefore, this paper focuses on studying and designing the SMED algorithm to minimize the end-to-end delay.

4.2. Minimum End-to-End Delay Routing Algorithm

In CR-VANETs, urban scenarios are affected by the dual effects of unstable links in road segments and complex environments at intersections, leading to larger delays. Characteristics such as inconsistent direction of vehicle movement and faster changes in network topology lead to unstable inter-vehicle links. The low market penetration rate of VANET devices makes the entire VANETs seriously affected by intermittent connectivity problems for at least the next decade, even if the density of vehicles in urban scenarios is sufficiently high. On the other hand, there are a large number of intersections on urban roads, so the routing verdicts of vehicles at intersections play a crucial role in routing performance.
In this section, routing metrics and algorithms for minimizing latency are designed for road segments and intersections based on the SVMU model, considering the different factors affecting vehicle communication in these environments. Specifically, channel selection is based on the active patterns of PUs, relay selection in road segments is based on the similarity between SU vehicles and the current vehicle, and direction selection at intersections is based on the angle between the intersection road segment and the destination vehicle, as well as the stable time of links on the road segment. Additionally, the social attributes of SUs are used to define vehicle weights and select the optimal direction and relay, and the social-based minimum delay routing in road segment (SMDR) and the social-based minimum delay routing in intersection (SMDI) are designed to achieve the purpose of minimizing the end-to-end delay.

4.2.1. Routing Metrics Design

The vehicle’s motion environment in cities can be categorized into road segments and intersections. When vehicles are moving in road segments, inter-vehicle communication is influenced by interference from PUs and link stability. Conversely, when vehicles are at intersections, they are not only affected by the aforementioned two factors but also by the direction of the intersection and traffic signals. Therefore, when designing routing metrics in this paper, it is divided into the design of routing indicators in road segments and the design of the routing index at intersections.
Before vehicles communicate in road segments, channel selection is the first step. Since inter-vehicle communication in road segments is affected by interference from PUs and link stability, when the probability of PUs’ activity on a channel is low, the interference they may cause to communication between SU vehicles is relatively small. Predicting the active probability of PUs based on their social attributes is used in this paper for channel selection. That is, when multiple channels are available, the active probability of PUs on each channel, denoted as p t , is sorted according to Equation (4), and the channel with the lowest active probability of PUs is selected for data transmission to ensure minimal PU’s interference and achieve the goal of minimizing end-to-end latency.
After selecting the available channels, inter-vehicle link stability is also a very important assessment criterion for vehicle communication quality. According to the similarity between vehicles in the SU’s social model, it can be seen that the higher the similarity between the two vehicles, the higher the frequency of the two vehicles’ encounters, and the longer the duration of each encounter, the more stable the link formed between the two vehicles, and the lower the probability of link interruption. Therefore, in this paper, when carrying out the selection of relay vehicles in the road section, we will prioritize the vehicles with high similarity to the current vehicle as the relay vehicle, and the similarity calculation process is shown in Equation (6).
When the vehicle arrives at intersections, it is also necessary to select the channel first. Since the PU’s interference is taken into account, the channel with the lowest probability of PU’s interference is selected for data transmission, following the same method as the channel selection in the road section.
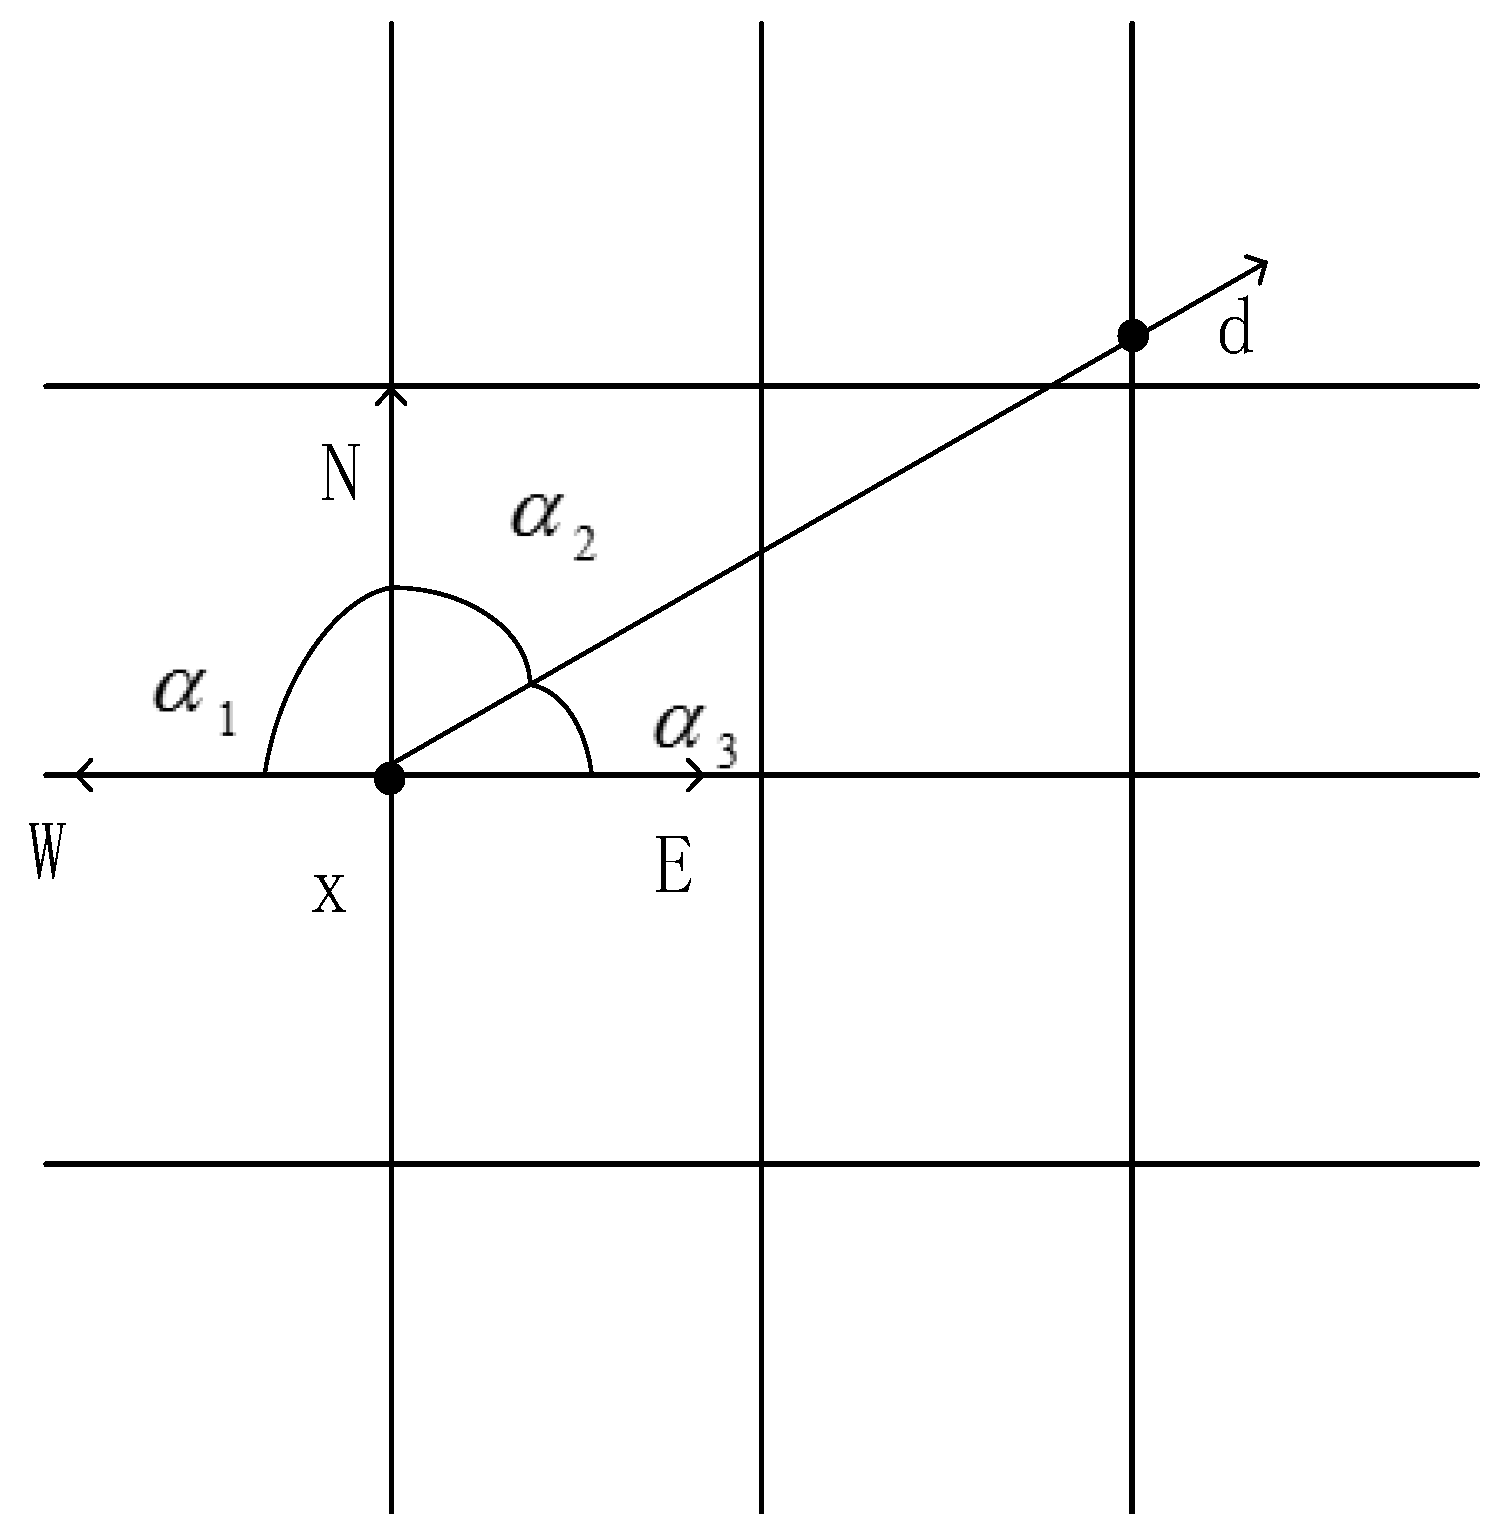
When the channel is selected, direction selection is needed to make the packet transmission direction closer to the target vehicle. In this paper, the optimal and suboptimal direction selection is carried out by comparing the angle between the current intersection where the vehicle is located and the target vehicle, as shown in Figure 4. When the vehicle arrives at the intersection, a directed graph is established with the current intersection as the starting point, including vectors x d , x N , x W , x E , respectively, which represent the vector composed of the intersection and the target vehicle, the vector composed of the intersection and the north road section, the vector composed of the intersection and the west road section, and the vector composed of the intersection and the east road section. Among them, α i ( i = 1,2 , 3 ) represents the angle between the vectors x W , x N , x E and   x d , respectively. The smaller the angle is, the more the road section is biased towards the direction of the target vehicle. Typically, there are two closer angles, which represent the two better road sections.
After obtaining the better road sections, it is necessary to make the optimal choice between the two road sections. Since traveling in a road section may cause link interruptions due to distance or interference to the PU, the communication stability of the two road sections needs to be compared. We utilize the inter-vehicle communication link stability prediction and define the time when the link on the road section n can be transmitted stably without interruption t n   , as shown in Equation (29),
t n = r i j k t e v
where r i j k ( t ) is the probability of link stabilization, which can be calculated by Equation (11). e is the length of the road section, v is the speed of the vehicle, and e   v   represents the time that the vehicle travels on the road section.
By comparing the link stability time of two better road sections, the optimal and suboptimal road sections are selected from the two better road sections. When a vehicle carries out data forwarding, it not only needs to consider the direction of the road section but also needs to consider the importance of the neighboring vehicles on the road section in the whole network, so with the help of the vehicle centrality to define the metric   ω i   that represents the importance of the node i in the whole network, as shown in Equation (30),
ω i = d ( i ) + b c i
where d ( i ) is the point centrality of the node, calculated by Equation (7). The larger the value of d ( i ) , the more popular the node. b c ( i ) is the intermediate centrality of the node, obtained by Equation (8), and represents the number of shortest paths passing through node i , this criterion is a key measure of the overall importance of the node, the larger the value of b c ( i ) , the greater the number of shortest paths passing through node i , and the more important node i is in the whole network.
After selecting the optimal road section, the current vehicle selects the neighbors whose movement direction is consistent with the packet transmission direction from the neighboring vehicles located at the intersection of the optimal road section and puts them into the forwarding set   F i . The neighboring vehicles in the forwarding set are then sorted based on their weights ω j , and the neighbor with the highest weight is selected to forward the data packet.

4.2.2. Minimum Delay Routing in Road Segments

This subsection mainly introduces the workflow of the SMDR algorithm, giving the assumptions on which the algorithm design is based, the description of the algorithm steps, the corresponding pseudo-code, and the algorithm interpretation and analysis, respectively, to explain the algorithm design process in detail. In addition, the algorithm in this section performs routing according to the metrics in the design of road segment routing metrics in Section 4.2.1.
The algorithms in this section are designed based on the following assumptions: We assume that the vehicle density on the road segment is sufficient when a vehicle has information to transmit; it will not encounter a situation where there are no neighboring vehicles available. All vehicles are equipped with two cognitive transceivers, one for transmitting and receiving data messages and another for receiving and transmitting control messages via a common control channel. In real life, vehicle communication will be interfered with by various obstacles, so in this paper, we assume that a vehicle traveling on a road section can only communicate with other vehicles on the same road section, not with those on other road sections. Similarly, a vehicle at an intersection can only communicate with other vehicles on the same intersection or with those on the reverse lanes of its current road section, but not with vehicles across the intersection. All vehicles can obtain their geographic location information and driving direction information through GPS and can exchange this information with neighboring vehicles. We also assume that each vehicle node cache is large enough that there will not be a case of insufficient cache resulting in packet loss. Each packet has its survival time; if the packet cannot be delivered to the target vehicle in its survival time, this packet will be discarded. Since the topology of the urban road structure network changes rapidly and routing paths are decided dynamically during packet transmission rather than planned in advance. The vehicle can acquire all channels in the current time slot occupied by the PU. Since the vehicle is equipped with GPS, the vehicle can know the destination information of other vehicles. When a vehicle transmits data in a road section, it first performs channel detection, and if there is no available channel, it carries packets and waits. When there is an available channel, the current vehicle sorts the channels according to the active probability of the PU on the channel and selects the channel with the smallest active probability of the PU for data transmission.
After selecting the channel, the vehicle makes a judgment based on the geographic location of the target vehicle, which is divided into three scenarios.
Scenario 1: The source vehicle and the target vehicle are on the same road segment, and the target vehicle is in the transmission range of the source vehicle.
Scenario 2: The source vehicle is on the same road segment as the target vehicle, but the target vehicle is not in the transmission range of the source vehicle.
Scenario 3: The source vehicle is not on the same road segment as the target vehicle.
Our SMDR sub-algorithm initializes the channel set C l i s t , the relay vehicle set C l i s t , the forwarding set   V s = V j   and the weight set ω i   to empty. When the vehicle V r e l a y   enters the road section, the vehicle   V r e l a y   carries out channel detection, if there is no available channel, it carries the data packet and waits, if there is an available channel, it selects the channel with the lowest active probability of the PU as the optimal channel for communication, i.e., for the vehicle   V r e l a y   , the optimal channel   F i   selected at this time is as shown in Equation (31),
c i = m i n p t
where   p t   is the value of the active probability of the PU on the current channel, which is calculated by Equation (4), the smaller the value indicates that the smaller the probability of interference by the PU in the communication process of the SU vehicle using the channel. Therefore, the channel with the smallest active probability of the PU is selected as the optimal channel and added to the set C l i s t .
After the channel is selected, the forwarding set   V s = V j   is updated according to the current position information, and the relay vehicle is selected according to different scenarios. If it is scenario 1, the vehicle   V r e l a y   forwards the packet directly to the target vehicle V r e l a y ; if it is scenario 2, greedy forwarding is used to select the vehicle closest to the target vehicle V r e l a y   as the relay vehicle from the forwarding set   V s = V j , and forward the packet to add the current relay vehicle to the set   C l i s t , and update the source vehicle   V r e l a y   to the current relay vehicle; if it is scenario 3, calculate the similarity values between the vehicles in the forwarding set V s = V j and V r e l a y   according to Equation (6), and get the weight set ω i , and select the vehicle with the maximum similarity value V j   as the relay vehicle, forward the packet, add the current relay vehicle to the set C l i s t , and update the source vehicle V r e l a y   to   V j , and then the vehicle V j will become the new source vehicle carrying the packet. In summary, for the vehicle   V r e l a y , the relay vehicle at this time is shown in Equation (32),
V j = V d Scenario 1 m i n ( d j d ) Scenario   2 m a x ( s i m ( V s , V j ) ) Scenario   3 ;   where   V j F s , s i m V s , V j Z s
where F s is the forwarding set of vehicle V r e l a y ,   ω i is the set of similarity values of V r e l a y with V r e l a y in the forwarding set of vehicle, V r e l a y is the target vehicle,   d j d is the Euclidean distance between V j   and   V r e l a y , and s i m ( V s , V j ) is the similarity value between   V j   and V r e l a y , which is calculated by Equation (6). Return to the selected set of channels   C l i s t   and the set of relay vehicles C l i s t   in the communication process from the source vehicle to the target vehicle, where the set of relay vehicles represents the path of packet transmission in the communication process. The SMDR sub-algorithm is shown as follows.
Algorithm 1: SMDR Algorithm
Inputs: source vehicle V r e l a y , target vehicle V r e l a y
Output: channel set C l i s t , relay vehicle C l i s t
1. Define the sets C l i s t , V r e l a y , F s , Z s
2. while V r e l a y ! =   V r e l a y
3.    Channel detection for SU vehicles
4.    if all channels are occupied by the PU
5.      Store the packet and wait for T w c t i , T w c t i   is calculated by Equation (15)
6.      Channel detection for SU vehicles
7.    else
8.    Calculate the active probability of the PU on the available channels p t according to Equation (4), and sort the available channels in the set of channels Ψ .
9.      Select the channel F i   with the lowest active probability of the PU p t and add   F i   to the set of channels   C l i s t
10.      if ( s d ! = s d )
11.          Select neighboring vehicles in the same direction of motion as the packet transmission direction to join the forwarding set   F s
12.      According to Equation (6), calculate the vehicles in the forwarding set V r e l a y   and their similarity value V j , and get the set of V j   values in the forwarding set   V s = V j . ω i
13.      Select the largest vehicle V j   from the set   Z s   V j and merge it into the set   C l i s t .
14.         V s = V j
15.      else
16.        if ( V d F s ) Pass the packet
17.        else Greedy Forwarding
18.        Merge C l i s t   into V r e l a y
19.        end if
20.      end if
21.    end if
22. end while
23. return   C l i s t , C l i s t
Line (1) of the algorithm is the initialization, and line (2) is the end-of-procedure judgment, which indicates that if the vehicle currently carrying the packet is not the target vehicle, the subsequent procedure is executed. Line (3) indicates that the PU performs channel probing, and lines (4) to (6) indicate that if there is no available channel, the vehicle carries the packet and waits for T w c t i before performing channel probing again. Lines (7) to (9) indicate that if there is an available channel, the optimal channel selection is done based on the active probability of the PU. Lines (10) to (14) indicate that when the current vehicle and the target vehicle are not in the same road segment, the forwarding set is constructed, and the vehicle with the largest similarity value is selected as the relay vehicle according to the similarity ranking between the vehicles in the forwarding set and the current vehicle. Lines (15) through (16) indicate that if the current vehicle and the target vehicle are in the same road section and the target vehicle is within the transmission range of the current vehicle, the packet is directly sent to the target vehicle. Line (17) indicates that if the target vehicle is not in the transmission range of the current vehicle, greedy forwarding is used; line (18) indicates that the current vehicle is merged into the set of relay vehicles; and line (23) is the return value of this algorithm.

4.2.3. Minimum Delay Routing in Intersections

The algorithm design assumptions in this section are the same as the algorithm design assumptions in Section 4.2.2; in addition, the algorithms in this section perform routing based on the metrics in the intersection routing metrics design in Section 4.2.1.
After the vehicle reaches the intersection, channel detection is performed, and if there is no available channel, scene judgment is performed at this time.
Scenario 1: The traffic signal is red, and the remaining red time is less than the waiting time for an available channel.
Scenario 2: The traffic signal is red, and the remaining red time is greater than the waiting time for the available channel.
Scenario 3: The traffic signal is green.
If there is an available channel, the current vehicle ranks the channels according to the active probability of the PU on the channel and selects the channel with the smallest active probability of the PU for data transmission. After selecting the channel, the optimal road section and the optimal relay vehicle selection need to be carried out, which is divided into the following scenarios.
Scenario 4: The current vehicle and the target vehicle are at the same intersection, and the target vehicle is in its transmission range.
Scenario 5: The current vehicle and the target vehicle are at the same intersection, but the target vehicle is not in its transmission range.
Scenario 6: The current vehicle and the target vehicle are not at the same intersection.
Our SMDI sub-algorithm initializes the set of selected intersection sections   S i n , the set of relay vehicles   V r e l a y , the set of selected channels C l i s t , the set of intersection pinch points Φ x , and the set of weights in the forwarding set   W i   to empty. Vehicle V r e l a y enters the intersection and carries out channel detection; if there is no available channel, it will perform scene judgment. If it is scene 1 and the target vehicle is not in the same road segment as the current vehicle, the vehicle carries the data packet and waits for   T r e d i ; if it is scene 2 and scene 3, it carries the data packet and waits for T w c t i .
If there are available channels, the value of all available channels p t   in the channel set Ψ are calculated according to Equation (4), and all available channels in the channel set are sorted according to the value of p t , the channel F i   with the smallest value of p t   is selected as the optimal channel, and this channel is added to the set   C l i s t . The selected optimal channel is shown in Equation (31).
After the channel is selected, the forwarding collection V s = V j   is updated according to the current position information, and the relay vehicle is selected according to the second step of scene judgment. If it is scenario 4, the vehicle   V r e l a y   forwards the data packet directly to the target vehicle V r e l a y , updates the source vehicle to V r e l a y , and merges the road section   s d   into the set   S i n   ; if it is scenario 5, greedy forwarding is used, the vehicle selects the vehicle closest to the target vehicle V r e l a y as the relay vehicle from the forwarding set   V s = V j , forwards the data packet, adds the current relay vehicle into the set C l i s t , updates the source vehicle V r e l a y   to the current relay vehicle, and merges the road section   s d into the set S i n ; if it is scenario 6, the vehicle V r e l a y   calculates the angle between the vector composed of the current intersection x and the three road sections and the vector composed of the intersection x and the target vehicle, and obtains the angle set Φ x   of the intersection x , and selects the smaller two values from this set, and labels the two corresponding road sections as s 1 and s 2 , which are the better road sections. According to Equation (29), the time of sustainable stabilization of the links on the road sections s 1 and s 2     t 1   and t 2   is calculated, and the road section with the longer time of sustainable stabilization of the links is selected as the optimal road section, which is merged into the set S i n . The optimal road section selected at this time is shown in Equation (33).
s i n = s 1 t 1 > t 2 s 2 else  
The vehicle with the same direction of movement as the direction of the target vehicle is selected from the optimal road section to join the forwarding set, the information of the forwarding set is updated, the weights of all the vehicles in the vehicle V s   forwarding set ω i are calculated according to Equation (30) to obtain the weight set W i , the vehicle V j   with the maximum weight value from the set W i   is selected as the relay vehicle, and the data packet is forwarded to V j , V j is merged into the set   V r e l a y , and the source vehicle is updated to   V j . In summary, for vehicle   V s , the relay vehicle at this time is shown in Equation (34),
V j = V d scenario   4 m i n ( d j d ) scenario   5 max ( ω j ) scenario   6 ;   where   V j F s , ω j W s  
where   F s   is the forwarding set of V s , ω j   is the weight of V j , which is calculated by Equation (30). W s   is the set of weights of all vehicles in the forwarding set F s   of vehicle   V r e l a y , V r e l a y   is the target vehicle, and d j d   is the Euclidean distance between V j and target vehicle V r e l a y .
Return the selected set of channels   C l i s t , the set of relay vehicles C l i s t   and the set of road sections   S i n passed during the communication process from the source vehicle to the target vehicle, where the set of relay vehicles represents the path of packet transmission during the communication process. The SMDI sub-algorithm is shown as follows.
Algorithm 2: SMDI Algorithm
Inputs: source vehicle V r e l a y , target vehicle V r e l a y
Output: set of selected road intersection sections   S i n , set of relay vehicles   V r e l a y , set of selected channels C l i s t
1. Define the sets S i n , V r e l a y , C l i s t , Φ x = , W i , define the variables s i n = s s
2. while V r e l a y ! = V r e l a y
/* If all channels are occupied by the PU, carry the packet and wait */
3.    The SU vehicle performs channel detection
4.    if all channels are occupied by the PU
5.      if ( C l i s t ! = I d &&   V r e l a y == red &&   T r e d i T w c t i )
6.        Store packets and wait for T r e d i
7.      else
8.        Store the packet and wait for T w c t i ,   T w c t i calculated by Equation (14)
9.      The SU vehicle performs channel detection
10.    end if
11. else
/*Channel selection when there are available channels*/
12.    Calculate the active probability of the PU according to Equation (5)   p t and sort the available channels in the set of channels Ψ .
13.    Select the channel   F i   with the lowest active probability of the PU p t and add F i to the set of channels.   C l i s t
14.    if (   C l i s t ! =   I d )
15.          Select the smaller two angles and label the corresponding road sections as s 1 and s 2 from the set of angles at the intersection x   Φ x
16.    Calculate the duration of uninterrupted communication on the road sections   s 1   and s 2   t 1 and t 2   according to Equation (29)
17.      if (   t 1 > t 2 )
18.        Add s 1   to S i n   ,   s i n = s 1
19.      else
20.        Add s 2 to   S i n   , s i n = s 2
21.      end if
22.        Select neighboring vehicles to join the forwarding pool in the same direction of motion as packet transmission   F s  
23.        Calculate the weights of all vehicles in   F s   according to Equation (30) and obtain the set of weights   W s   .
24.        Sort to get the vehicle with the largest   ω j   value in the set F s   V j
25.        Add   V j   to the collection V r e l a y .
26.         V s = V j
27.    else
28.      if ( V d F s ) Pass the packet
29.      else Greedy Forwarding
30.      Merge   C l i s t   into   V r e l a y
31.      Incorporate   s d   into S i n
32.      end if
33.    end if
34. end if
35. end while
36. return S i n ,   V r e l a y ,   C l i s t
Line (1) of the algorithm is the initialization, and line (2) is the end-of-procedure judgment, which indicates that if the vehicle currently carrying the packet is not the target vehicle, the subsequent procedure is executed. Line (3) indicates that the SU vehicle performs channel detection; lines (4) to (6) indicate that if there is no available channel and the target vehicle and the current vehicle are at the same intersection, the traffic signal is red, and the waiting time for the red light is smaller than the waiting time for the available channel, then the packet is stored and waits for   T r e d i . Lines (7) to (9) indicate that in the case of no available channel, the vehicle waits for   T w c t i   before channel detection in all cases except for the condition in line (5). Lines (12) to (20) indicate that the vehicle selects two smaller angles from the set of current road intersection angles   Φ x , and the two road sections corresponding to the angles are the better road sections and calculates t n   according to Equation (30), selects the road section with the larger value of   t n   as the optimal road section. Lines (22) to (26) indicate the sorting of the vehicles’ weights in the forwarding set, and the vehicle with the largest weight is selected as the relay vehicle. Lines (27) through (28) indicate that if the target vehicle is at the same intersection as the current vehicle and the target vehicle is within its transmission range, the packet is directly forwarded to the target vehicle. Line (29) indicates the use of greedy forwarding if the target vehicle is at the same intersection as the current vehicle but not within its transmission range. Line (36) is the output of this algorithm.

5. Performance Evaluation

In this section, we analyze the factors affecting the end-to-end delay in urban environments. Moreover, we specify the details of the simulation parameters, routing algorithm implementation, and simulation data processing. Finally, we analyze the simulation results to verify the impact of users’ social attributes on routing performance and verify the effectivity of our proposal in terms of end-to-end delay and packet loss rate.
While our current approach relies on theoretical assumptions and simulated environments, we have demonstrated the effectiveness of our model through detailed simulations that consider various real-world factors such as mobility patterns and traffic conditions. The simulations are designed to capture the dynamics of real-world systems while adhering to the theoretical foundations.

5.1. Simulation Setup and Algorithm Implementation

In CR-VANETs, the activity pattern of the PU is closely related to the availability of the channel, and the relationship between the SU vehicles will also have an impact on the link stability, as well as the availability probability of the channel and the quality and stability of the link, having an important impact on the end-to-end delay. In this paper, we assume that the density of vehicles is large enough and the vehicles have next-hop vehicles at any time. The SMED algorithm achieves the purpose of minimizing the end-to-end delay by considering the effects of the PU’s activity pattern, the relationship between SUs, and factors such as the road section and intersections of the urban environment.
Considering existing CR-VANETs routing studies rarely take into account the social attributes of users and the routing studies that distinguish between road sections and intersections, we choose the IDRA algorithm that considers intersection routing in the VANETs environment and the EPDMR algorithm for routing in the CR-VANETs environment to be compared with the algorithms in this paper. The IDRA algorithm utilizes an ant colony to determine the optimal route with low latency and robustness. It also employs a greedy transfer and forwarding mechanism to forward packets between two adjacent intersections, thereby minimizing the movement effect of individual vehicles on the routing path and pursuing overall latency minimization. The EPDMR algorithm is a routing algorithm based on the CR-VANET environment, which takes into account the social attributes of the PUs and aims to find a path with the maximum link available duration during data transmission by analyzing the activity patterns of the PUs.
Our SMED algorithm considers the effects of PU and SU vehicles’ social attributes on end-to-end delay simultaneously. The algorithm carries out channel selection through the active law of the PU, takes the channel with the lowest probability of the PU’s activity as the optimal channel, divides the vehicle environment into road sections and intersections, carries out the relay vehicle selection in the road sections with the similarity of the SU, selects the better road sections by the angle of the pinch, selects the optimal road sections with the probability of the stability of the links on the road sections, and carries out the optimal relay vehicle selection with the centrality of the SU vehicle, which is a multifaceted consideration to achieve the purpose of minimizing the end-to-end delay.
We simulate the urban road traffic situation and implement the routing algorithm based on the SVMU model defined in Section 3. A grid is used to plan the roads, a normal distribution is used to simulate the activities of the PUs, and an exponential distribution is used to simulate the use of the channel by the PUs. The channel becomes exclusive when a single PU occupies it. We adopt the road environment with a grid with specifications of 5 × 5 and a road length of 2 km, which consists of 25 intersections and 60 two-way dual-vehicle road segments, with the red and green light durations at the intersections being both 60 s. There are five available channels on each road segment, and the length of the data packet is 500 bytes. The active time of PUs on each channel follows an exponential distribution, and their arrival rate is 0.5 per second. The Mac layer utilizes the 802.11p routing protocol. We executed it 100 times to take its arithmetic mean for result analysis. The specific parameter settings are shown in Table 2.
In the process of routing algorithm implementation, six classes are designed respectively. Figure 5 displays the algorithm implementation class diagram. Here we utilize PU, Vehicle, Channel, Forwarders, TypeHeaders, and RoutingProtocol to represent the PU, SU vehicle, channel, forwarding set, packet header, and routing protocol, respectively.
In the PU class, we define the variable m_on, which represents the time when the PU occupies the channel, the attribute m_off, which represents the time when the PU does not occupy the channel, and m_inradius, which represents the interference radius of the PU. In addition, to represent the social attributes of the PU, we define the function PUActive() to represent the active pattern of the PU and the attribute m_rate to represent the probability of the PU occupying the channel.
In the Vehicle class, we define the attribute m_location to represent the geographic location of the SU vehicle, m_radium to represent the transmission radius of the SU vehicle, and in order to represent the social attributes between the vehicles, we define m_metric to represent the centrality metric weights defined by Equations (4)–(17) in this paper. Additionally, we define m_routingProtocal to represent the routing protocol class object. Furthermore, we define the function SpectrumSensing() for detecting idle channels in the network and the function SpectrumDecision() for channel decisions.
In the Channel class, we use the m_flag attribute to indicate whether the channel is in the available state or blocking state, and we also design the function PUComing() to detect the arrival rate of the PU.
In the Forwarders class, we define the attributes m_neighbors and m_canforwarders to represent the set of neighbor nodes and the set of forwarding nodes of the vehicle. Additionally, four functions GetSMEDIForwarders(), GetSMEDRForwarders(), GetIDRAForwarders(), and GetEPDMRForwarders() are defined in this paper. Among them, GetSMEDIForwarders() and GetSMEDRForwarders() are different ways for the SMED algorithm to obtain the set of forwarding vehicles, respectively. If the vehicle is in the road segment, the GetSMEDRForwarders() function is called to select the forwarding vehicle set; if the vehicle is at the intersection, the GetSMEDIForwarders() function is called for the forwarding vehicle set selection. GetIDRAForwarders() and GetEPDMRForwarders() then indicate forwarding vehicle set selection based on the metrics of the IDRA algorithm and the EPDMR algorithm, respectively.
In the TypeHeader class, we define the attribute m_source to represent the source node of the packet, m_destination to represent the destination vehicle node of the packet, m_forwarder to represent the set of candidates forwarding nodes for the packet, and m_type to represent the type of the packet, in addition to the corresponding read and write functions. Among them, the packet types contain five types: Hello, SMEDData, IDRAData, EPDMRData, and ACK. Specifically, Hello packets are mainly used to identify neighboring nodes; SMEDData, IDRAData, and EPDMRData denote packets forwarded through the three routing protocols of SMED, IDRA, and EPDMR, respectively; and ACK packets denote the receipt of acknowledgments.
In the RoutingProtocal class, we define a TypeHeader class object m_theader and a Forwarders class object m_forwarders. In addition to this, we also define SendHello(), RecvHello(), GetNeighbors(), SendData(), SendACK(), and RecvACK() functions. Among them, the SendHello() function and the RecvHello() function are used to send and receive Hello packets; the GetNeighbors() function is used to get the set of neighboring nodes; the SendData() function is used to send data; and the SendACK() function is used to send acknowledgment packets, i.e., ACK packets are sent when the node is the target vehicle of the packet. The RecvACK() function is used to receive the ACK packet, and the number of successful data packet transmissions can be obtained from the information in the packets.
Among them, the RecvHello() function calls the GetNeighbors() function in class Forwarders to get the set of neighboring nodes, and the SendData() function selects different routing algorithm protocols and a different set of candidate forwarding nodes based on different data types at the time of packet sending.

Simulation Data Processing

Due to the high cost of vehicles and on-board cognitive radio devices, it was not feasible to conduct experiments in real-world scenarios. Therefore, we referenced a large number of high-quality foreign papers and used MATLAB for simulation to model the algorithm. The hardware environment used in the experiments was an ASUS i7-1355U laptop, and the software environment was MATLAB version R2021b.
Due to the comparative analysis of the end-to-end delay and packet loss rate among the SMED algorithm, the EPDMR algorithm, and the IDRA algorithm in terms of three metrics: the number of PUs, the number of channels, and the number of SU vehicles, it is necessary to process the results of the three experiments. The calculation process of end-to-end delay is shown in Equations (4)–(11), and the calculation process of packet loss rate is the difference between the number of sent packets and the number of received packets divided by the number of sent packets, i.e., the ratio of lost packets to the total packets.
When the number of PUs gradually increases from 5 to 25, the end-to-end delay and packet loss rate of the three algorithms are recorded, respectively, and the step size of PU growth is set to 5, considering the PU growth probability problem and the ratio of the number of PUs to the number of channels. When the number of channels increases from 1 to 8, the end-to-end delay and packet loss rate of the three algorithms are recorded, respectively, and the step size of channel growth is set to 1, considering the limited number of channels and the probability problem of the channel changing from the blocking state to the available state. When the number of SU vehicles is increased from 20 to 100, the end-to-end delay and packet loss rate of the three algorithms are recorded, respectively, and the step size of SU vehicle growth is set to 20, considering the rapid change in topology due to the fast movement of vehicles and the rapid change in the number of vehicles. To ensure the accuracy of the results of the experiments, we executed the experiment 100 times, taking the arithmetic mean as the experimental results for analysis and comparison.

5.2. Simulation Results

We analyze the end-to-end delay and packet loss rate parameters among the SMED algorithm, the EPDMR algorithm, and the IDRA algorithm in terms of the number of PUs, the number of channels, and the number of SU vehicles. We calculate the end-to-end delay based on Equations (4)–(11) and calculate the packet loss rate by the difference between the number of sent packets and the number of received packets divided by the number of sent packets, i.e., the ratio of lost packets to the total packets.
Considering the PU growth probability and the ratio of the number of PUs to the number of channels, the step size of PU growth is set to 5. Considering the limited number of channels and the probability of the channel changing from the blocking state to the available state, the step size of channel growth is set to 1. Considering the rapid change in topology due to the fast movement of vehicles and the rapid change in the number of vehicles, the step size of SU vehicle growth is set to 20. Each experiment was executed 100 times, and the arithmetic mean was taken as the final result, which was analyzed and compared.

5.2.1. Performance with Different Numbers of PUs

In CR-VANETs, the activities of the PU introduce a huge uncertainty in the communication links between SUs, as the SU cannot interfere with the PU’s communication. When the number of PUs is small, the occupancy probability of channels by PUs decreases, at this time, the number of channels available for SU is large, and the interference probability of PUs to the communication between SU vehicles is small, so the waiting delay and packet loss rate will be small; when the number of PUs increases, on the one hand, the occupancy number of channels by PUs increases, the number of channels available for SU reduces, which increases the delay of SU’s waiting for the available channels, and on the other hand, in the communication process of SU, the probability of interruption caused by the PU to the SU’s link increases, and the number of interruptions increases, resulting in a larger waiting delay and packet loss rate. Thus, it can be seen that the number of PUs has a greater impact on the end-to-end delay and packet loss rate, so we select the number of PUs as an index to analyze the experimental results.
As shown in Figure 6a, the end-to-end delay of the three algorithms increases with the number of PUs. This paper’s SMED algorithm considers the interference probability between the PU and the SU during channel selection, resulting in a smaller end-to-end delay compared to the EPDMR and IDRA algorithms. The EPDMFR algorithm takes into account the activity patterns of the PU, and the end-to-end delay is smaller than the IDRA algorithm, but this algorithm does not take measures for the PU activity; it produces a larger end-to-end delay than the SMED algorithm in this paper. Overall, the SMED algorithm in this paper reduces the end-to-end delay by 24% and 48% in terms of the number of PU metrics compared to the EPDMR and IDRA algorithms, respectively.
As shown in Figure 6b, with the number of PUs increasing, the interference caused by the PU to the SU communication increases, so the packet loss rate of the three algorithms shows a growing trend. As the SMED algorithm in this paper and the EPDMR algorithm take into account the activity patterns of the PUs, the packet loss rate is smaller than the IDRA algorithm, and the EPDMR algorithm does not have the corresponding processing for the activity patterns of the PUs, so the packet loss rate is greater than the SMED algorithm. When the number of PUs is 10, the IDRA algorithm packet loss rate appears to increase dramatically, as the algorithm does not take into account the interference of PUs with SU communication and does not take any corresponding measures. At this time, the number of PUs is close to the number of channels, causing significant interference to the use of channels by SUs, resulting in a substantial increase in packet loss rate. Overall, the SMED algorithm in this paper reduces the packet loss rate by 21.9% and 31.2% in the number of PU metrics compared to the EPDMR algorithm and the IDRA algorithm, respectively.
An important observation is that, in Figure 6b, there appears to be an anomaly in the packet loss rate curve between 15 and 20 PUs. Specifically, the red line (SMED) remains relatively stable between 15 and 20 primary users, while the green line (EPDMR) continues to increase between 15 and 20 primary users. This phenomenon of stability may be related to algorithmic parameters (such as interference handling and channel selection) and system settings (such as the relative proportion between primary and secondary users). In addition, the EPDMR algorithm lacks sufficient adaptability when faced with an increasing number of primary users, leading to performance degradation as interference rises, particularly once the number of primary users reaches a certain threshold.

5.2.2. Performance with Different Numbers of Channels

The number of channels has a huge impact on the performance of end-to-end communication. In the case of a fixed number of PUs, if the number of channels is small, the number of available channels for SU is limited, and the probability of interference from PU to SU communication increases, resulting in larger waiting delays and packet loss rates; while the number of channels increases, the number of available channels for SU also increases, and the waiting delay and packet loss rate decrease. When the number of channels is sufficient, the end-to-end delay tends to a stable state. It can be concluded that the number of channels has a large impact on the end-to-end delay and packet loss rate, so we select the number of channels as an indicator to analyze the experimental results.
As shown in Figure 7a, when the number of channels increases, the end-to-end delay generated by the SMED algorithm, EPDMR algorithm, and IDRA algorithm decreases as the PU’s occupancy of the channel and the interference to the SU’s communication decrease, but the SMED algorithm in this paper is always in the state of smaller delay. For example, when the number of channels increases, the delay of the IDRA algorithm is about 15% higher than the SMED algorithm, while the EPDMR algorithm performs similarly to this paper. The IDRA algorithm does not take into account the fast-changing characteristics of the topology and has a larger end-to-end delay and packet loss rate. The EPDMR algorithm always seeks the channel section with the longest duration for data transmission, resulting in a smaller end-to-end delay than the IDRA algorithm. However, this algorithm relies on the assumption of sufficient and high-quality channels, which leads to a larger delay when the number of channels is small and a smoother change when there are four channels. The EPDMR algorithm develops the routing scheme in advance and cannot update the information according to the latest situation, while the SMED algorithm in this paper dynamically considers the communication quality of the road section during the data transmission process, which not only reduces the waiting delay for the available channel but also ensures timely information, so the end-to-end delay produced by the SMED algorithm is less than the EPDMR algorithm. Overall, when the number of channels increases to a certain number, the end-to-end delay produced by the three algorithms tends to level off, and the change is small, such as when the number of channels increases from 5 to 8 in the process; at this time, the number of channels is sufficient, and the end-to-end delay produced by the three algorithms tends to stabilize. Compared with the EPDMR algorithm and IDRA algorithm, the SMED algorithm in this paper reduces the end-to-end delay by 4.9% and 15.8% in the number of channels metric, respectively.
As shown in Figure 7b, when the number of channels is small, the PU causes significant interference to SU communication, resulting in a larger packet loss rate, and with the increasing number of channels, the packet loss rate of all three algorithms decreases. The SMED algorithm in this paper tends to select friend vehicles when relay vehicle selection is performed, and since the link stability between friend vehicles is stronger, the SMED algorithm in this paper is at the level of minimum packet loss rate in general. The IDRA algorithm exhibits a higher packet loss rate because it fails to account for rapid topology changes and channel quality issues. The EPDMR algorithm is based on the assumption that the number of channels is sufficient and the quality of the channel is good, and hence the packet loss rate is larger when the number of channels is small. When the number of channels is 4, the number of channels and the number of PUs are closer, the interference is reduced, and the decrease in packet loss rate for the EPDMR algorithm and IDRA algorithm increases, but this is not the optimal balance point for the number of channels and the number of PUs, so the packet loss rate of the IDRA algorithm is smaller than the EPDMR algorithm. But when the number of channels increases to 5, the number of channels and the number of PUs tend to be balanced, and the packet loss rate begins to decline significantly. After the number of channels increases to 6, the packet loss rate of the EPDMR algorithm is less than the SMED algorithm in this paper. The reason is that when the EPDMR algorithm performs channel selection, it always selects the channel with the longest duration, while the SMED algorithm selects the channel with the smallest active probability of the PU, so when the number of channels is sufficient and the quality is good, the packet loss rate of the EPDMR algorithm is less than the SMED algorithm. Overall, compared to the EPDMR algorithm and the IDRA algorithm, the SMED algorithm in this paper reduces the packet loss rate by 26.9% and 31.8 in the number of channels metric, respectively.
An important observation is that, in Figure 7b, there appears to be an anomaly in the packet loss rate curve, where the red line (representing the SMED algorithm) flattens out between 3 and 8 channels, and where the green (EPDMR) and black (IDRA) lines intersect at 3.5 and 5 channels. The SMED algorithm may exhibit less sensitivity to additional channels once a certain threshold is reached, which results in a flattened performance curve. In contrast, the EPDMR and IDRA algorithms, which may have been designed to handle interference or channel switching differently, show more dynamic changes as the number of channels increases. While the experimental setup was designed to minimize external biases (with 100 trials to calculate the arithmetic mean), fluctuations in network dynamics, such as real-time channel quality, traffic fluctuations, or system overhead, may introduce errors. These variations may not be perfectly modeled, leading to slight discrepancies in the results. For example, the green and black curves intersecting at different points (3.5 and 5 channels) may reflect minor inconsistencies or delays in the system’s response to changes in the environment that are not fully captured by the simulation model. Thus, these discrepancies are not necessarily errors in the algorithm itself but may stem from the network’s dynamic conditions.

5.2.3. Performance with Different Numbers of Vehicles

When the number of SU vehicles is small, although the occupancy demand of the channel becomes smaller, no neighboring vehicles or a small number of neighboring vehicles will generate additional waiting delay; when the number of vehicles is large, on the one hand, the vehicle currently carrying the packet has sufficient neighboring vehicles, which reduces the waiting delay for the neighboring vehicles to a certain extent, but on the other hand, the increase in the number of vehicles causes each tree node to record more information and the spectrum routing requests between different spectrum trees lead to high cost, so the increase in the number of vehicles implies a more complex spectrum tree. Thus, it can be concluded that the number of SU vehicles has a large impact on the end-to-end delay and packet loss rate, and in this paper, the number of vehicle indicators is selected to analyze the experimental results.
As shown in Figure 8a, with the increase in the number of vehicles, the end-to-end delay of the three algorithms all shows a decreasing trend. The SMED algorithm in this paper is based on the assumption that the number of vehicles is sufficient and the vehicles have the available next hop at any time to carry out the study of the most minimization of the end-to-end delay, and there is no treatment of the vehicle without the next hop situation; therefore, when the number of vehicles is smaller, the SMED algorithm has a larger end-to-end delay than the EPDMR algorithm, such as when the number of vehicles is between 20 and 40, the SMED algorithm is higher than EPFMR. But when the number of vehicles is increased to 40, the end-to-end delay generated by the SMED algorithm decreases rapidly. Overall, the SMED algorithm in this paper reduces the end-to-end delay by 6.2% and 11.3% in the number of vehicles metric compared to the EPDMR and IDRA algorithms, respectively.
As shown in Figure 8b, the packet loss rate of all three algorithms becomes larger with the increase in the number of vehicles because the increase in the number of vehicles leads to the complexity of spectrum usage among vehicles. The SMED algorithm in this paper has the smallest packet loss rate by considering the social attributes of vehicles when performing relay selection and tending to select friend vehicles and vehicles with greater centrality. In contrast, the EPDMR algorithm and IDRA algorithm have a larger packet loss rate as they do not consider the social attributes of vehicles, and the difference between the two is smaller. The EPDMR algorithm carries out path planning in advance each time to ensure the channel quality, so the packet loss rate is smaller than the IDRA algorithm. Overall, the SMED algorithm in this paper reduces the packet loss rate by 25.8% and 34.5% in the number of vehicles metric compared to the EPDMR and IDRA algorithms, respectively.
An important observation is that, in Figure 8a, the red line (representing the SMED algorithm) closely overlaps with the black line (representing the IDRA algorithm) at around 40 vehicles and deviates significantly from the green line (representing the EPDMR algorithm) and where the lines intersect at around 46 vehicles and display different rates of decrease between 60 and 80 vehicles. The phenomenon can be attributed to several potential causes, both related to parameter sensitivity and experimental errors. SMED may be more sensitive to the dynamics of increasing vehicle density and efficiently manages resource allocation, leading to a faster packet loss rate reduction compared to IDRA. The green line (EPDMR) exhibits a different behavior, which may be due to how each algorithm accounts for interference, vehicle mobility, and routing decisions under increasing load. The SMED algorithm might manage traffic more efficiently, leading to a more noticeable drop in delay, whereas the IDRA algorithm shows a more gradual decrease. This could be due to SMED’s optimization in handling interference and vehicle-to-vehicle communication more effectively under denser network conditions. While the experiments were conducted with the aim to minimize error by executing the simulations 100 times, factors such as dynamic interference patterns, small fluctuations in vehicle mobility, or network conditions during the simulations might cause slight variations in the observed results. Thus, these errors could explain why certain intersections between the curves occur (e.g., red and green at 46 vehicles), indicating that the system is highly sensitive to certain parameters that may not have been perfectly controlled in the simulation.
In summary, when selecting the direction of intersections and relay vehicles, the SMED algorithm utilizes the active behavior of PUs and the characteristics of centrality, similarity, and friendship of SUs to ensure the stability of the selected links and the reliability of packet transmission. We compare the end-to-end delay and packet loss rates in terms of the number of PUs, the number of SUs, and the number of channels. We analyzed and validated the effectiveness of the SMED algorithm by comparing experimental results.

6. Conclusions

To solve the end-to-end delays caused by unstable links in CR-VANETs, we analyzed the factors that caused delays within road segments and at intersections in urban environments based on the characteristics of urban roads, user social attributes, and network features. We analyzed the metrics and measurements for channel selection, road intersection direction selection, road segment selection, and relay vehicle selection in the process of vehicle forwarding data packets in urban scenarios. We formulated the end-to-end delay calculation, established the objective and constraint function, and proposed the SMED routing algorithm to solve the problem of the end-to-end delay minimization. We simulated and analyzed the SMED routing algorithm with CR-VANETs routing algorithms EPDMR and IDRA and compared the improvement of routing performance by considering social attributes. We simulated end-to-end latency and packet loss rate performances with different numbers of PUs, SUs, and channels. The SMED routing algorithm improved end-to-end delay by an average of 11.7% compared to EPDMR and 25.0% compared to IDRA and improved packet loss rate by an average of 24.9% compared to EPDMR and 32.5% compared to IDRA. The simulation results have verified the effectiveness of our study. In our future work, we may consider the resilience of the proposed approach under cyberattacks, such as packet loss due to denial-of-service (DoS) attacks [47].

Author Contributions

Conceptualization, J.W. and H.L.; methodology, J.W. and A.M.; software, W.D. and A.M.; validation, H.L. and L.Y.; formal analysis, X.T. and A.M.; writing—original draft preparation, J.W. and W.D.; writing—review and editing, J.W.; funding acquisition, J.W., L.Y. and X.T. All authors have read and agreed to the published version of the manuscript.

Funding

This research is funded by the National Natural Science Foundation of China (No. 62302155, No. 62472149 and No. 62272356), the Natural Science Foundation of Chongqing (CSTB2022NSCQ-MSX1414), the Higher Educational Teaching Research Project of Hubei (No. 2022296), and the Doctoral Scientific Research Project of Hubei University of Technology (No. BSQD2020062).

Data Availability Statement

The data presented in this study are available on request from the corresponding author.

Conflicts of Interest

The authors declare no conflicts of interest.

References

  1. Zhao, J.; Gai, X.; Luo, X. Performance comparison of vehicle networking based on DSRC and LTE technology. In International Conference on Intelligent Transportation Engineering; Springer Nature: Singapore, 2021. [Google Scholar]
  2. Khalek, N.A.; Tashman, D.H.; Hamouda, W. Advances in Machine Learning-Driven Cognitive Radio for Wireless Networks: A Survey. IEEE Commun. Surv. Tutor. 2023, 26, 1201–1237. [Google Scholar] [CrossRef]
  3. Duan, W.; Tang, X.; Zhou, J.; Wang, J.; Zhou, G. Load balancing opportunistic routing for cognitive radio ad hoc networks. Wirel. Commun. Mob. Comput. 2018, 2018, 9412782. [Google Scholar] [CrossRef]
  4. Sun, R.; Huang, Y.; Zhu, L. Communication by credence: Trust communication in vehicular Ad Hoc networks. Mob. Netw. Appl. 2022, 27, 510–522. [Google Scholar] [CrossRef]
  5. Abdelkader, G.; Elgazzar, K.; Khamis, A. Connected vehicles: Technology review, state of the art, challenges and opportunities. Sensors 2021, 21, 7712. [Google Scholar] [CrossRef]
  6. Jiang, Q.; Tang, X.; Wang, J. QoS-Aware Route Navigation for Pedestrians Using 5G Cellular Networks. In Proceedings of the 2024 IEEE 35th International Symposium on Personal, Indoor and Mobile Radio Communications (PIMRC), Valencia, Spain, 2–5 September 2024; pp. 1–6. [Google Scholar] [CrossRef]
  7. Pari, D.; Natarajan, J. Secure spectrum access, routing, and hybrid beamforming in an edge-enabled mmwave massive MIMO CRN-based internet of connected vehicle (IoCV) environments. Sensors 2022, 22, 5647. [Google Scholar] [CrossRef]
  8. Sangi, A.R.; Alkatheiri, M.S.; Anamalamudi, S.; Alqarni, M.A.; Memon, M.H.; Yang, W. Spectrum handoff aware aodv routing protocol for cognitive radio vehicular ad hoc networks. Complexity 2021, 2021, 6981719. [Google Scholar] [CrossRef]
  9. Srivastava, A.; Prakash, A.; Tripathi, R. QoS aware stochastic relaxation approach in multichannel CR-VANET: A junction-centric geographic routing protocol. J. Ambient. Intell. Humaniz. Comput. 2023, 14, 11103–11121. [Google Scholar] [CrossRef]
  10. Al-Absi, M.A.; Al-Absi, A.A.; Sain, M.; Lee, H. Moving ad hoc networks—A comparative study. Sustainability 2021, 13, 6187. [Google Scholar] [CrossRef]
  11. Ali, R.; Liu, R.; Nayyar, A.; Waris, I.; Li, L.; Shah, M.A. Intelligent driver model-based vehicular ad hoc network communication in real-time using 5G new radio wireless networks. IEEE Access 2023, 11, 4956–4971. [Google Scholar] [CrossRef]
  12. Wang, X.; You, X. Social attributes based information-centric vehicular cloud data delivery framework. IEEE Internet Things J. 2024, 11, 31180–31189. [Google Scholar] [CrossRef]
  13. Yao, L.; Wang, Y.; Wang, X.; Wu, G. Cooperative caching in vehicular content centric network based on social attributes and mobility. IEEE Trans. Mob. Comput. 2019, 20, 391–402. [Google Scholar] [CrossRef]
  14. Zhu, Y.; Xu, B.; Shi, X.; Wang, Y. A survey of social-based routing in delay tolerant networks: Positive and negative social effects. IEEE Commun. Surv. Tutor. 2012, 15, 387–401. [Google Scholar] [CrossRef]
  15. Ishfaq, U.; Khan, H.U.; Iqbal, S. Identifying the influential nodes in complex social networks using centrality-based approach. J. King Saud Univ.-Comput. Inf. Sci. 2022, 34, 9376–9392. [Google Scholar] [CrossRef]
  16. Jing, T.; Zhou, J.; Liu, H.; Zhang, Z.; Huo, Y. SoRoute: A reliable and effective social-based routing in cognitive radio ad hoc networks. EURASIP J. Wirel. Commun. Netw. 2014, 2014, 200. [Google Scholar] [CrossRef]
  17. Lu, J.; Cai, Z.; Wang, X.; Zhang, L.; Li, P.; He, Z. User social activity-based routing for cognitive radio networks. Pers. Ubiquitous Comput. 2018, 22, 471–487. [Google Scholar] [CrossRef]
  18. Zhang, L.; Cai, Z.; Li, P.; Wang, L.; Wang, X. Spectrum-availability based routing for cognitive sensor networks. IEEE Access 2017, 5, 4448–4457. [Google Scholar] [CrossRef]
  19. Yang, J.; Ma, C.; Man, J.; Xu, H.; Zheng, G.; Song, H. Cache-enabled in cooperative cognitive radio networks for transmission performance. Tsinghua Sci. Technol. 2019, 25, 1–11. [Google Scholar] [CrossRef]
  20. Petrov, T.; Finkelberg, I.; Počta, P.; Buzna, Ľ.; Zarkhin, N.; Gal-Tzur, A.; Toledo, T. An analytical approach to the estimation of vehicular communication reliability for intersection control applications. Veh. Commun. 2024, 45, 100693. [Google Scholar] [CrossRef]
  21. Gatate, V.; Agarkhed, J. Routing based on spectrum quality and availability in wireless cognitive radio sensor networks. In International Conference on Innovative Computing and Communications: Proceedings of ICICC 2021, Delhi, India, 20–21 February 2021; Springer: Singapore, 2022; Volume 1, pp. 497–508. [Google Scholar]
  22. Khokhar, R.H.; Md Noor, R.; Ghafoor, K.Z.; Ke, C.H.; Ngadi, M.A. Fuzzy-assisted social-based routing for urban vehicular environments. EURASIP J. Wirel. Commun. Netw. 2011, 2011, 178. [Google Scholar] [CrossRef]
  23. Song, Y.; Li, J.; Li, C.; Wang, F. Social popularity based routing in delay tolerant networks. Int. J. Smart Sens. Intell. Syst. 2016, 9, 1687–1709. [Google Scholar] [CrossRef]
  24. Le, T.; Kalantarian, H.; Gerla, M. A novel social contact graph-based routing strategy for workload and throughput fairness in delay tolerant networks. Wirel. Commun. Mob. Comput. 2016, 16, 1352–1362. [Google Scholar] [CrossRef]
  25. Kerrache, C.A.; Lagraa, N.; Benslimane, A.; Calafate, C.T.; Cano, J.C. On the human factor consideration for VANETs security based on social networks. In Proceedings of the 2018 IEEE International Conference on Communications (ICC), Kansas City, MO, USA, 20–24 May 2018; pp. 1–6. [Google Scholar]
  26. Kerrache, C.A.; Lagraa, N.; Hussain, R.; Ahmed, S.H.; Benslimane, A.; Calafate, C.T.; Vegni, A.M. TACASHI: Trust-aware communication architecture for social internet of vehicles. IEEE Internet Things J. 2018, 6, 5870–5877. [Google Scholar] [CrossRef]
  27. Tang, X.; Zhou, J.; Xiong, S.; Wang, J.; Zhou, K. Geographic segmented opportunistic routing in cognitive radio ad hoc networks using network coding. IEEE Access 2018, 6, 62766–62783. [Google Scholar] [CrossRef]
  28. Wang, J.; Zhang, H.; Tang, X.; Hao, S. Social-aware routing for cognitive radio–based vehicular ad hoc networks. Int. J. Distrib. Sens. Netw. 2019, 15, 1550147719866389. [Google Scholar] [CrossRef]
  29. Priyadharshini, A.; Sundarambal, M. Cognitive radio based vehicular sensor network using optimal tree routing protocol. Wirel. Pers. Commun. 2020, 110, 2237–2252. [Google Scholar] [CrossRef]
  30. Smida, E.B.; Fantar, S.G.; Youssef, H. Link efficiency and quality of experience aware routing protocol to improve video streaming in urban VANETs. Int. J. Commun. Syst. 2020, 33, e4209. [Google Scholar] [CrossRef]
  31. Shen, R.; Wang, X.; Xu, Y. Weighted sum-rate maximized power allocation in downlink MIMO-NOMA systems. In Proceedings of the 2019 IEEE 19th International Conference on Communication Technology (ICCT), Xi’an, China, 16–19 October 2019; pp. 679–684. [Google Scholar]
  32. Wang, J.; Zhang, H.; Tang, X.; Li, Z. Delay-tolerant routing and message scheduling for CR-VANETs. Future Gener. Comput. Syst. 2020, 110, 291–309. [Google Scholar] [CrossRef]
  33. Wang, J.; Zhang, H.; Hao, S.; Fu, C. An urban expressway forwarding scheme for cognitive Internet of vehicles. Int. J. Distrib. Sens. Netw. 2020, 16, 1550147720912947. [Google Scholar] [CrossRef]
  34. Lee, S.; Lee, S.H.; Lee, H. Timely directional data delivery to multiple destinations through relay population control in vehicular ad hoc network. Int. J. Distrib. Sens. Netw. 2020, 16, 1550147720907829. [Google Scholar] [CrossRef]
  35. Veena, R.C.; Dayanand, L.; Brahmananda, S.H.; Sahana, D.S.; Mala, B.M. A cooperative vehicle intelligence for smart transport services. Int. J. Adv. Trends Comput. Sci. Eng. 2020, 9, 195922020. [Google Scholar] [CrossRef]
  36. Singh, A.K.; Pamula, R. An efficient and intelligent routing strategy for vehicular delay tolerant networks: An efficient routing strategy for VDTN. Wirel. Netw. 2021, 27, 383–400. [Google Scholar] [CrossRef]
  37. Awe, O.P.; Babatunde, D.A.; Lambotharan, S.; AsSadhan, B. Second order Kalman filtering channel estimation and machine learning methods for spectrum sensing in cognitive radio networks. Wirel. Netw. 2021, 27, 3273–3286. [Google Scholar] [CrossRef]
  38. Reddy, C.S.; Subramanyam, M.V.; Reddy, P.R. Hybrid strategy for reliable packet transfer and packet loss reduction in cognitive radio Ad-Hoc Network. Int. J. Adv. Technol. Eng. Explor. 2021, 8, 1524. [Google Scholar] [CrossRef]
  39. Zhang, Z.; Sun, S.; Liu, M.; Li, Z.; Zhang, Q. Rendezvous Delay-Aware Multi-Hop Routing Protocol for Cognitive Radio Networks. In Proceedings of the 2022 18th International Conference on Mobility, Sensing and Networking (MSN), Guangzhou, China, 14–16 December 2022; pp. 28–35. [Google Scholar]
  40. Chen, G.; Zhu, H.; Xu, Y.; Song, T.; Hu, J. A Novel Joint Spectrum Sensing and Resource Allocation Scheme in Cognitive Internet of Vehicles Networks. IEEE Trans. Veh. Technol. 2024, 73, 13412–13424. [Google Scholar] [CrossRef]
  41. Patel, D.K.; Kavaiya, S.; Ding, Z.; Guan, Y.L.; Sun, S. Impact of primary user activity statistics in cognitive vehicular networks. IEEE Trans. Veh. Technol. 2021, 71, 2859–2873. [Google Scholar] [CrossRef]
  42. Wang, J.; Mei, A.; Tang, X.; Shi, B. Social-Based Link Reliability Prediction Model for CR-VANETs. In Wireless Algorithms, Systems, and Applications: 16th International Conference, WASA 2021, Nanjing, China, 25–27 June 2021; Proceedings, Part I 16; Springer: Cham, Switzerland, 2021; pp. 376–388. [Google Scholar]
  43. McNett, M.; Voelker, G.M. Access and mobility of wireless PDA users. ACM SIGMOBILE Mob. Comput. Commun. Rev. 2005, 9, 40–55. [Google Scholar] [CrossRef]
  44. Granovetter, M. The strength of weak ties: A network theory revisited. Sociological theory 1983, 1, 201–233. [Google Scholar] [CrossRef]
  45. Shiang, H.P.; Van der Schaar, M. Distributed resource management in multihop cognitive radio networks for delay-sensitive transmission. IEEE Trans. Veh. Technol. 2008, 58, 941–953. [Google Scholar] [CrossRef]
  46. Li, G.; Boukhatem, L. An intersection-based delay sensitive routing for VANETs using ACO algorithm. In Proceedings of the 2014 23rd International Conference on Computer Communication and Networks (ICCCN), Shanghai, China, 4–7 August 2014; pp. 1–8. [Google Scholar]
  47. Caviglia, R.; Gaggero, G.; Portomauro, G.; Patrone, F.; Marchese, M. An SDRBased Cybersecurity Verification Framework for Smart Agricultural Machines. IEEE Access 2023, 11, 54210–54220. [Google Scholar] [CrossRef]
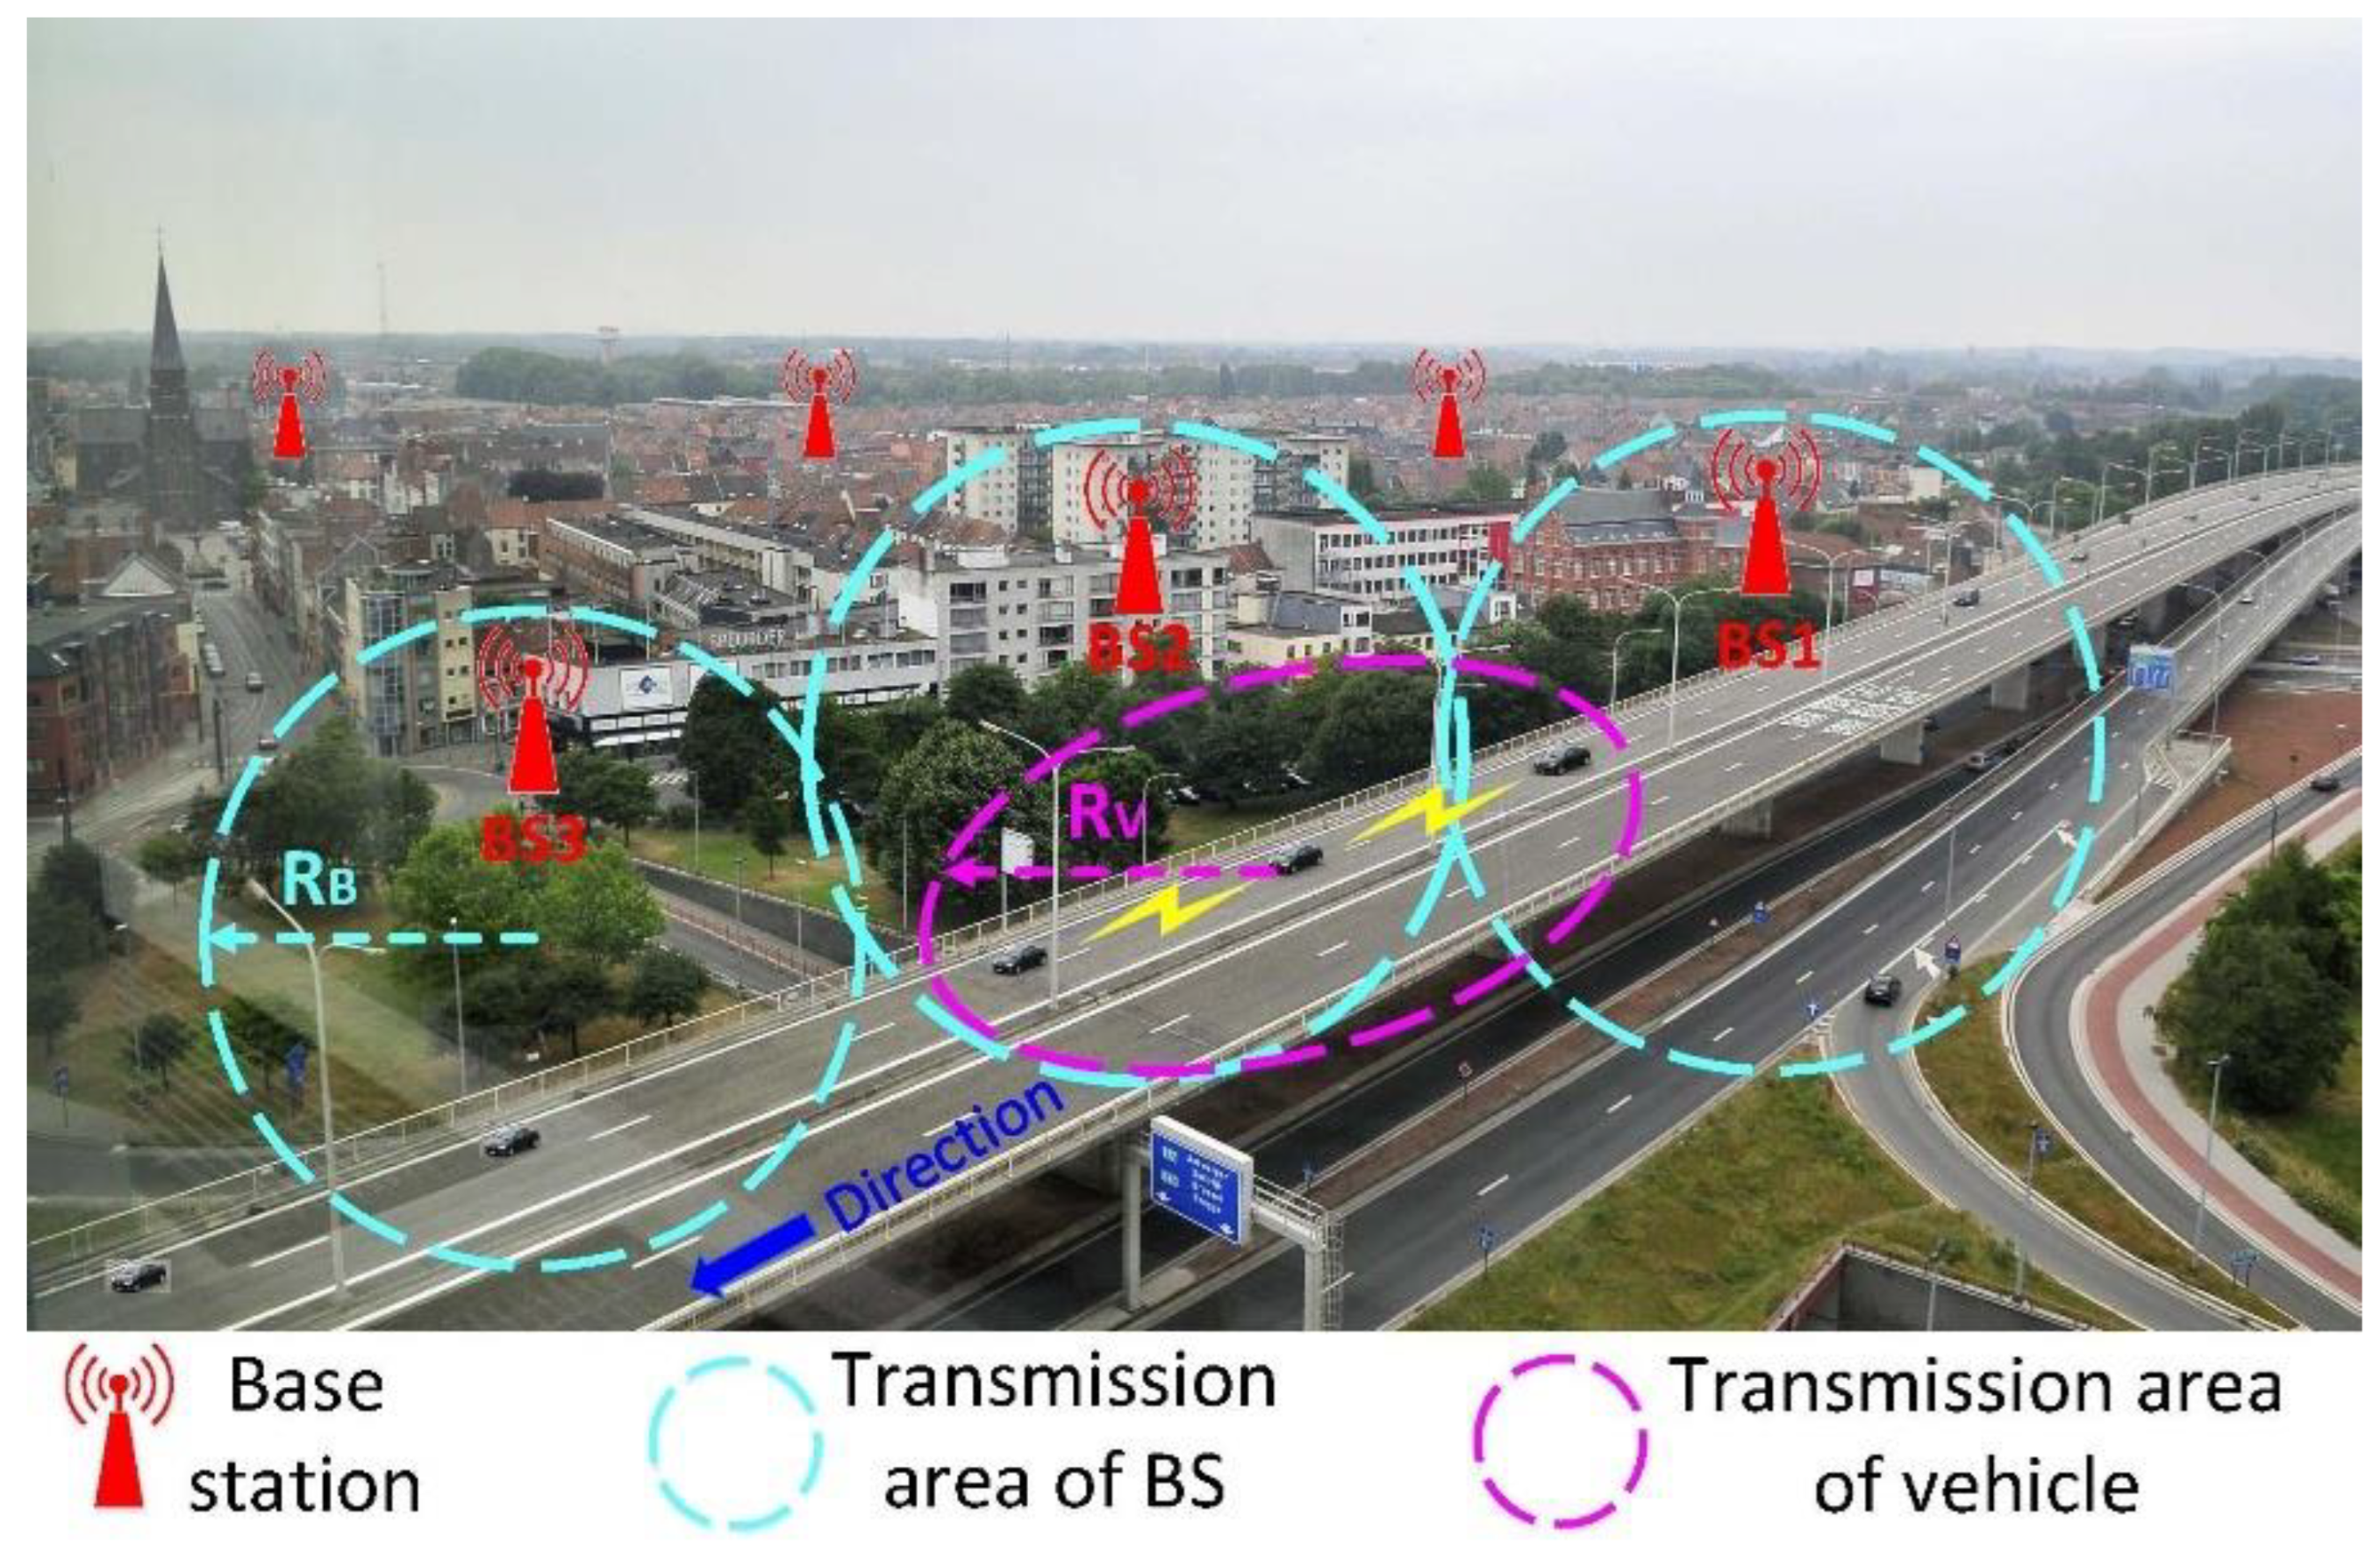
Figure 1. A typical scenario of CR-VANETs.
Electronics 14 00627 g001
Figure 2. Scenario 1 forwarding vehicle layout.
Electronics 14 00627 g002
Figure 3. Scenario 2 forwarding vehicle layout.
Electronics 14 00627 g003
Figure 4. Indicators for roadway intersection orientation options.
Electronics 14 00627 g004
Figure 5. Algorithm implementation class diagram.
Electronics 14 00627 g005
Figure 6. Change in algorithm performance due to the number of primary users.
Electronics 14 00627 g006
Figure 7. Change in algorithm performance due to the number of channels.
Electronics 14 00627 g007
Figure 8. Change in algorithm performance due to number of vehicles.
Electronics 14 00627 g008
Table 1. Symbols.
Table 1. Symbols.
SymbolMeaningSymbolMeaning
GNumber of parallel roadsONumber of road intersections
HNumber of road segmentseLength of road segments
fWidth of the roadμExpectation of the normal distribution
σVariance of the normal distributionf(x)Probability density function
F(x)Cumulative density functionp(t1, t2)Probability that the primary user is active from t1 to t2
p′(t)Probability that the primary user is active in the t-th time slotq(t1, t2)Probability that there is no available channel from t1 to t2
fᵢⱼFrequency of encounters between vehicle i and vehicle jtᵢⱼEncounter time between vehicle i and vehicle j
sim(Vᵢ, Vⱼ)Similarity between vehicle i and vehicle jd(i)Degree centrality of vehicle i
VSet of all vehicle nodesFₗᵢSet of friends of vehicle i
KNumber of friend vehicles of vehicle iDNumber of neighbor vehicle nodes of vehicle i
εWeight of a friend linkαWeight of a normal link
lᵢⱼLink between vehicle i and vehicle jbc(j)Betweenness centrality of vehicle j
ωⱼₖNumber of shortest paths from vehicle j to vehicle ksⁿBase number of vehicles
NNumber of primary usersMNumber of secondary users
CTotal number of channelscᵢThe i-th channel
ΨSet of all channelsPᵢThe i-th primary user
VᵢThe i-th secondary user vehicleSᵢThe i-th base station
RₚPrimary user transmission radiusρᵥSecondary user transmission radius
θᵢⱼAvailability of the link from vehicle i to vehicle jdᵢⱼEuclidean distance between vehicle i and vehicle j
NᵢSet of neighbor nodes of vehicle iT_busyTime the primary user occupies the channel
d_densityDensity of vehiclesTTotal number of time slots
T_idleTime the primary user does not occupy the channeleᵢEdge between vehicle i and vehicle j
rᵢⱼ(t)Probability that the link between vehicle i and vehicle j is not interrupted at time tYᵢⱼ(t)Probability that the link between vehicle i and vehicle j does not suffer physical interruptions at time t
IᵖᵏProbability that the primary user does not interfere at time kIᵗᵢ(t)Probability that no cognitive interference occurs in the t-th time slot
pᵥ(t1, t2)Probability that the link remains stable from t1 to t2E_errorError rate in primary user activity prediction
m(i)Secondary user attribute measureE′_errorError rate in link stability prediction
EₚActual value of link stability predictionEₑPredicted value of link stability
ETTTransmission time per hop on a linkdᵢWaiting time for an available channel
rPacket transmission ratepPacket error rate per channel
rᵢⱼ(t)Probability of link stability between vehicle i and vehicle jEExpected delay in the road segment
Tct_wWaiting time for an available channeltᵢTime the hop starts
Tᵣ_hopDelay of one hop in a road segmenthᵩNumber of hops in a road segment
E(Tᵣ_road)Expected delay in a road segmentdᵣNumber of road segments
Tᵣ_roadExpected delay in a road segmentTᵣ_redRemaining red light time at the current moment
E(Tᵣ_road)Expected delay in a road segmentχVehicle speed
VₛVehicle weightV_dTarget vehicle
C_listSet of road segments selected from source vehicle to target vehicleΦSet of road intersection segments selected for routing
WSet of angles between the road segment and target vehicle
Table 2. Simulation parameters.
ParametersRetrieve a Value
Number of PUs[5, 25]
Number of SUs[20, 100]
vehicle speed50 km/h
Number of channels[1, 8]
PUs’ arrival rate0.5/s
Channel time occupied by PUs 0.3 s
Number of roads5
Road length2 km
Red light time60 s
Green light time60 s
Vehicle transfer radius200 m
PUs’ interference radius250 m
MAC layer protocol802.11p
Disclaimer/Publisher’s Note: The statements, opinions and data contained in all publications are solely those of the individual author(s) and contributor(s) and not of MDPI and/or the editor(s). MDPI and/or the editor(s) disclaim responsibility for any injury to people or property resulting from any ideas, methods, instructions or products referred to in the content.