Article

Research on Predictive Maintenance Methods for Current Transformers with Iron Core Structures

1
Xiaogan Power Supply Company, State Grid Hubei Electric Power Co., Ltd., Xiaogan 432000, China
2
School of Computer Science and Engineering, Central South University, Changsha 410083, China
3
School of Electronics Information, Central South University, Changsha 410083, China
*
Author to whom correspondence should be addressed.
Electronics 2025, 14(3), 625; https://doi.org/10.3390/electronics14030625
Submission received: 31 December 2024 / Revised: 17 January 2025 / Accepted: 28 January 2025 / Published: 5 February 2025

Abstract

:
The reliable operation of power systems is heavily dependent on effective maintenance strategies for critical equipment. Current maintenance methods are typically categorized into corrective, preventive, and predictive approaches. While corrective maintenance often results in significant downtime and preventive maintenance can be inefficient, predictive maintenance emerges as a promising technique for accurately forecasting faults. In this study, we investigated the diagnosis and prediction of fault states, specifically single-phase short circuit (1HCF) and double-phase short circuit (2HCF) faults, using monitoring data from current transformers in 110 kV substations. We proposed a predictive maintenance method for current transformers based on core-type structures, which integrates wavelet transform to extract multi-level frequency domain features, employs feature selection techniques (including the Spearman correlation coefficient and mutual information) to identify key predictive features, and utilizes Random Forest classifiers for fault state prediction. Experimental results demonstrate an overall prediction accuracy of 94%.

1. Introduction

In industrial environments, the proper maintenance of industrial equipment is essential for keeping production systems in optimal condition, thereby ensuring the stability of the production process. This is particularly significant for certain production sectors, such as the power industry. Although equipment failures are infrequent, power outages resulting from equipment malfunctions can lead to significant revenue losses. Such failures during peak demand periods can lead to significant consequences. Moreover, for industries reliant on electrical power—such as manufacturing, telecommunications, and data centers—operational interruptions can significantly disrupt production or services. This reduction in productivity can impede operations across multiple industrial sectors. Consequently, safety assurance and maintenance personnel in the power industry utilize a variety of methods to ensure the proper functioning of electrical equipment. To date, numerous relevant studies have emerged, encompassing a wide array of traditional solutions, engineering techniques, and advanced analytical technologies based on artificial intelligence [1].
Some studies [2,3,4,5] have categorized maintenance strategies according to the temporal relationship between the execution of maintenance and the occurrence of failures. There are three primary maintenance approaches: corrective maintenance, preventive maintenance, and predictive maintenance. Corrective maintenance entails the implementation of remedial measures following a failure. While this method incurs the lowest equipment maintenance costs and extends maintenance intervals, it also increases the risk of increased equipment unavailability. Post-failure maintenance shutdowns lead to revenue losses and decreased social production efficiency. Preventive maintenance seeks to prevent unexpected shutdowns by conducting regular inspections and replacements. This approach ensures that the equipment remains in optimal condition and minimizes the risk of potential downtime. However, its limitations include the necessity for maintenance planning and increased costs, which may result in excessive maintenance in certain situations. In predictive maintenance, repairs are performed as necessary, usually just before anticipated failures occur. The essence of this method lies in predicting the health status of machines through repetitive analysis of known characteristics. The application of this technology minimizes both planned and unplanned downtime, offering a more balanced approach. The key equipment for current transformers traditionally relies on maintenance methods that primarily involve regular inspections and replacements following failures. Ricardo Manuel et al. [6] noted that insulation contamination and creepage distances should be routinely checked to prevent current transformer failures. Zhiwu Wu et al. [7] proposed a maintenance strategy for current transformers that includes implementing preventive measures based on an analysis of each component. This strategy emphasizes ensuring the integrity of the coil insulation and maintaining adequate insulation distances during installation, as well as conducting regular inspections of the insulation layer, coils, and connection terminals. Additionally, they suggested utilizing a fault diagnosis expert system to identify fault types based on real-time monitoring data and reasoning rules, enabling the provision of appropriate remedial measures. Alok Gupta et al. [8] also indicated that, in the event of multiple faults, once a current transformer fault is detected, it should be replaced with spare parts from stock to address the immediate problem. They further recommended taking preventive measures to enhance the mechanical structure of the current transformer.
In recent years, the advancement of industrial wireless sensor networks has significantly enhanced data acquisition technology in our industrial production environments. Taking a domestic substation in China as an example, various sensors have been gradually implemented to achieve high reliability in real-time mechanical data collection, partially replacing manual periodic shutdown inspections. With the ongoing advancement of data acquisition capabilities, the implementation of data-driven predictive maintenance methods for substations has become increasingly feasible. Currently, an increasing amount of research is focused on predictive maintenance. For instance, Alexandra I. Khalyasmaa et al. [9] collected various technical diagnostic data from current transformers and employed machine learning algorithms to analyze and process these data. Their goal was to evaluate the technical status of current transformers, predict potential failures, and develop proactive maintenance plans. Similarly, Qusay Alhamd et al. [10] extracted features from the differential current of current transformers using enhanced wavelet analysis, incorporating additional information such as differential current amplitude and bias current. They utilized Long Short-Term Memory networks for training, enabling accurate identification of internal faults, external faults, inrush currents, and other issues related to current transformers. This paper introduces a predictive maintenance approach specifically designed for iron-core current transformers used in substations. The proposed method can accurately predict both single-phase and double-phase short-circuit faults in current transformers using collected historical data. This approach effectively enhances the security of power systems and reduces unexpected power outages caused by these two types of current transformer faults. As a result, it ensures the reliability of the power supply and lowers operational costs. Furthermore, it has significant implications for advancing smart grid development and facilitating the green transformation of power networks.
The main contributions are summarized as follows:
  • This study integrates wavelet transform (WT), the Spearman correlation coefficient (SCC), and Mutual Information (MI) to propose an advanced feature engineering method for the predictive maintenance of power equipment. This method integrates time-frequency domain analysis, statistical correlation, and information theory characteristics to ensure comprehensive and effective feature selection.
  • This paper employs Random Forest (RF) as the classification model, leveraging its robust capabilities in assessing feature importance and handling nonlinear decision boundaries to achieve high performance in multi-class fault diagnosis. The model demonstrates strong adaptability and explanatory capabilities for healthy states, single-phase short circuit faults, and bidirectional short circuit fault scenarios.
The remainder of this paper is organized as follows: Section 2 provides a brief overview of related research on predictive maintenance methods. Section 3 presents a detailed description of the proposed method. Section 4 conducts experiments utilizing the collected monitoring data to validate the effectiveness of the proposed approach. Finally, Section 5 offers conclusions.

2. Related Works

Predictive maintenance (PdM) is based on historical data, models, and domain expertise. Utilizing statistical or machine learning models, PdM can identify trends, behavioral patterns, and correlations to forecast potential faults in advance. This proactive approach enhances the decision-making process for maintenance activities, ultimately helping to prevent unexpected shutdowns.
Based on the differences in techniques and analytical approaches, current predictive maintenance technologies for electrical equipment can be classified into four categories: rule-based methods, model-based methods, data-driven methods, and hybrid methods, as illustrated in Figure 1.
Rule-driven methods rely on manually predefined rules, thresholds, and experiential knowledge to assess equipment status. These methods do not depend on extensive historical data or complex models; instead, they primarily evaluate equipment operation through straightforward logical determinations. Common approaches within this category include triggering alarms or maintenance operations based on preset thresholds or logical conditions, as well as conducting equipment diagnostics through predetermined expert experience [11] and knowledge base rules [12]. However, these methods have potential limitations due to their fixed rules, which hinder adaptability to changes in equipment conditions and complex operating environments. Additionally, they exhibit limited effectiveness in addressing non-linear and intricate fault patterns in equipment, typically processing only single variables or simple threshold judgments, and are unable to capture the complex relationships among multiple variables. The benefits of rule-driven methods include improved clarity, readability, and technical accuracy while maintaining the original meaning.
Model-driven methods primarily rely on physical or mathematical models of equipment, employing operational mechanism modeling to evaluate the health status of the equipment. In comparison to rule-driven approaches, these methods are more sophisticated and necessitate that model developers possess a comprehensive understanding of equipment principles and extensive domain expertise. Common techniques in this category include establishing mathematical or physical models [13] to compare actual data with model predictions for equipment status assessment, as well as developing signal processing models [14] to extract key signal characteristics, among others. Data-driven methods depend on the analysis of historical data and real-time monitoring data. They employ statistical analysis, machine learning, deep learning, and other technologies to identify potential patterns within the data and automatically predict equipment health status or potential failures. Based on this foundation, these methods can be further categorized into three major types [15,16]: maintenance methods based on statistical and trend analysis, machine learning-based maintenance methods, and deep learning-based maintenance methods.
Maintenance based on statistical and trend analysis primarily utilizes statistical analytical techniques to identify long-term trends or abnormal changes, thereby predicting potential failures. Common methods include time series analysis and regression models. These techniques are particularly effective for equipment with extensive historical data, as they can effectively identify anomalous patterns and long-term trends. However, they may struggle to address complex fault patterns. Specific applications include analyzing growth trends in the long-term voltage, temperature, and vibration data of electrical equipment.
Machine learning-based maintenance primarily involves training algorithms to recognize fault patterns from historical equipment data and predict future equipment states. Common methods include Support Vector Machines, Random Forests, and Artificial Neural Networks. These techniques are well-suited for processing large volumes of historical data and complex fault patterns; however, they require substantial amounts of high-quality training data. Specific applications include the classification and prediction of current transformer monitoring data, as well as the identification of various fault states.
Deep learning-based methods primarily employ neural networks, such as Convolutional Neural Networks (CNNs) and Long Short-Term Memory networks (LSTMs), to automatically learn equipment fault patterns from complex datasets. These methods eliminate the need for extensive manual feature extraction and are capable of processing complex, high-dimensional, and non-linear data. They are particularly well-suited for analyzing large volumes of sensor data generated during equipment operation; however, they require significant computational resources and substantial amounts of training data. Specific applications include state classification predictions based on transformer sensor detection data and the identification of various faults.
Hybrid-driven methods seamlessly integrate the previously mentioned approaches, synthesizing the advantages of various driving mechanisms to enhance accuracy and adaptability. For example, in certain scenarios, rule-based and data-driven approaches can be combined; this may involve establishing specific alarm thresholds while employing machine learning for equipment fault prediction, or incorporating data-driven learning mechanisms into physical models to achieve more precise predictive outcomes.
In summary, the aforementioned predictive maintenance methods each offer unique advantages while also facing specific limitations. Rule-based and model-based approaches provide straightforward implementations and high interpretability; however, they often lack the flexibility needed to adapt to complex and dynamic operational environments. In contrast, data-driven methods, which leverage statistical analysis and machine learning techniques, offer enhanced capabilities for handling large volumes of data and uncovering intricate fault patterns. Nevertheless, these methods require substantial amounts of high-quality data and significant computational resources. Hybrid methods seek to integrate the strengths of both rule-based and data-driven approaches to achieve improved performance and adaptability. Given the current trends in data availability and advancements in machine learning, data-driven methods emerge as particularly promising for the predictive maintenance of electrical equipment. Consequently, this study primarily focuses on data-driven techniques to develop more accurate and efficient predictive maintenance solutions, with the aim of enhancing the reliability and maintenance efficiency of electrical systems.
Although existing predictive maintenance methods have made significant progress in the power sector, there are still notable gaps in the prediction of specific physical fault types. For instance, ref. [17] proposed a VMD-GRU error prediction method based on Bayesian optimization to address the issue of current transformer measurement error prediction. This approach utilizes the Bayesian optimization algorithm to determine the optimal parameters of the model, thereby providing a novel and effective solution for error prediction. Additionally, ref. [18] employed environmental parameters—such as temperature, magnetic field, and load—as input variables, while using the ratio and phase error of the electronic current transformer as output variables to construct an error prediction model. Furthermore, ref. [19] employs the maximum information coefficient to analyze the correlation between the errors of air-core coil current transformers and their environmental and operational conditions. However, existing studies primarily concentrate on fault prediction related to measurement errors in current transformers, leaving significant gaps in the prediction of specific physical fault types. A limited number of studies have addressed particular physical fault types; for instance, ref. [20] investigates faults caused by interference, such as electrical fast transient pulse groups and damped oscillation waves, while ref. [21] utilizes Convolutional Neural Networks and Faster R-CNN models to detect abnormal temperature fault types in current transformers. Although these studies have made some progress, research on predictive maintenance for common fault types, such as 1HCF and 2HCF, remains inadequate. Consequently, the novel method proposed in this study addresses this research gap for single-phase and two-phase short circuit faults in current transformers, thereby contributing to the predictive maintenance of power systems.

3. Predictive Maintenance Strategies for Current Transformer Failures

This section elaborates on a proposed predictive maintenance method for iron-core current transformers, specifically designed for certain application scenarios. This method can achieve relatively accurate predictions of single-phase and double-phase short-circuit faults in current transformers. The technical architecture is illustrated in Figure 2.
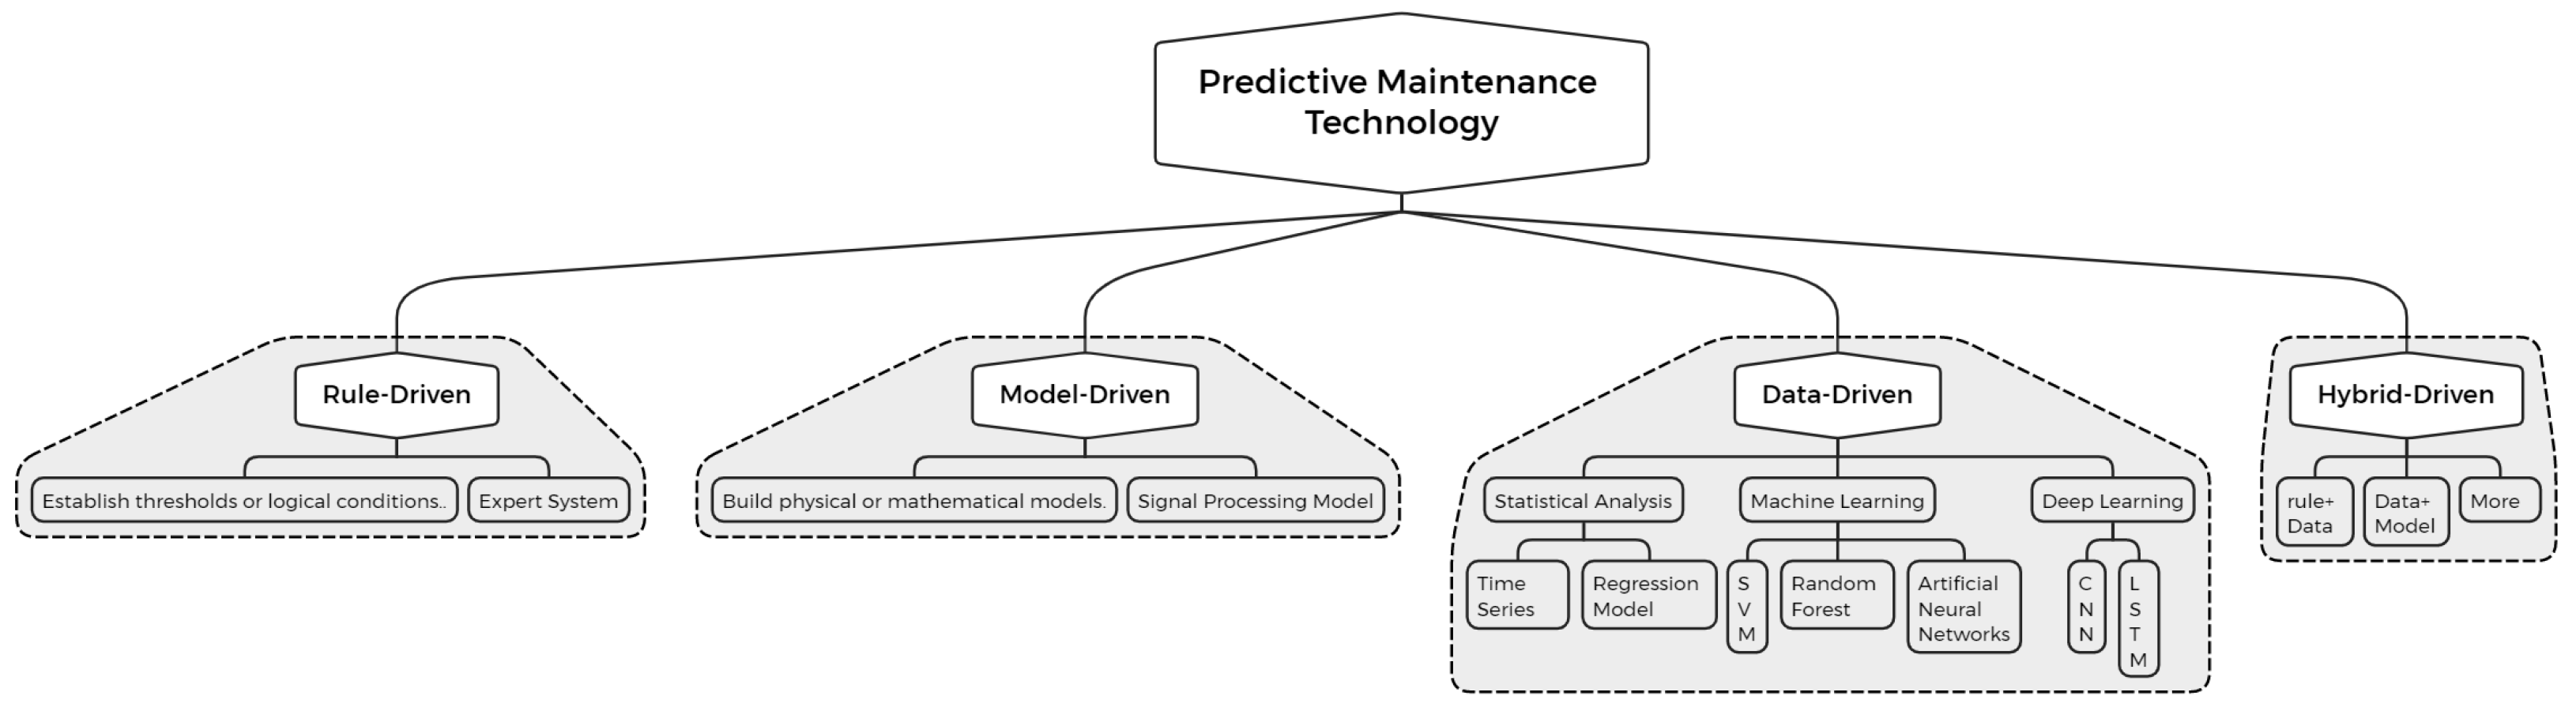
As illustrated in the figure, the proposed predictive maintenance method consists of three main components: data preprocessing, feature extraction, and fault classification. The data source includes sensor monitoring data from a specific iron-core current transformer located within a designated substation.

3.1. Data Preprocessing

In the predictive maintenance application discussed in this paper, the majority of the data sourced consists of time-series data from sensors. Therefore, it is crucial to conduct data preprocessing to effectively extract relevant features and eliminate noise and redundancy during the construction of the data analysis model.
Regarding the data preprocessing phase, data cleaning is initially conducted to eliminate anomalous values and invalid data. Since the collected raw sensor data cannot be directly utilized for subsequent processing, data labeling is necessary to convert fault and healthy states into numerical forms that can be processed by machine learning models. In this context, we convert the labels “HLTY” (healthy state), “1HCF” (single-phase short-circuit fault state), and “2HCF” (double-phase short-circuit fault state) into numerical labels 0, 1, and 2, respectively. Furthermore, to process current transformer signals with complex frequency components and transient characteristics, this paper employs wavelet transform (WT) technology, which has demonstrated remarkable effectiveness in analyzing time-varying features or non-stationary signals [22]. Prior to performing the wavelet transform, this study also processed the collected raw data. To extract statistical features, this research utilized a rolling window with a fixed size of 10 to capture overall trends and fluctuations in current, voltage, power factor, and other parameters. The reasoning behind the window selection was as follows:
(1)
When extracting statistical features, choosing a sliding window with a fixed size of 10 shows relatively good performance in the experimental results, while the calculation time and memory consumption are relatively moderate.
(2)
If a sliding window that is too large is used, some short-term changing features are likely to be smoothed out, which can negatively impact the detection capability of short-term faults and result in high computational time and memory consumption. Conversely, a sliding window that is too small may not adequately capture the changing features of the entire signal.
(3)
We established the parameters based on the sampling frequency and detection window length of the power equipment in the substation. A window length of 10 is adequate to encompass a complete cycle of current fluctuation, thereby effectively extracting statistical features.
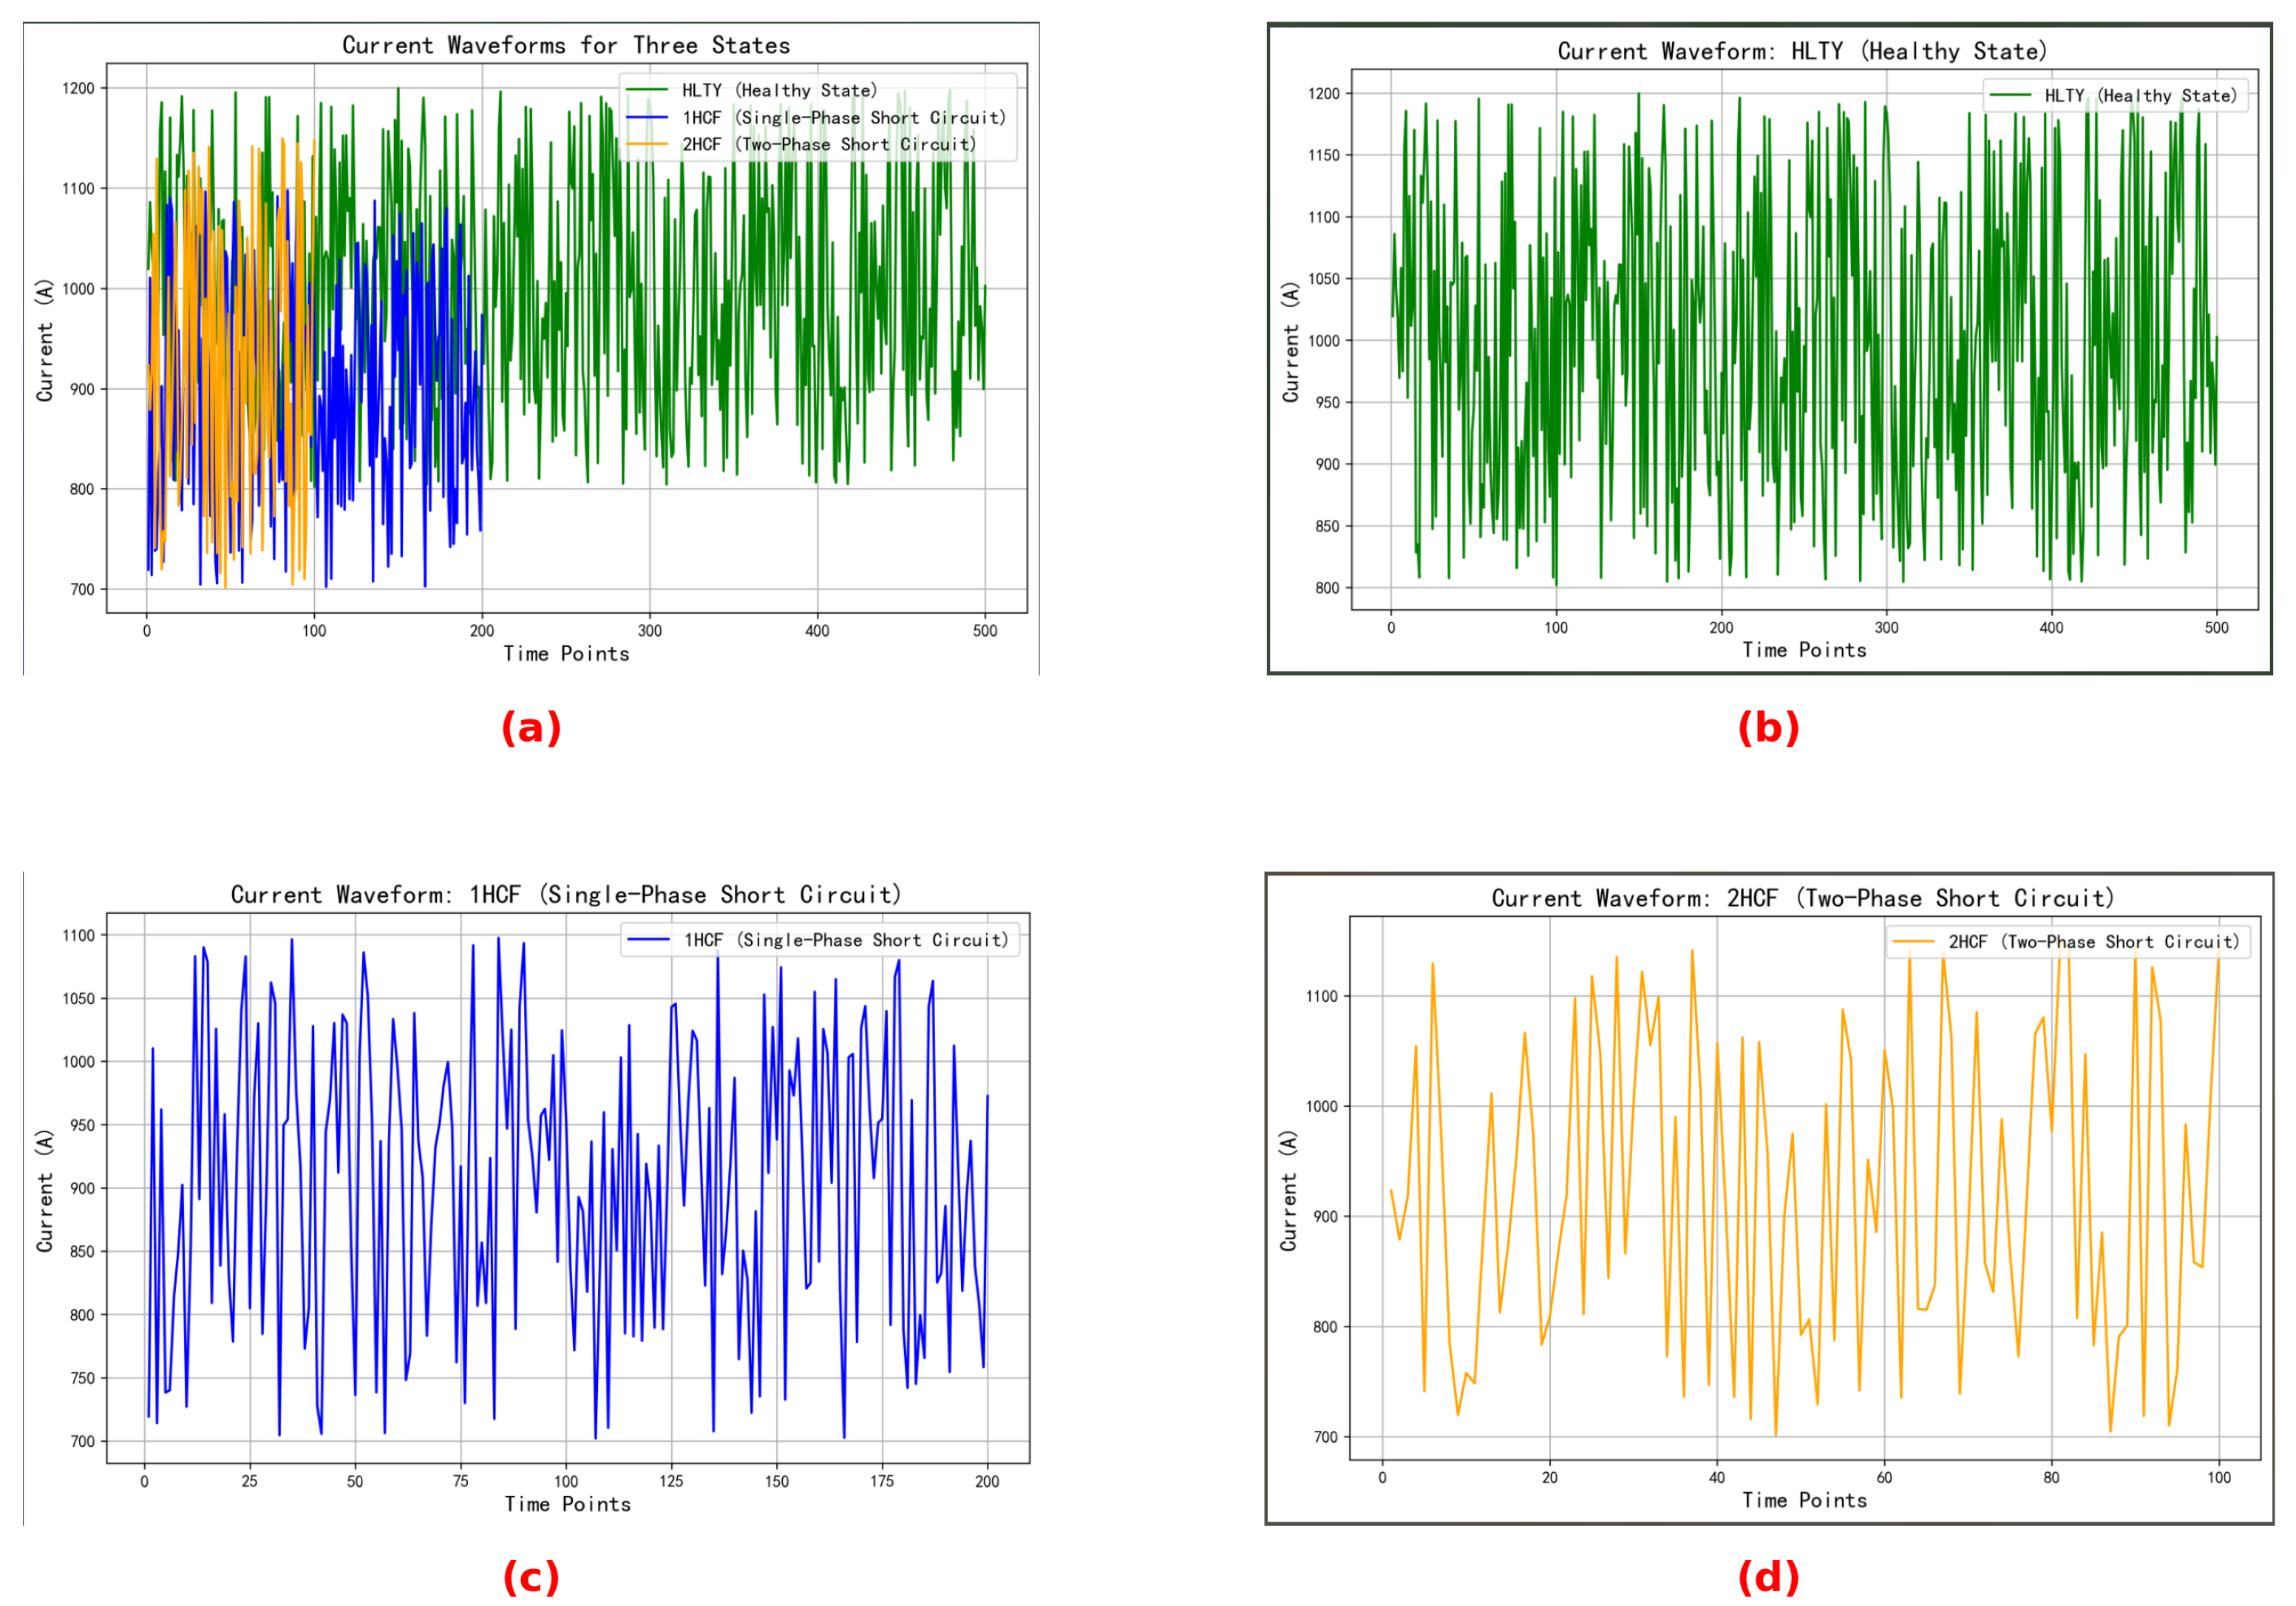
Figure 3 illustrates the current waveform diagram in its current state, as well as the current waveform diagrams for the three individual states.
The waveform diagrams above illustrate the variation of current values over time across three states. It is evident from the figure that the current waveform in the HLTY state is relatively stable, exhibiting a small amplitude range, with fluctuations approximately between 800 A and 1200 A. In contrast, the current waveform in the 1HCF state is more irregular, with fluctuations ranging from approximately 700 A to 1100 A. This irregularity may be attributed to current leakage resulting from a short circuit. The current waveform in the 2HCF state fluctuates between approximately 700 A and 1150 A, which is similar to the amplitude range of the 1HCF state; however, the fluctuation amplitude is greater than that of the 1HCF state, and the local peaks and valleys are more pronounced.
The wavelet transform in this research primarily consists of three key steps:
Step one involves selecting an appropriate wavelet basis function, denoted as ψ ( t ) . In this paper, we have chosen the Daubechies wavelet, which is widely utilized for signal decomposition and reconstruction as a filtering tool. This family of compactly supported wavelets is well-suited for the local analysis of signals and is capable of effectively capturing short-term variations in current transformer signals.
Step two involves wavelet decomposition. This study employs the Discrete Wavelet Transform (DWT), which decomposes current signals using a selected wavelet basis function into multiple levels of varying frequency components. This process allows for the extraction of signal features from different frequency bands. The signal can be represented as:
x ( t ) = j = 0 J k c j , k ψ j , k ( t )
where j represents the scaling parameter, indicating the various decomposition levels of the wavelet; k is the translation parameter, denoting the translation position of the wavelet function in time or space; c j , k is the wavelet coefficient, reflecting the outcome of the transformation at scale j and position k; and ψ j , k ( t ) is the wavelet basis function, adjusted by translation and scaling. Additionally, J indicates the number of decomposition levels, and  c j , k is defined as follows:
c j , k = x ( t ) ψ j , k ( t ) d t , ψ j , k ( t ) = 1 2 j ψ t k 2 j
Taking the collected current signal data from the current transformer as an example, we utilized wavelet decomposition to separate the current signal into low-frequency and high-frequency components, which represent the steady-state and instantaneous variation components of the signal, respectively. The low-frequency components, particularly those containing fundamental waves, are essential for detecting load changes and ensuring normal operations. The energy in the low-frequency portion typically correlates with the power system’s fundamental wave and load magnitude, while its mean and variance can reflect the average load level and fluctuations in load fluctuation conditions.
For larger j values, specifically the high-frequency components, the energy can indicate equipment failures or reveal the presence of high-frequency noise and transient signals. For example, during short-circuit faults, the current waveform may exhibit significant pulses and variations. These sudden changes in high-frequency components are captured, with statistical features such as peak values and spectral distribution reflecting these variations. Consequently, at each time point, wavelet decomposition is performed on the current data as well as the data from the previous nine time points. This process involves calculating the mean and standard deviation for low-frequency components, and skewness and kurtosis for high-frequency components. The features extracted after wavelet decomposition are retained for subsequent feature selection.
Step three involves wavelet reconstruction. This process is essential because, in classification prediction tasks, directly utilizing wavelet-decomposed current signals—decomposed into multiple layers with varying frequency components—can be overly complex and fragmented. Using all this frequency information directly as input for subsequent classification predictions is not appropriate. However, after reconstruction, the processed frequency domain information can be transformed back into signals that are suitable for further analysis, preserving the frequency information while enabling subsequent processing. We employ the Inverse Discrete Wavelet Transform (IDWT):
x ( t ) = j = 0 J k c j , k ψ j , k ( t )
where c j , k represents the wavelet coefficients obtained at the j-th level.
In this study, we selectively reconstructed the signal to retain only the low-frequency components, only the high-frequency components, and the fully reconstructed signal. This approach facilitates subsequent feature extraction and screening, followed by the selective input of the appropriate reconstructed signals into the classification training model.
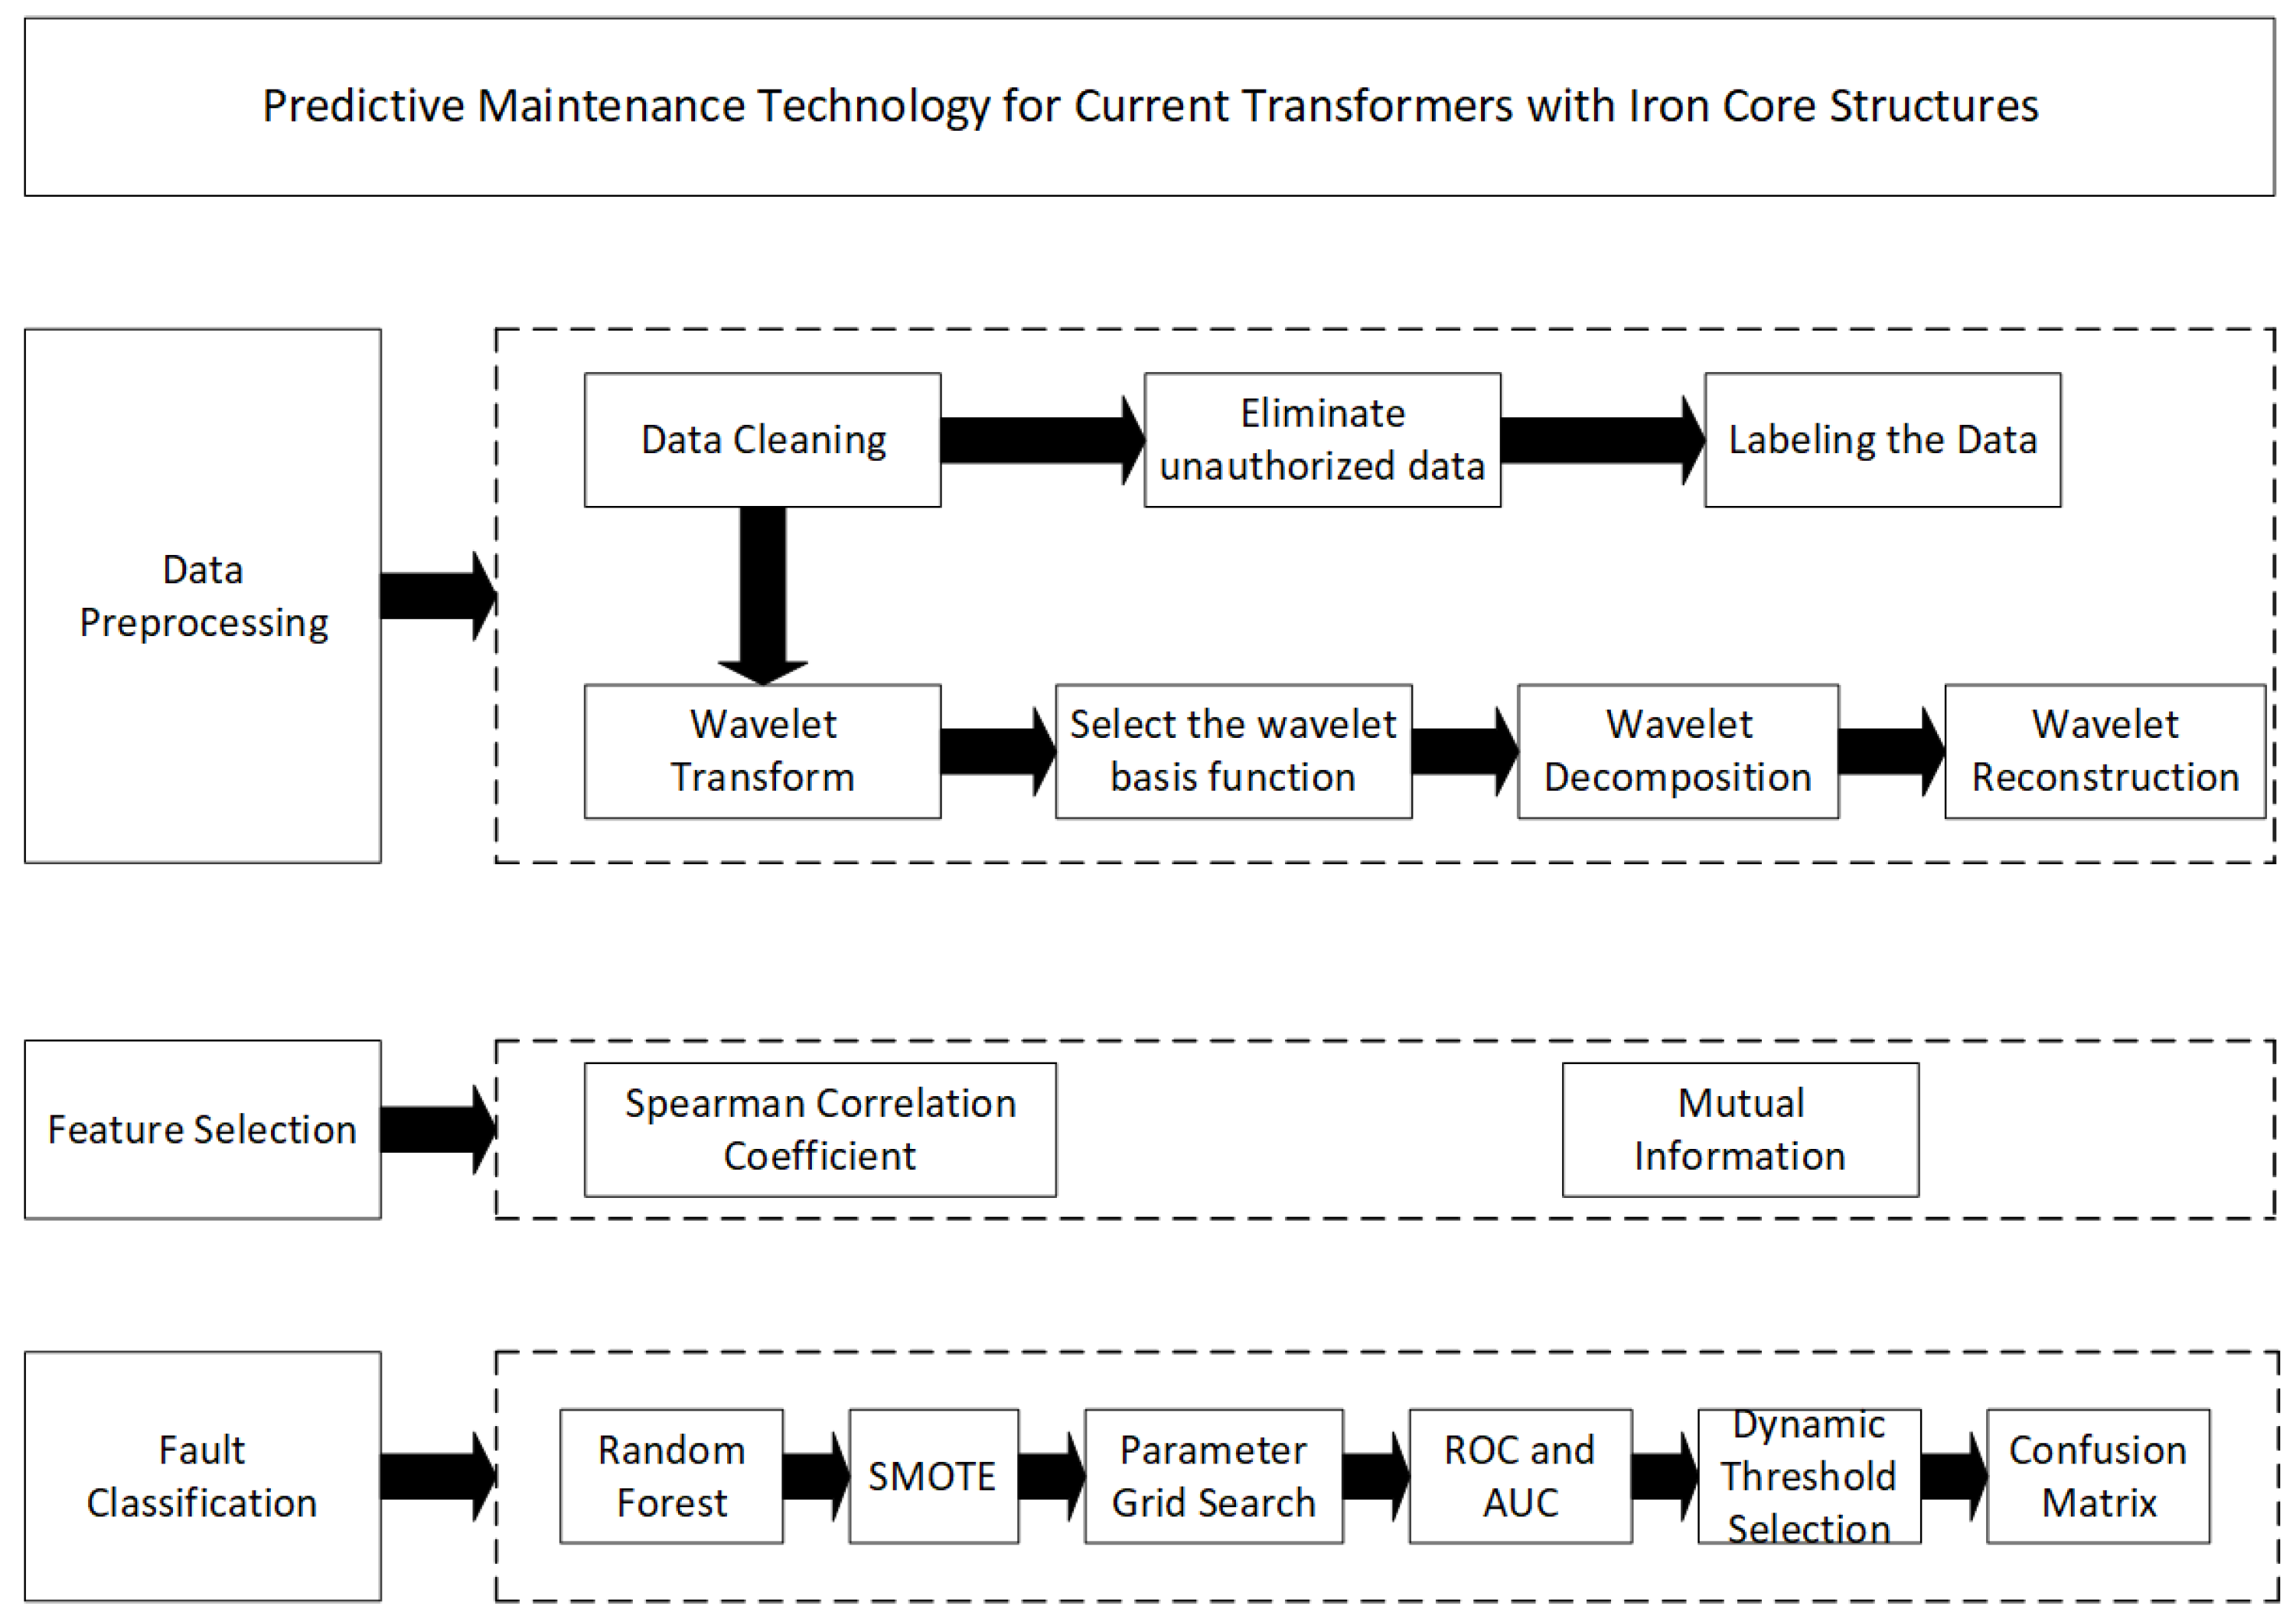
The complete data preprocessing workflow is illustrated in Figure 4.
The specifics of the operations are detailed in Algorithm 1.
Algorithm 1 Data Preprocessing Algorithm
Require: 
Raw dataset D, Wavelet type W
Ensure: 
Processed dataset D with numeric labels
  1:
D clean
  2:
for all  r e c o r d D  do
  3:
    if  validate ( r e c o r d )  then
  4:
         D clean D clean { r e c o r d }
  5:
    end if
  6:
end for
  7:
D labeled
  8:
for all  r e c o r d D clean  do
  9:
    if is_healthy_data ( r e c o r d )  then
10:
         l a b e l 0
11:
    else if is_single_phase_fault ( r e c o r d )  then
12:
         l a b e l 1
13:
    else
14:
         l a b e l 2
15:
    end if
16:
     D labeled D labeled { ( r e c o r d , l a b e l ) }
17:
end for
18:
D transformed
19:
for all  ( r e c o r d , l a b e l ) D labeled  do
20:
    signal←extract_signal ( r e c o r d )
21:
     w a v e l e t _ c o e f f s perform _ DWT ( s i g n a l , W )
22:
     r e c o n s t r u c t e d _ s i g n a l perform _ IWT ( w a v e l e t _ c o e f f s , W )
23:
     D transformed D transformed { ( r e c o n s t r u c t e d _ s i g n a l , l a b e l ) }
24:
end for
25:
return  D transformed

3.2. Feature Selection

For feature extraction, this research employs a joint screening approach utilizing the Spearman coefficient (SC) and Mutual Information (MI). The Spearman coefficient is effective not only for linear relationships but also for monotonic non-linear relationships. In comparison to the Pearson correlation coefficient, it is less sensitive to outliers and can effectively reveal monotonicity between features and target variables. Meanwhile, Mutual Information measures the dependency between two random variables and captures more complex and potential non-linear associations. It is particularly adept at uncovering hidden relationships when the connections between features and target variables are intricate. By combining these two methods for screening, we can more comprehensively evaluate the correlation between features and target variables. This approach retains features that exhibit monotonic relationships with our state label classifications while also considering important non-linearly correlated features. Furthermore, when addressing complex data relationships, this joint approach helps mitigate certain biases in feature selection. The screening conducted from different dimensions using these two methods can enhance our model’s generalization capability, resulting in more accurate and stable training and prediction outcomes.
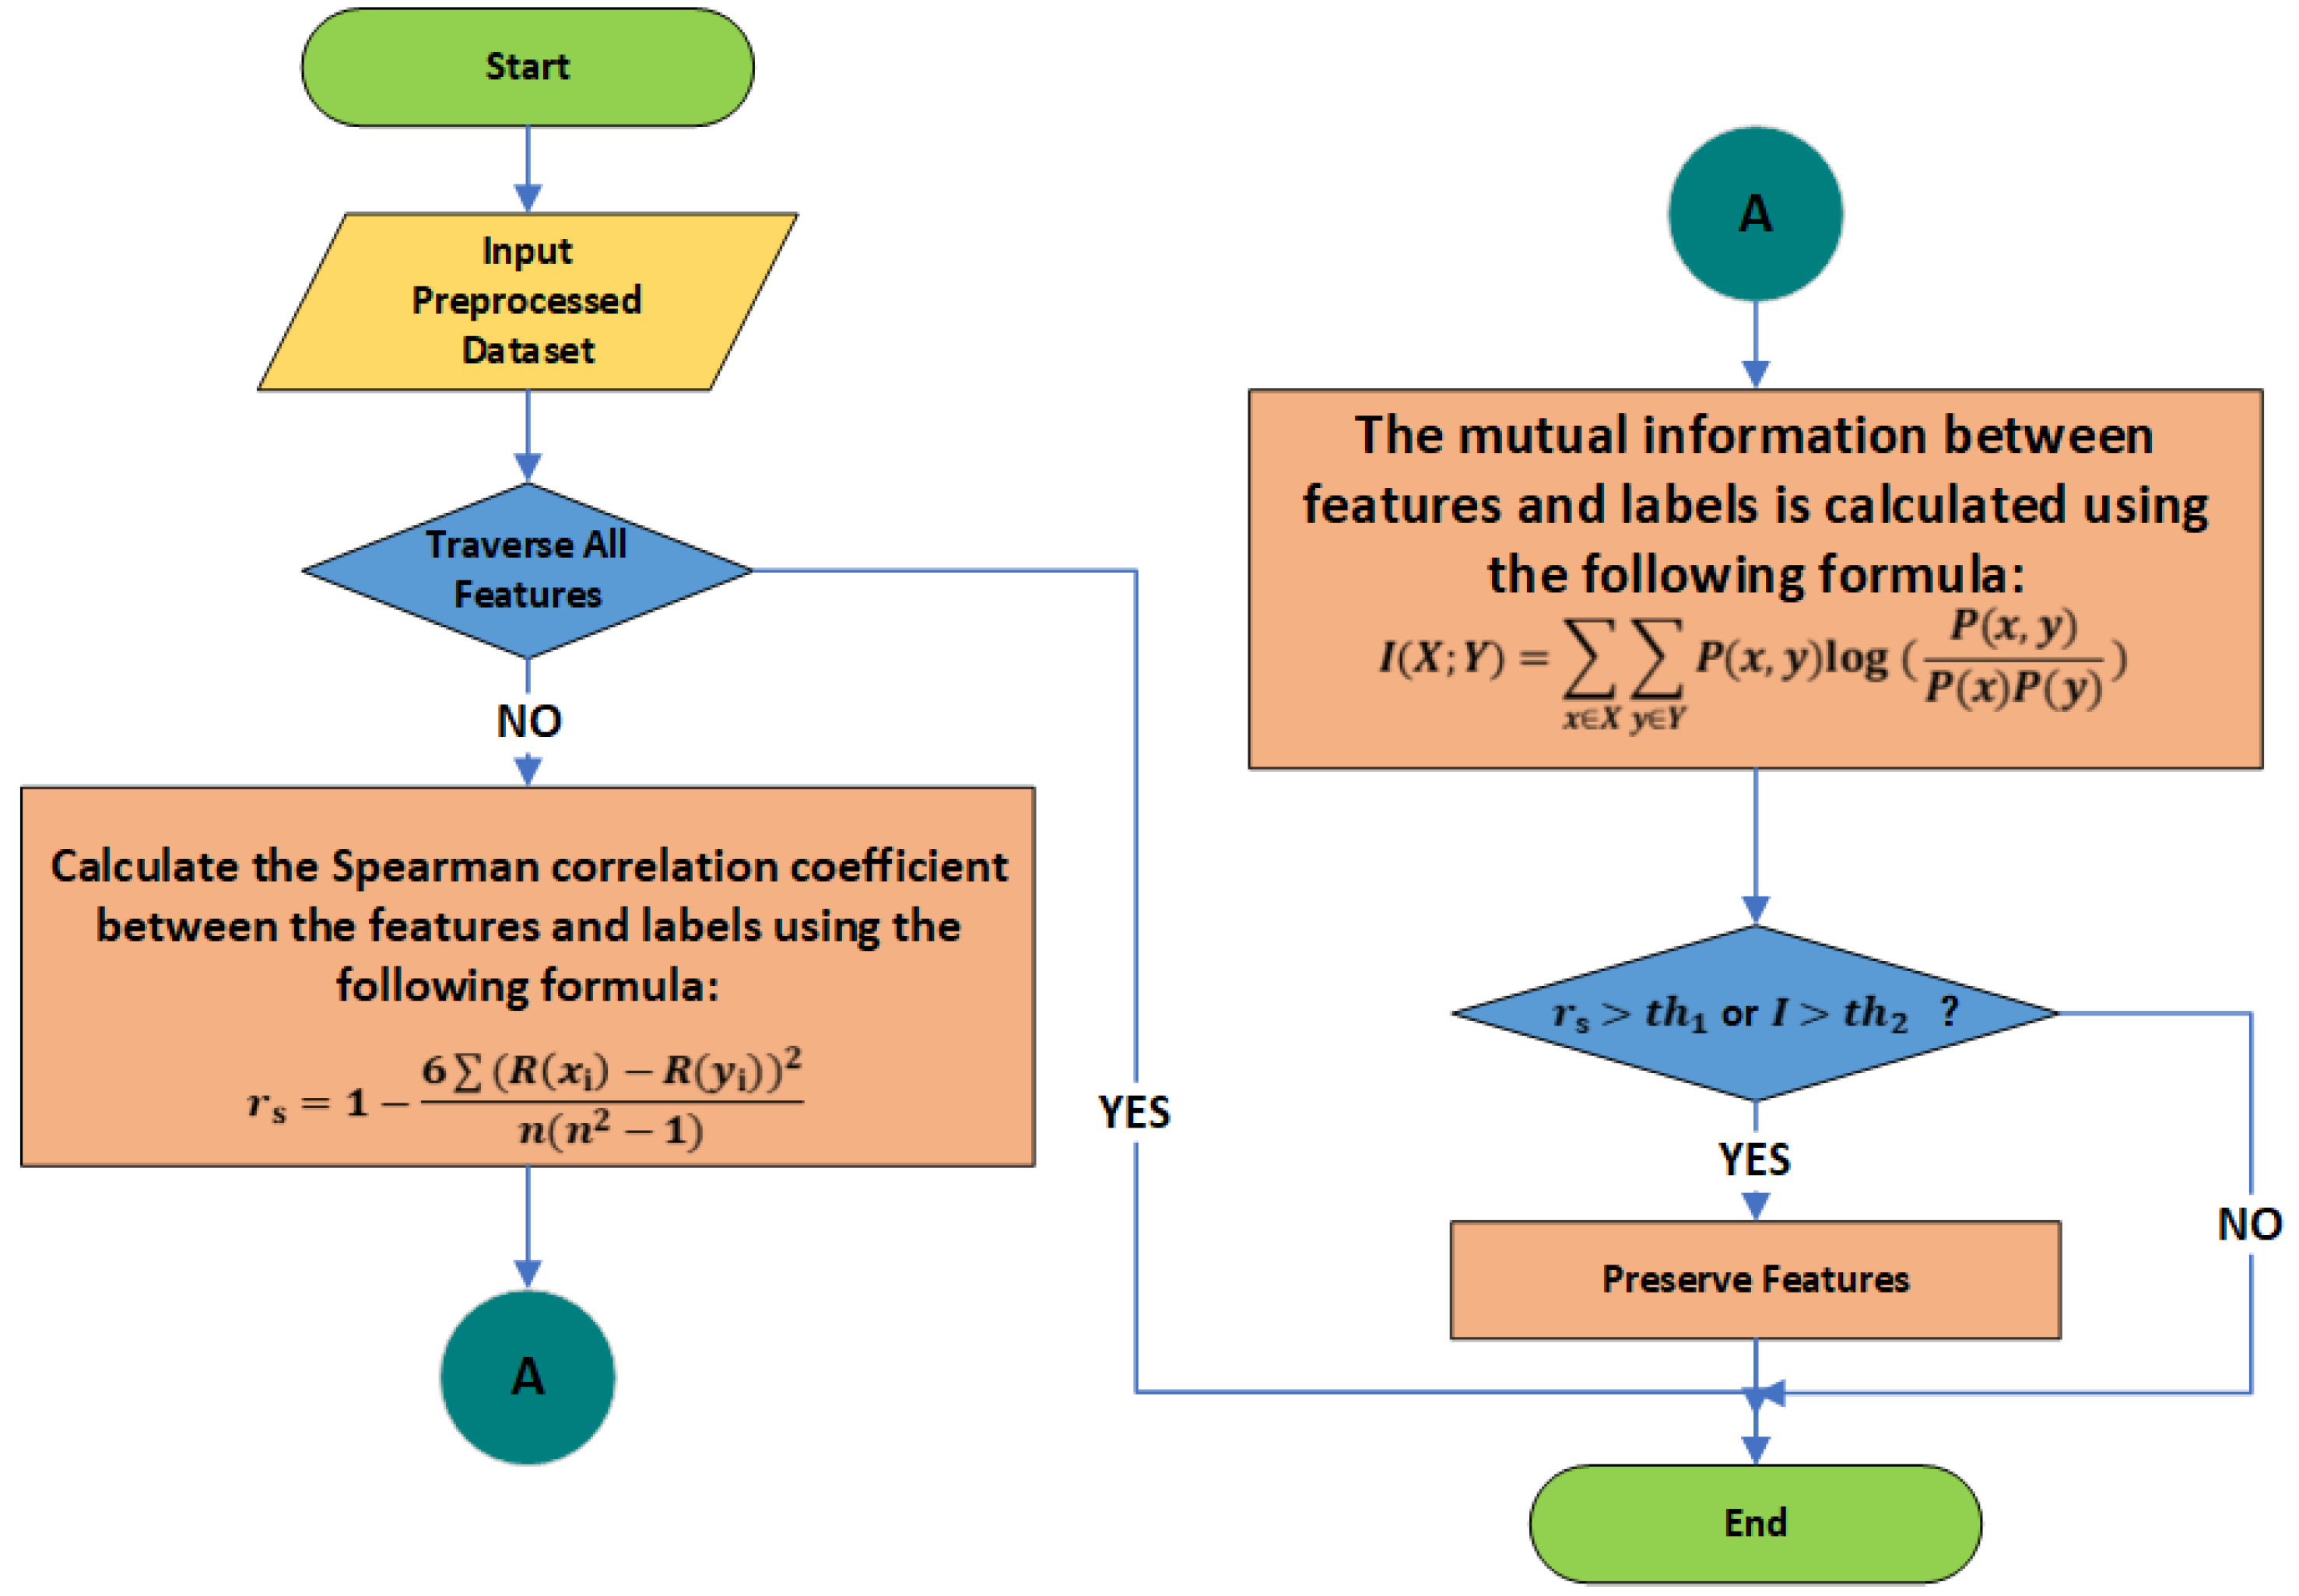
The specific methodology is illustrated in Figure 5.
The definitions of R( x i ) and R( y i ) in the figure are as follows:
R( x i ) is a ranking value generated by sorting a single feature extracted from the historical monitoring data of the current transformer using wavelet transformation or statistical feature extraction. The monitoring data include current values, voltage values, power factors, temperature, humidity, harmonic content, and load status. The extracted statistical features encompass characteristic values such as the mean, standard deviation, kurtosis, and skewness. Here, x i represents all the extracted characteristic values. The advantage of the ranking value R( x i ) over the calculation of absolute values is that it can eliminate the influence of units from different physical variables.
R( y i ) represents the ranking value obtained by sorting the state samples of the current transformer. Here, y i denotes the target state label, which corresponds to the current transformer’s state. The possible state labels include healthy state (HLTY), single-phase short circuit fault (1HCF), and double-phase short circuit fault (2HCF). These states are converted and represented by digital labels: 2 for healthy state, 0 for single-phase short circuit fault, and 1 for double-phase short circuit fault.
In order to more clearly illustrate the ranking distribution and correlation between R( x i ) and R( y i ), we use the characteristic of x i , which represents the current value, as an example for demonstration and explanation in Figure 6.
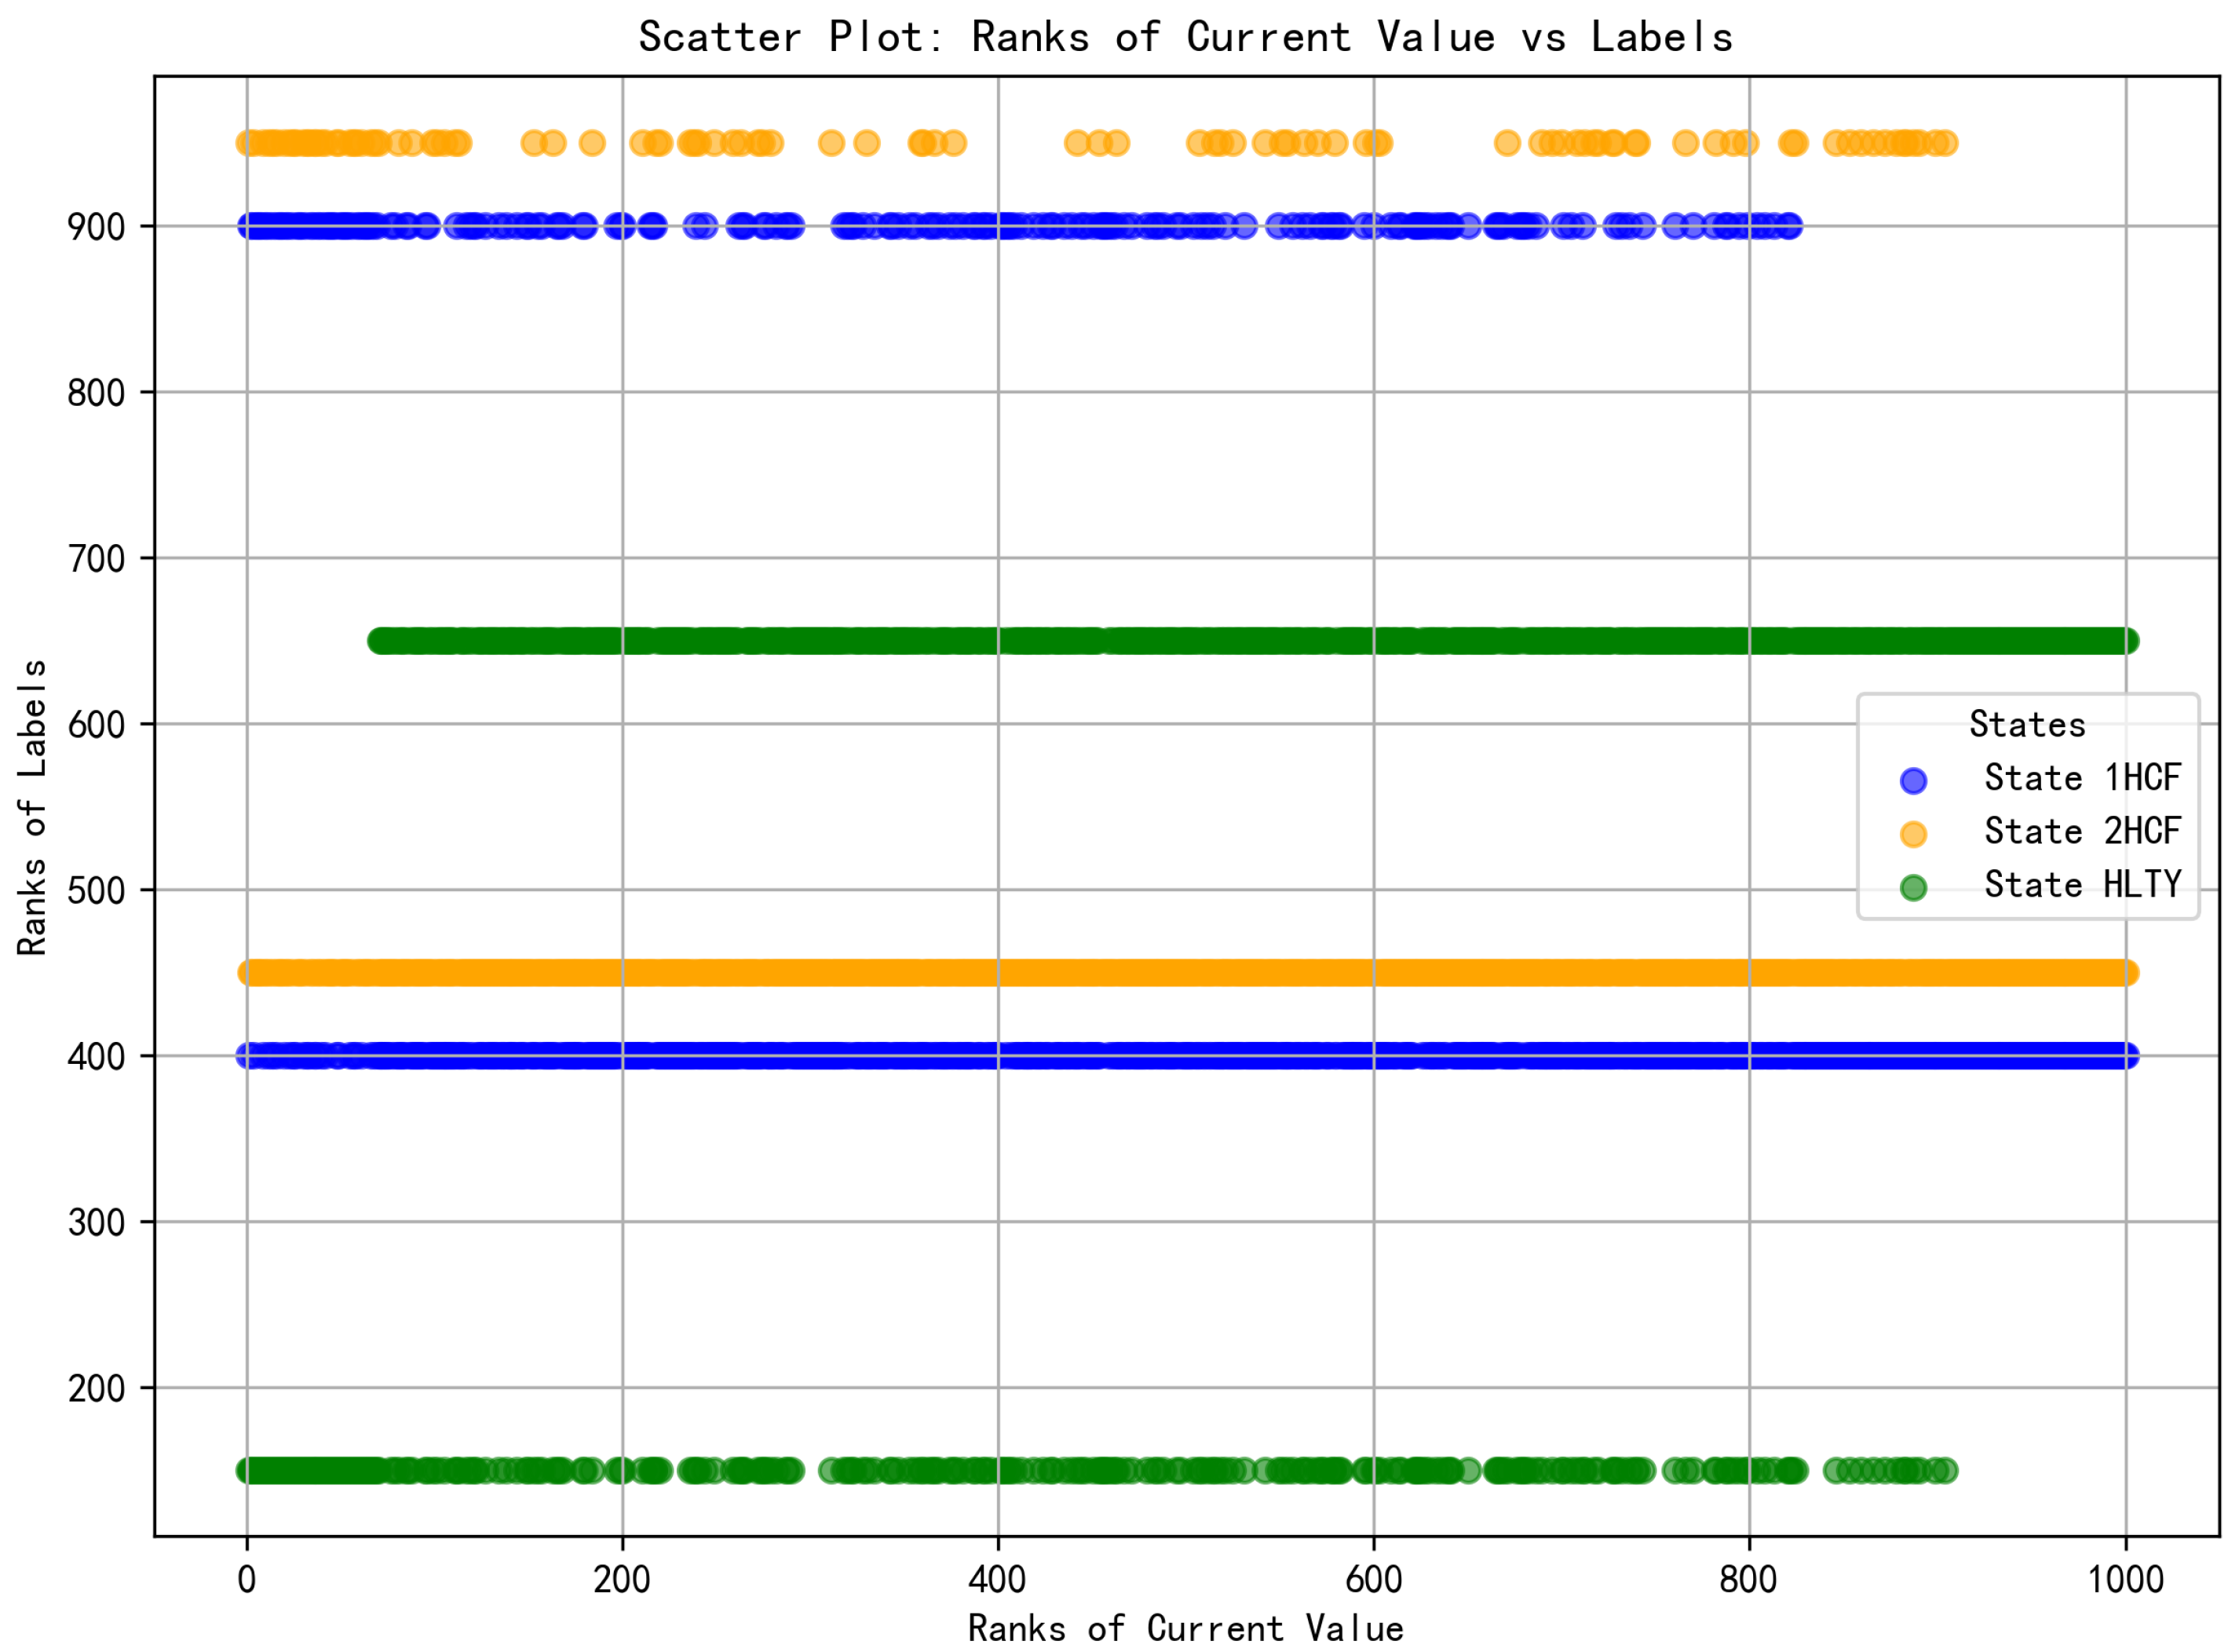
The scatter plot above illustrates the relationship between the ranking distribution of the current value feature and the state label rankings. The horizontal axis represents the feature ranking of the current value, where a higher ranking value indicates a greater current value of the sample. The vertical axis denotes the ranking of the state labels (HLTY, 1HCF, 2HCF). Each label is discretized and represented by a numerical value, with the ranking of each state calculated based on the binary (0,1) label of the corresponding sample. Specifically, if a sample belongs to a particular state label, its corresponding value is 1, resulting in a higher ranking value. Conversely, if the sample does not belong to that state label, the value is 0, leading to a lower ranking value.
The data points for different states in the figure are represented by distinct colors: blue indicates 1HCF, yellow signifies 2HCF, and green denotes HLTY. The distribution illustrated in the figure reveals a significant overlap between the blue and orange points in certain areas, suggesting that the 1HCF and 2HCF states share similarities in their current value distributions. This overlap may pose challenges for the classifier in differentiating between the two states, thereby impacting the model’s predictive performance. Consequently, this is one of the factors contributing to the low prediction accuracy of 2HCF.
The statistical features extracted after the wavelet transform, including the mean and standard deviation, along with reconstructed signals and other feature data, are incorporated into the target feature set (featureSet) for iteration. The process then iterates through the feature set (featureSet), calculating both the Spearman coefficient and the Mutual Information coefficient between each f e a t u r e i and the target values (i.e., the digitized state labels) according to the corresponding mathematical formulas presented in Figure 5.
Further screening is conducted using the Spearman coefficient to eliminate features that exhibit minimal monotonic relationships with the labels. For instance, during feature iteration, calculations indicated that the mean and variance of current values derived from low-frequency components extracted through wavelet transform demonstrated high Spearman coefficient values when assessed against state label values, highlighting clear distinctions between healthy and faulty states. Conversely, features such as harmonic content and power factor produced results close to zero, suggesting no significant monotonic relationship for state discrimination. This step preliminarily reduces data dimensionality while preserving features with strong monotonic relationships. However, in practical scenarios, variables often possess more complex relationships that cannot be adequately captured by monotonicity alone. Therefore, relying solely on the Spearman coefficient is insufficient; it is essential to incorporate Mutual Information to assess non-linear relationships, thereby preventing the exclusion of important features that could impact the training accuracy and reliability of subsequent fault classification models.
After preliminary screening, we utilize Mutual Information to assess whether the remaining features exhibit non-linear or more complex effects on the labels. If there is no information overlap between the currently examined feature and the state label values, the calculated value of the formula is 0. Conversely, if the features are completely correlated, the Mutual Information equals their entropy. Some features may not demonstrate significant performance in the Spearman coefficient during preliminary screening but may perform well in the Mutual Information assessment. Such features should not be overlooked, as they may possess important predictive capabilities.
In the feature selection process, setting appropriate thresholds is crucial for decision-making, as it directly influences the ability of selected features to effectively support model training and enhance prediction accuracy. Establishing suitable thresholds helps eliminate irrelevant or noisy features while retaining those that positively contribute to model performance. In this context, for the Spearman coefficient threshold (Threshold 1), we determined that an absolute value of the Spearman coefficient between 0.2 and 0.3 typically indicates a moderate monotonic relationship between features and labels. In contrast, values ranging from 0.5 to 0.7 demonstrate a very strong monotonic relationship. To eliminate features with extremely weak relationships to state label values while avoiding the exclusion of effective features due to excessively high threshold settings, we established the final Threshold 1 at 0.3. For Mutual Information (Threshold 2), we noted that, in most cases, features with lower Mutual Information values exert a weaker influence on target labels, whereas features with higher Mutual Information values generally possess greater predictive capability for those labels. To prevent overlooking non-linear relationships while filtering out features with evidently weak non-linear relationships, we set Threshold 2 at 0.1.
Finally, during the screening process, we selected features that met either the specified Threshold 1 for the Spearman coefficient or Threshold 2 for Mutual Information.

3.3. Classification Prediction

For the classification prediction component, we utilize a Random Forest model. This model exhibits the characteristics of ensemble learning, providing high accuracy and robustness while effectively managing high-dimensional data and noise. It also offers excellent parallelization capabilities and can assess feature importance, showcasing its strong problem-solving abilities for complex, non-linear state data of current transformers.
The specific steps are outlined as follows:
After completing preprocessing and feature selection, we divide the data into training and test sets. First, we create a model using a pipeline that incorporates SMOTE (Synthetic Minority Over-sampling Technique) and a Random Forest classifier. Since the substation discussed in this paper operates without equipment failures most of the time, the fault data in the collected current transformer data represent a small minority. This situation can hinder the model’s ability to effectively learn the characteristics of fault data during training, leading to a class imbalance problem. Therefore, SMOTE is employed to generate additional samples of the minority class, thereby achieving a more balanced training dataset.
The next step involves hyperparameter optimization. We utilize grid search in conjunction with cross-validation to identify the optimal combination of hyperparameters for the model. Subsequently, we apply this optimal combination to make predictions on the test set.
After identifying the optimal parameter combination through grid search, we train the optimized pipeline using the training set. Upon completion of the training process, we utilize the p r e d i c t proba method to calculate the probability of each sample belonging to each class. These probability data serve as the foundation for subsequent evaluations of model performance.
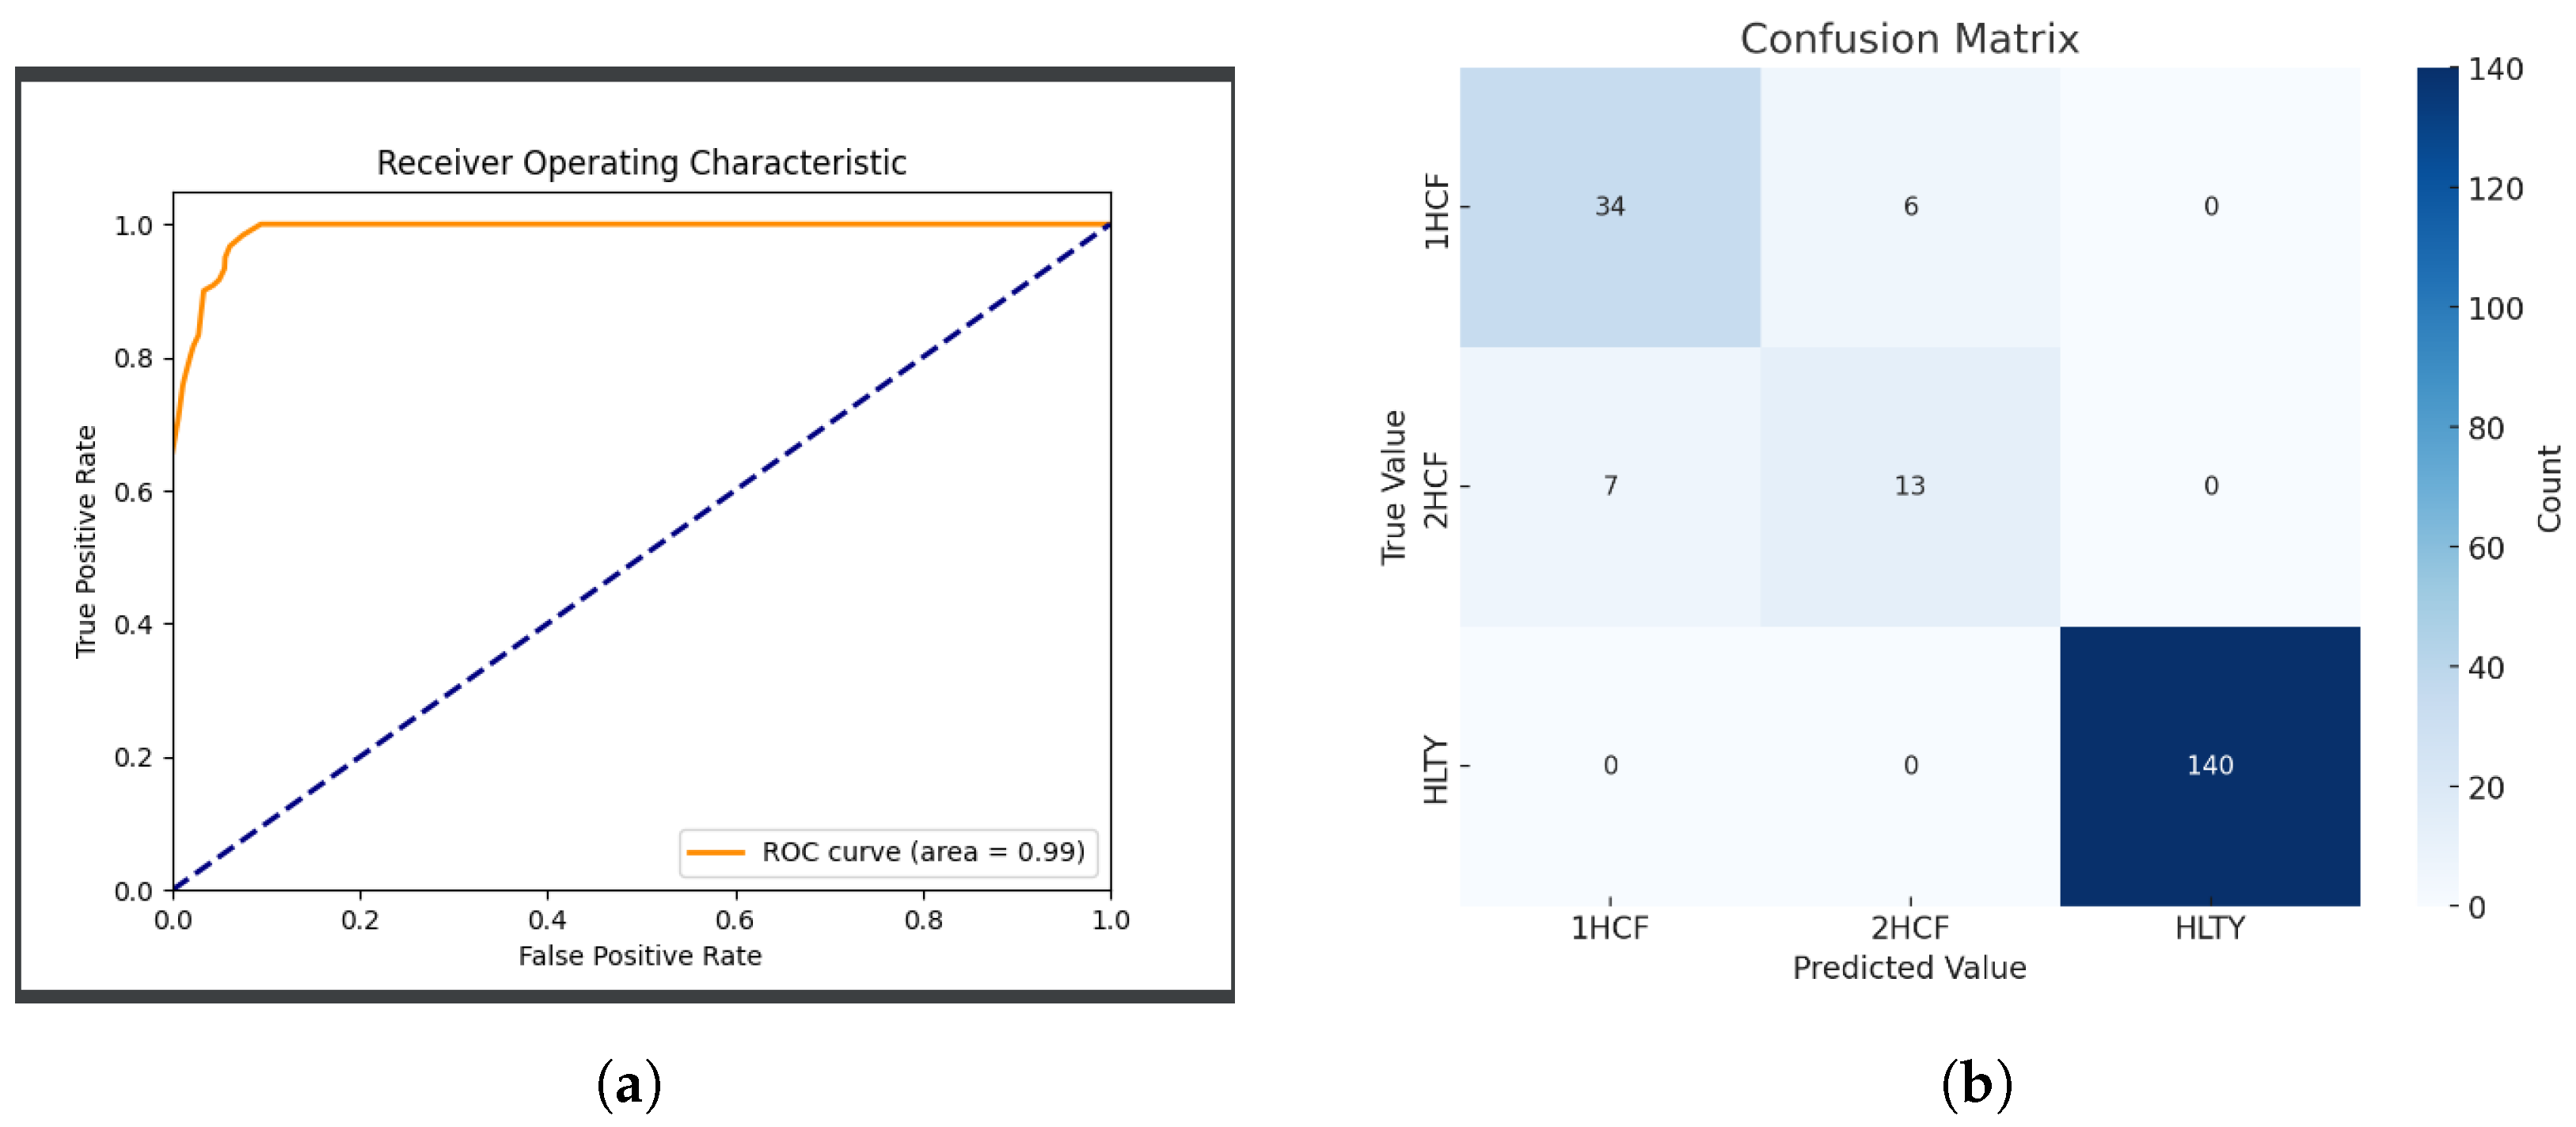
Finally, we conduct a comprehensive evaluation of model performance. This paper calculates the Receiver Operating Characteristic (ROC) curve for each class and computes the macro-average ROC Area Under the Curve (AUC) metric, generating corresponding ROC curve plots. By plotting the relationship between the True Positive Rate (TPR) and the False Positive Rate (FPR), we illustrate the classifier’s ability to differentiate between positive and negative samples.
Based on the Receiver Operating Characteristic (ROC) curve, we dynamically select the optimal threshold to enhance the model’s predictive performance. Subsequently, we generate a confusion matrix to illustrate the comparison between predicted and actual results for each class, thereby revealing the accuracy and reliability of the pre-trained model in predicting real samples.
The specifics of the feature selection and classification prediction training operations are outlined in Algorithm 2.
Algorithm 2 Feature Selection and Model Training for Fault Diagnosis
Require: 
Processed dataset D transformed , MIC threshold MIC thresh , Model type M
Ensure: 
Trained model M trained
  1:
D features
  2:
Step 1: Feature Selection
  3:
for all  ( r e c o r d , l a b e l ) D transformed  do
  4:
     f e a t u r e s extract _ features ( r e c o r d )
  5:
    for all  f i f e a t u r e s  do
  6:
         MIC i compute _ MIC ( f i , l a b e l )
  7:
        if  MIC i MIC thresh  then
  8:
            D features D features { ( f i , l a b e l ) }
  9:
        end if
10:
    end for
11:
end for
12:
Step 2: Train-Test Split
13:
D train , D test split ( D features , ratio = 0.8 )
14:
Step 3: Model Training
15:
M initialized initialize _ model ( M )
16:
M trained train ( M initialized , D train )
17:
Step 4: Model Evaluation
18:
p r e d i c t i o n s predict ( M trained , D test )
19:
a c c u r a c y compute _ accuracy ( p r e d i c t i o n s , D test )
20:
r o c _ c u r v e compute _ roc _ curve ( p r e d i c t i o n s , D test )
21:
save _ figure ( r o c _ c u r v e , path = . / roc _ curve . png )
22:
return  M trained

4. Experiment Verification

This technical solution performs a case analysis utilizing sample data from an iron-core current transformer in a domestic 110 kV third-generation smart substation, thereby demonstrating the advantages of this technology.
We obtained the original dataset from the historical monitoring data of the substation’s sensors. We extracted partial data from eight repeated experiments, with each experiment containing 1000 sample data points. This dataset includes data from healthy states (HLTY), single-phase short-circuit fault (1HCF) data, and double-phase short-circuit fault state data. The distribution of the sample data is presented in Table 1:
Table 2 presents some of the monitoring data used in our experiments, showcasing the key attributes of the dataset that serve as the foundation for our study. These attributes include various operational parameters of the current transformers, such as current values, voltage levels, power factor, temperature, humidity, and harmonic content, which were collected from the historical monitoring of the equipment. Additionally, statistical features like the mean, standard deviation, skewness, and kurtosis were derived from these data, further aiding the analysis.
The purpose of including this table is to provide readers with a clear understanding of the specific properties and characteristics of the data we utilized in our predictive maintenance experiments. It is not intended to directly illustrate relationships between the variables, but rather to highlight the key features that inform the fault prediction process. This table serves as a reference for understanding the dataset upon which the subsequent analysis and experiments are based.
After training the model on the training set using our predictive maintenance technology, we evaluated the classification prediction performance of the trained model on the test set. We first assessed the classification performance for each category through Receiver Operating Characteristic (ROC) curves (see Figure 7a). By analyzing the relationship between True Positive Rate (TPR) and False Positive Rate (FPR), we were able to reflect the model’s analytical capabilities at various thresholds. In Figure 7a, we plotted the macro-average ROC curve, which is derived from the macro-average values calculated from the FPR and TPR of all categories, thereby illustrating the model’s overall performance across all categories. The information presented in the figure indicates that the ROC curve shows a high Area Under Curve (AUC), approaching 1, indicating good overall prediction performance and effective discrimination between normal and fault states.
The ROC curve is constructed using the predicted probabilities generated by the model, which are plotted against the true labels (0 for normal and 1 for faults). The curves presented are not based on spline or polynomial fitting; rather, they are directly derived from the prediction results and the true labels. The area under the curve (AUC) value reflects the model’s ability to distinguish between the different classes, with a value closer to 1 indicating superior classification performance.
Although the model demonstrates strong overall classification capabilities, we generated a confusion matrix to comprehensively evaluate its performance and to better understand the differences in classification outcomes across various categories in the test set, as illustrated in Figure 7b. The results of the confusion matrix indicate that the model’s predictions for HLTY states are highly accurate, with nearly all true HLTY state samples correctly classified as HLTY. This reflects the model’s effectiveness in predicting normal states. While the overall accuracy for 1HCF states is also high, there are some instances of misclassification when identifying 2HCF states.
The final evaluation report is presented in Figure 8.
Here, 0 represents the 1HCF state, 1 represents the 2HCF state, and 2 represents the HLTY state.
Analyzing these results reveals that this technology has achieved an overall average prediction rate of 94%. The prediction accuracy for HLTY state data is particularly impressive, reaching an average of 100%, while the prediction for 1HCF state data averaged 84%. However, in predicting 2HCF states, the recognition accuracy requires improvement and optimization due to the subtle differences between 2HCF and 1HCF states, achieving only about 67%.
Through the analysis presented above, this study demonstrates that predictive maintenance technology for iron-core current transformers can effectively identify and predict equipment failures to a certain extent, utilizing historical state monitoring data. However, in the context of identifying specific short-circuit faults—particularly distinguishing between single-phase and double-phase short-circuit faults—the model’s recognition accuracy requires enhancement, as some misclassifications are still evident.

5. Conclusions

The primary objective of this study is to develop a predictive maintenance method for core-type current transformers that can effectively identify and forecast fault conditions based on historical monitoring data. The proposed method integrates wavelet transform, the Spearman correlation coefficient, Mutual Information, and a Random Forest classification model. This approach aims to address the limitations of traditional maintenance strategies, such as excessive maintenance and the inability to accurately predict faults. According to the experimental results, the proposed method successfully achieved its main objectives, attaining an overall prediction accuracy of 94%. The model demonstrated exceptional performance in identifying the HLTY state, achieving an accuracy of 100%, and the 1HCF state, with an accuracy of 84%. These results indicate that the proposed method is both stable and effective for these two operating states of the current transformer. However, the findings also revealed limitations in identifying the 2HCF state, which exhibited a relatively low prediction accuracy of 67%. This may be attributed to subtle feature differences between the 1HCF and 2HCF states, the limited number of 2HCF samples, or the influence of other unlabeled fault conditions. This observation underscores the necessity for further research to enhance the framework’s ability to classify overlapping fault type features and to consider the identification and prediction of additional unlabeled fault conditions. Overall, the results indicate that the proposed method can effectively identify specific fault conditions in current transformers based on historical detection data. This approach offers a practical and efficient solution for predictive maintenance, enhancing the stability and safety of power systems while simultaneously reducing maintenance costs and downtime. In future work, we plan to address some limitations of this study by expanding the dataset to encompass additional fault conditions, such as partial discharge and three-phase short circuits. Furthermore, we aim to explore more advanced machine learning and deep learning models to further enhance the accuracy and reliability of fault identification and prediction in the real-world power industry, ultimately ensuring greater reliability and efficiency of power system equipment.

Author Contributions

H.H., K.X. and X.Z. designed the project and drafted the manuscript, as well as collected the data. F.L., L.Z., R.X. and D.L. wrote the code and performed the analysis. All authors have read and agreed to the published version of the manuscript.

Funding

This research was funded by the Science and Technology Project of State Grid Hubei Electric Power Co., Ltd., Xiaogan Power Supply Company (Research on proactive warning method of abnormal operation of substation equipment based on deep learning).

Data Availability Statement

The data presented in this study are available in this article.

Conflicts of Interest

The authors Huan Hu, Kang Xu, Xianya Zhang, Fangjing Li and Lingling Zhu were employed by the company State Grid Hubei Electric Power Co., Ltd. Xiaogan Power Supply Company. The remaining authors declare that the research was conducted in the absence of any commercial or financial relationships that could be construed as a potential conflict of interest.

References

  1. Molęda, M.; Małysiak-Mrozek, B.; Ding, W.; Sunderam, V.; Mrozek, D. From corrective to predictive maintenance—A review of maintenance approaches for the power industry. Sensors 2023, 23, 5970. [Google Scholar] [CrossRef]
  2. Mao, K.; Wu, F.; Xue, H. Innovation in Data-Based Predictive Maintenance Methods. Equip. Manag. Maint. 2023, 32–34. [Google Scholar]
  3. Zonta, T.; Da Costa, C.A.; da Rosa, R.R.; de Lima, M.J.; da Trindade, E.S.; Li, G.P. Predictive maintenance in the Industry 4.0: A systematic literature review. Comput. Ind. Eng. 2020, 150, 106889. [Google Scholar] [CrossRef]
  4. Zhang, W.; Yang, D.; Wang, H. Data-driven methods for predictive maintenance of industrial equipment: A survey. IEEE Syst. J. 2019, 13, 2213–2227. [Google Scholar] [CrossRef]
  5. Divya, D.; Marath, B.; Santosh Kumar, M.B. Review of fault detection techniques for predictive maintenance. J. Qual. Maint. Eng. 2023, 29, 420–441. [Google Scholar] [CrossRef]
  6. Velásquez, R.M.A.; Lara, J.V.M. Current transformer failure caused by electric field associated to circuit breaker and pollution in 500 kV substations. Eng. Fail. Anal. 2018, 92, 163–181. [Google Scholar] [CrossRef]
  7. Wu, Z.; Huang, T.; Wang, C.; Wu, X.; Tu, Y. Transformer Fault Diagnosis and Location Method Based on Fault Tree Analysis. Scalable Comput. Pract. Exp. 2024, 25, 3587–3593. [Google Scholar] [CrossRef]
  8. Gupta, A.; Demiroglu, M.; Isaacs, N. Analysis of Offshore Platform Current Transformer Failures. In Proceedings of the 2022 IEEE IAS Petroleum and Chemical Industry Technical Conference (PCIC), Denver, CO, USA, 26–29 September 2022; pp. 245–252. [Google Scholar]
  9. Khalyasmaa, A.I.; Senyuk, M.D.; Eroshenko, S.A. Analysis of the state of high-voltage current transformers based on gradient boosting on decision trees. IEEE Trans. Power Deliv. 2020, 36, 2154–2163. [Google Scholar] [CrossRef]
  10. Alhamd, Q.; Saniei, M.; Seifossadat, S.G.; Mashhour, E. Advanced Fault Detection in Power Transformers Using Improved Wavelet Analysis and LSTM Networks Considering Current Transformer Saturation and Uncertainties. Algorithms 2024, 17, 397. [Google Scholar] [CrossRef]
  11. Cerezo, J.; Kubelka, J.; Robbes, R.; Bergel, A. Building an expert recommender chatbot. In Proceedings of the 2019 IEEE/ACM 1st International Workshop on Bots in Software Engineering (BotSE), Montreal, QC, Canada, 28 May 2019; pp. 59–63. [Google Scholar]
  12. Guo, W.; Zhang, T.; Lü, Y.; Chen, T. Power System Transient Fault Event Diagnosis Method Based on Knowledge Base and Rule Base. Microcomput. Appl. 2023, 39, 103–105, 125. [Google Scholar]
  13. Wang, Q. Open Circuit Fault Diagnosis of PMSM Drive System Considering Model Predictive Control. Master’s Thesis, Anhui University, Hefei, China, 2020. [Google Scholar]
  14. Li, M. Parallel Inference RF-Based Circuit Fault Diagnosis Technology Using a Multi-Signal Model. Master’s Thesis, University of Electronic Science and Technology of China, Chengdu, China, 2022. [Google Scholar]
  15. Keleko, A.T.; Kamsu-Foguem, B.; Ngouna, R.H.; Tongne, A. Artificial intelligence and real-time predictive maintenance in industry 4.0: A bibliometric analysis. AI Ethics 2022, 2, 553–577. [Google Scholar] [CrossRef]
  16. Xu, G.; Liu, M.; Wang, J.; Ma, Y.; Wang, J.; Li, F.; Shen, W. Data-driven fault diagnostics and prognostics for predictive maintenance: A brief overview. In Proceedings of the 2019 IEEE 15th International Conference on Automation Science and Engineering (CASE), Vancouver, BC, Canada, 22–26 August 2019; pp. 103–108. [Google Scholar]
  17. Chen, X.; Zhang, C.; Zhang, H.; Cheng, Z.; Xu, Y.; Yan, Y.; Ou, L.; Su, Y. Error prediction of VMD-GRU current transformer based on bayesian optimization. J. Physics Conf. Ser. IOP Publ. 2024, 2835, 012055. [Google Scholar] [CrossRef]
  18. Wang, K.; Li, H.; Li, H.; Gao, J. Error Model and Forecasting Method for Electronic Current Transformers Based on LSTM. Tehnički Vjesnik 2023, 30, 399–407. [Google Scholar]
  19. Li, Z.; Chen, X.; Wu, L.; Ahmed, A.S.; Wang, T.; Zhang, Y.; Li, H.; Li, Z.; Xu, Y.; Tong, Y. Error analysis of air-core coil current transformer based on stacking model fusion. Energies 2021, 14, 1912. [Google Scholar] [CrossRef]
  20. Liu, B.; Deng, X.; Liu, Y.; Tang, P.; Wang, X.; Xu, M. A Fault Diagnosis Method of Electronic Current Transformer Based on Deep Learning. In Proceedings of the 2024 3rd Asian Conference on Frontiers of Power and Energy (ACFPE), Chengdu, China, 25–27 October 2024; pp. 379–386. [Google Scholar]
  21. Wang, S.; Liang, D.; Li, J.; Tang, C.; Xiao, Y.; Yin, W. Research on Transformer Temperature Rise Detection Based on Faster RCNN. In Proceedings of the 2023 IEEE International Conference on Applied Superconductivity and Electromagnetic Devices (ASEMD), Tianjin, China, 27–29 October 2023; pp. 1–2. [Google Scholar]
  22. Zhang, Z.; Yin, R.J.; Gong, B. A Power System Fault Diagnosis Method Based on Wavelet Transform. Electr. Technol. Econ. 2024, 391–392, 399. [Google Scholar]
Figure 1. Predictive maintenance methods.
Electronics 14 00625 g001
Figure 2. Technical architecture diagram for predictive maintenance of iron-core current transformers.
Electronics 14 00625 g002
Figure 3. Plot of raw current signal: (a) all, (b) HLTY, (c) 1HCF, and (d) 2HCF.
Electronics 14 00625 g003
Figure 4. Proposed data preprocessing pipeline for current transformer fault diagnosis.
Electronics 14 00625 g004
Figure 5. Proposed feature selection process for current transformer fault diagnosis.
Electronics 14 00625 g005
Figure 6. Scatter plot of R( x i ) and R( y i ).
Electronics 14 00625 g006
Figure 7. Comparison of ROC curve and confusion matrix. (a) Receiver Operating Characteristic (ROC) Curve. (b) Confusion matrix.
Electronics 14 00625 g007
Figure 8. Results evaluation report diagram.
Electronics 14 00625 g008
Table 1. Data status statistics in the dataset.
Data NumberCurrent Transformer StatusSample Size
D 1Health Status (HLTY)700
D 2Single-Phase Short-Circuit Fault (1HCF)200
D 3Two-Phase Short-Circuit Fault (2HCF)100
Table 2. Part of the current transformer detection data table.
Data NumberCurrent Value (A)Voltage Value (kV)Power FactorTemperature (°C)Humidity (%)Frequency (Hz)Harmonic Content (%)Load Status (%)Status Tags
18001100.9523.14250.11.20.7HLTY
210001100.8634.54750.02.50.851HCF
311001100.8937.85149.82.10.92HCF
412001100.9222.84050.21.30.65HLTY
510501100.8735.24649.92.20.81HCF
611501100.8538.15249.72.80.922HCF
79001100.9325.34350.11.50.72HLTY
811001100.8833.94850.02.00.881HCF
911501100.8636.25049.92.70.872HCF
109501100.9424.04550.31.40.68HLTY
1111001100.8734.74750.02.10.821HCF
1212001100.8937.45249.62.60.912HCF
1310001100.9125.04450.21.30.74HLTY
1411001100.9034.14650.02.20.831HCF
1511001100.8338.05349.82.90.932HCF
Disclaimer/Publisher’s Note: The statements, opinions and data contained in all publications are solely those of the individual author(s) and contributor(s) and not of MDPI and/or the editor(s). MDPI and/or the editor(s) disclaim responsibility for any injury to people or property resulting from any ideas, methods, instructions or products referred to in the content.

