1. Introduction
Heavy-haul railways are recognised around the world as a mode of transport for bulk goods that is both environmentally sound and highly efficient. In the course of the last three decades, concurrent with China’s accelerated socio-economic and technological progress, heavy-haul railways such as the Daqin and Shuohuang lines have undergone rapid development. Within China’s heavy-haul rail transport system, 20,000 tonne heavy-haul combined trains have achieved large-scale operation through their exceptional transport capacity [
1], becoming the predominant formation among various heavy-haul train configurations. This configuration comprises two locomotives and over 200 freight wagons, forming a distributed power train that collectively achieves the traction task for trains with a total weight in excess of 20,000 tonnes. The air braking system is the primary critical system for safely completing traction tasks, serving as the main control system for achieving deceleration, stopping, and preventing runaway functions in heavy-haul trains. The train brake pipe functions as the solitary conduit traversing the entire heavy-haul combination train, thereby facilitating both air braking and overrun control. The braking system of the 20,000 tonne combined train comprises a main line extending over 2.6 km. It is evident that, due to the exceptional length of the physical structure, the internal gas state is susceptible to external interference. This, in turn, has the potential to cause abnormal pressure fluctuations within the piping system [
2]. As the train brake pipe remains at constant pressure prior to pressure-reduction braking, external temperature effects primarily manifest as temperature increases causing a rise in brake pipe pressure. Should such fluctuations occur during the initial braking phase, the elevated pressure will compound the pressure reduction, directly causing the actual pressure reduction to exceed the preset range (e.g., exceeding 55 kPa). This will result in an abnormal increase in the train’s overall braking force. The implementation of relief operations in such conditions gives rise to substantial longitudinal impulses between carriages, thereby posing a grave threat to operational safety and equipment longevity. In order to mitigate the aforementioned risk, the locomotive operations management department has mandated emergency stops for relief when train pipe pressure reduction exceeds 55 kPa [
3]. While this measure is undoubtedly effective in controlling impulse hazards, the increased frequency of en-route stops has a direct impact on the operational efficiency of mainline rail transport organisation. Statistics indicate that in 2022, over 300 instances of heavy-haul train deceleration occurred due to excessive pressure reduction in the pipe system. During the winter and spring seasons of 2023 and 2024, numerous similar stoppages persisted, occurring approximately seven times weekly. This significantly impedes transport efficiency and may pose operational safety risks. Consequently, investigating the causes of pressure fluctuations and the resulting variations in braking force has become crucial work for further exploring the operational patterns of heavy-haul trains and preventing the occurrence of both ‘grey rhino’ and ‘black swan’ events.
The present study systematically analyses the causes of brake pipe pressure fluctuations. This is achieved by means of an analysis of operational data from heavy-haul trains on the Daqin Railway, incorporating the working principles of the air braking system. The study’s primary objective is to examine the impact of external factors, including ambient temperature and atmospheric pressure, on these fluctuations. Moreover, addressing operational requirements, it investigates computational methods for assessing the influence of main brake pipe pressure variations on train braking force. The objective of this research is to establish a theoretical framework to optimise operating strategies, thereby enhancing operational safety and transport efficiency.
2. Principles of Operation for Train Air Braking Systems
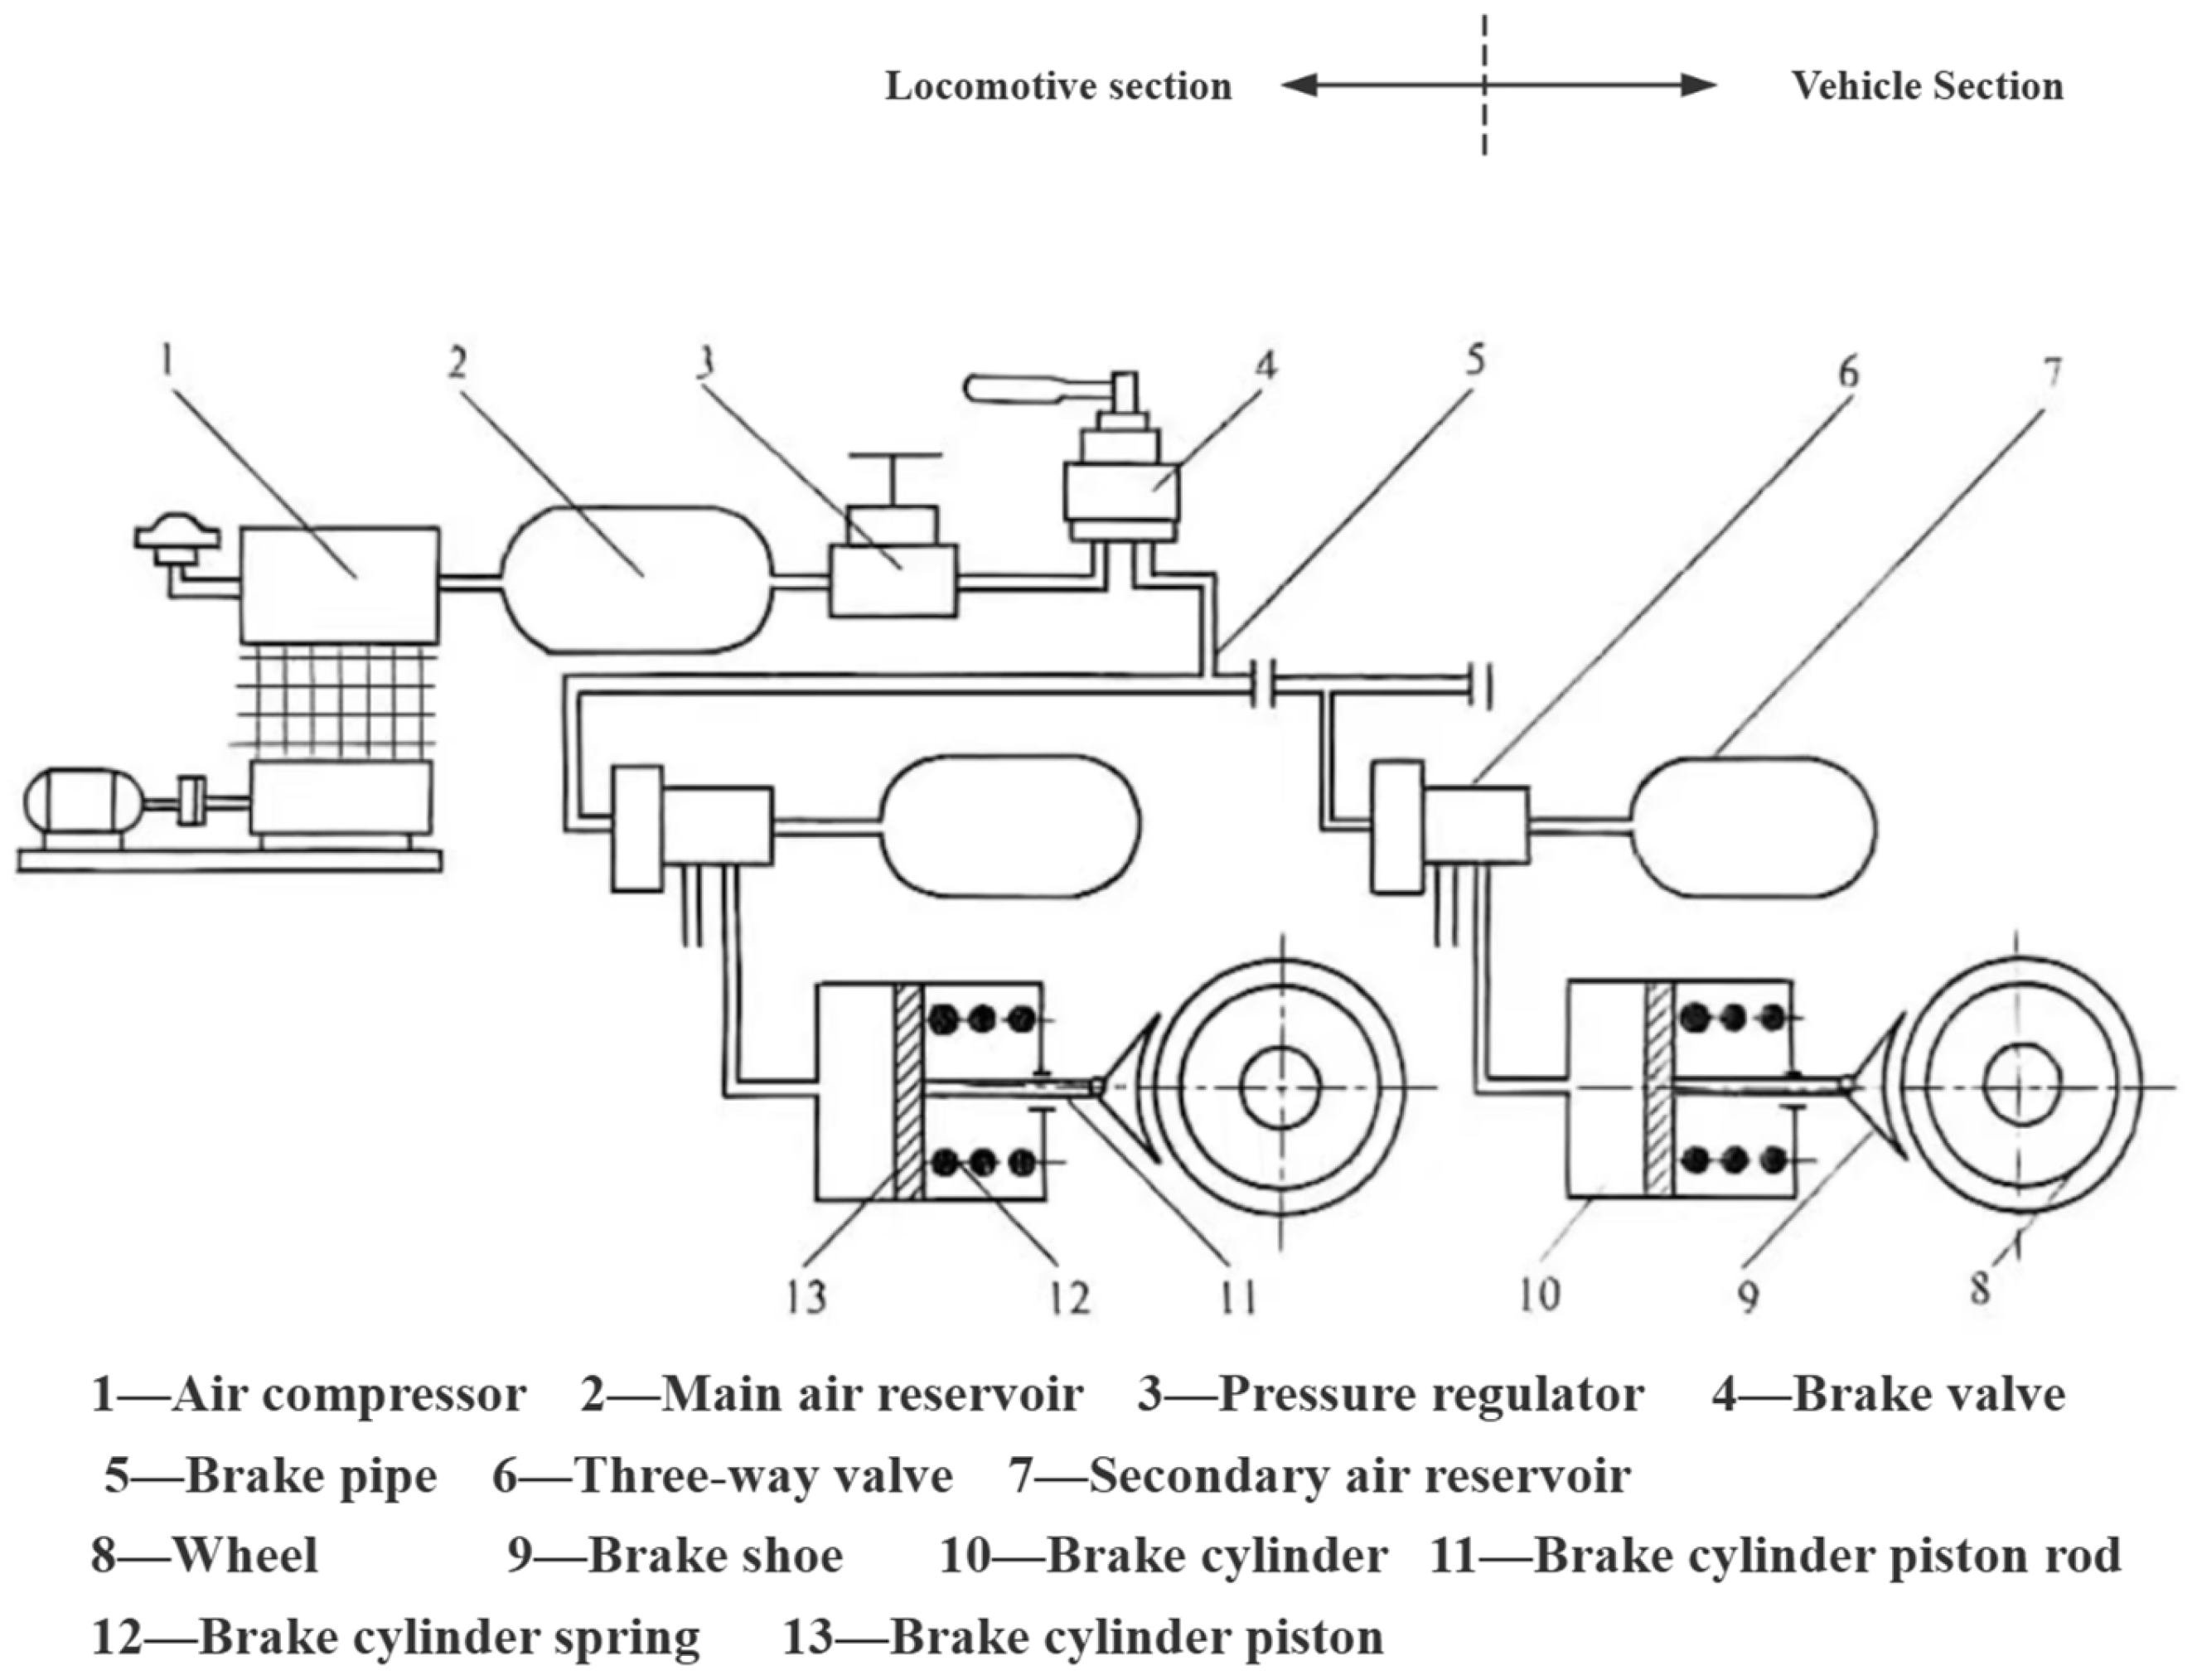
The operating principle of the train air braking system is illustrated in
Figure 1 [
4]. The locomotive brake control unit functions as the command centre for the train’s air braking system. During the process of train release, the locomotive driver manipulates the handle to direct compressed air from the locomotive master cylinder into the train pipe, thereby pressurising it [
5]. Concurrently, the brake cylinders of freight vehicles vent air, thereby allowing the brake shoes to disengage from the wheels under the action of return springs and vibration, thus releasing the braking state of the vehicles [
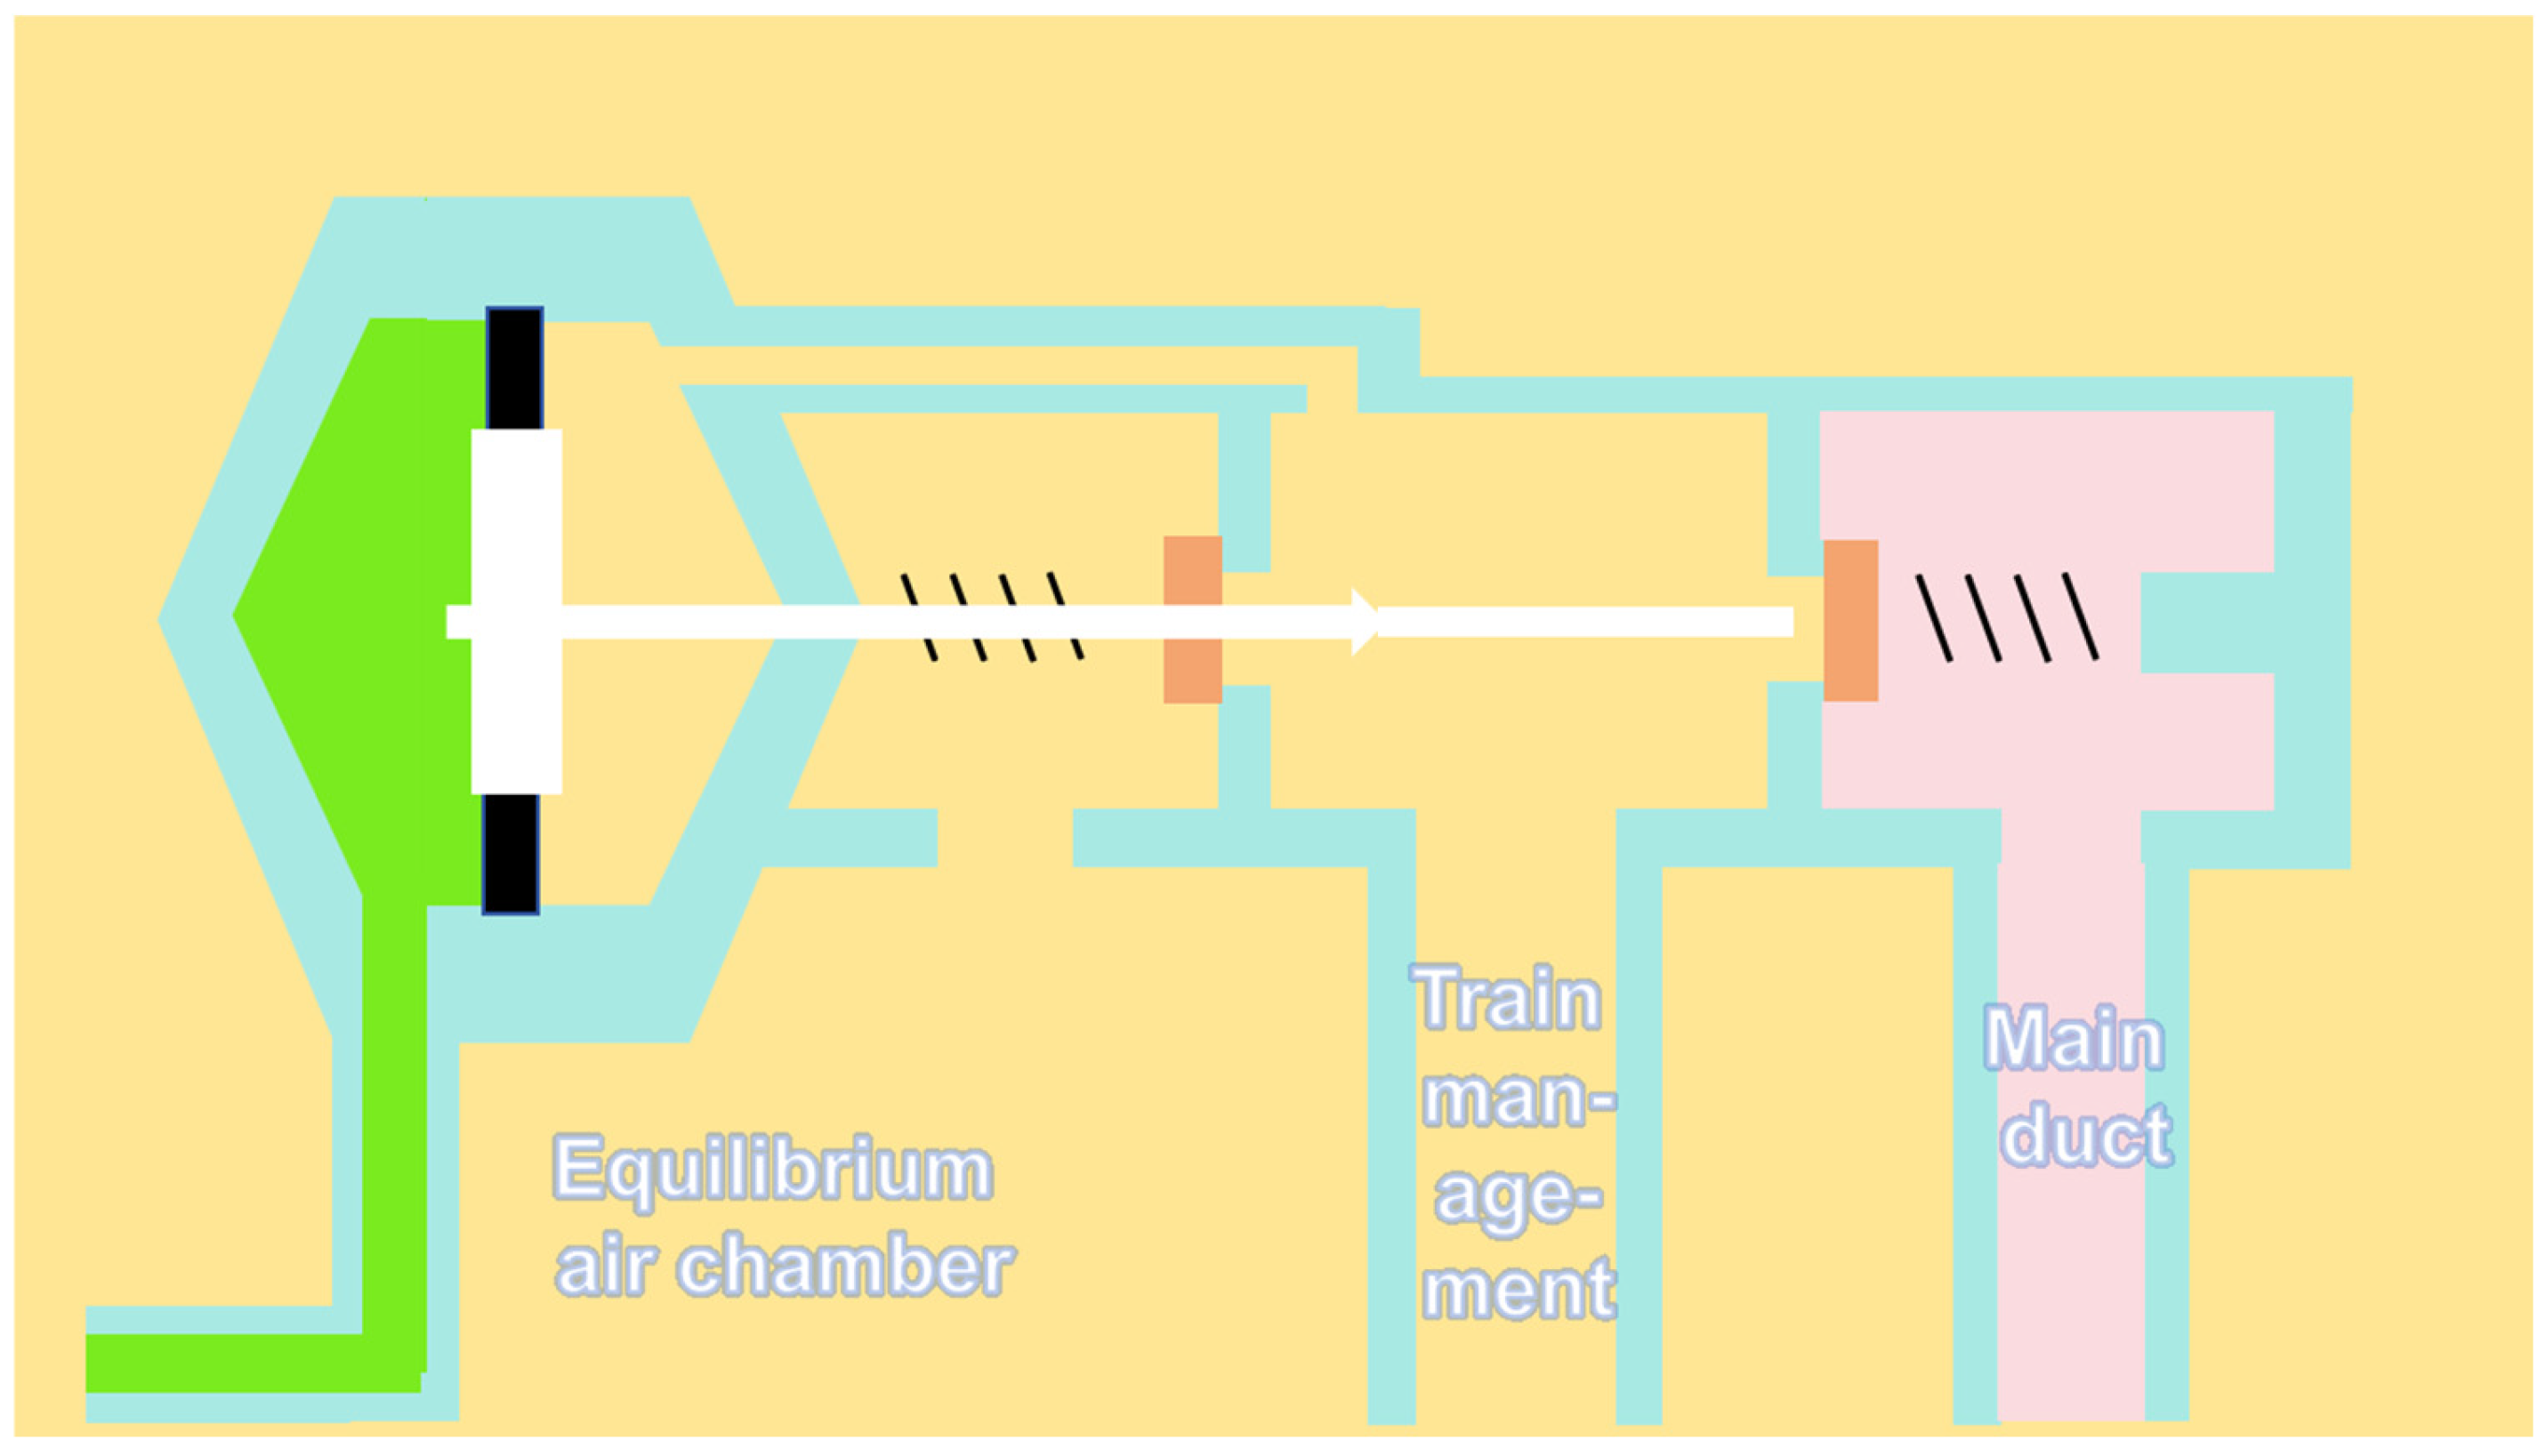
6]. The air-charging process is continued until the pressure in both the train pipe and the auxiliary air chambers of all freight vehicles reaches the predetermined set pressure. The application of the train brakes by the locomotive driver involves the operation of the handle to control the locomotive brake valve, resulting in the discharge of compressed air from the train pipe into the atmosphere. This results in a rapid decline in train pipe pressure. The freight vehicle brake control valve utilises the train pipe pressure reduction as its control input signal. The system functions by directing compressed air from the auxiliary air chamber, in conjunction with a proportion of air from the train pipe, into the brake cylinder. Within the brake cylinder, the compressed air drives the piston and piston rod, forcing the brake shoes to press against the wheels and thereby apply the vehicle brake. It can thus be concluded that, upon attaining full pressurisation, the rate of pressure reduction within the train pipe becomes the predominant factor in determining the magnitude of the train’s braking force. In the context of locomotives, the brake system functions by regulating train pipe pressure via the equalising air chamber. The underlying control principle is illustrated in
Figure 2. During braking and release operations, the pressure of the train pipe is controlled by the pressure within the air chamber.
3. Synchronous Acquisition Solution for Locomotive Braking Systems and Environmental Data
A thorough examination of long-term tracking test data has substantiated the notion that ambient temperature exerts a significant influence on fluctuations in train pipe pressure. In order to further investigate the impact of environmental variations on train pipe pressure control, a data monitoring system suitable for railway locomotives must be designed. This system is designed to concurrently collect locomotive operational data alongside train running environment parameters, whilst performing computational processing and data storage functions.
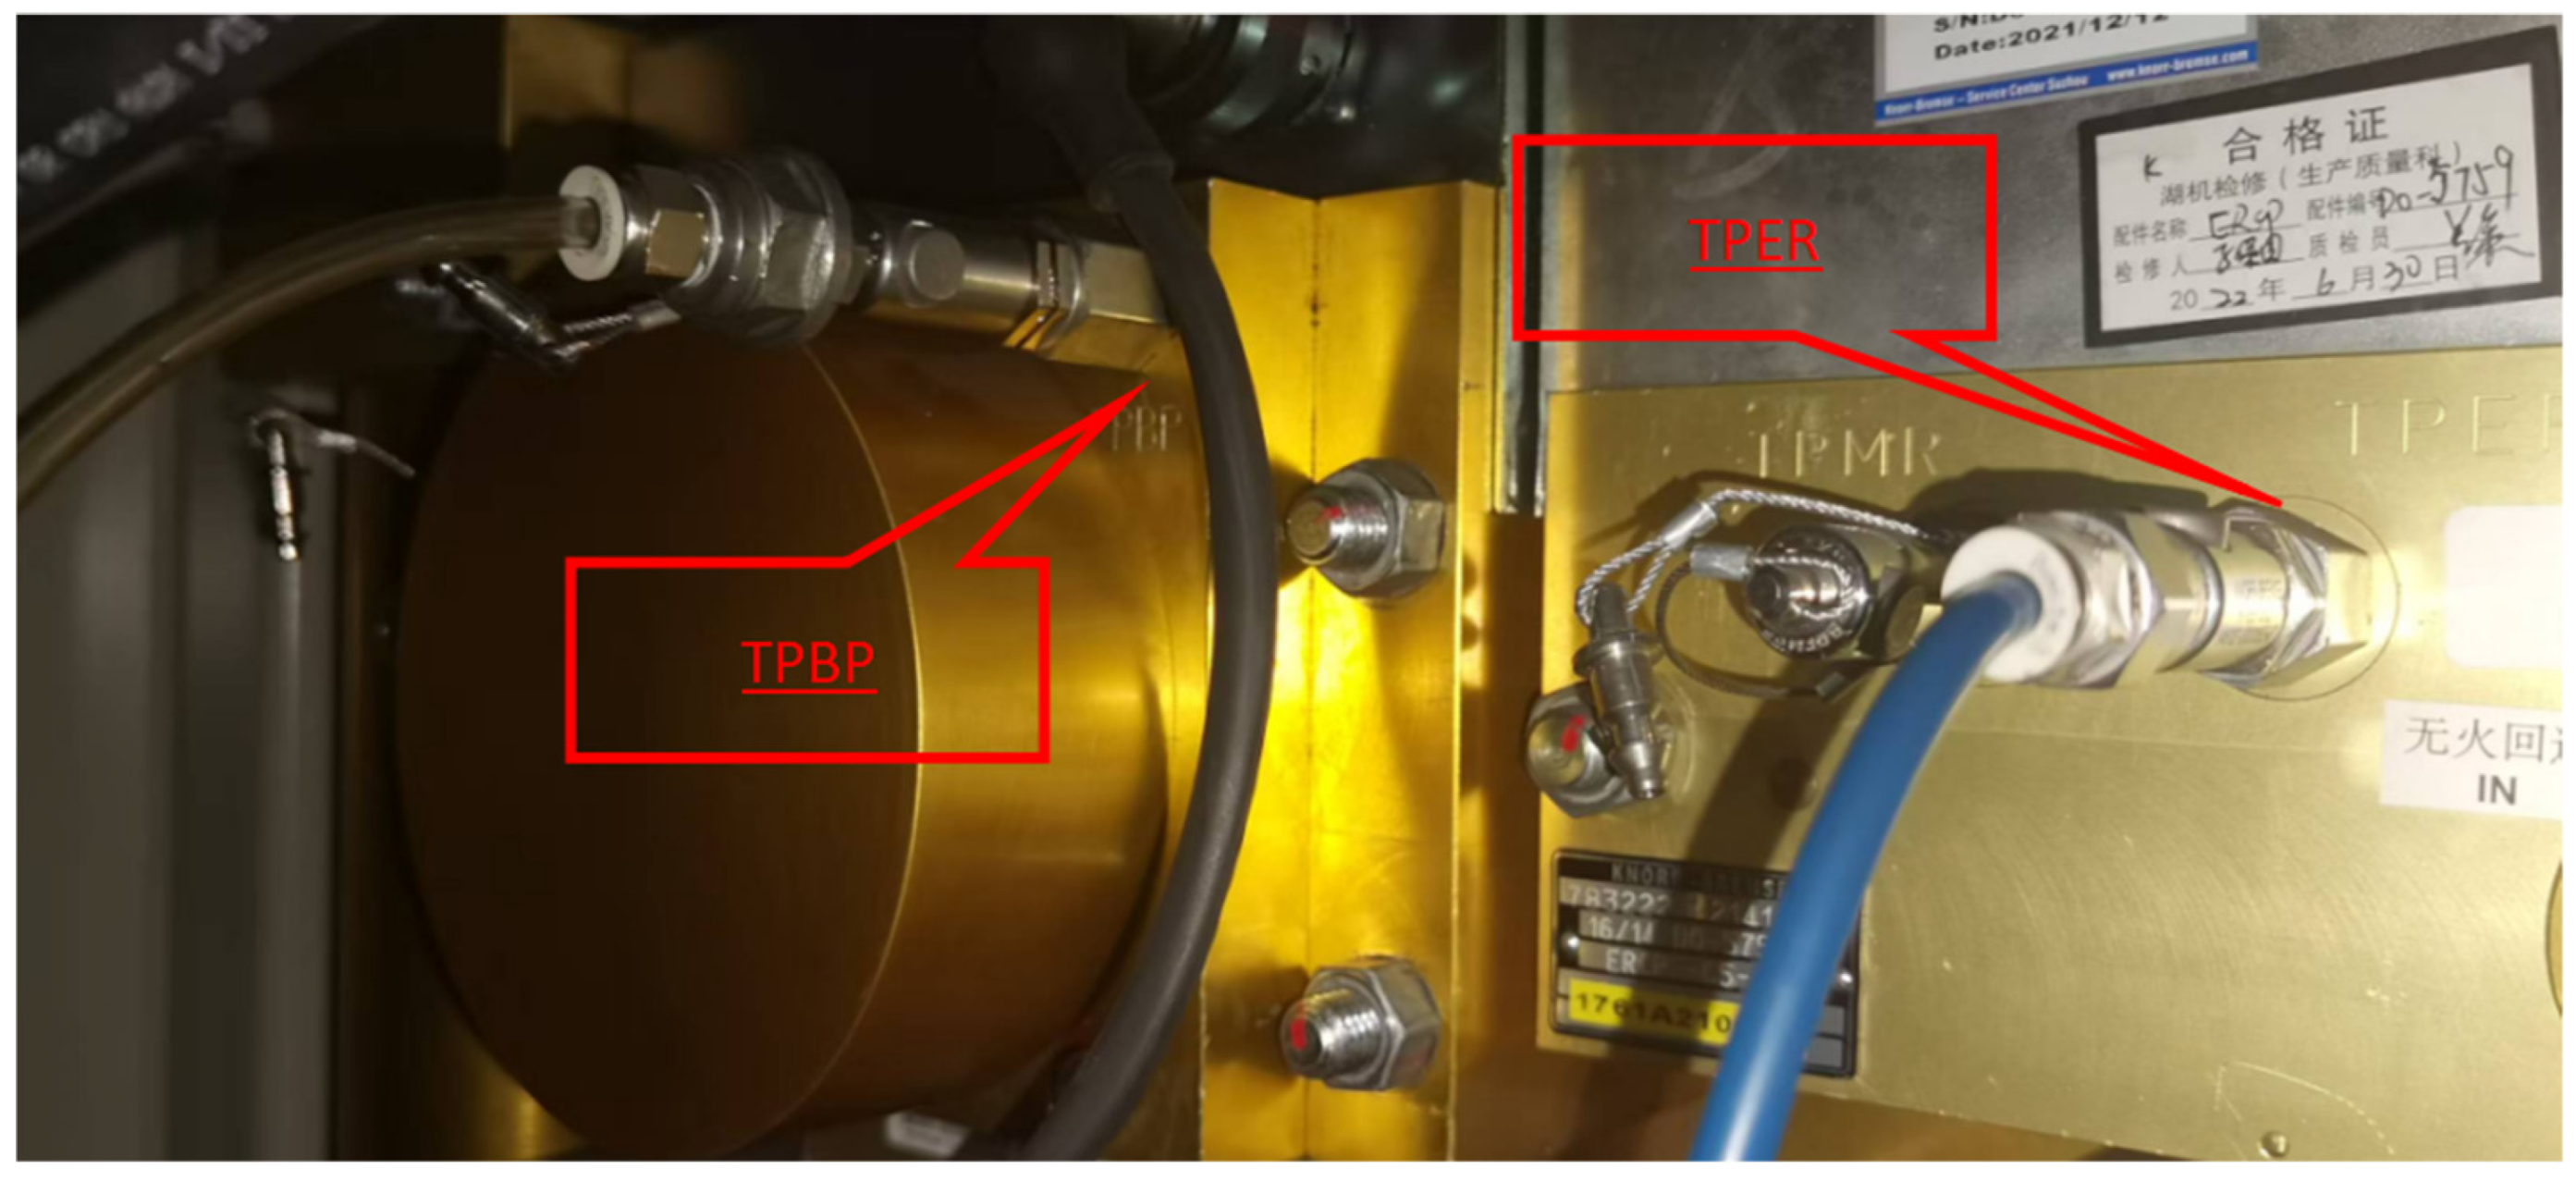
According to the principles of the train air braking system, the magnitude of braking force generated by the air brakes is determined by the pressure reduction in the train pipe. This pressure reduction is achieved by the locomotive brake valve controlling the pressure in the brake reservoir. Consequently, the key parameters for monitoring the braking system of heavy-duty locomotives primarily include the pressure characteristics of the brake reservoir and the train pipe. The locomotive brake valve incorporates dedicated test ports: TPER for the brake reservoir pressure and TPBP for the train pipe pressure (see
Figure 3). During testing, pressure sensors may be connected to these ports via adaptors to enable real-time monitoring of both reservoir and train pipe pressure data. The specified pressure measurement parameters are detailed in
Table 1.
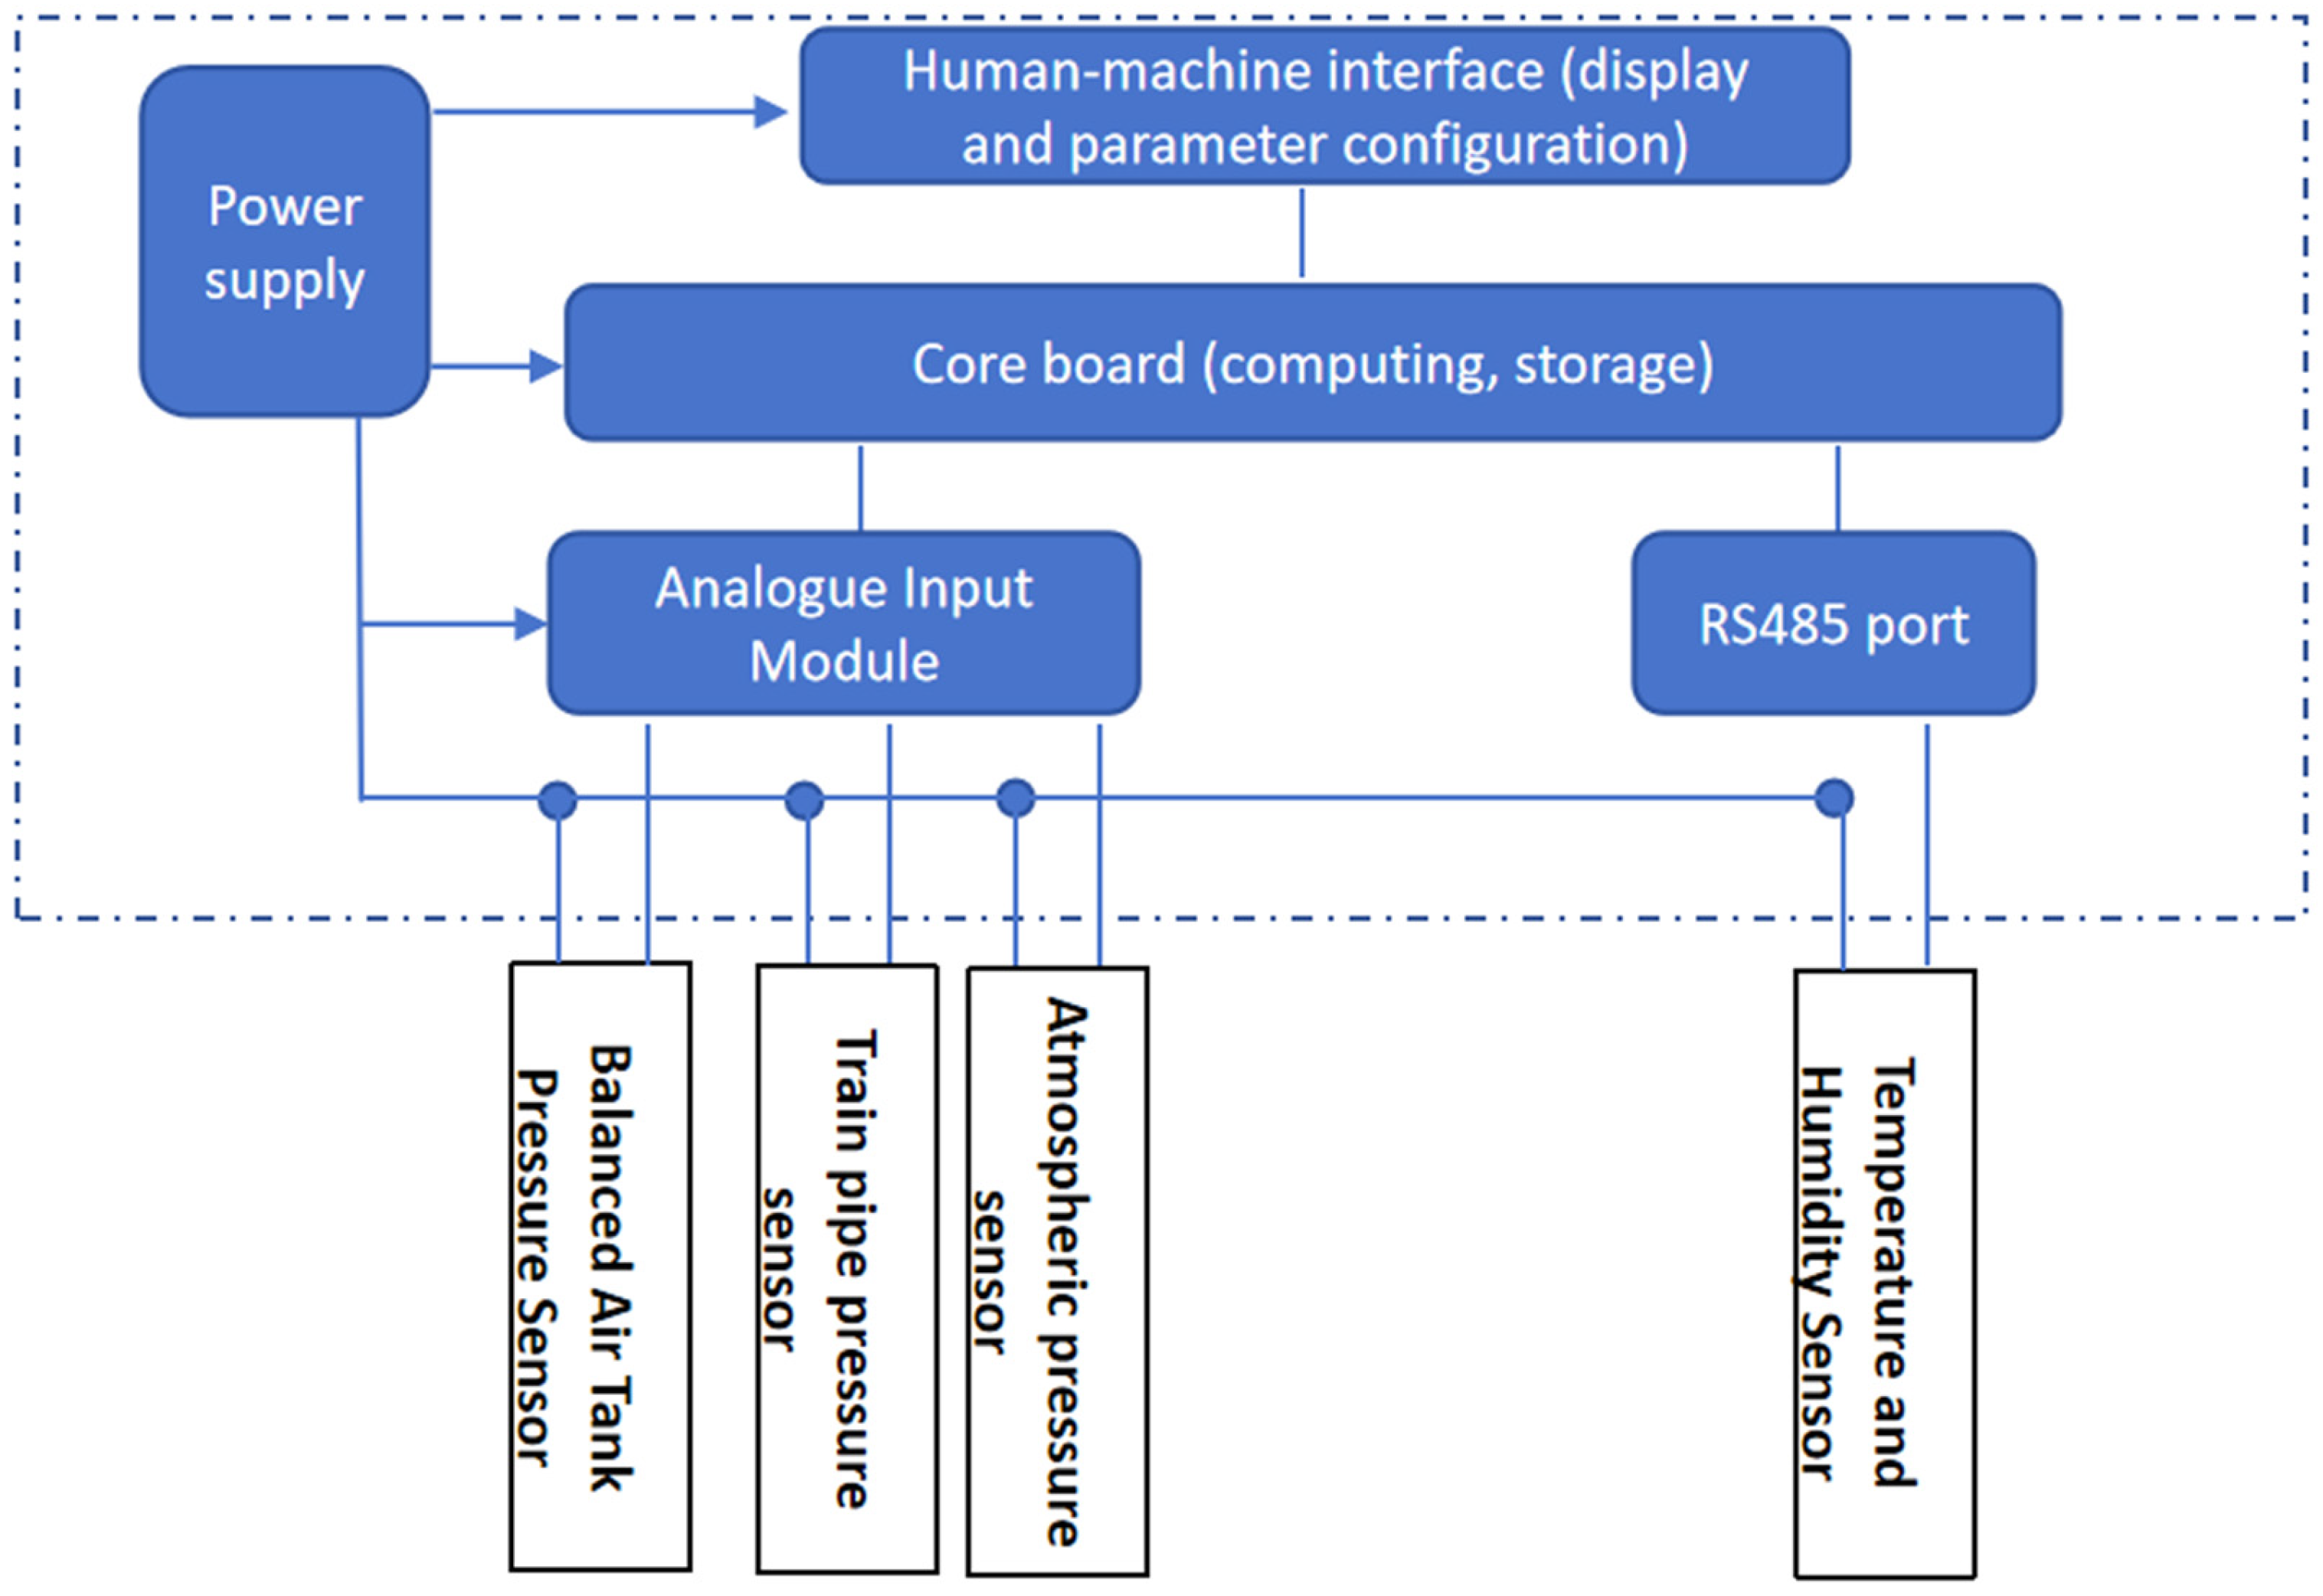
Environmental parameters primarily involve the acquisition of ambient temperature and humidity. Utilising temperature and humidity sensors connected via an RS485 bus to the monitoring host’s 485 port, these readings are synchronously recorded alongside locomotive braking system pressure data. The environmental sensor parameter table is presented in
Table 2.
In this manner, both the train braking system and environmental parameters are recorded on the same time axis, enabling synchronised data acquisition. The schematic diagram of the monitoring system’s composition is shown in
Figure 4.
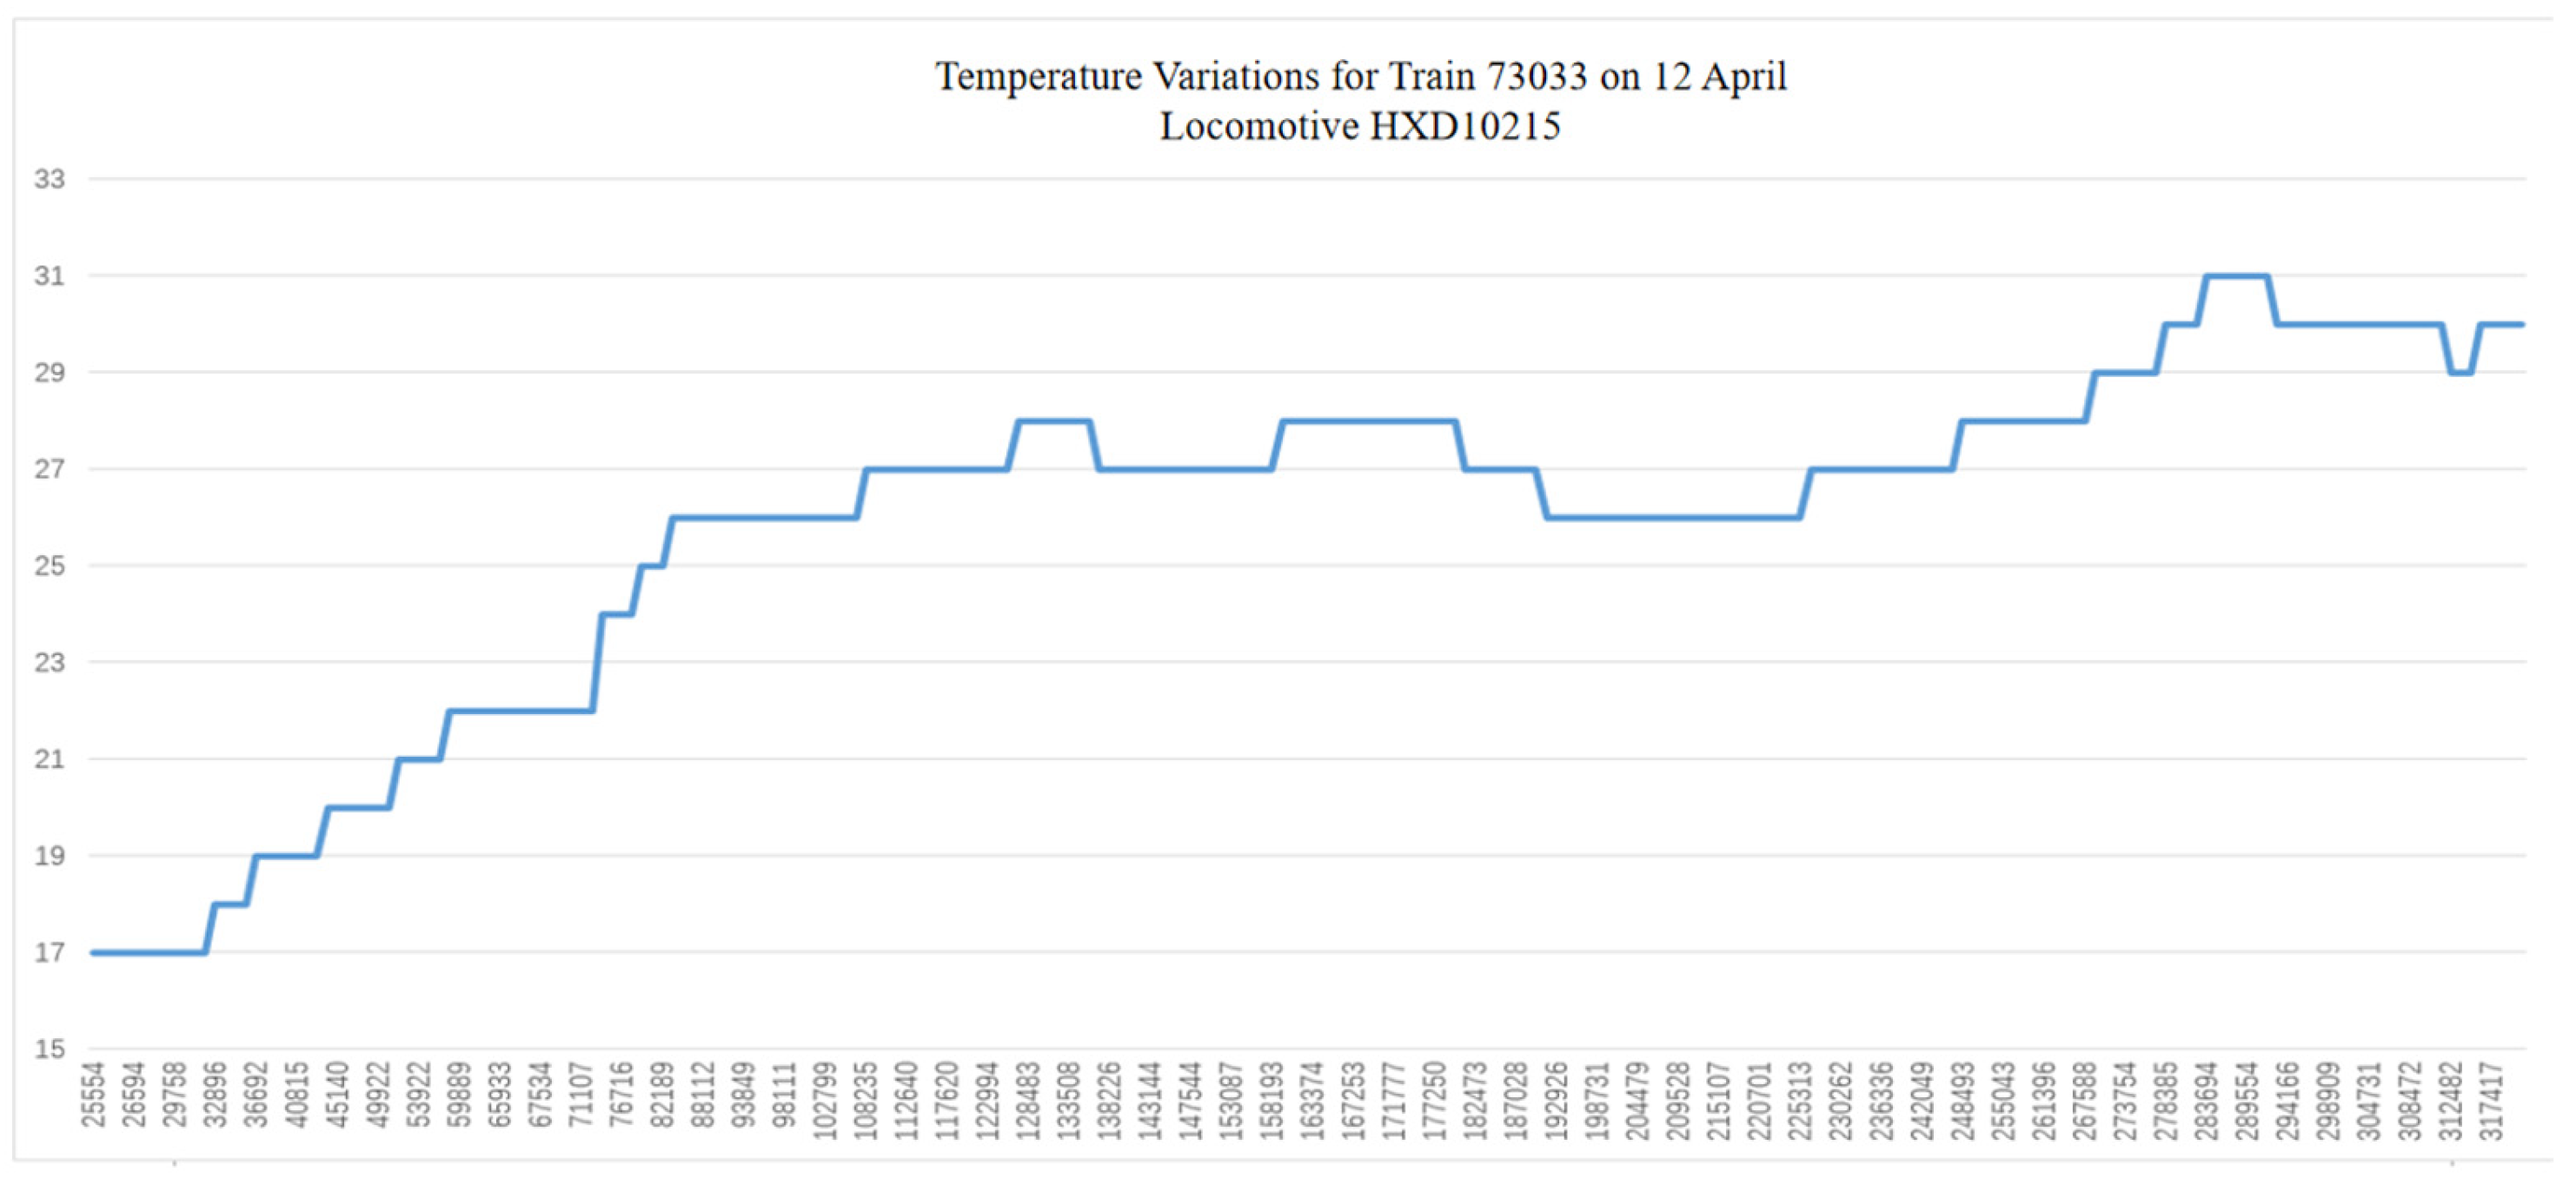
In April 2024, the monitoring system detected abnormal increases in brake pipe pressure across five trains travelling between Hudong and Chawu stations on the Daqin Railway. These incidents exhibited identical patterns of change.
Figure 5 displays the ‘temperature–geographical location’ data curve monitored on 12 April.
The data indicates that following the train’s departure from Hudong No. 2 Depot (with the kilometre marker approximately at K25km+500m when the button was pressed), the operating temperature gradually rose from 17 °C to 25.5 °C until reaching K82km+112m. This temperature increase occurred during the period from 19:06:00 to 21:46:30, Over approximately 2 h and 40 min of operation, the temperature increased by 8.5 °C. Notably, the section at K64km on the Daqin Line—where abnormal increases in train pipe pressure are frequently reported—falls precisely within this interval of sustained temperature rise.
During actual operation, heavy-load trains apply air brakes near K64km for speed regulation purposes. Prior to braking, the main pipe pressure of these trains gradually increases due to sustained temperature rise. During the braking process, this elevated pressure compounds with the required pressure reduction, causing the total pressure reduction to increase significantly. This may even exceed 55 kPa, reaching the pressure reduction threshold necessitating a stop for relief. As this location frequently experiences train pipe pressure reductions exceeding 55 kPa, necessitating a stop for relief, it has garnered significant attention from locomotive operations management departments. Field operational statistics indicate that pressure increases in the train brake pipe are particularly prevalent during spring, especially in April. Instances where excessive pressure rise causes relief stops account for over half of all relief stops recorded at this location. In reality, monitoring data indicates that following braking at K64km, ambient temperatures continue to rise. Consequently, brake pipe pressure may still increase after train relief. However, as air brakes are not applied for an extended period thereafter, this phenomenon has not drawn the attention of operational management personnel.
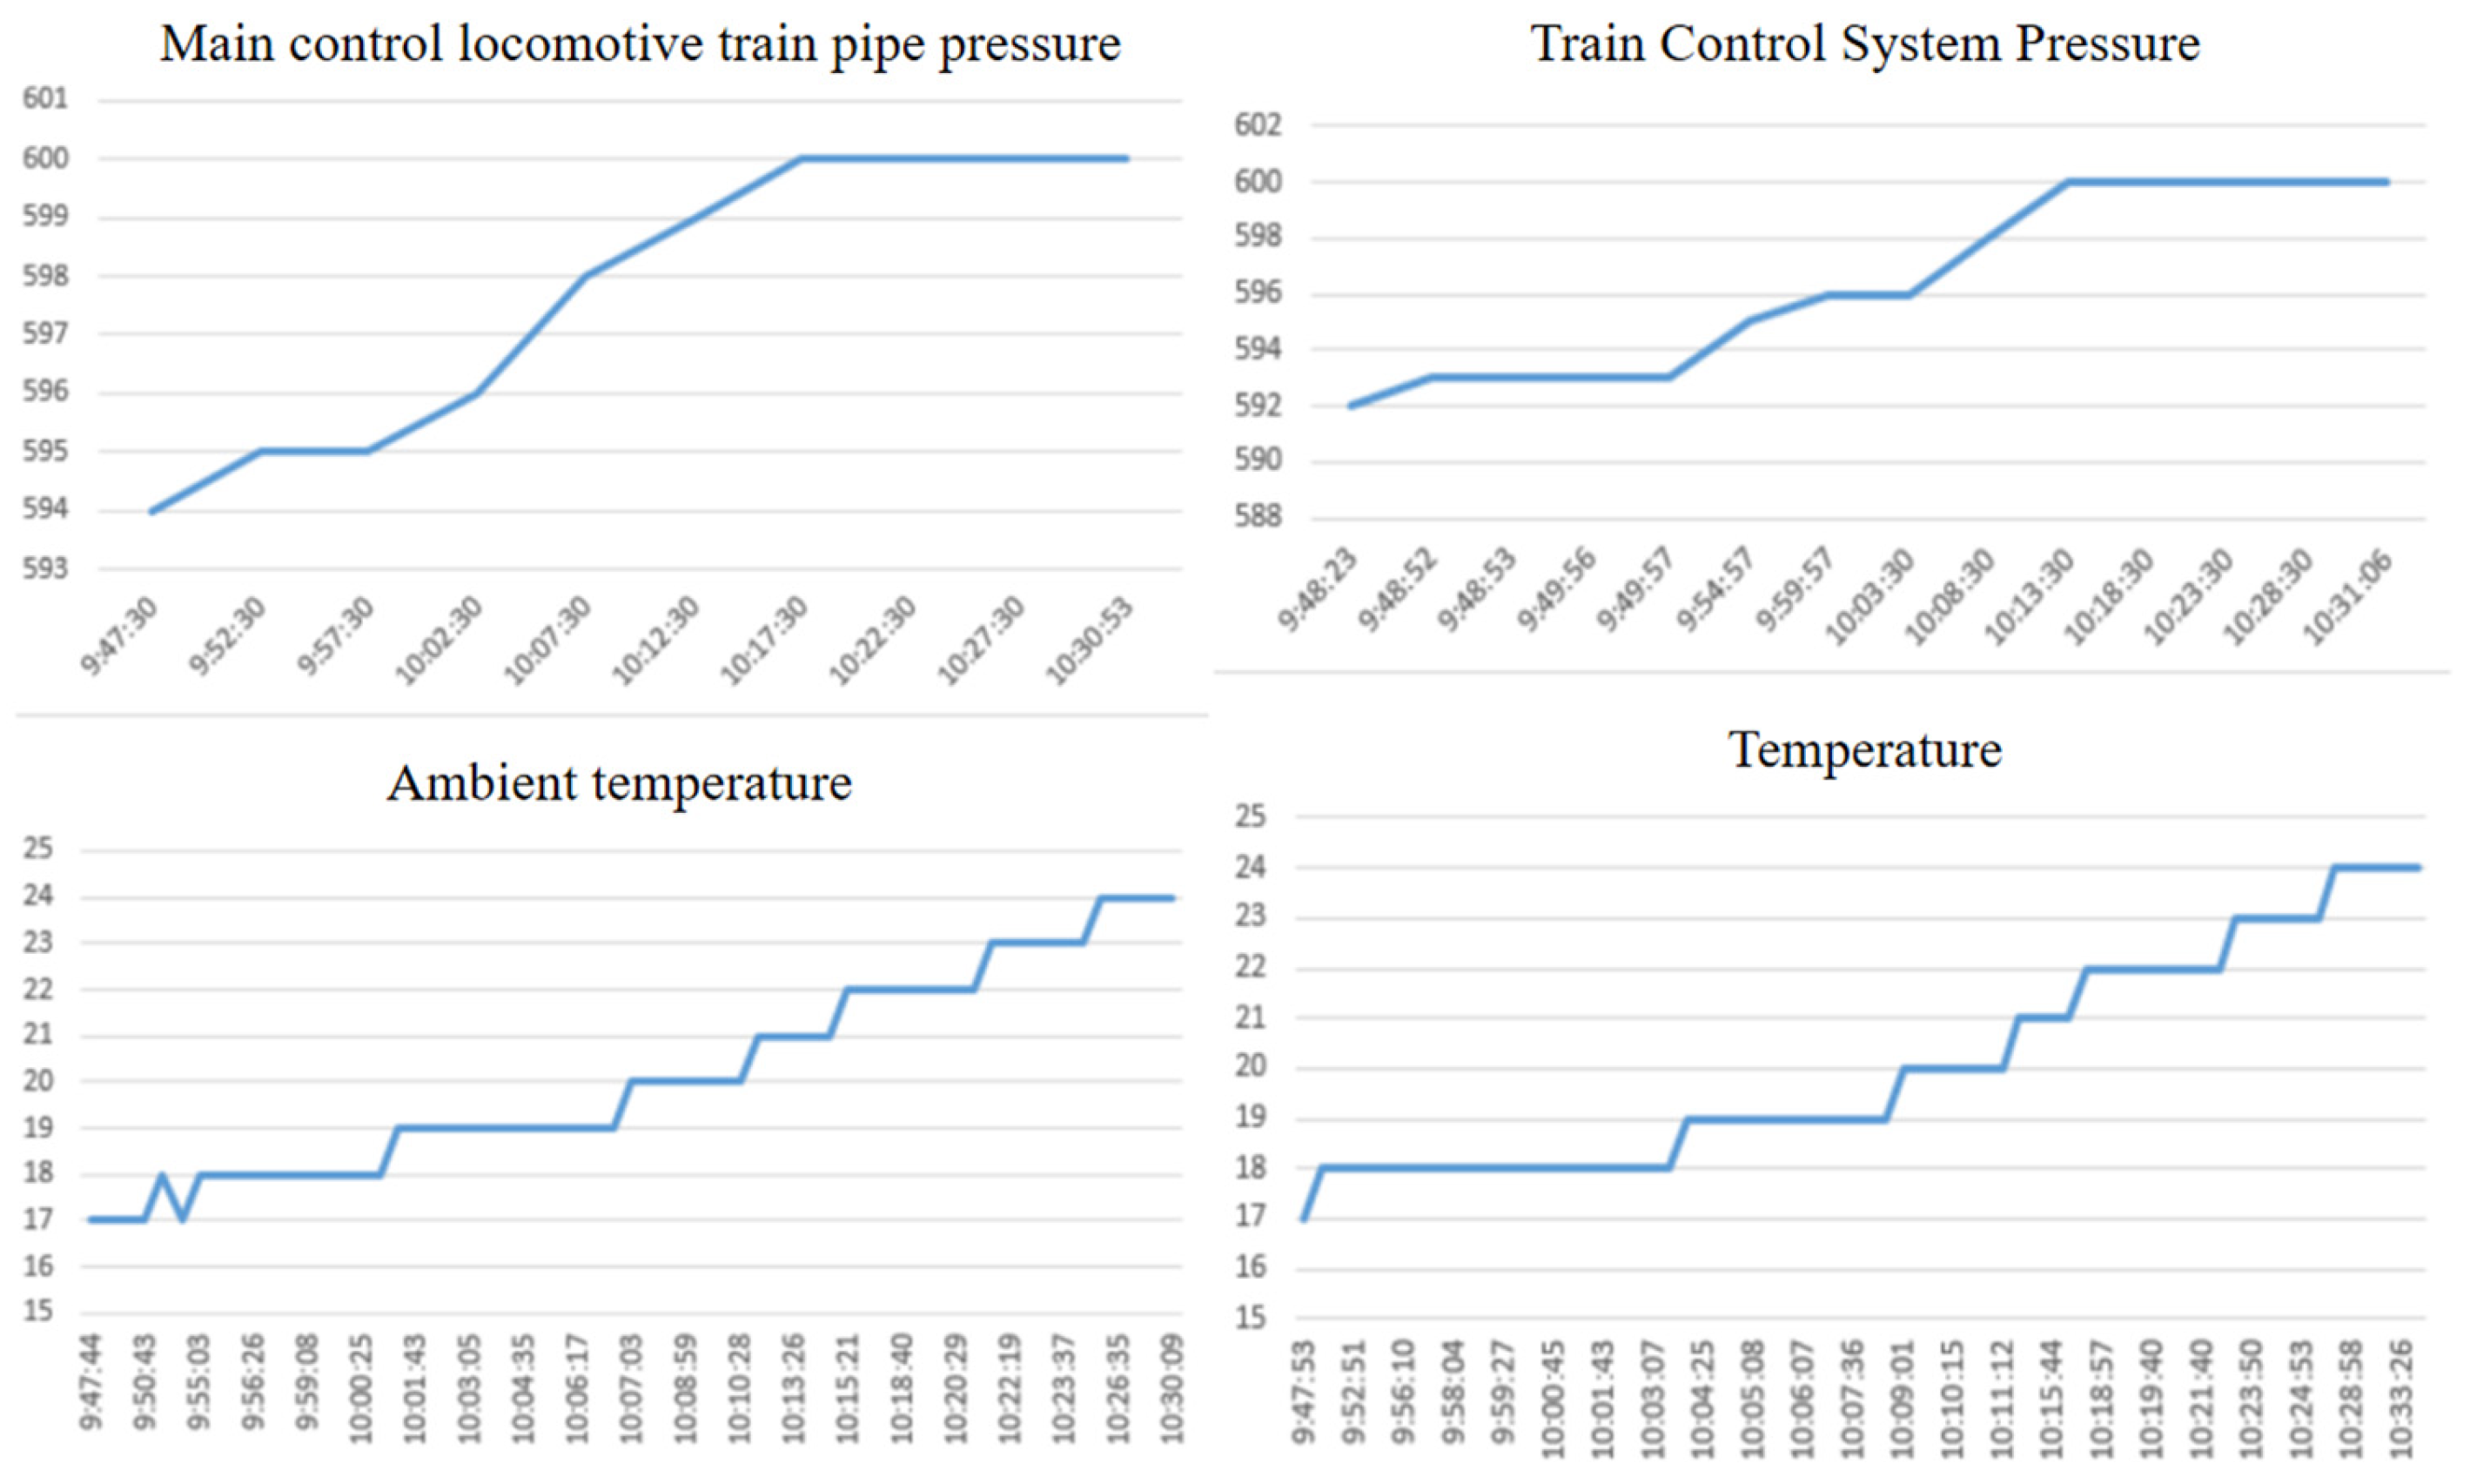
To further investigate the relationship between train pipe pressure and ambient temperature variations, synchronous data collection was conducted on the air braking system of heavy-haul trains alongside ambient temperature changes. The compiled data curves are presented in
Figure 6, illustrating the coincidence between train pipe pressure and temperature at the K64km mark.
Analytical data indicates that near K273km on the Daqin Railway, trains frequently experience a gradual rise in pipe pressure under constant pressure conditions due to temperature increases. This has resulted in numerous trains halting due to excessive pressure reduction, with the underlying mechanism identical to that observed near K64km.
4. Analysis of the Impact of Pipe Pressure Fluctuations on Braking Force
To further investigate the impact of pressure fluctuations in the brake pipe system on braking force, a computational model was developed through theoretical derivation. By integrating monitoring data, this model enables analysis of how pressure variations in the train’s main brake pipe and the altitude at the train’s operating location influence the brake cylinder pressure in railway freight vehicles.
The magnitude of air braking force in heavy freight trains is determined by the rolling stock comprising the train, with the braking force of each individual vehicle being directly controlled by the pressure within its brake cylinder. According to the operating principle of the Type 120-1 brake valve within the freight wagon braking system, during reduced-pressure braking, compressed air from the wagon’s auxiliary air chamber enters the wagon brake cylinder via the Type 120-1 brake valve. This air pressure generates thrust against the bellows, thereby driving the brake shoes to press against the wheels and initiate braking. To achieve rapid pressure build-up in the vehicle brake cylinder at the onset of reduced-pressure braking, the system incorporates a secondary pressure-reduction function. During this process, a portion of compressed air from the train pipe is channelled through the brake valve into the vehicle brake cylinder (this stage contributes an incremental pressure rise of ∆j), accelerating the rate of pressure increase within the cylinder. Consequently, the compressed air within the vehicle brake cylinder comprises both the pressurised air from the auxiliary air reservoir and the pressurised air introduced into the brake cylinder from the train pipe during the secondary pressure reduction process. Prior to air braking, the total air volume within the vehicle braking system comprises the sum of the high-pressure gas in the auxiliary air chamber, the connecting pipework, and the atmospheric gas volume in the space ahead of the brake cylinder piston. For computational convenience, following braking, a portion of the compressed air from the vehicle’s auxiliary air chamber is transferred into the vehicle brake cylinders and connecting pipework, thereby reducing the pressure within the auxiliary air chamber. The vehicle brake cylinder and connecting pipes experience a pressure increase due to the introduction of compressed air. For computational convenience, the effect of ∆j is temporarily disregarded in the initial calculation phase. The final brake cylinder pressure is determined by subsequently combining the calculated result with ∆j. The preliminary calculation is derived from Equation (3), utilising Equation (1) to compute the post-braking pressure within the brake cylinder.
where P
a: Pressure in the auxiliary air chamber prior to braking; P
d: Atmospheric pressure; P
z′: Brake cylinder pressure (absolute pressure), in kPa; r: Pressure reduction in the auxiliary air chamber, in kPa; V
a denotes the auxiliary air chamber volume, taken as 50 L; Vw represents the ineffective volume of the brake cylinder (including the volume within the rear cover of the brake cylinder and the volume of the brake cylinder piping), taken as 5.5 L; and V
c signifies the effective volume of the brake cylinder, calculated as the piston area of the brake cylinder (305
2 × π/4) multiplied by the piston stroke (155 ± 5 mm), where V
c = 11.3 L.
Rearranging the above equation yields Formula (2):
Consider the impact of the following two factors on the calculation: Adjusting Formula (2) to Formula (3):
During train braking, the pressure increase ∆j supplied to the brake cylinder via the main brake valve is generated through the train pipe.
The relationship between ambient atmospheric pressure and atmospheric relative pressure (gauge pressure). Adjust Formula (2) to Formula (3). Pz denotes the relative pressure value of the brake cylinder.
Substituting the established parameters, where V
a = 50, V
w = 5.5, V
c = 11.3, and based on empirical values where ∆j = 15, yields Equation (4):
As demonstrated by the aforementioned derivation process, the pressure within the vehicle brake cylinder exhibits an inverse relationship with atmospheric pressure. During the second-order pressure reduction process whereby air is charged into the brake cylinder via the train pipe, the pressure within the brake cylinder maintains a direct relationship with the volume of air charged.
During descent from high to low altitude, the pressure within the brake cylinders progressively diminishes under the influence of the air brake system’s cycle, consequently reducing the train’s braking force. Specific data is presented in
Table 3.
5. Method for Calculating Vehicle Braking Force
5.1. Calculation of Brake Shoe Pressure
As heavy-haul trains do not employ mixed-type rolling stock, particularly the 20,000 tonne heavy-haul trains which exclusively utilise C80B-type vehicles, the calculation method employs actual brake shoe pressure rather than converted values to enhance accuracy. Based on the structure and parameters of the braking force transmission system in railway freight wagons, the pressure per brake shoe is as follows:
Brake shoe pressure K = Brake cylinder piston rod thrust P × Brake ratio × Brake transmission efficiency × (1/8).
Note: Based on the C80B vehicle configuration, one brake cylinder actuates eight brake shoes. Therefore, when calculating the pressure per individual brake shoe, one-eighth of the total value should be taken.
According to the design of the C80B freight wagon, its braking ratio is 7.3. Based on historical data, the transmission efficiency for freight wagon brake shoe braking is set at 0.50 (50%). The pressure per brake shoe for the C80B can be calculated using the aforementioned Formula (5).
Based on the structure of the brake cylinder, the calculation method for the thrust P of the brake cylinder piston rod is given by Formula (6).
where P
z denotes the air pressure within the brake cylinder (kPa), and d
z represents the diameter of the brake cylinder (mm), taken as 305. Substituting Equation (6) into Equation (5) yields Equation (7).
5.2. Calculation of Coefficient of Friction
According to TB/T 1407.1-2018 ‘Train Traction Calculation Part 1: Locomotive-Hauled Trains’, the brake shoe coefficient of friction is a dynamic value related to both running speed and brake shoe pressure [
7]. As heavy-haul trains do not feature mixed formations, particularly 20,000 tonne heavy-haul trains which exclusively utilise C80 or C80B rolling stock, employing the actual calculated friction coefficient enhances the accuracy of results. Per traction calculation regulations, C80B rolling stock employs high-friction composite brake blocks. The friction coefficient ψ of these blocks relates to both brake block pressure and train operating speed, calculated via Formula (8).
5.3. Calculation Method for Braking Force B
The braking force B of a single vehicle comprises the braking forces of eight brake shoes, where the braking force of each shoe is the product of the shoe pressure and the coefficient of friction, calculated using Formula (9).
A 20,000 tonne heavy-haul train consists of 210 vehicles, hence the air braking force Bz for the entire train is calculated using Formula (10).
Therefore, the mathematical formula for calculating the air braking force of a train is organised as the following set of equations, namely Formula (11).
In this mathematical formula, the variables are Pd (atmospheric pressure), r (pressure reduction), and v (speed). The variable Pd (atmospheric pressure) is directly acquired by the monitoring device via sensors. The variable r (pressure reduction) is calculated by the train pipe pressure sensor through real-time collection of data before and after braking. The variable v (speed) is obtained from RS485 bus data via the locomotive’s integrated safety monitoring device. This enables the real-time calculation of the entire train’s braking force.
If the brake pipe pressure of a heavy-load train remains unaffected by temperature, using the CCB II brake parameters as the calculation sample, the reduction in brake pipe pressure r
0 is directly related to the pressure reduction in the equalising reservoir. The calculation formula is given by Equation (12).
r0 denotes the pressure reduction in the train pipe when unaffected by temperature; re1 represents the pressure in the equalising air chamber prior to pressure-reduction braking; re2 denotes the pressure in the equalising air chamber after pressure-reduction braking. Both re1 and re2 are obtained through real-time monitoring using the equalising air chamber pressure sensor.
Substituting r
0 for r in Equation (11) yields the train braking force B
z0 unaffected by temperature. Subtracting B
z from B
z0 produces Equation (13), whose result represents the temperature-dependent braking force B
C for the entire heavy-load train.
Combine Equations (11)–(13) to derive the calculation Formula (14).
Based on monitoring and calculation data for heavy-haul trains on the Daqin Railway, when operating at 70 km/h under constant temperature conditions, the initial air brake application results in a 50 kPa pressure drop in the train pipe, yielding a calculated braking force of 1998 kN. Calculated braking force values for heavy-haul trains at speeds of 70 km/h, 60 km/h, 55 km/h, 40 km/h, 30 km/h, and 20 km/h are presented in
Table 4.
During actual operations on the Daqin Railway, numerous trains experienced abnormal increases in brake pipe pressure prior to applying air brakes within the Jundu Mountain Tunnel. This phenomenon primarily arises because tunnel temperatures exceed external ambient temperatures, causing abnormal pressure surges in the train’s brake pipes. Consequently, the train’s brake pipe pressure reduction amounts to 55 kPa. Neglecting variations in atmospheric pressure, the calculated braking force values at different speeds are presented in
Table 5. At a speed of 70 km/h, the calculated train braking force is 2290 kN. The impact of brake pipe pressure fluctuations on train braking force is 2290 kN − 1998 kN = 292 kN.
Given that the Jundu Mountain Tunnel is not at sea level, measurements indicate the corresponding atmospheric pressure at this location is 96 kPa. Using Formula 14, the train braking force values at different speeds were recalculated as shown in
Table 6. At a speed of 70 km/h, the calculated train braking force is 2342 kN. The impact of brake pipe pressure fluctuations on train braking force is 2343 kN − 1998 kN = 345 kN, representing an enhancement of approximately 17%. Calculations based on train longitudinal dynamics indicate that increased braking force leads to greater longitudinal forces during deceleration, thereby heightening the risk of derailment on curved sections of track.
Consequently, within the Jundu Mountain Tunnel, abnormal increases in brake pipe pressure, compounded by the effects of altitude, will significantly amplify the braking force required for heavy-load trains. Furthermore, computational analysis indicates that atmospheric pressure and train braking force exhibit an inverse relationship, meaning that geographical altitude and train braking force demonstrate a direct proportional relationship.
6. Comparison with Traditional Computational Methods
The calculation of brake cylinder pressure and brake shoe friction coefficient constitutes a critical process in determining train braking force. In brake cylinder pressure calculations, traditional methods consider only the pressure reduction in the train brake pipe, using the formula P
z = 3.25r − 100 (where P
z is the brake cylinder pressure and r is the pressure reduction in the train brake pipe) [
8]. While this method is acceptable for rough estimates of brake cylinder pressure, using it to derive train braking force increases computational error. For instance, with a brake pipe pressure reduction of 50 kPa, this formula yields a calculated brake cylinder pressure of 62.5 kPa. However, during braking tests on 20,000 tonne heavy-haul trains with a 50 kPa pressure reduction, measured brake cylinder pressures for railway freight vehicles ranged from 85 to 100 kPa, with the vast majority of data points concentrated between 90 and 100 kPa. The data deduced from Formula (14) in this paper aligns with operational line test data, thereby validating the line test results. Regarding the calculation of brake shoe friction coefficients, traditional algorithms predominantly employ a converted friction coefficient formula (Ψ = 0.378 × (2v + 150)/(3v + 150)) due to the difficulty in accurately obtaining brake shoe normal pressure. These calculations do not account for the influence of brake shoe pressure on friction coefficient results, which to some extent compromises the precision of friction coefficient calculations.
In summary, the computational method presented in this paper demonstrates greater precision than conventional methods in calculating train braking forces.
7. Conclusions
This paper conducts a systematic investigation into the variation in braking force experienced by Daqin Railway’s 20,000 tonne heavy-haul combined trains during operation, arising from abnormal fluctuations in brake pipe pressure. Utilising monitoring equipment to collect train operational data, a braking force calculation method was derived and a train braking force computational model established. The calculations account for both the impact of temperature-induced increases in brake pipe pressure on train braking force and the superimposed effect of atmospheric pressure variations on braking force. This addresses the current lack of scientific analysis concerning the impact of brake pipe pressure fluctuations on braking force in heavy-haul trains. The research provides a new reference model for calculating braking force, facilitating detailed longitudinal force simulations for heavy-haul trains. It also offers theoretical guidance for subsequent studies on suppression strategies for abnormal increases in brake pipe pressure during heavy-haul train operations.
Author Contributions
Concept and design: T.L. and Y.Y.; Methodology: T.L., Y.Y. and L.G.; Validation: T.L., Y.Y. and L.G.; Formal Analysis: T.L. and Y.Y.; Resource Management: Y.Y.; Data Organisation: T.L., Y.Y. and L.G.; Drafting: T.L.; Review and Revision: Y.Y. and L.G.; Visualisation: T.L.; Project Management: Y.Y. All authors have read and agreed to the published version of the manuscript.
Funding
This research was supported by the National Natural Science Foundation of China, Grant No. U24B20122.
Data Availability Statement
All data used in this study are included in the figures and tables within the main text of the article and are not stored in any external repository.
Conflicts of Interest
Author Yongsheng Yu was employed by the company Science and Technology Research Institute of Daqin Railway Co., Ltd. The remaining authors declare that the research was conducted in the absence of any commercial or financial relationships that could be construed as a potential conflict of interest.
References
- Wei, W.; Zhang, Y.; Zhang, J.; Zhao, X. Influence of quick release valve on braking performance and coupler force of heavy haul train. Railw. Eng. Sci. 2023, 31, 153–161. [Google Scholar] [CrossRef]
- Yang, X.G.; Wei, W. Comparative Study on Simulation and Experiment of Heavy Haul Train Operating Conditions. J. Transp. Technol. 2019, 8, 129–137. [Google Scholar] [CrossRef]
- Wang, G.; Song, Y.; Yu, Y.; Lu, X. Analysis of the Effects of Rising Ambient Temperature on Pressure Fluctuations in Piping Systems and Braking Forces of Heavy-Load Trains. Railw. Locomot. Roll. Stock. 2023, 43, 120–126. [Google Scholar]
- Wang, F.; Jiang, J.; Zhang, Z.; Luo, Y. Research on Evaluation Methods for Air Brake Force Strength of Heavy-Load Intelligent Trains. Electr. Transm. Locomot. 2022, 270, 109–115. [Google Scholar] [CrossRef]
- Xu, J.; Li, Z.; Chang, Y. Railway Locomotive Braking Systems, M+Book ed.; Beijing Jiaotong University Press: Beijing, China, 2019. [Google Scholar]
- Zhang, W. Vehicle Braking Systems, 2nd ed.; China Railway Publishing House: Beijing, China, 2015. [Google Scholar]
- TB/T 1407.1-2018; Calculation of Train Traction Part 1: Locomotive Traction. National Railway Administration: Beijing, China, 2018.
- Rao, Z. Train Traction Calculations; China Railway Publishing House: Beijing, China, 1999. [Google Scholar]
Figure 1.
Control schematic diagram for the train air braking system.
Figure 1.
Control schematic diagram for the train air braking system.
Figure 2.
Schematic diagram illustrating the principle of locomotive brake control via the air reservoir regulating train pipe pressure.
Figure 2.
Schematic diagram illustrating the principle of locomotive brake control via the air reservoir regulating train pipe pressure.
Figure 3.
Brake actuator test port location. (TPBP in the diagram denotes the train brake pipe pressure test port, while TPER denotes the equalizing air chamber pressure test port).
Figure 3.
Brake actuator test port location. (TPBP in the diagram denotes the train brake pipe pressure test port, while TPER denotes the equalizing air chamber pressure test port).
Figure 4.
Schematic diagram of the composition and principles of the data acquisition and recording system.
Figure 4.
Schematic diagram of the composition and principles of the data acquisition and recording system.
Figure 5.
Temperature variation data curve along the route from Hudong station to Chawu station.
Figure 5.
Temperature variation data curve along the route from Hudong station to Chawu station.
Figure 6.
Changes in the main and trailing locomotive train pipe pressure and ambient temperature for heavy-haul combined trains at K64km.
Figure 6.
Changes in the main and trailing locomotive train pipe pressure and ambient temperature for heavy-haul combined trains at K64km.
Table 1.
Pressure sensor specification sheet.
Table 1.
Pressure sensor specification sheet.
| Name | Scope of Testing | Accuracy | Output Signal |
|---|
| Balanced Air Tank Pressure Sensor | 0–700 kPa | 0.5‰ | 0–10 V |
| Train Air Tank Pressure Sensor | 0–700 kPa | 0.5‰ | 0–10 V |
Table 2.
Environmental sensor specifications.
Table 2.
Environmental sensor specifications.
| Parameter Name | Parameter Value |
|---|
| Temperature measurement range | −30~70 °C |
| Humidity measurement range | 0~100% RH |
| Accuracy | ±0.2 °C, ±3% RH (10%~90%) |
| Repeatability | ±0.1 °C, ±0.1% RH |
| Long-term stability | 0.04 °C per annum, 0.5% relative humidity per annum |
| Output signal | RS485 |
| Supply voltage | 5~24 V |
| Operating environment | Temperature: −55 °C to 120 °C; Humidity: ≤95% RH |
Table 3.
This effect of atmospheric pressure variations on brake cylinder pressure.
Table 3.
This effect of atmospheric pressure variations on brake cylinder pressure.
Pressure Reduction
(kPa) | Atmospheric Pressure
(kPa) | Δj (kPa) | Brake Cylinder Pressure (kPa) |
|---|
| 50 | 89 | 15 | 103.9486 |
| 50 | 90 | 15 | 103.276 |
| 50 | 91 | 15 | 102.6034 |
| 50 | 92 | 15 | 101.9308 |
| 50 | 93 | 15 | 101.2582 |
| 50 | 94 | 15 | 100.5856 |
| 50 | 95 | 15 | 99.913 |
| 50 | 96 | 15 | 99.2404 |
| 50 | 97 | 15 | 98.5678 |
| 50 | 98 | 15 | 97.8952 |
| 50 | 99 | 15 | 97.2226 |
| 50 | 100 | 15 | 96.55 |
| 50 | 101 | 15 | 95.8774 |
Table 4.
Air braking force of trains at different speeds corresponding to a 50 kPa pressure reduction (in the table below, all pressure reduction values, atmospheric pressure, Δj values, Brake cylinder pressure Pz and Brake shoe pressure are held constant at [50 kPa], [100 kPa], [15 kPa], [96.55 kPa], and [3.215115 kN], respectively).
| Speed (km/h) | Coefficient of Friction | Train Braking Force (kN) |
|---|
| 70 | 0.3699147 | 1998 |
| 60 | 0.37571273 | 2029 |
| 55 | 0.37902589 | 2047 |
| 40 | 0.39117416 | 2113 |
| 30 | 0.40180389 | 2170 |
| 20 | 0.41547069 | 2244 |
Table 5.
Air braking force of trains at different speeds corresponding to a 55 kPa pressure reduction (in the table below, all pressure reduction values, atmospheric pressure, Δj values, Brake cylinder pressure Pz and Brake shoe pressure are held constant at [55 kPa], [100 kPa], [15 kPa], [111.431 kPa], and [3.710652 kN], respectively).
| Speed (km/h) | Coefficient of Friction | Train Braking Force (kN) |
|---|
| 70 | 0.36739555 | 2290 |
| 60 | 0.3731541 | 2326 |
| 55 | 0.3764447 | 2347 |
| 40 | 0.38851024 | 2422 |
| 30 | 0.39906758 | 2488 |
| 20 | 0.41264131 | 2572 |
Table 6.
Air braking force of trains at different speeds corresponding to a 55 kPa pressure reduction (in the table below, all pressure reduction values, atmospheric pressure, Δj values, Brake cylinder pressure Pz and Brake shoe pressure are held constant at [55 kPa], [96 kPa], [15 kPa], [114.1214 kPa], and [3.800243 kN], respectively).
| Speed (km/h) | Coefficient of Friction | Train Braking Force (kN) |
|---|
| 70 | 0.36694506 | 2343 |
| 60 | 0.37269655 | 2379 |
| 55 | 0.37598312 | 2400 |
| 40 | 0.38803386 | 2477 |
| 30 | 0.39857825 | 2545 |
| 20 | 0.41213534 | 2631 |
| Disclaimer/Publisher’s Note: The statements, opinions and data contained in all publications are solely those of the individual author(s) and contributor(s) and not of MDPI and/or the editor(s). MDPI and/or the editor(s) disclaim responsibility for any injury to people or property resulting from any ideas, methods, instructions or products referred to in the content. |
© 2025 by the authors. Licensee MDPI, Basel, Switzerland. This article is an open access article distributed under the terms and conditions of the Creative Commons Attribution (CC BY) license (https://creativecommons.org/licenses/by/4.0/).
