A Feature Selection Method Based on a Convolutional Neural Network for Text Classification
Abstract
1. Introduction
2. Literature Review
2.1. Feature Selection Methods in the Text Domain
2.1.1. Ranking Methods
2.1.2. Selecting Methods
2.1.3. Summary
2.2. CNNs for Text Mining
2.2.1. Text Representation
2.2.2. Text Classification
2.2.3. Semantics Analysis
2.2.4. Summary
2.3. Research Motivation
3. Methodology
3.1. Research Objectives
3.2. Feature Selection Preliminary
3.3. Structure of the Three-Layer CNN
3.3.1. Basic Operations
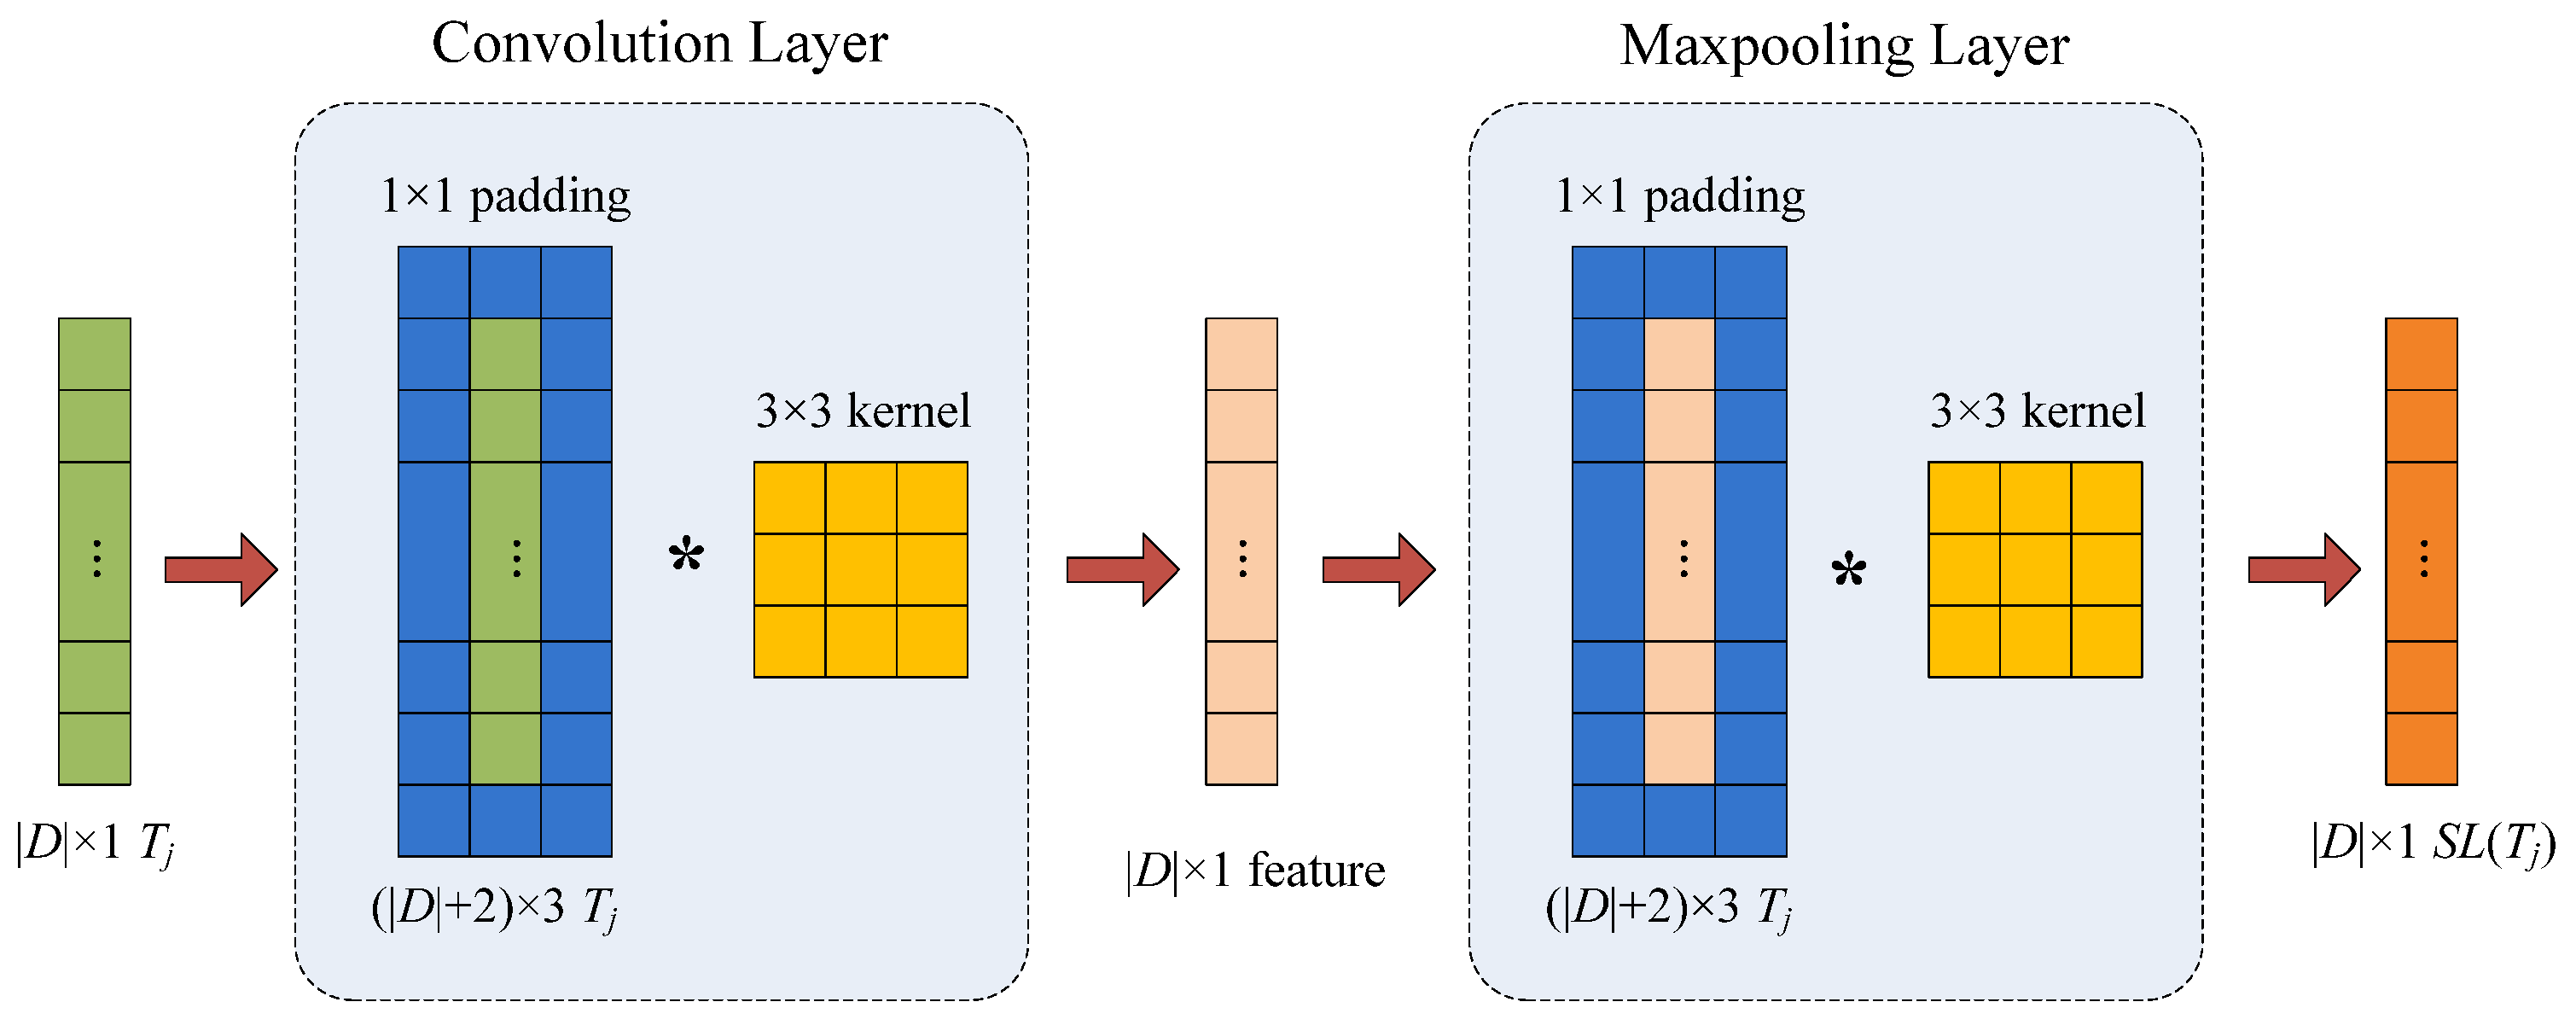
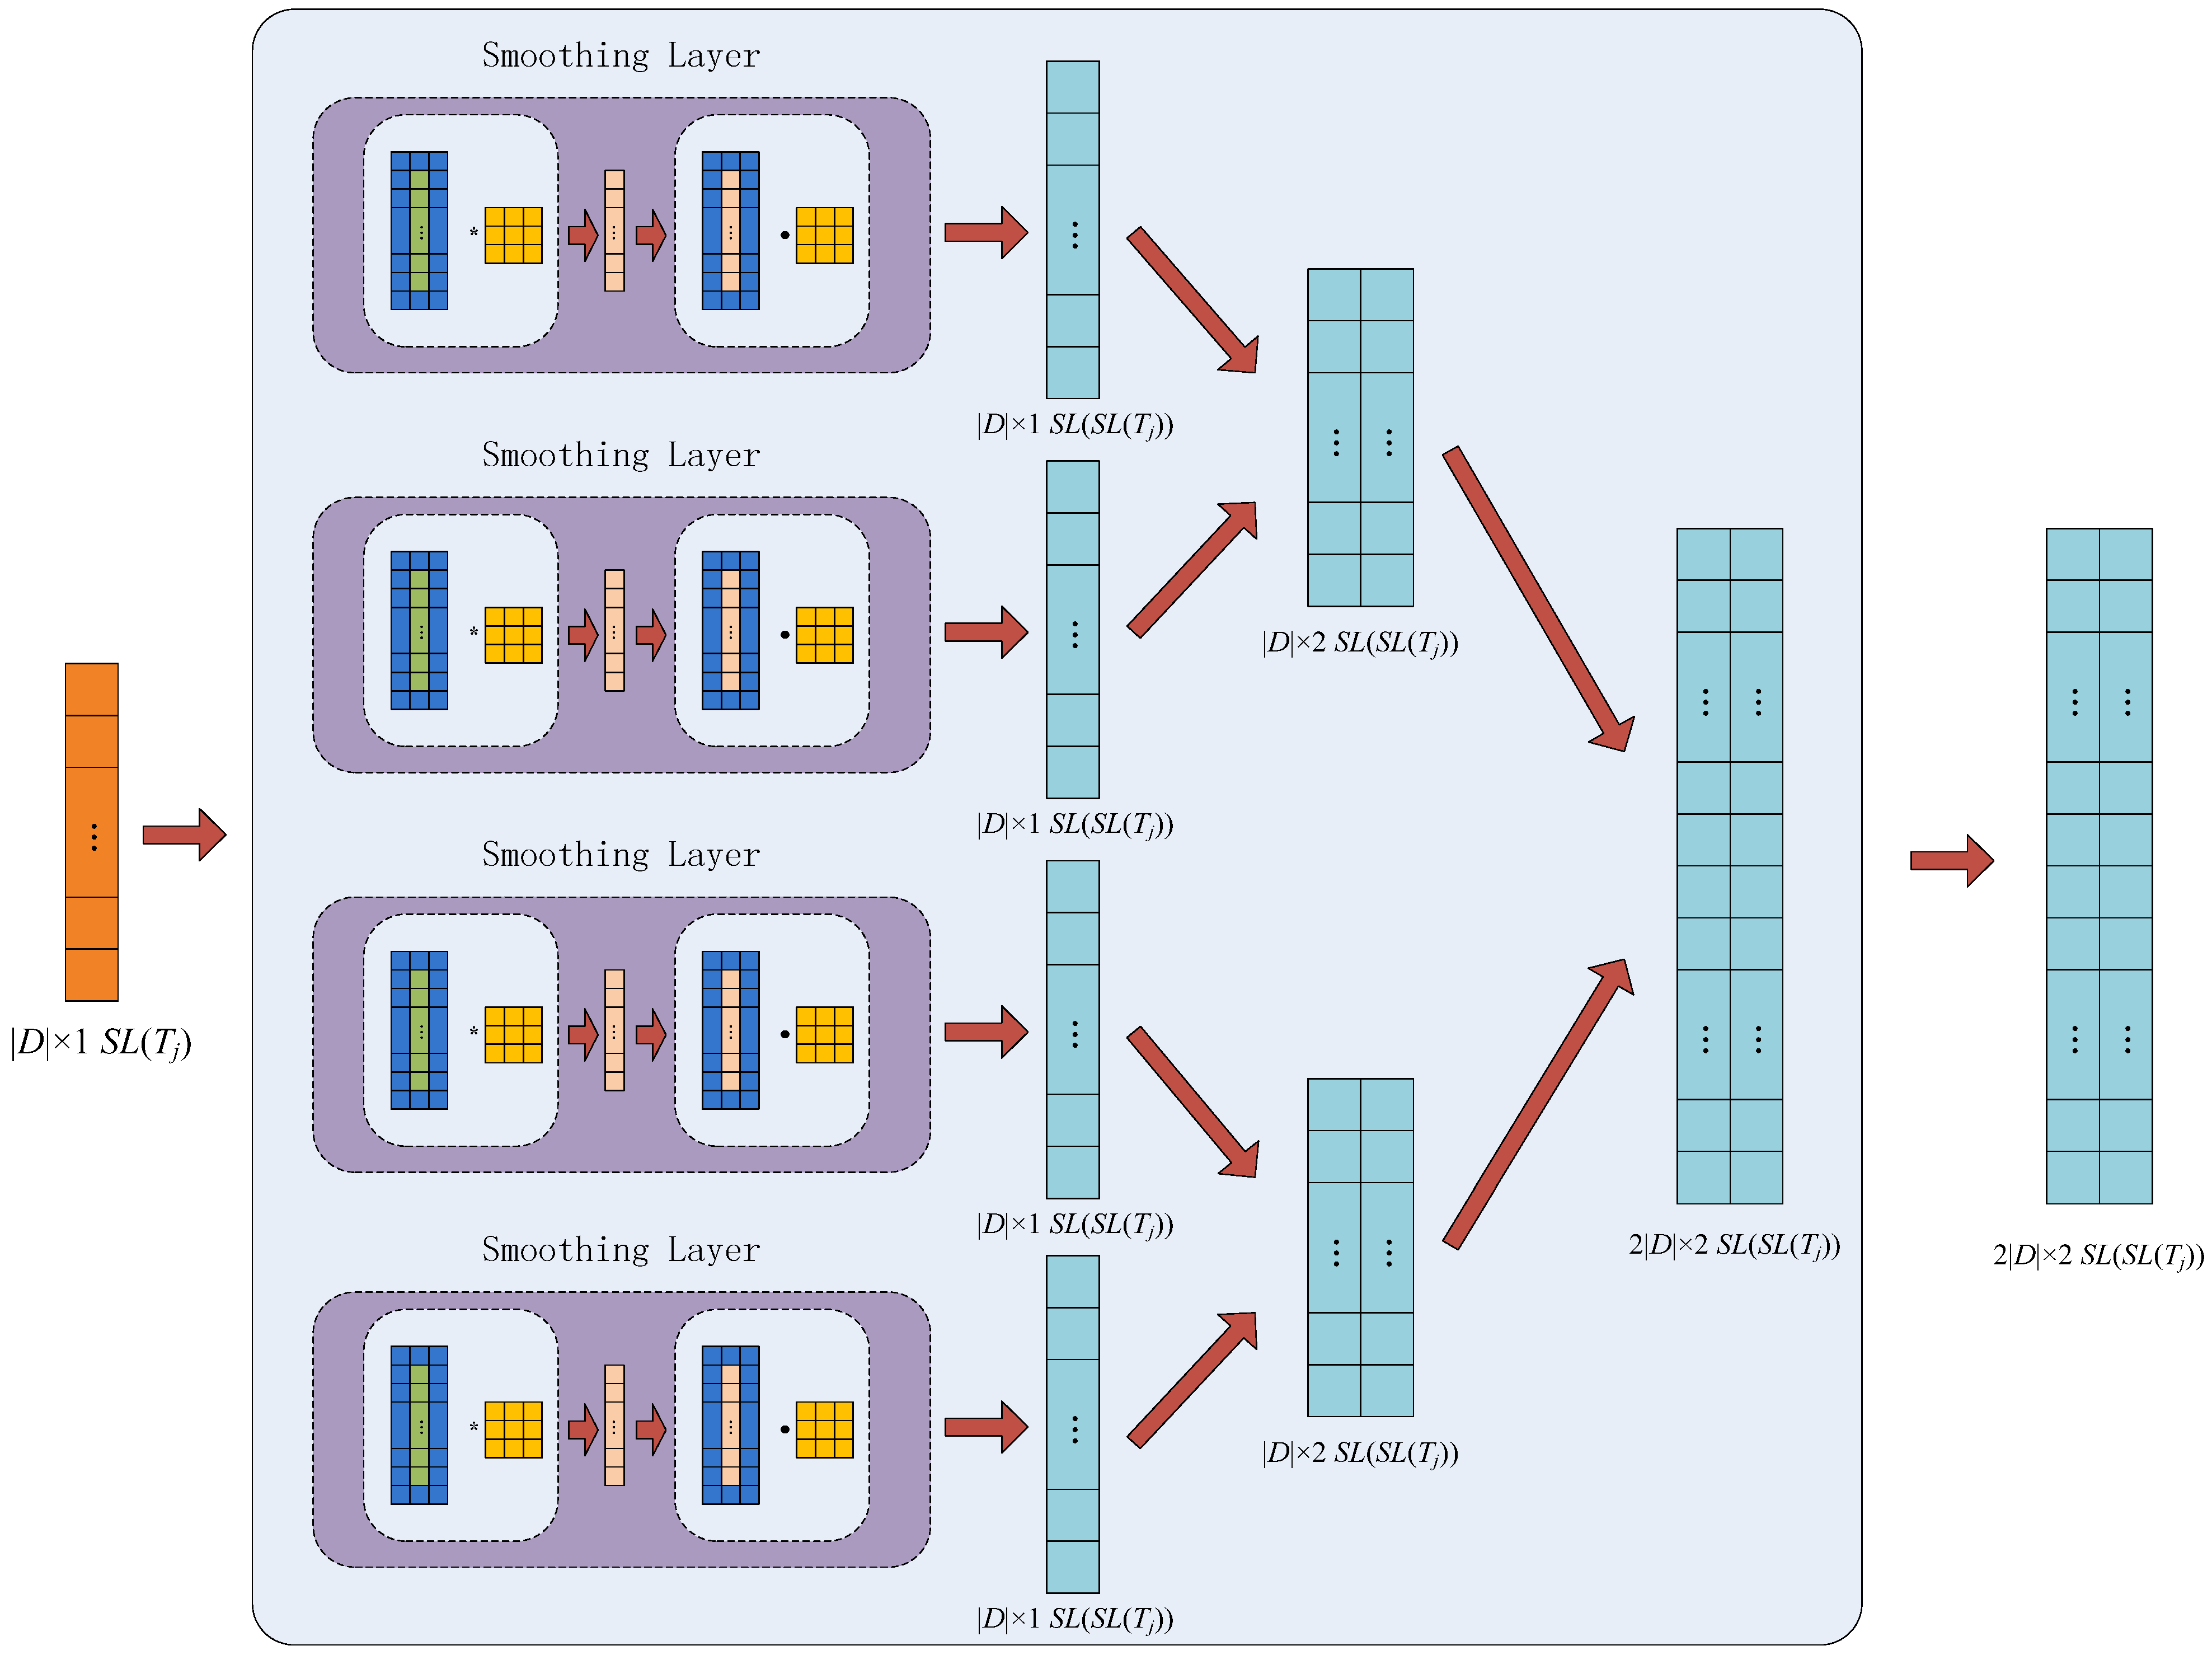
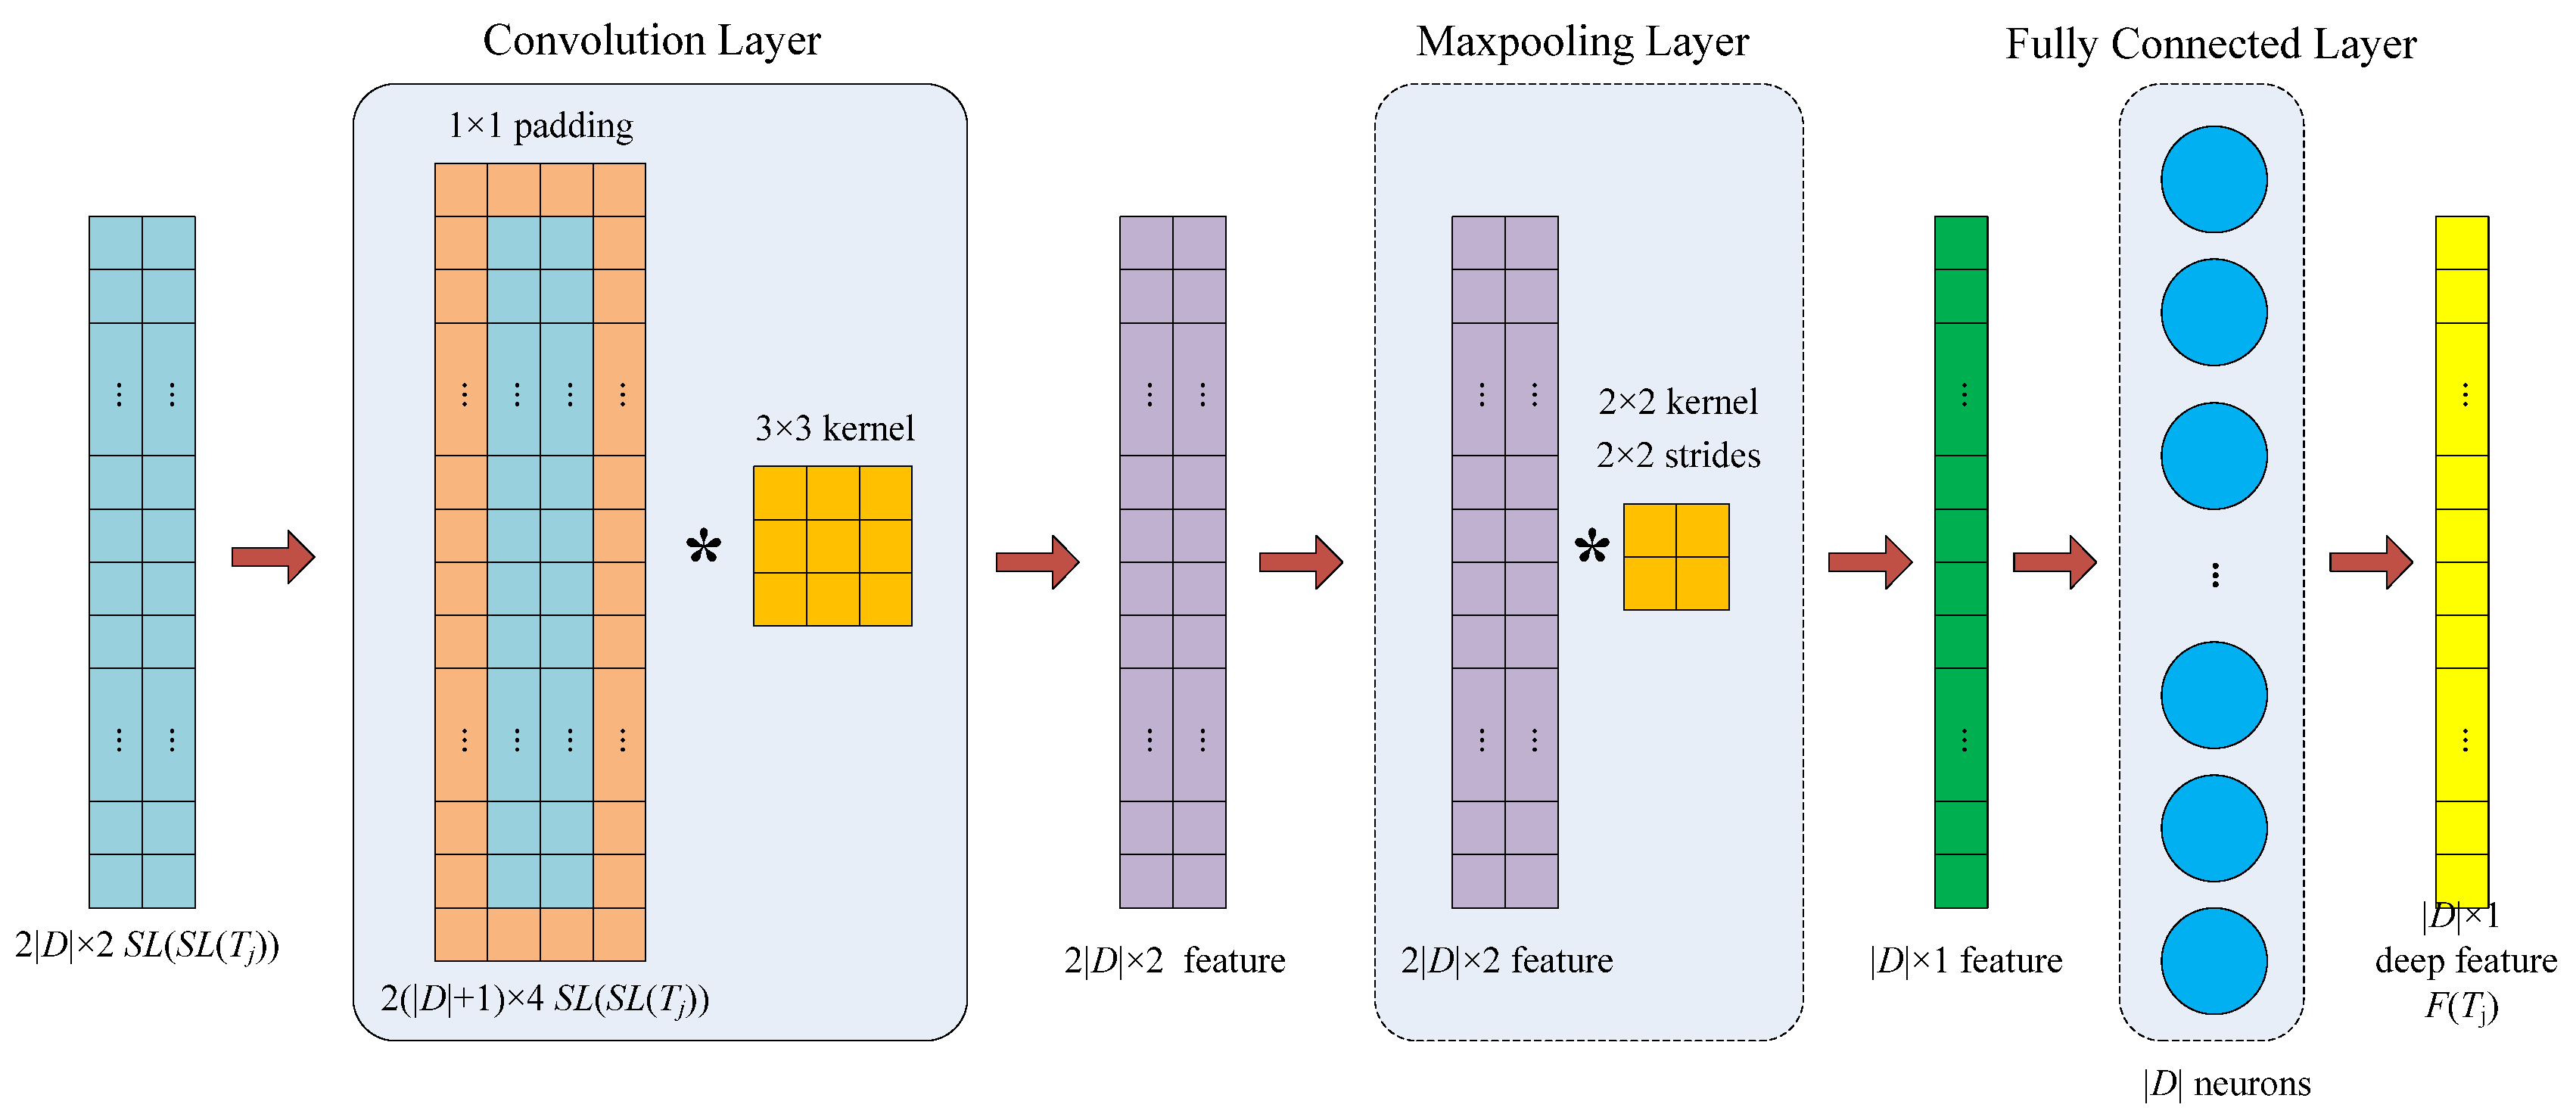
3.3.2. Basic Layers
- (1)
- Smoothing Layer
- (2)
- Extending Layer
- (3)
- Compressing Layer
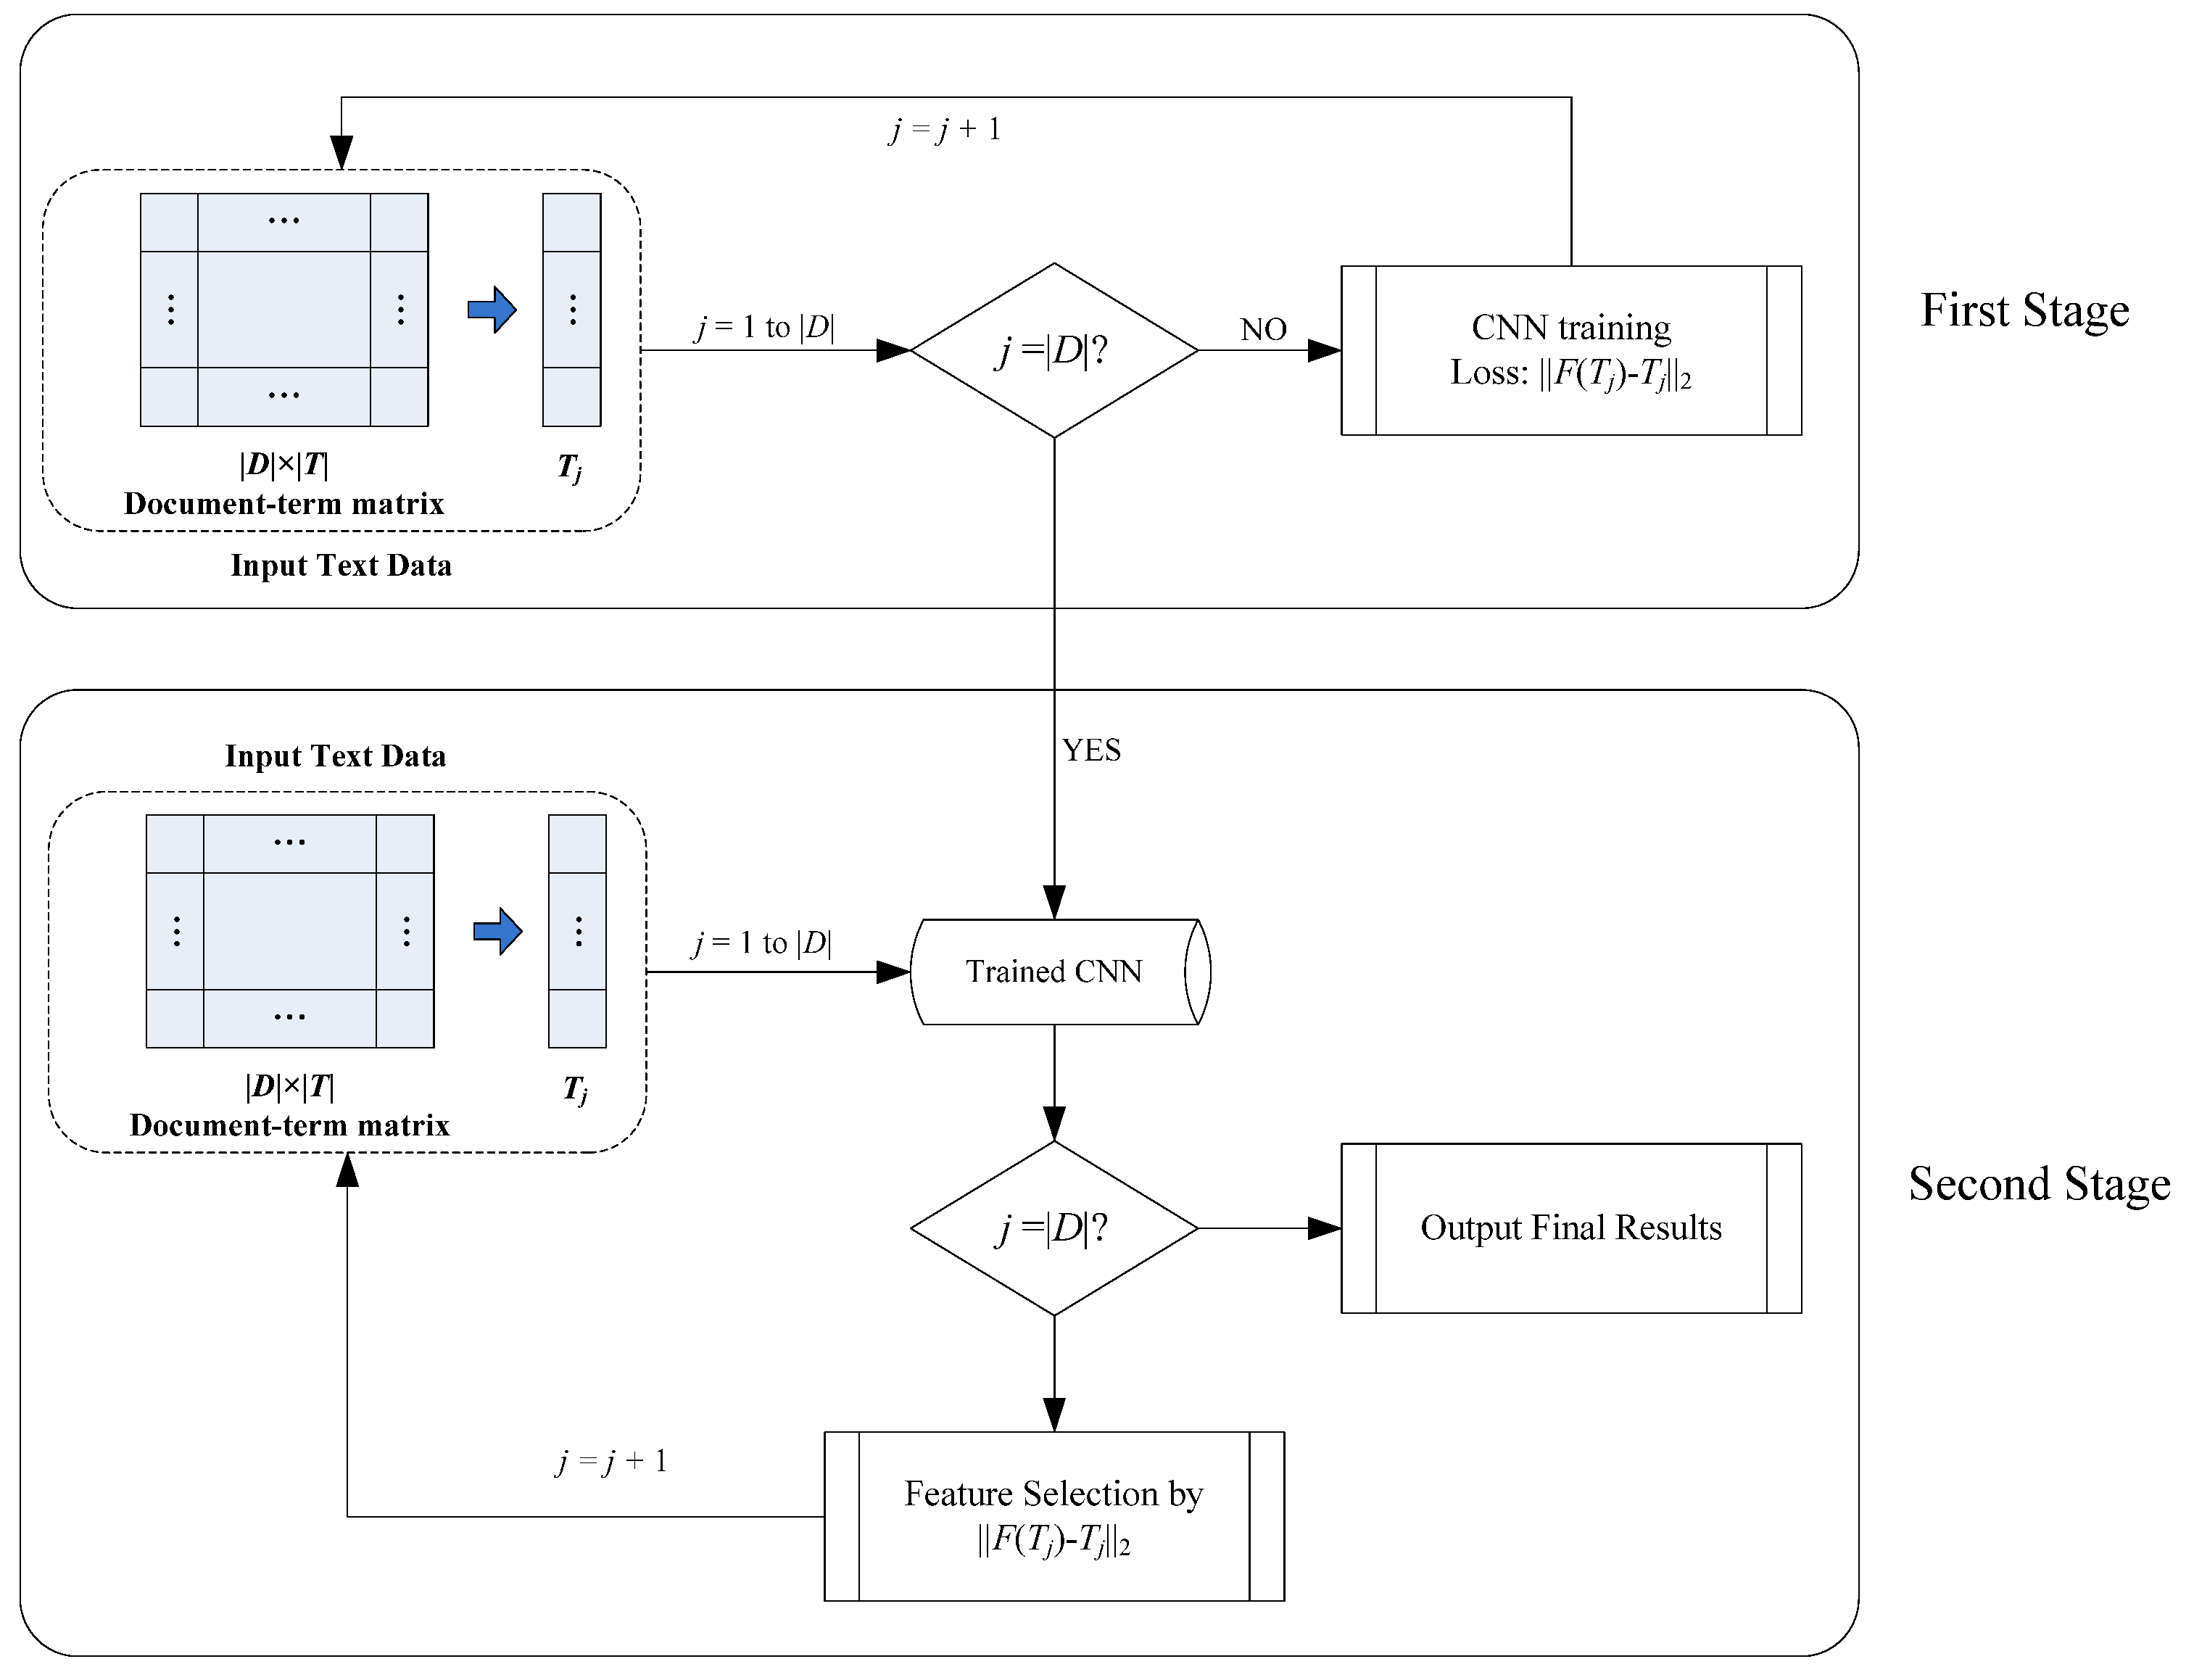
3.4. The Proposed Feature Selection Method, CNNFS
- (1)
- First Stage
- (2)
- Second Stage
- (3)
- Algorithm
| Algorithm 1. Algorithm of feature selection using CNNFS | |
| Input: , the document-term matrix , the number of selected discriminating terms | |
| Output: , the subset of discriminating terms | |
| 1 2 3 4 5 6 7 8 9 10 11 12 13 14 | # first stage ; For ; End For # second stage ; For ; ; End For # output results ; |
| 15 | Return ; |
| 16 | |
- (4)
- Complexity
4. Experiments
4.1. Datasets
4.2. Evaluation Metrics
4.3. Results and Discussions
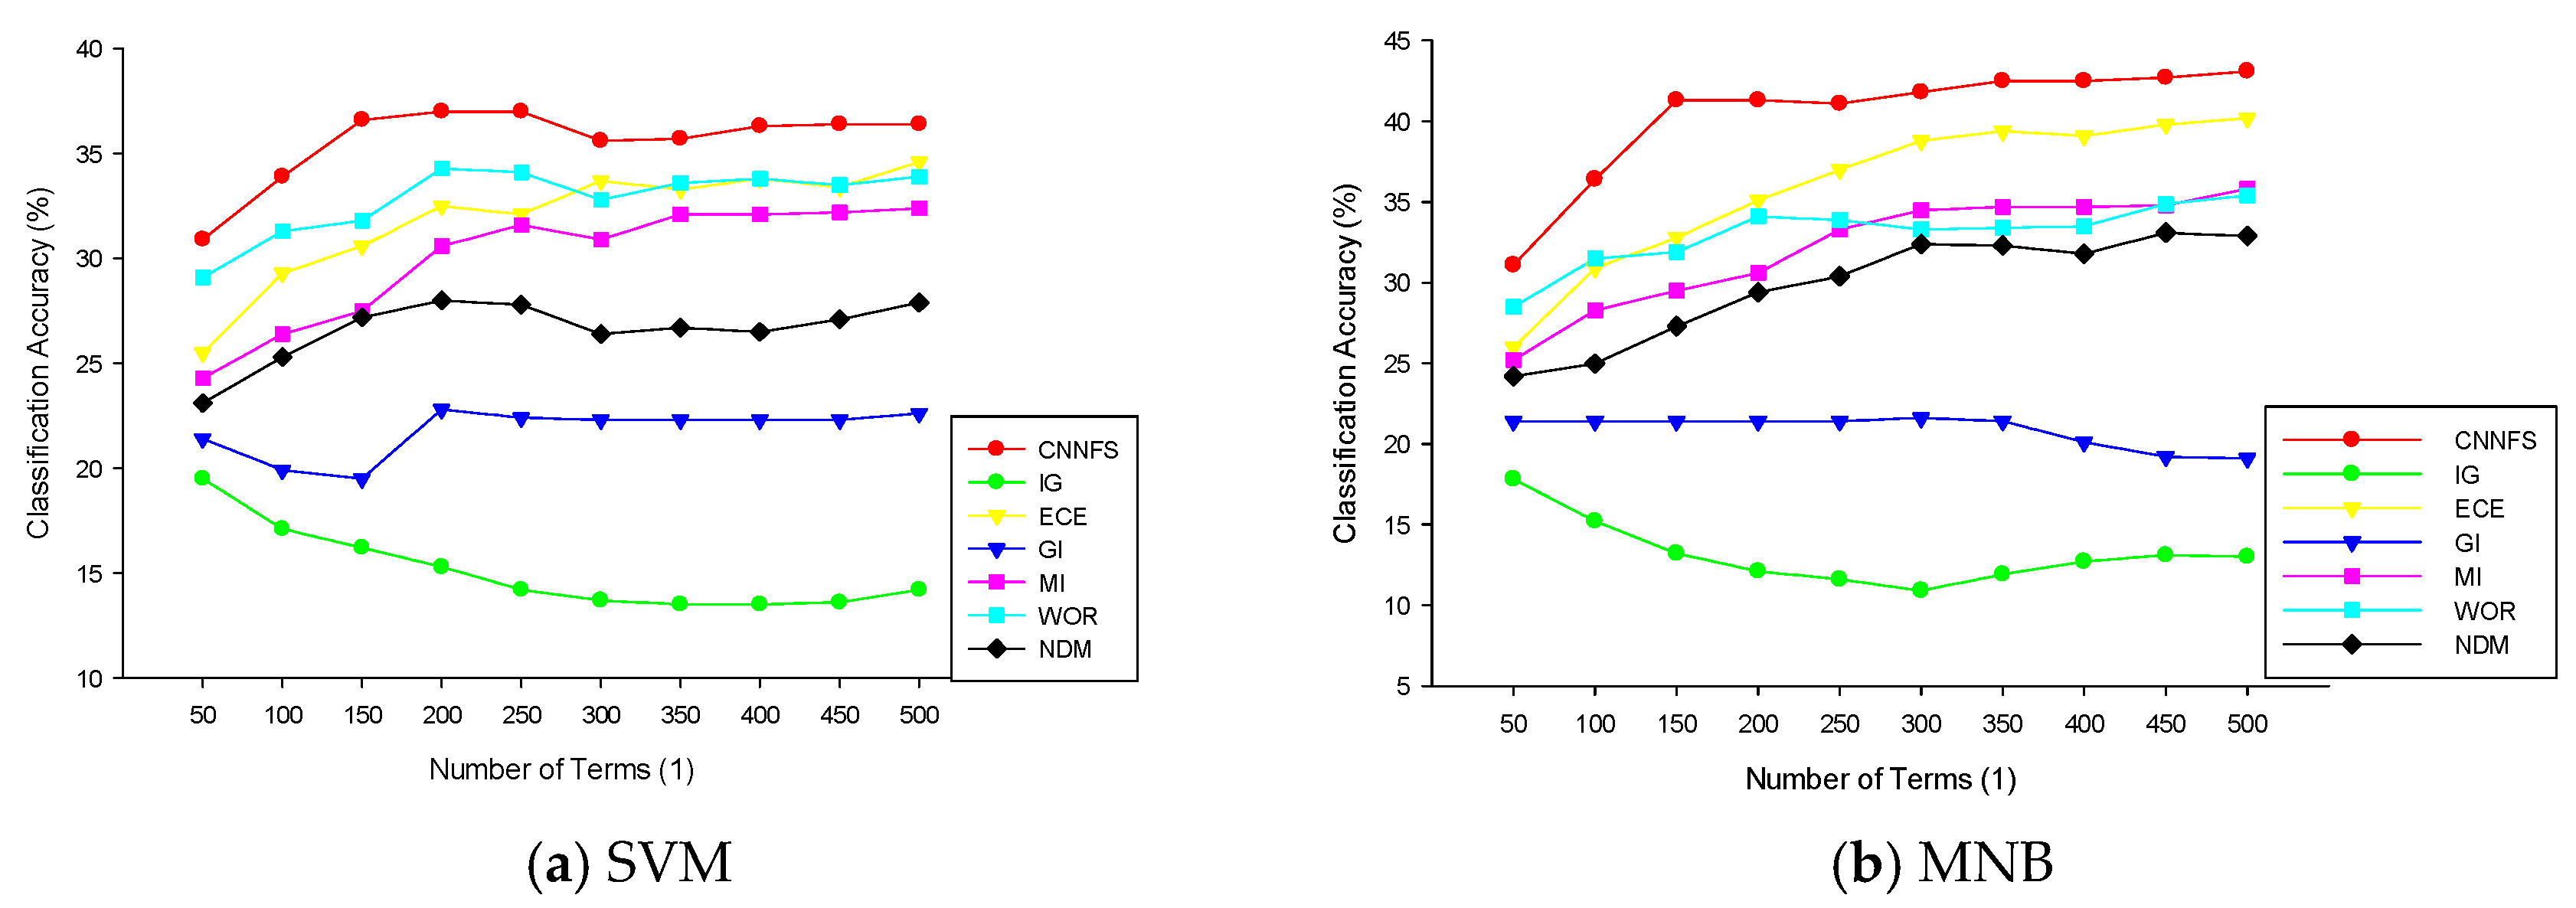
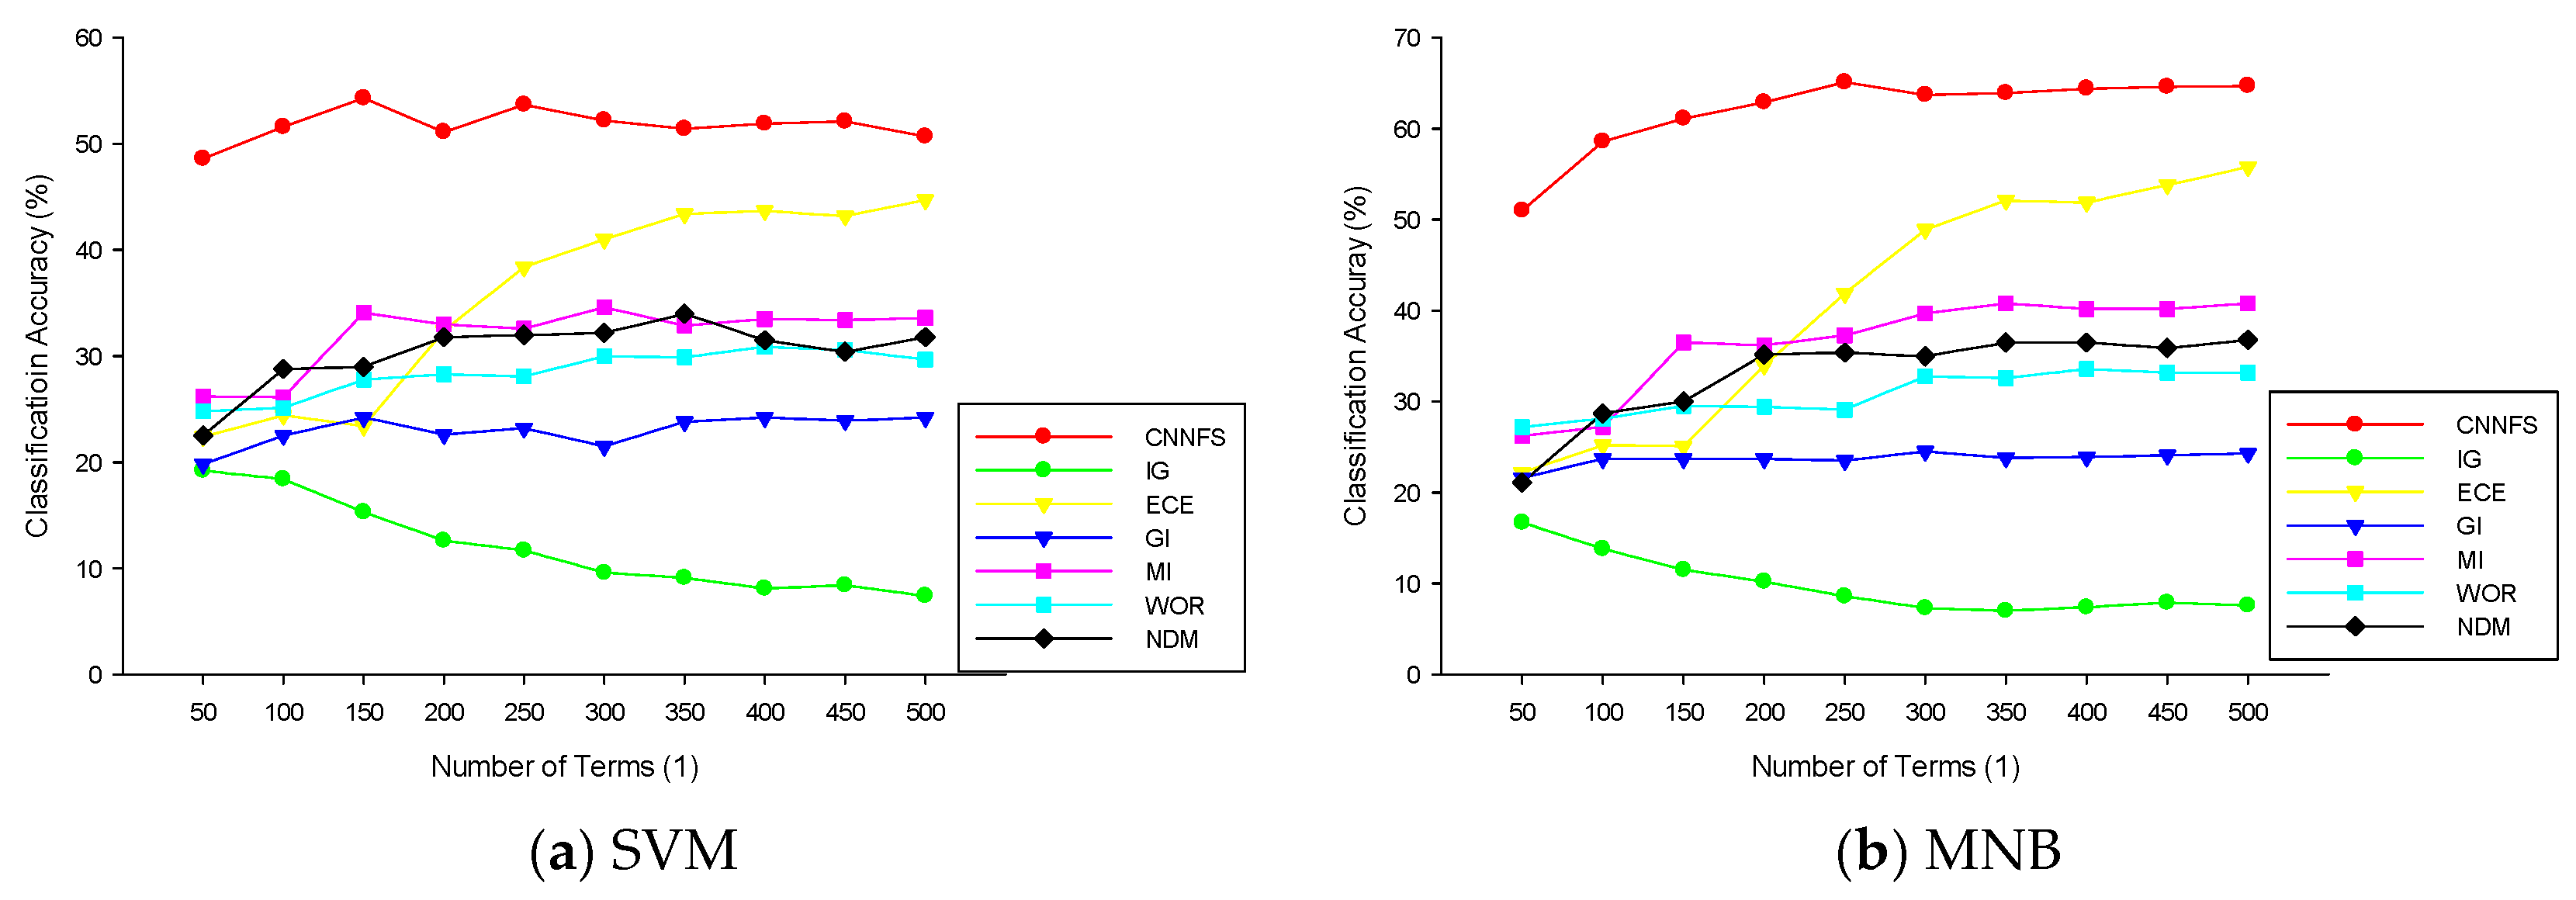
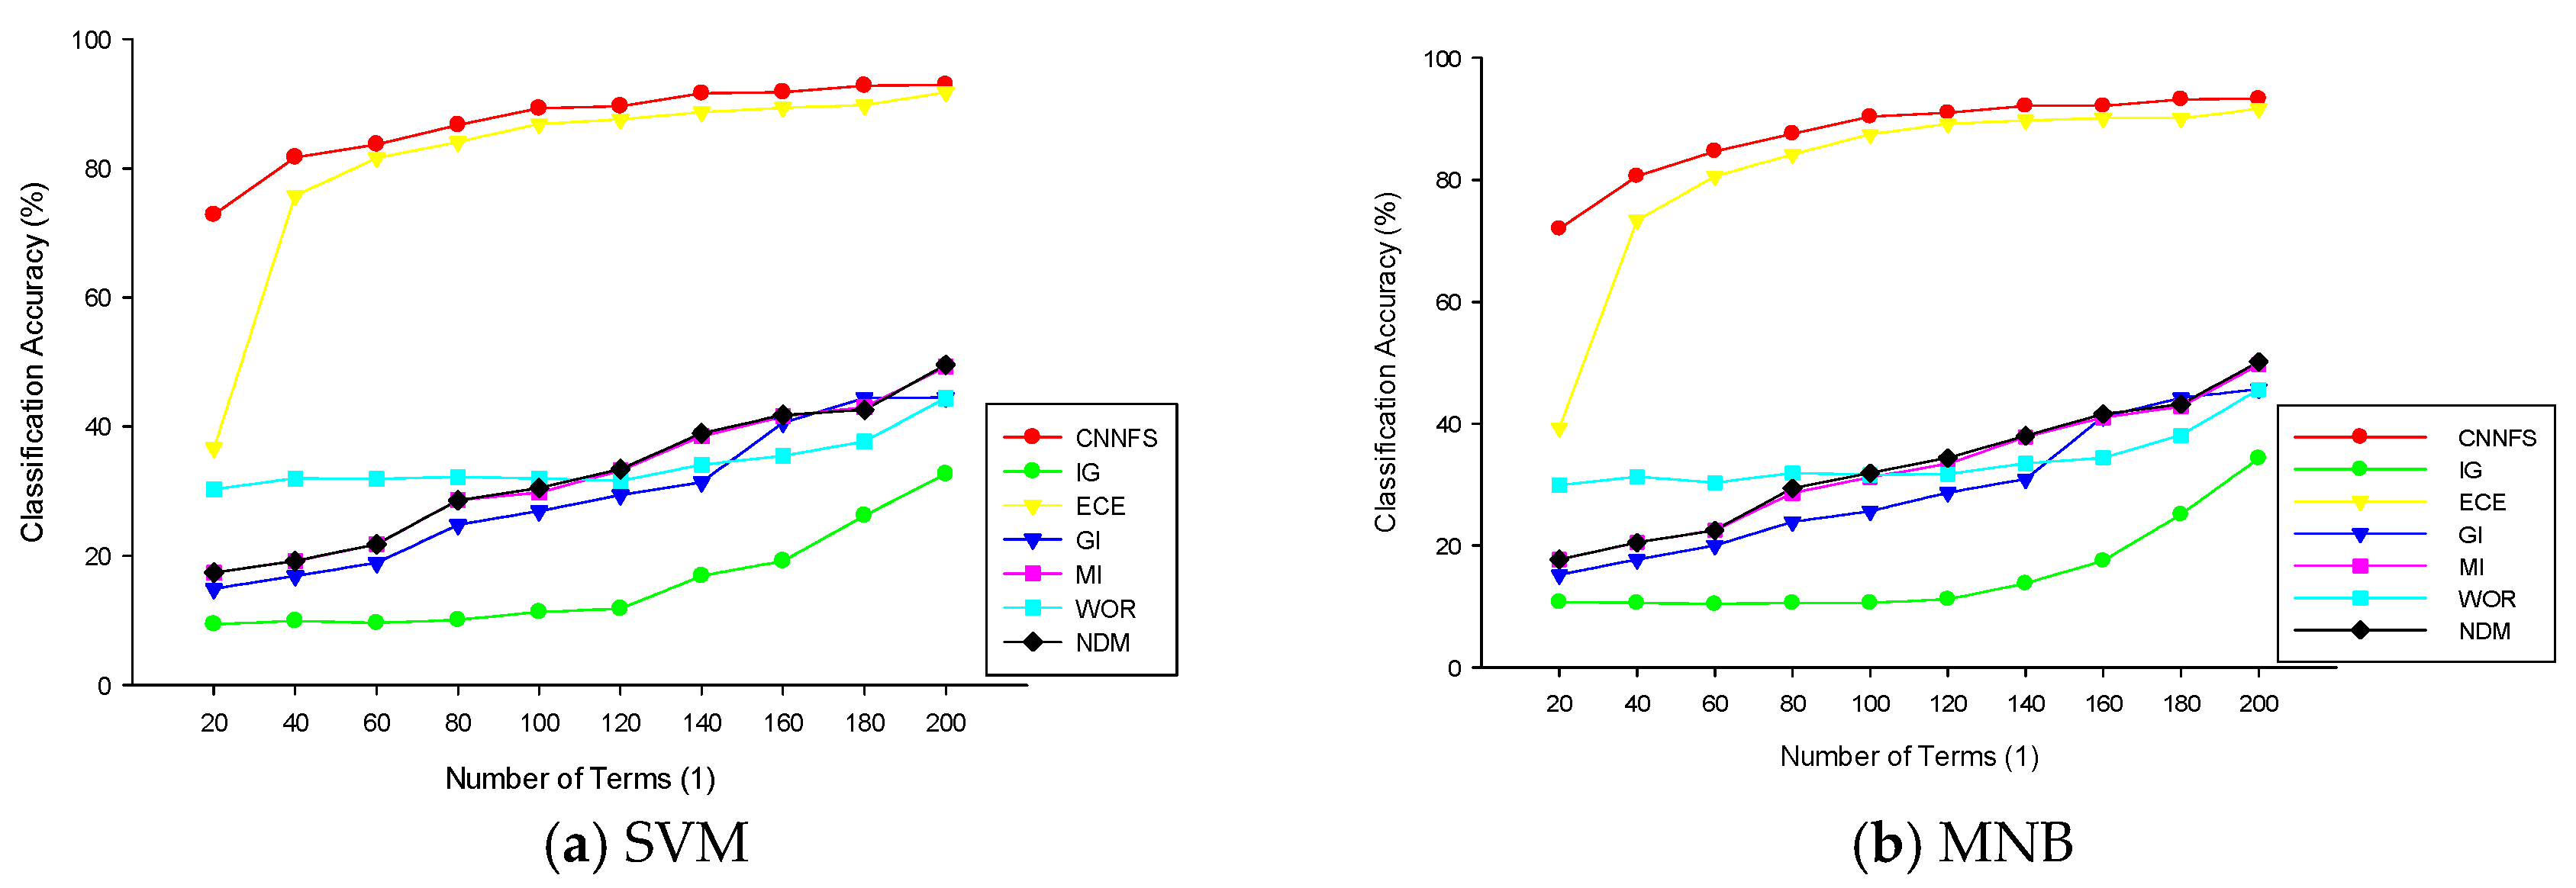
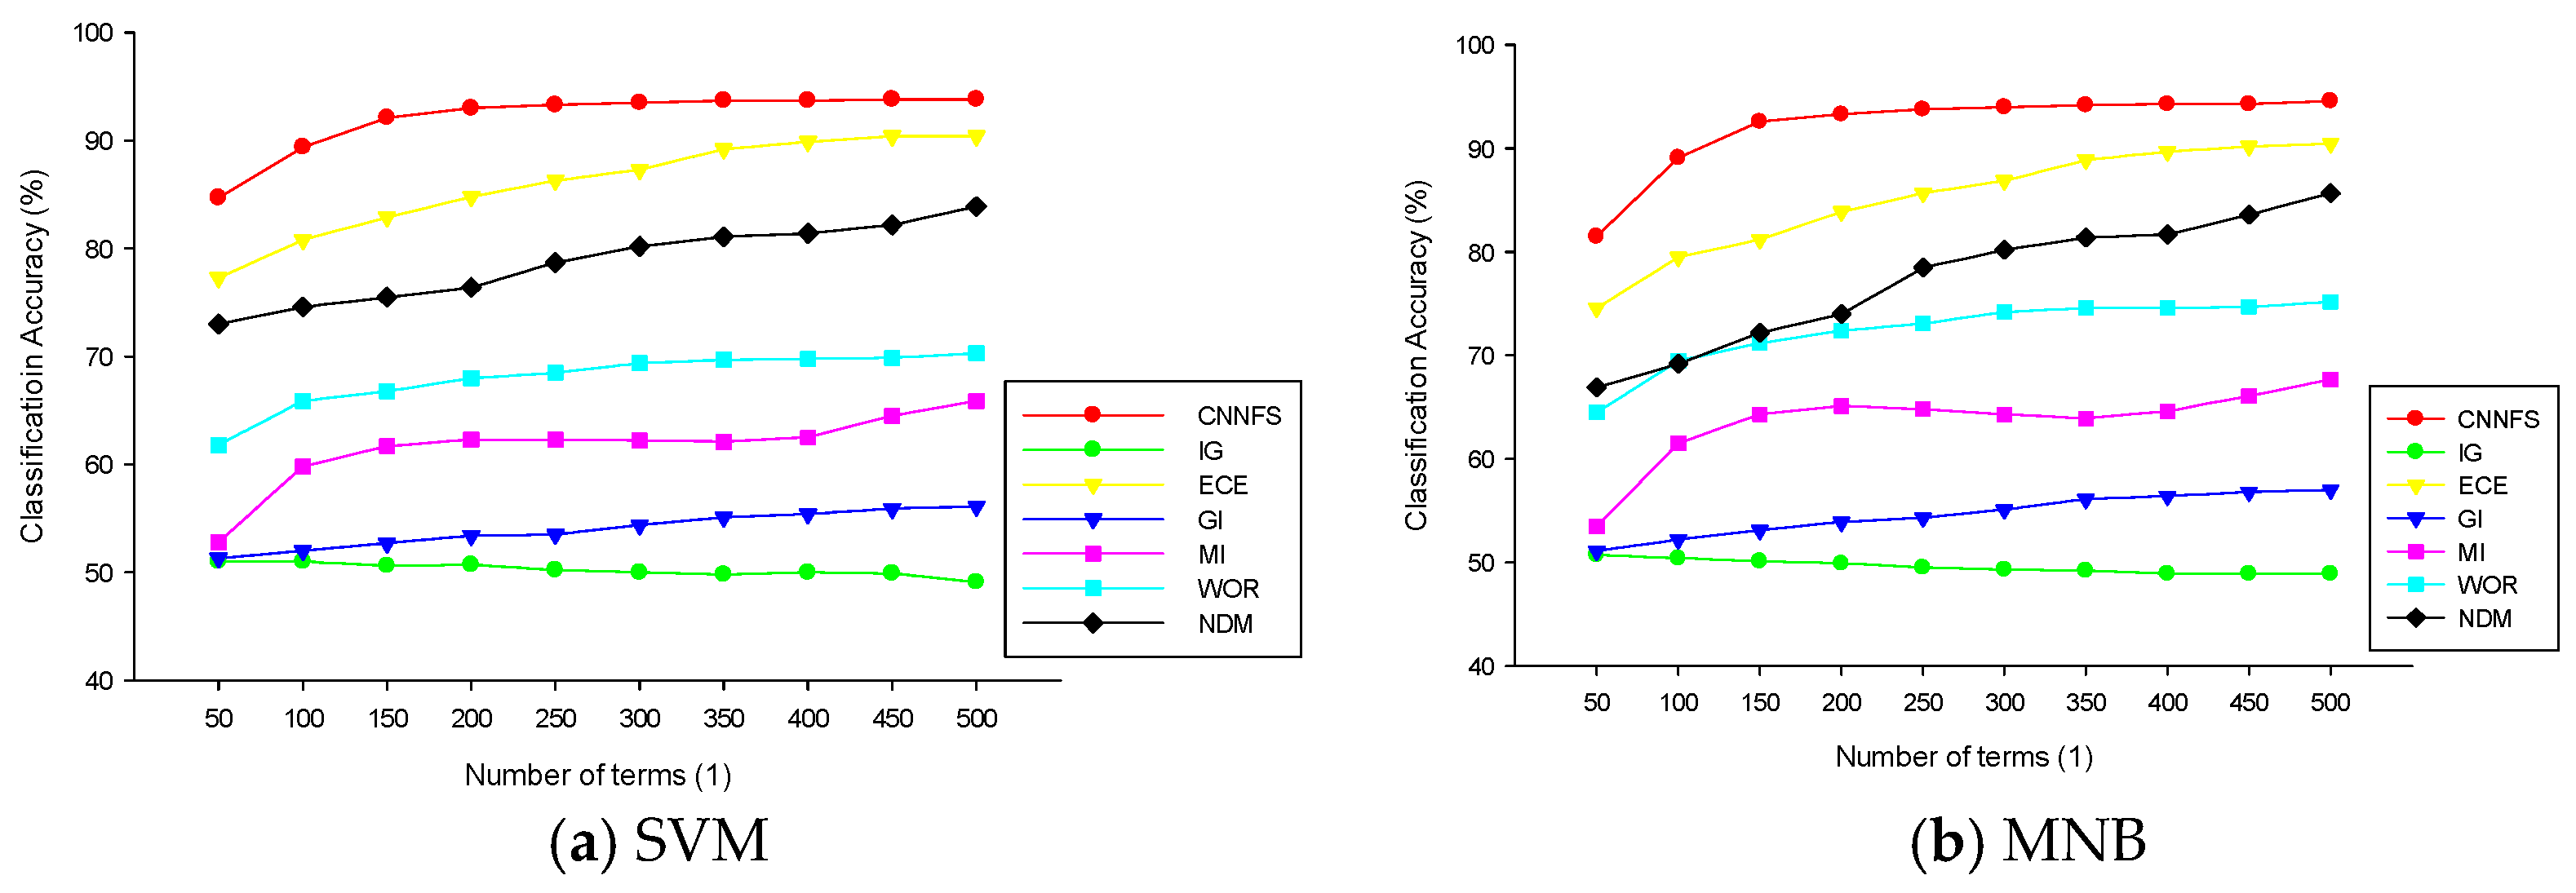
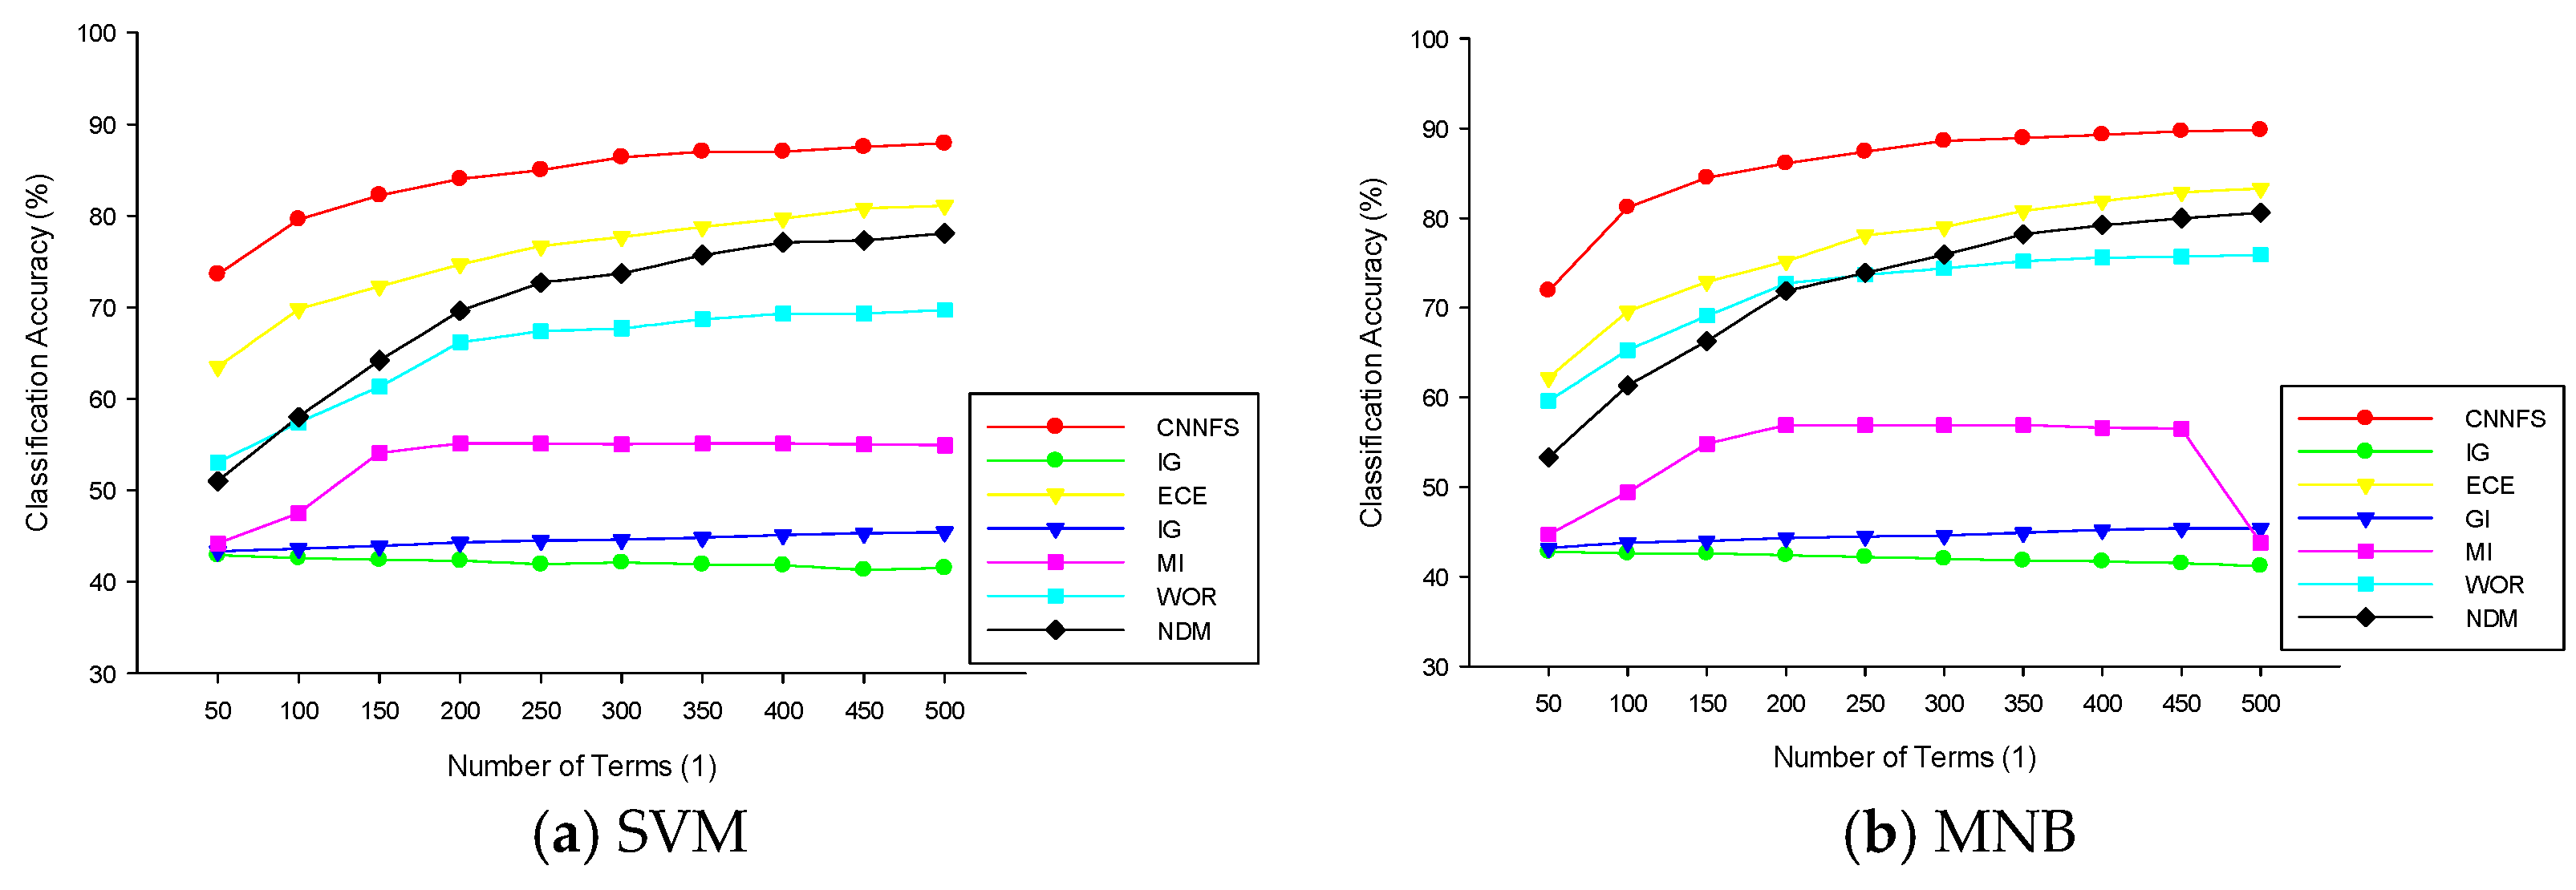
4.3.1. Classification Accuracy Analysis
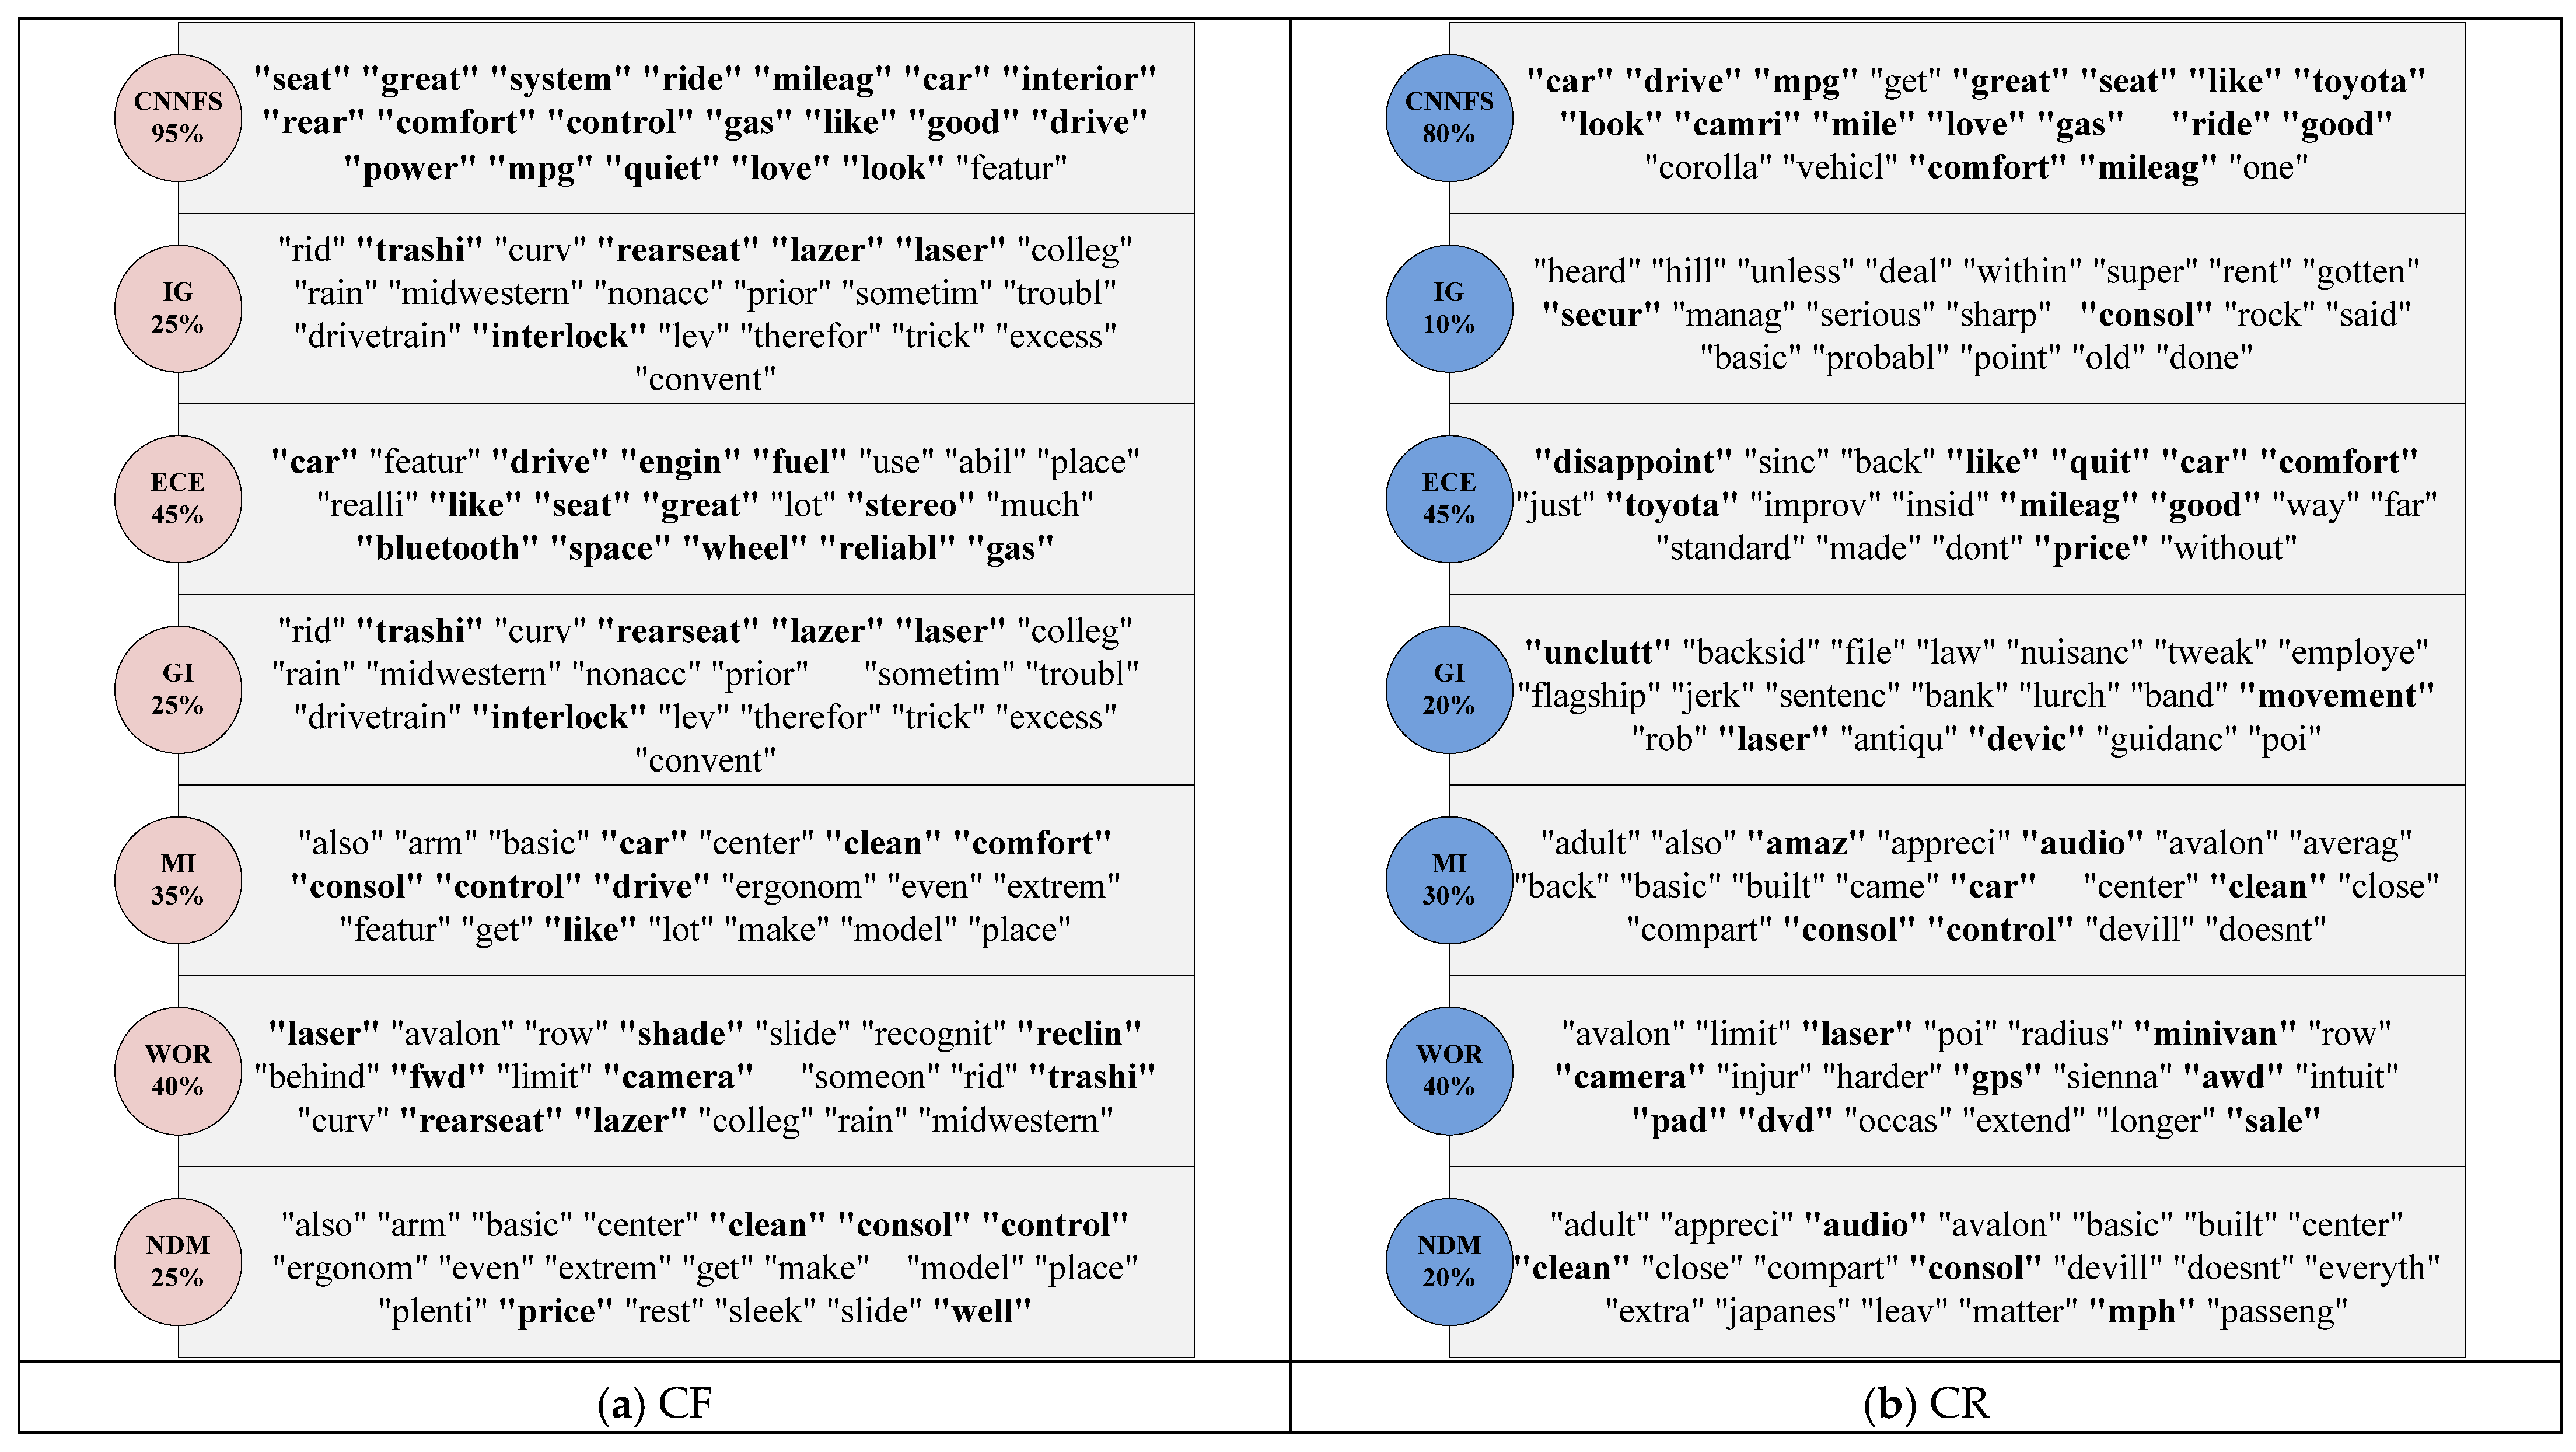
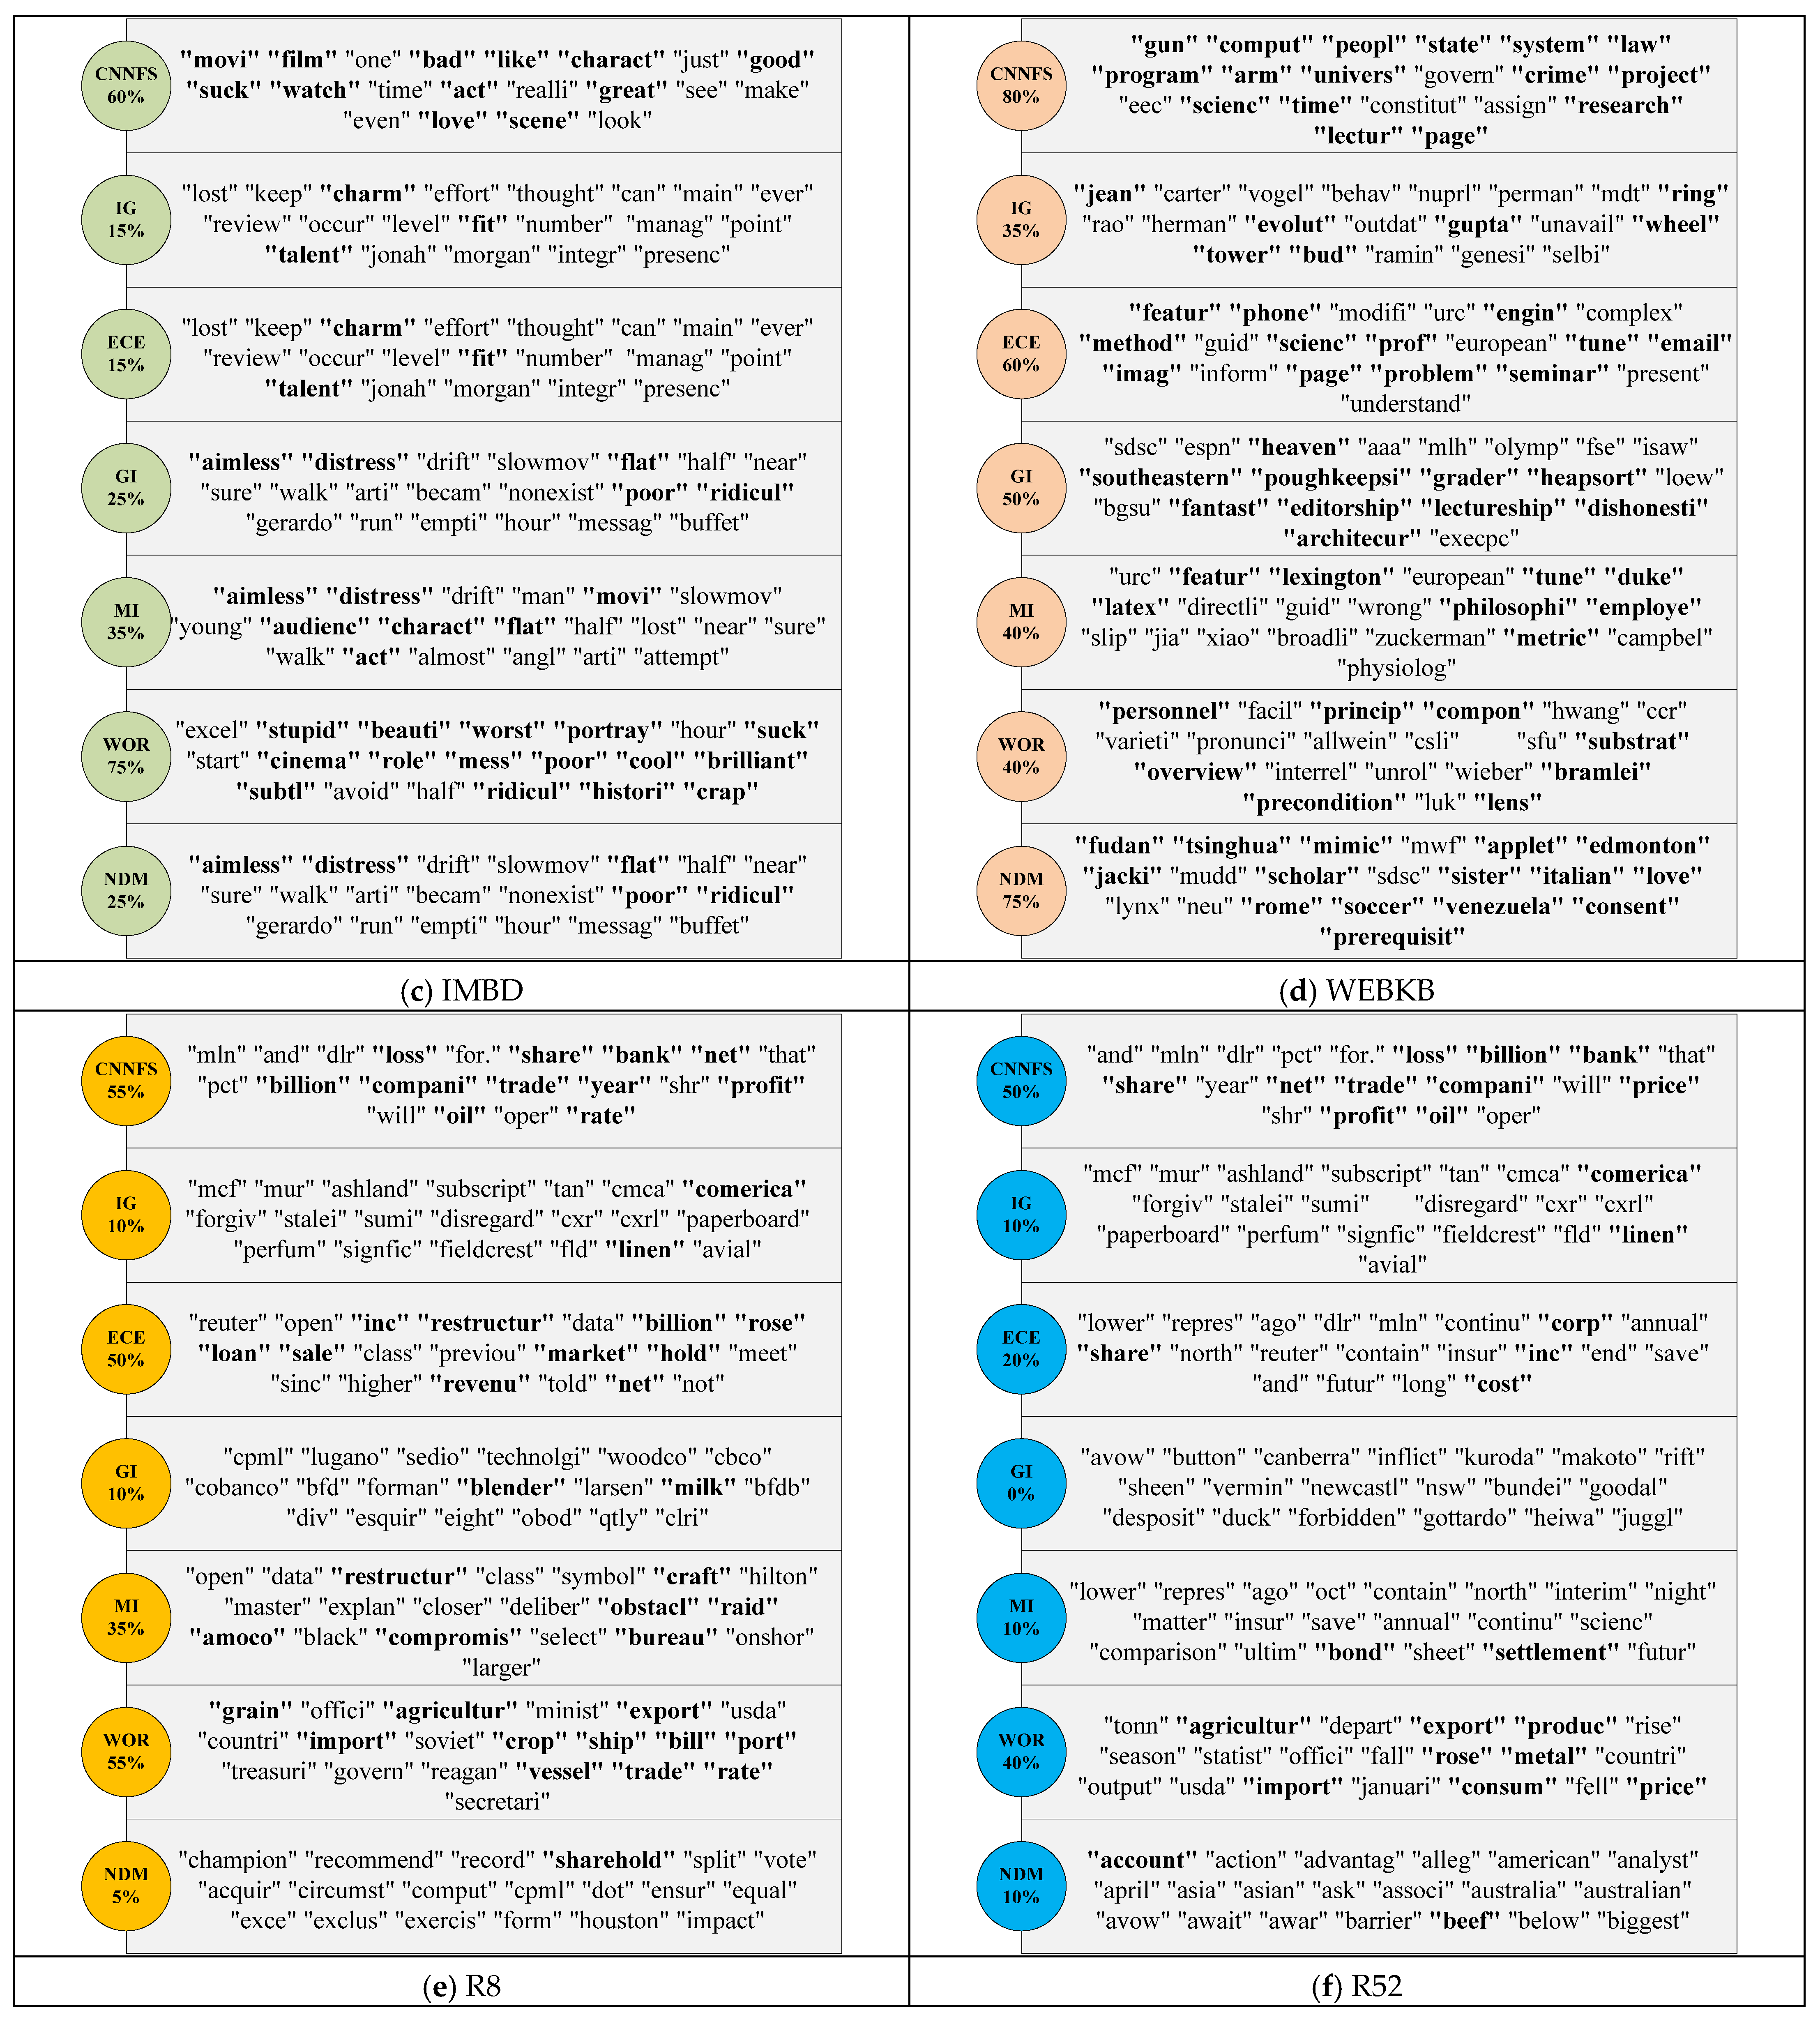
4.3.2. Semantics Analysis
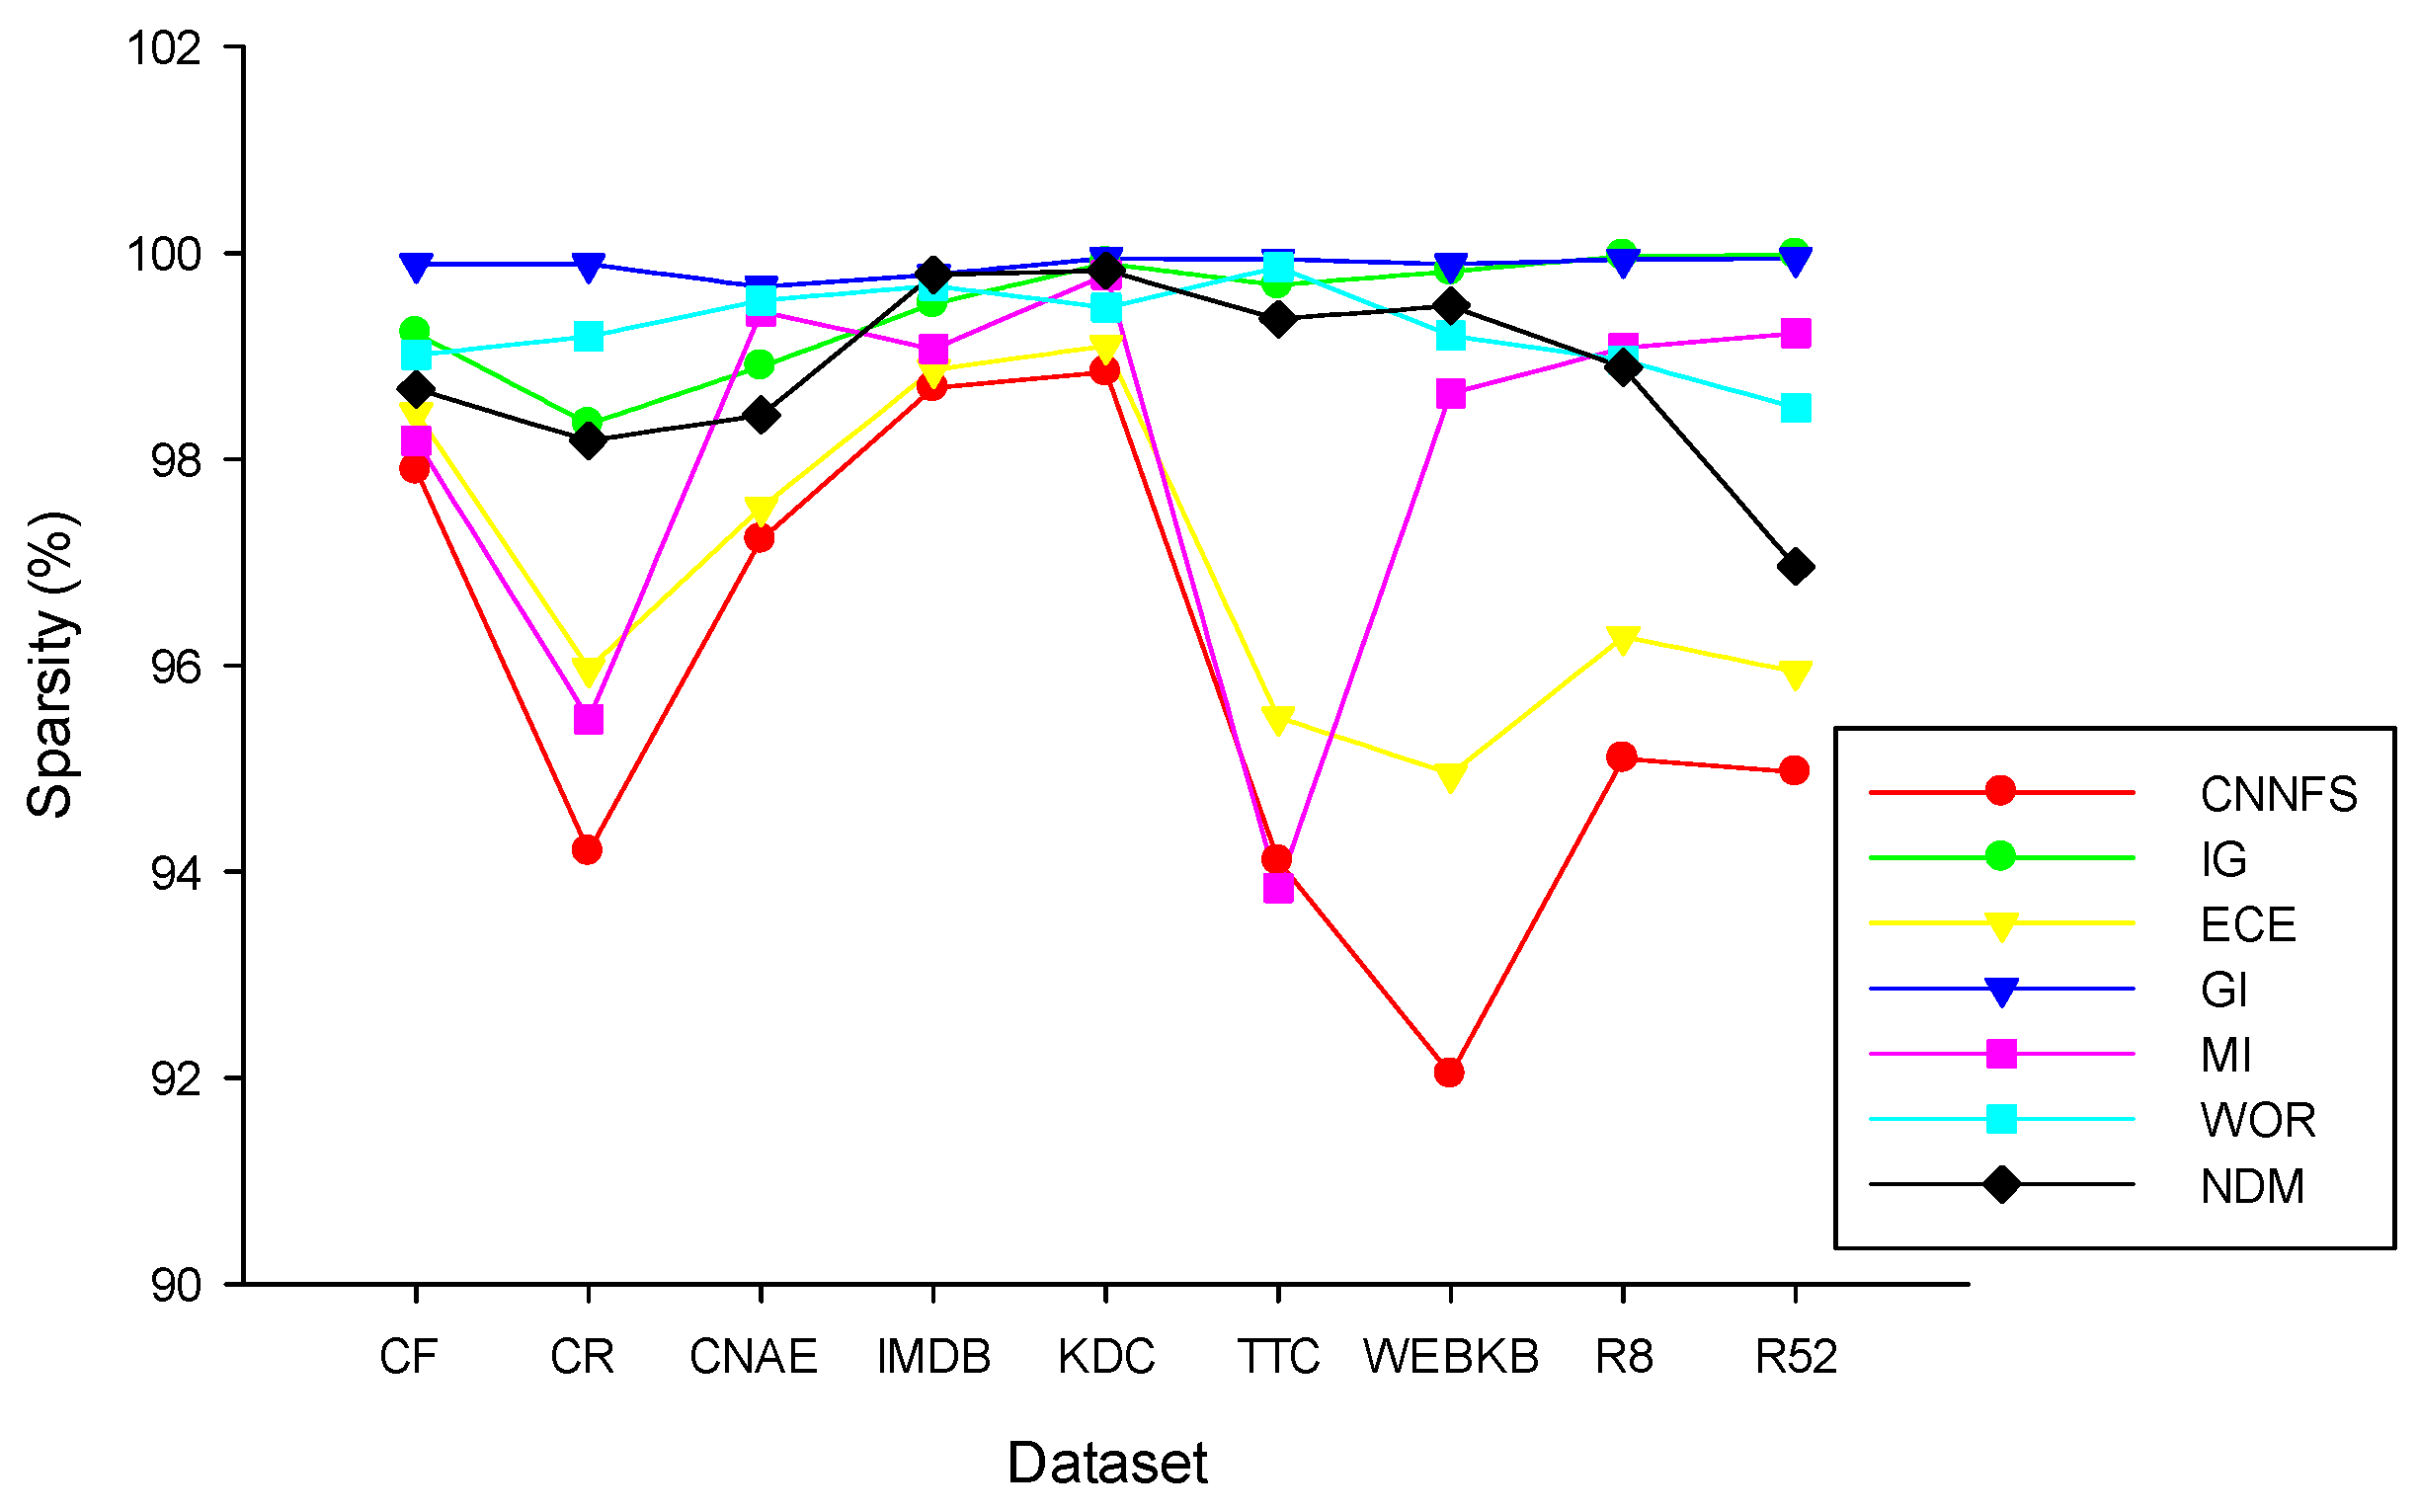
4.3.3. Sparsity Analysis
5. Conclusions
Author Contributions
Funding
Data Availability Statement
Conflicts of Interest
Appendix A
| (1) CF Dataset | |||||||
| SVM | CNN | IG | ECE | GI | MI_avg | WOR | NDM |
| 50 | 30.9 | 19.5 | 25.5 | 21.4 | 24.3 | 29.1 | 23.1 |
| 100 | 33.9 | 17.1 | 29.3 | 19.9 | 26.4 | 31.3 | 25.3 |
| 150 | 36.6 | 16.2 | 30.6 | 19.5 | 27.5 | 31.8 | 27.2 |
| 200 | 37 | 15.3 | 32.5 | 22.8 | 30.6 | 34.3 | 28 |
| 250 | 37 | 14.2 | 32.1 | 22.4 | 31.6 | 34.1 | 27.8 |
| 300 | 35.6 | 13.7 | 33.7 | 22.3 | 30.9 | 32.8 | 26.4 |
| 350 | 35.7 | 13.5 | 33.3 | 22.3 | 32.1 | 33.6 | 26.7 |
| 400 | 36.3 | 13.5 | 33.8 | 22.3 | 32.1 | 33.8 | 26.5 |
| 450 | 36.4 | 13.6 | 33.4 | 22.3 | 32.2 | 33.5 | 27.1 |
| 500 | 36.4 | 14.2 | 34.6 | 22.6 | 32.4 | 33.9 | 27.9 |
| MNB | CNN | IG | ECE | GI | MI_avg | WOR | NDM |
| 50 | 31.08 | 17.8 | 26 | 21.4 | 25.2 | 28.5 | 24.2 |
| 100 | 36.4 | 15.2 | 30.9 | 21.4 | 28.3 | 31.5 | 25 |
| 150 | 41.3 | 13.2 | 32.8 | 21.4 | 29.5 | 31.9 | 27.3 |
| 200 | 41.3 | 12.1 | 35.1 | 21.4 | 30.6 | 34.1 | 29.4 |
| 250 | 41.1 | 11.6 | 37 | 21.4 | 33.3 | 33.9 | 30.4 |
| 300 | 41.8 | 10.9 | 38.8 | 21.6 | 34.5 | 33.3 | 32.4 |
| 350 | 42.5 | 11.9 | 39.4 | 21.4 | 34.7 | 33.4 | 32.3 |
| 400 | 42.5 | 12.7 | 39.1 | 20.1 | 34.7 | 33.5 | 31.8 |
| 450 | 42.7 | 13.1 | 39.8 | 19.2 | 34.8 | 34.9 | 33.1 |
| 500 | 43.1 | 13 | 40.2 | 19.1 | 35.8 | 35.4 | 32.9 |
| (2) CR Dataset | |||||||
| SVM | CNN | IG | ECE | GI | MI_avg | WOR | NDM |
| 50 | 48.6 | 19.2 | 22.4 | 19.8 | 26.2 | 24.8 | 22.5 |
| 100 | 51.6 | 18.4 | 24.4 | 22.5 | 26.1 | 25.1 | 28.8 |
| 150 | 54.3 | 15.3 | 23.4 | 24.2 | 34.1 | 27.8 | 29 |
| 200 | 51.1 | 12.6 | 32.4 | 22.6 | 33 | 28.3 | 31.8 |
| 250 | 53.7 | 11.7 | 38.4 | 23.2 | 32.6 | 28.1 | 32 |
| 300 | 52.2 | 9.6 | 41 | 21.5 | 34.6 | 30 | 32.2 |
| 350 | 51.4 | 9.1 | 43.4 | 23.8 | 32.9 | 29.9 | 34 |
| 400 | 51.9 | 8.1 | 43.7 | 24.2 | 33.5 | 30.9 | 31.5 |
| 450 | 52.1 | 8.4 | 43.2 | 23.9 | 33.4 | 30.6 | 30.4 |
| 500 | 50.7 | 7.4 | 44.7 | 24.2 | 33.6 | 29.7 | 31.8 |
| MNB | CNN | IG | ECE | GI | MI_avg | WOR | NDM |
| 50 | 51 | 16.7 | 22.2 | 21.6 | 26.2 | 27.2 | 21.1 |
| 100 | 58.6 | 13.8 | 25.2 | 23.7 | 27.2 | 28.1 | 28.7 |
| 150 | 61.1 | 11.5 | 25.1 | 23.7 | 36.5 | 29.5 | 30 |
| 200 | 62.9 | 10.2 | 34 | 23.7 | 36.2 | 29.4 | 35.2 |
| 250 | 65.1 | 8.6 | 41.9 | 23.5 | 37.3 | 29.1 | 35.4 |
| 300 | 63.7 | 7.3 | 48.9 | 24.5 | 39.7 | 32.8 | 35 |
| 350 | 63.9 | 7 | 52.1 | 23.8 | 40.8 | 32.6 | 36.5 |
| 400 | 64.4 | 7.4 | 51.9 | 23.9 | 40.2 | 33.6 | 36.5 |
| 450 | 64.6 | 7.9 | 53.8 | 24.1 | 40.2 | 33.2 | 35.9 |
| 500 | 64.7 | 7.6 | 55.8 | 24.3 | 40.8 | 33.2 | 36.8 |
| (3) CNAE Dataset | |||||||
| SVM | CNN | IG | ECE | GI | MI_avg | WOR | NDM |
| 20 | 72.8 | 9.4 | 36.7 | 14.9 | 17.4 | 30.3 | 17.4 |
| 40 | 81.7 | 9.9 | 75.8 | 16.9 | 19.2 | 32 | 19.2 |
| 60 | 83.7 | 9.6 | 81.6 | 18.9 | 21.8 | 31.9 | 21.8 |
| 80 | 86.7 | 10.1 | 84.1 | 24.8 | 28.6 | 32.2 | 28.6 |
| 100 | 89.3 | 11.3 | 86.9 | 26.9 | 29.8 | 32 | 30.5 |
| 120 | 89.6 | 11.8 | 87.6 | 29.4 | 33.2 | 31.6 | 33.4 |
| 140 | 91.6 | 16.9 | 88.7 | 31.4 | 38.5 | 34.1 | 39 |
| 160 | 91.8 | 19.2 | 89.4 | 40.6 | 41.6 | 35.5 | 41.8 |
| 180 | 92.8 | 26.2 | 89.8 | 44.4 | 43 | 37.7 | 42.6 |
| 200 | 92.9 | 32.7 | 91.8 | 44.5 | 49.3 | 44.4 | 49.6 |
| MNB | CNN | IG | ECE | GI | MI_avg | WOR | NDM |
| 20 | 72 | 10.7 | 39.3 | 15.2 | 17.7 | 29.9 | 17.7 |
| 40 | 80.6 | 10.6 | 73.4 | 17.7 | 20.5 | 31.3 | 20.5 |
| 60 | 84.7 | 10.4 | 80.6 | 20 | 22.5 | 30.3 | 22.5 |
| 80 | 87.6 | 10.6 | 84.2 | 23.9 | 28.6 | 31.9 | 29.4 |
| 100 | 90.4 | 10.6 | 87.5 | 25.6 | 31.2 | 31.6 | 31.9 |
| 120 | 91 | 11.2 | 89.2 | 28.7 | 33.4 | 31.7 | 34.4 |
| 140 | 92.1 | 13.8 | 89.8 | 30.9 | 37.8 | 33.5 | 38 |
| 160 | 92.1 | 17.5 | 90.1 | 41.1 | 41 | 34.4 | 41.6 |
| 180 | 93.2 | 25.1 | 90.1 | 44.2 | 42.8 | 38.1 | 43.2 |
| 200 | 93.3 | 34.3 | 91.7 | 45.7 | 49.7 | 45.6 | 50.2 |
| (4) IMDB Dataset | |||||||
| SVM | CNN | IG | ECE | GI | MI_avg | WOR | NDM |
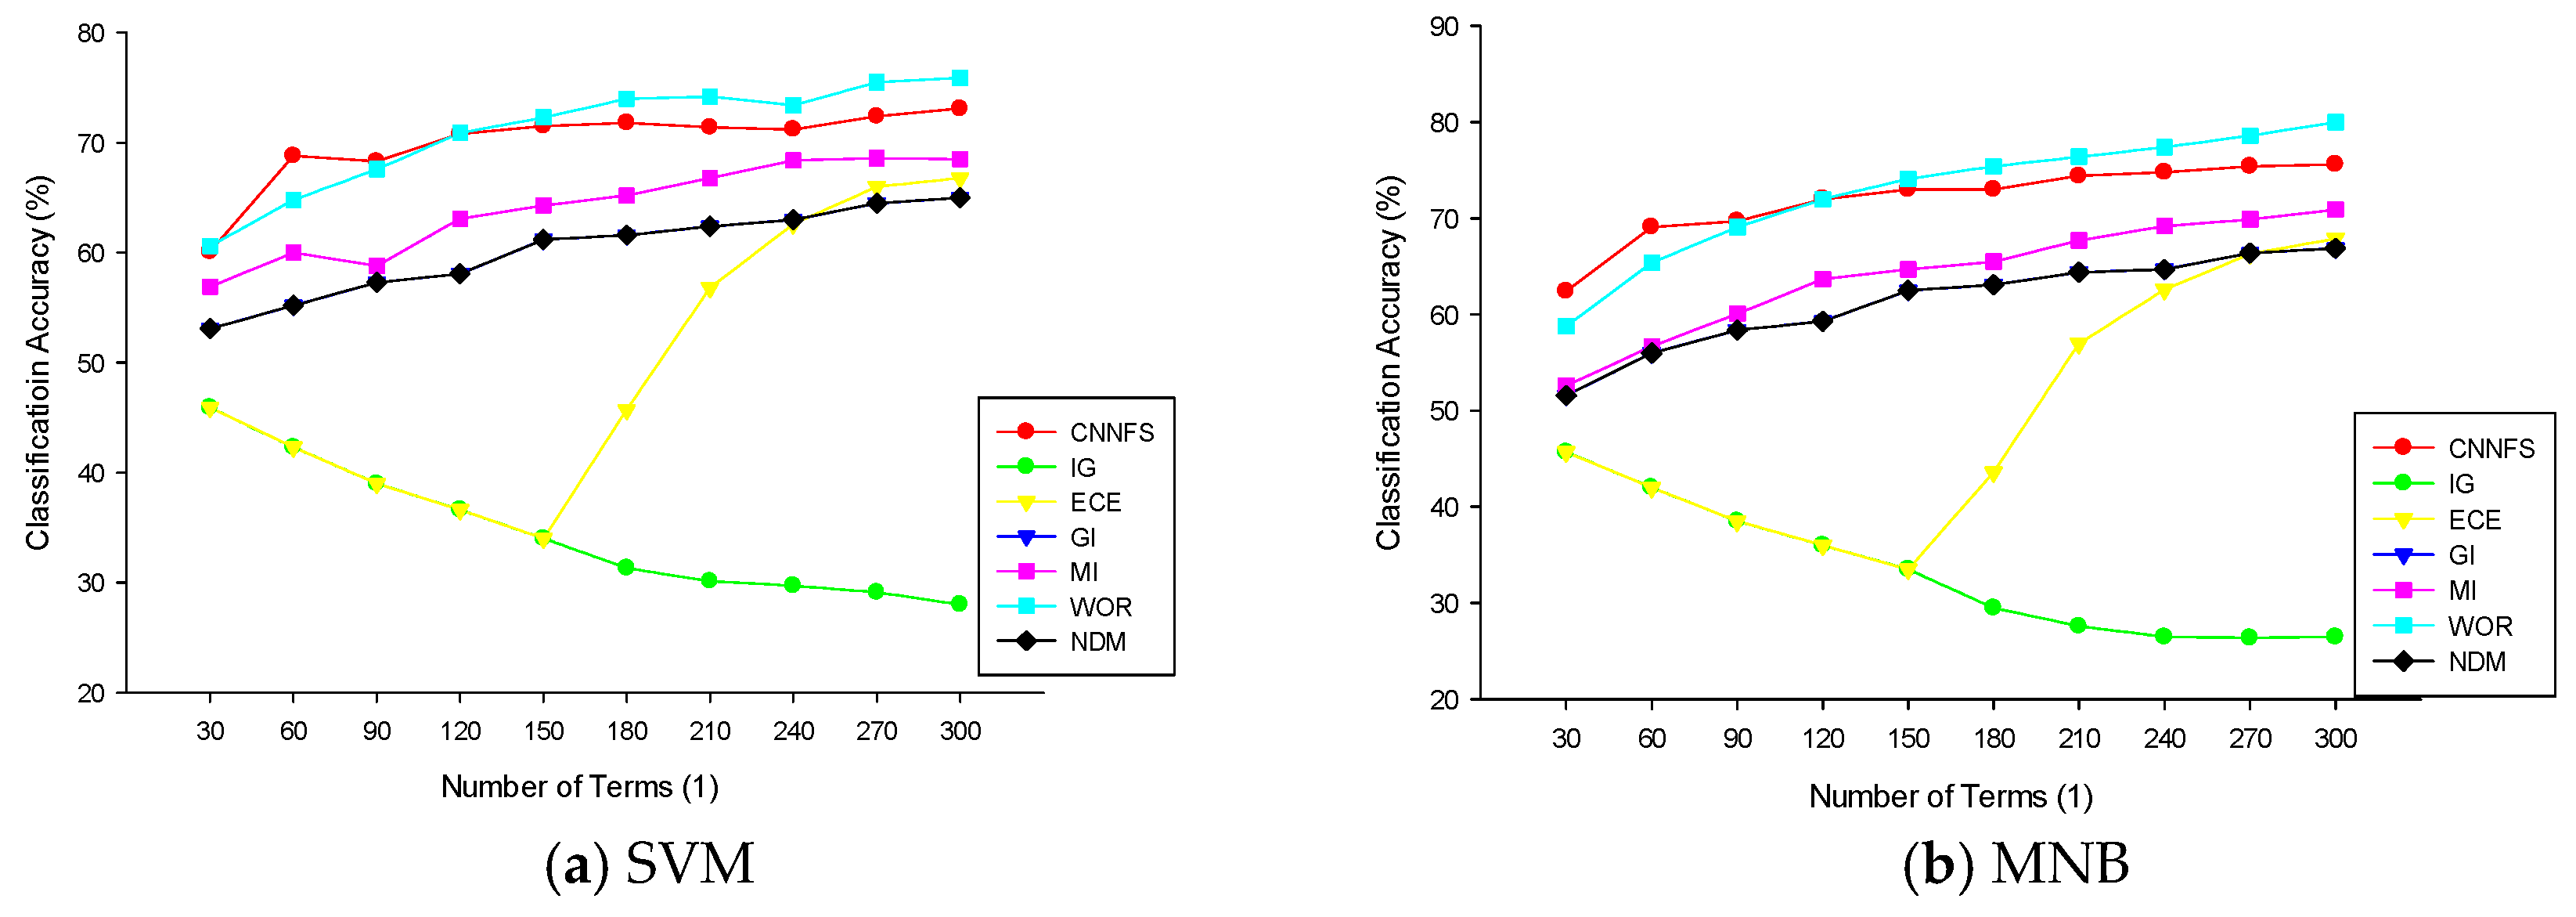
| 30 | 60.1 | 45.9 | 45.9 | 53.1 | 56.9 | 60.6 | 53.1 |
| 60 | 68.8 | 42.3 | 42.3 | 55.2 | 60 | 64.8 | 55.2 |
| 90 | 68.3 | 39 | 39 | 57.3 | 58.8 | 67.6 | 57.3 |
| 120 | 70.8 | 36.6 | 36.6 | 58.1 | 63.1 | 70.9 | 58.1 |
| 150 | 71.5 | 34 | 34 | 61.2 | 64.3 | 72.3 | 61.2 |
| 180 | 71.8 | 31.3 | 45.7 | 61.6 | 65.2 | 74 | 61.6 |
| 210 | 71.4 | 30.1 | 56.8 | 62.4 | 66.8 | 74.2 | 62.4 |
| 240 | 71.2 | 29.7 | 62.6 | 63 | 68.4 | 73.4 | 63 |
| 270 | 72.4 | 29.1 | 66 | 64.5 | 68.6 | 75.5 | 64.5 |
| 300 | 73.1 | 28 | 66.8 | 65 | 68.5 | 75.9 | 65 |
| MNB | CNN | IG | ECE | GI | MI_avg | WOR | NDM |
| 30 | 62.4 | 45.7 | 45.7 | 51.6 | 52.6 | 58.8 | 51.6 |
| 60 | 69.1 | 42 | 42 | 56 | 56.7 | 65.4 | 56 |
| 90 | 69.7 | 38.5 | 38.5 | 58.4 | 60.1 | 69.1 | 58.4 |
| 120 | 72 | 36 | 36 | 59.3 | 63.7 | 72 | 59.3 |
| 150 | 73 | 33.5 | 33.5 | 62.5 | 64.7 | 74.1 | 62.5 |
| 180 | 73 | 29.5 | 43.6 | 63.1 | 65.5 | 75.4 | 63.1 |
| 210 | 74.4 | 27.6 | 57 | 64.4 | 67.7 | 76.4 | 64.4 |
| 240 | 74.8 | 26.5 | 62.6 | 64.7 | 69.2 | 77.4 | 64.7 |
| 270 | 75.4 | 26.4 | 66.3 | 66.4 | 69.9 | 78.6 | 66.4 |
| 300 | 75.6 | 26.5 | 67.9 | 66.9 | 70.9 | 80 | 66.9 |
| (5) KDC Dataset | |||||||
| SVM | CNN | IG | ECE | GI | MI_avg | WOR | NDM |
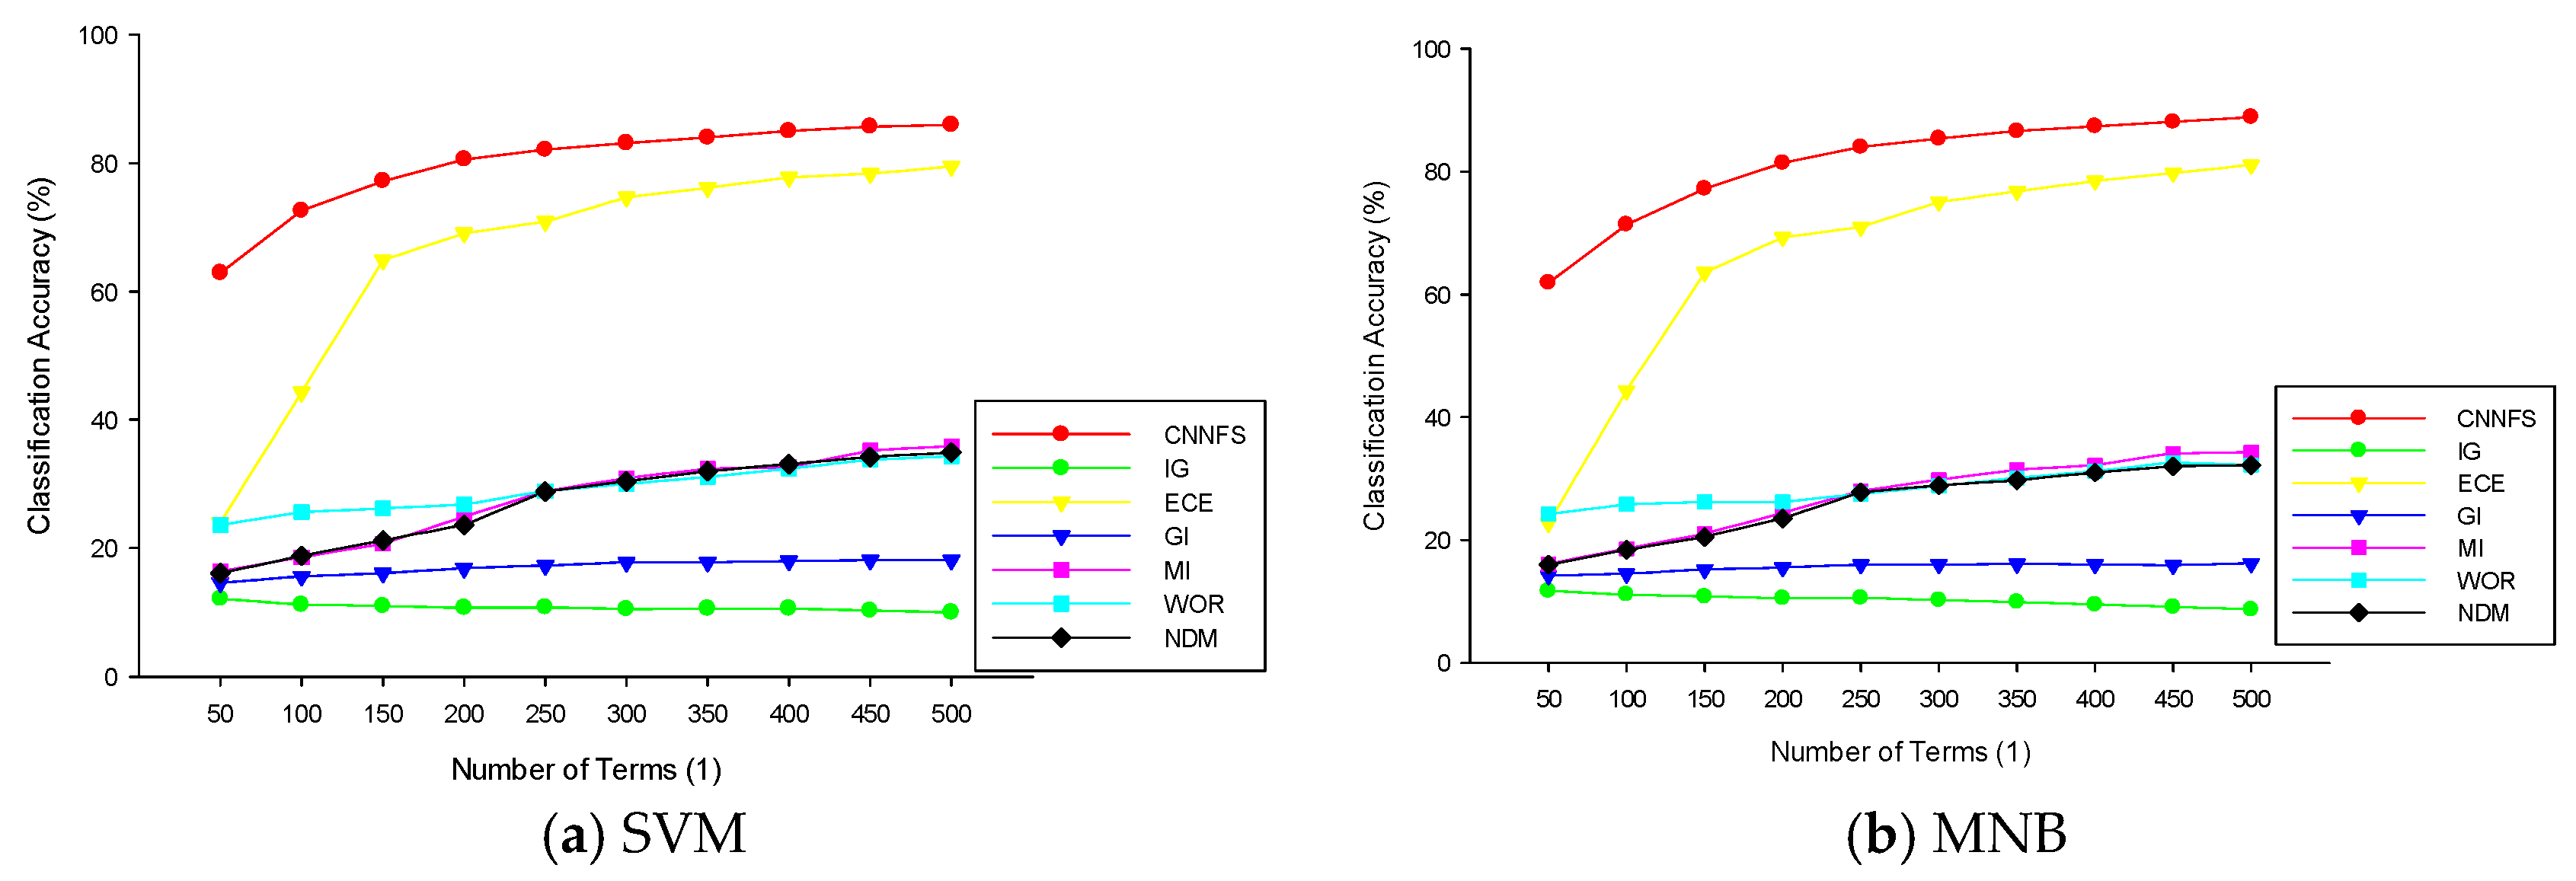
| 50 | 62.9 | 12.1 | 24 | 14.6 | 16.4 | 23.6 | 16.1 |
| 100 | 72.6 | 11.2 | 44.3 | 15.6 | 18.6 | 25.6 | 18.8 |
| 150 | 77.2 | 11 | 64.9 | 16.1 | 20.7 | 26.2 | 21.2 |
| 200 | 80.6 | 10.7 | 69.1 | 16.9 | 24.9 | 26.8 | 23.6 |
| 250 | 82.1 | 10.8 | 70.9 | 17.3 | 28.9 | 28.9 | 28.8 |
| 300 | 83.1 | 10.5 | 74.7 | 17.8 | 30.9 | 30 | 30.4 |
| 350 | 84 | 10.6 | 76.2 | 17.8 | 32.4 | 31.1 | 32 |
| 400 | 85 | 10.6 | 77.8 | 18 | 32.6 | 32.4 | 33.1 |
| 450 | 85.7 | 10.3 | 78.4 | 18.1 | 35.2 | 33.8 | 34.2 |
| 500 | 86 | 10 | 79.5 | 18.1 | 35.9 | 34.3 | 34.9 |
| MNB | CNN | IG | ECE | GI | MI_avg | WOR | NDM |
| 50 | 61.9 | 11.7 | 22.7 | 14.2 | 16.1 | 24.2 | 16 |
| 100 | 71.4 | 11.1 | 44.3 | 14.5 | 18.6 | 25.8 | 18.4 |
| 150 | 77.2 | 10.8 | 63.6 | 15.2 | 21 | 26.2 | 20.5 |
| 200 | 81.4 | 10.5 | 69.3 | 15.5 | 24.4 | 26.2 | 23.5 |
| 250 | 84 | 10.6 | 71 | 16 | 28 | 27.5 | 27.8 |
| 300 | 85.4 | 10.2 | 75.1 | 16 | 29.8 | 28.8 | 28.9 |
| 350 | 86.6 | 9.9 | 76.8 | 16.1 | 31.42 | 30.1 | 29.7 |
| 400 | 87.4 | 9.5 | 78.5 | 16 | 32.2 | 31.2 | 31 |
| 450 | 88.1 | 9.1 | 79.8 | 15.9 | 34.1 | 32.6 | 32 |
| 500 | 88.9 | 8.7 | 81.1 | 16.2 | 34.3 | 32.2 | 32.2 |
| (6) TTC Dataset | |||||||
| SVM | CNN | IG | ECE | GI | MI_avg | WOR | NDM |
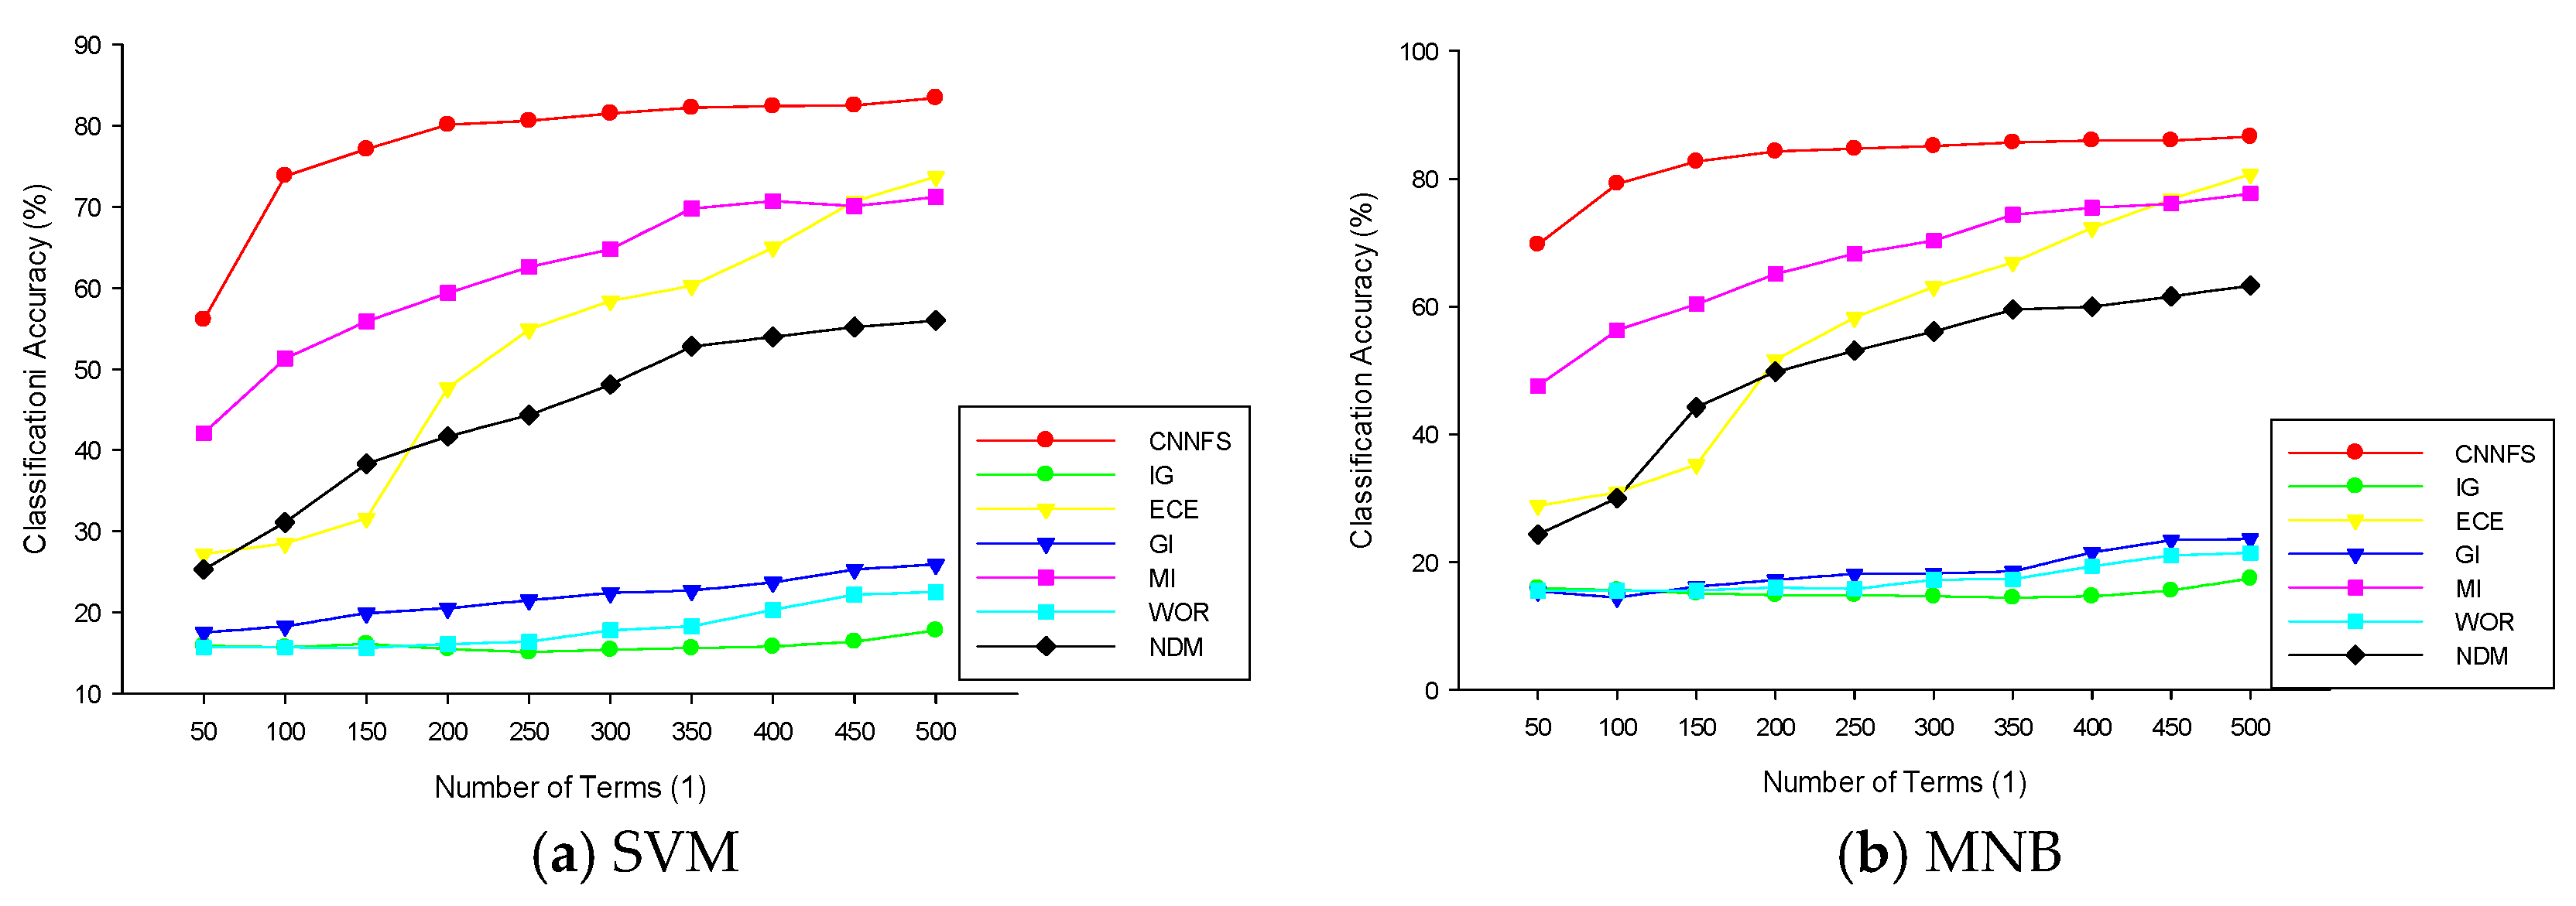
| 50 | 56.1 | 15.9 | 27.2 | 17.5 | 42.1 | 15.7 | 25.3 |
| 100 | 73.8 | 15.7 | 28.5 | 18.3 | 51.3 | 15.7 | 31.1 |
| 150 | 77.1 | 16.1 | 31.6 | 19.9 | 55.9 | 15.6 | 38.3 |
| 200 | 80.1 | 15.5 | 47.7 | 20.5 | 59.4 | 16.1 | 41.7 |
| 250 | 80.6 | 15.1 | 54.9 | 21.5 | 62.6 | 16.4 | 44.3 |
| 300 | 81.5 | 15.4 | 58.4 | 22.4 | 64.8 | 17.8 | 48.1 |
| 350 | 82.2 | 15.6 | 60.3 | 22.7 | 69.8 | 18.3 | 52.8 |
| 400 | 82.4 | 15.8 | 65 | 23.7 | 70.7 | 20.3 | 54 |
| 450 | 82.5 | 16.4 | 70.7 | 25.3 | 70.1 | 22.2 | 55.2 |
| 500 | 83.4 | 17.8 | 73.7 | 25.9 | 71.2 | 22.5 | 56 |
| MNB | CNN | IG | ECE | GI | MI_avg | WOR | NDM |
| 50 | 69.7 | 15.9 | 28.8 | 15.4 | 47.6 | 15.5 | 24.3 |
| 100 | 79.2 | 15.6 | 30.9 | 14.4 | 56.3 | 15.5 | 30 |
| 150 | 82.7 | 15.1 | 35.2 | 16.1 | 60.4 | 15.5 | 44.2 |
| 200 | 84.3 | 14.8 | 51.7 | 17.2 | 65.1 | 16 | 49.8 |
| 250 | 84.7 | 14.8 | 58.3 | 18.1 | 68.3 | 15.75 | 53.1 |
| 300 | 85.1 | 14.6 | 63.1 | 18.2 | 70.3 | 17.2 | 56.1 |
| 350 | 85.7 | 14.4 | 66.9 | 18.5 | 74.4 | 17.3 | 59.5 |
| 400 | 86 | 14.6 | 72.3 | 21.5 | 75.5 | 19.3 | 60 |
| 450 | 86 | 15.5 | 76.8 | 23.4 | 76.1 | 21 | 61.6 |
| 500 | 86.6 | 17.4 | 80.75 | 23.6 | 77.7 | 21.4 | 63.3 |
| (7) WEKBE Dataset | |||||||
| SVM | CNN | IG | ECE | GI | MI_avg | WOR | NDM |
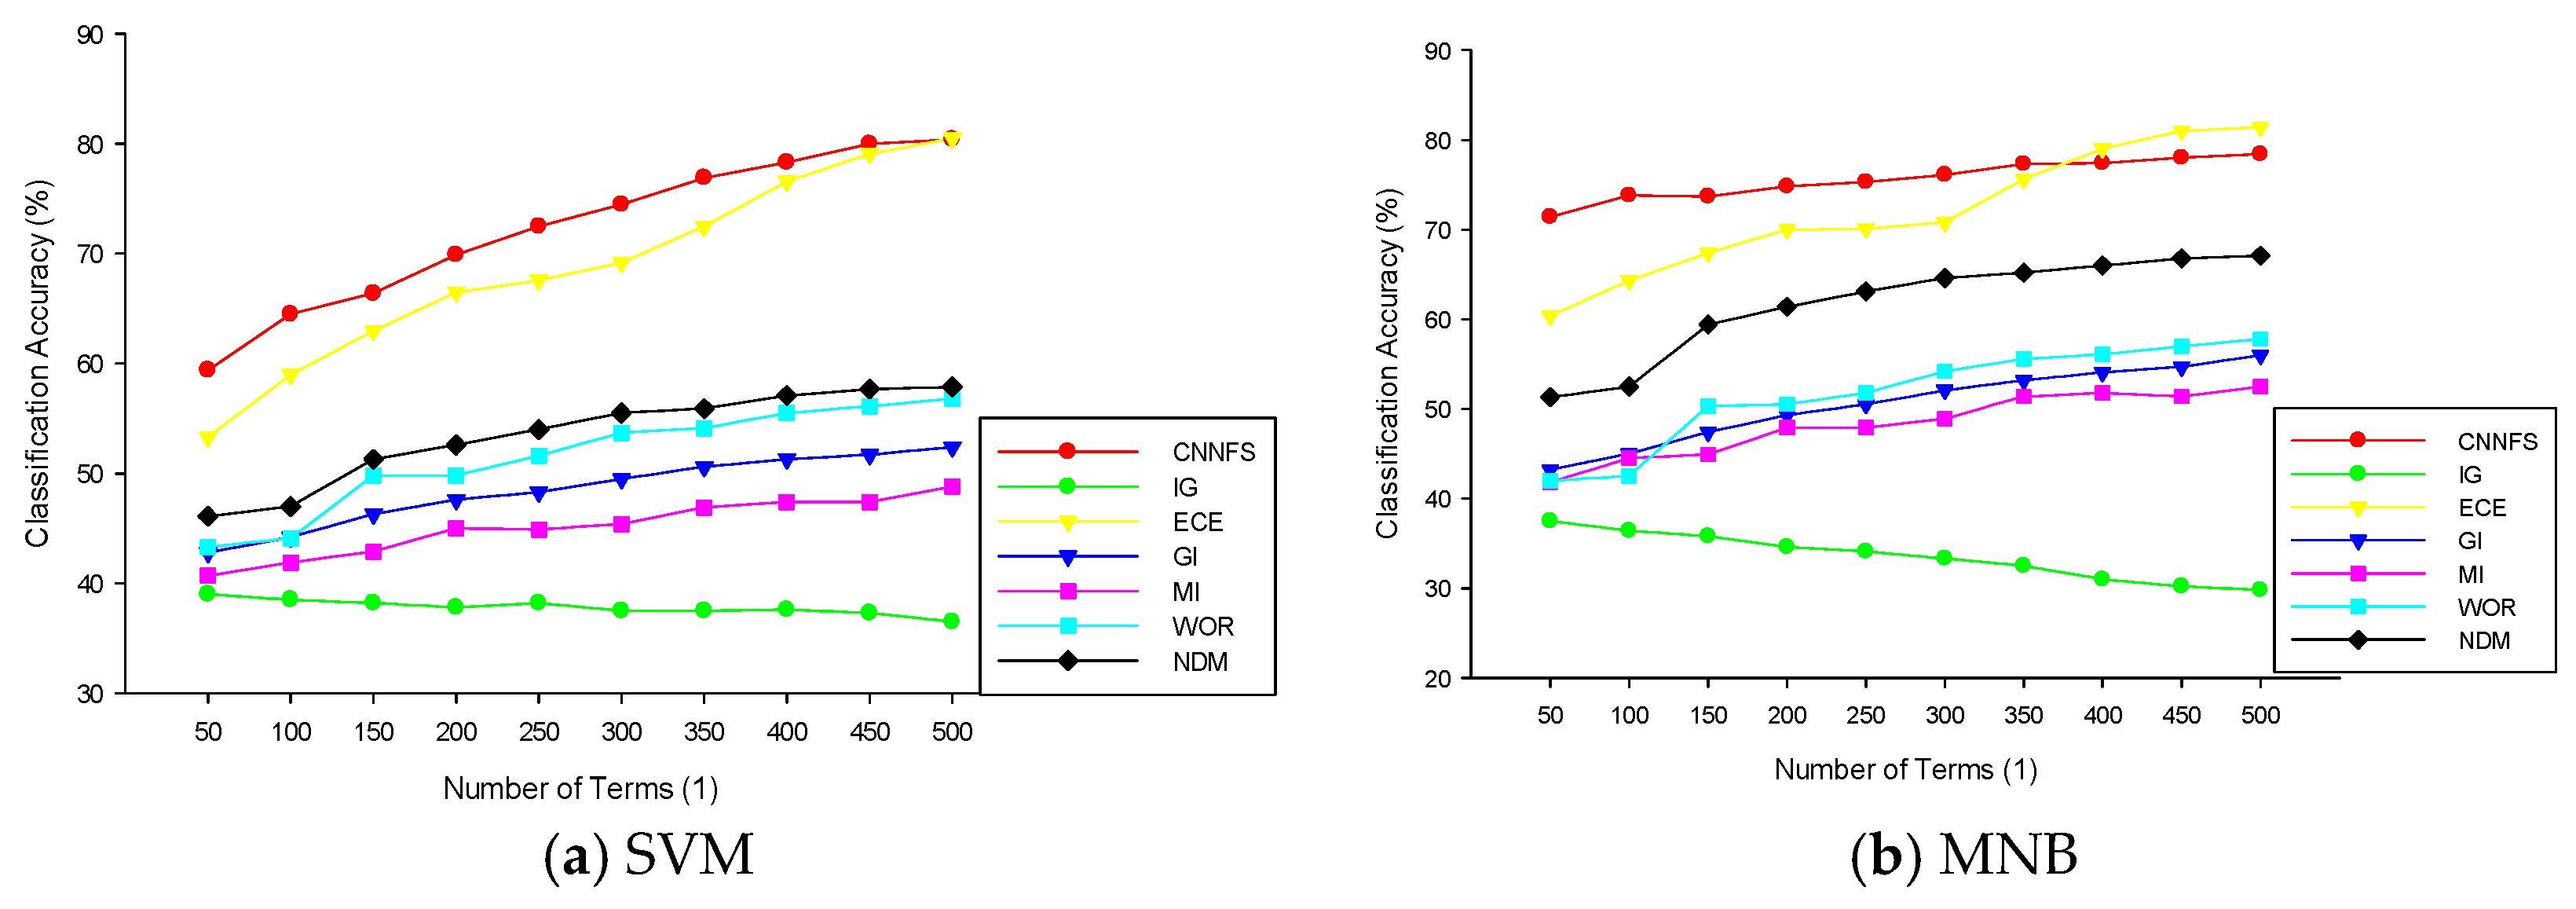
| 50 | 59.4 | 39 | 53.3 | 42.8 | 40.7 | 43.3 | 46.1 |
| 100 | 64.5 | 38.5 | 59 | 44.2 | 41.9 | 44.1 | 47 |
| 150 | 66.4 | 38.2 | 63 | 46.3 | 42.9 | 49.8 | 51.3 |
| 200 | 69.9 | 37.8 | 66.5 | 47.6 | 45 | 49.8 | 52.6 |
| 250 | 72.5 | 38.2 | 67.6 | 48.3 | 44.9 | 51.6 | 54 |
| 300 | 74.5 | 37.5 | 69.2 | 49.5 | 45.4 | 53.7 | 55.5 |
| 350 | 76.9 | 37.5 | 72.5 | 50.6 | 46.9 | 54.1 | 55.9 |
| 400 | 78.3 | 37.6 | 76.6 | 51.3 | 47.4 | 55.5 | 57.1 |
| 450 | 80 | 37.3 | 79.1 | 51.7 | 47.4 | 56.1 | 57.7 |
| 500 | 80.4 | 36.5 | 80.5 | 52.4 | 48.8 | 56.8 | 57.9 |
| MNB | CNN | IG | ECE | GI | MI_avg | WOR | NDM |
| 50 | 71.4 | 37.5 | 60.4 | 43.2 | 41.8 | 42 | 51.3 |
| 100 | 73.8 | 36.4 | 64.3 | 45 | 44.5 | 42.5 | 52.5 |
| 150 | 73.7 | 35.8 | 67.4 | 47.4 | 44.9 | 50.3 | 59.4 |
| 200 | 74.8 | 34.6 | 70 | 49.3 | 47.9 | 50.5 | 61.4 |
| 250 | 75.3 | 34.1 | 70.1 | 50.5 | 47.9 | 51.8 | 63.1 |
| 300 | 76.1 | 33.3 | 70.8 | 52.1 | 48.9 | 54.2 | 64.6 |
| 350 | 77.3 | 32.5 | 75.6 | 53.2 | 51.4 | 55.6 | 65.2 |
| 400 | 77.4 | 31 | 79 | 54.1 | 51.8 | 56.1 | 66 |
| 450 | 78 | 30.2 | 81 | 54.7 | 51.4 | 57 | 66.8 |
| 500 | 78.4 | 29.8 | 81.4 | 56 | 52.5 | 57.8 | 67.1 |
| (8) R8 Dataset | |||||||
| SVM | CNN | IG | ECE | GI | MI_avg | WOR | NDM |
| 50 | 84.7 | 51 | 77.3 | 51.3 | 52.8 | 61.8 | 73 |
| 100 | 89.4 | 51 | 80.8 | 52 | 59.8 | 65.9 | 74.6 |
| 150 | 92.1 | 50.6 | 82.9 | 52.7 | 61.7 | 66.8 | 75.5 |
| 200 | 93 | 50.7 | 84.8 | 53.4 | 62.3 | 68 | 76.4 |
| 250 | 93.3 | 50.2 | 86.3 | 53.5 | 62.3 | 68.5 | 78.7 |
| 300 | 93.5 | 50 | 87.3 | 54.4 | 62.2 | 69.4 | 80.2 |
| 350 | 93.7 | 49.8 | 89.2 | 55.1 | 62.1 | 69.7 | 81.1 |
| 400 | 93.7 | 50 | 89.9 | 55.4 | 62.5 | 69.8 | 81.4 |
| 450 | 93.8 | 49.9 | 90.4 | 55.9 | 64.5 | 69.9 | 82.2 |
| 500 | 93.8 | 49.1 | 90.4 | 56.1 | 65.9 | 70.3 | 83.9 |
| MNB | CNN | IG | ECE | GI | MI_avg | WOR | NDM |
| 50 | 81.5 | 50.7 | 74.6 | 51.1 | 53.5 | 64.5 | 66.9 |
| 100 | 89.1 | 50.4 | 79.5 | 52.2 | 61.5 | 69.5 | 69.2 |
| 150 | 92.6 | 50.1 | 81.2 | 53.1 | 64.3 | 71.2 | 72.2 |
| 200 | 93.3 | 49.9 | 83.9 | 53.9 | 65.1 | 72.4 | 74 |
| 250 | 93.8 | 49.5 | 85.7 | 54.3 | 64.8 | 73.1 | 78.5 |
| 300 | 94 | 49.3 | 86.9 | 55.1 | 64.3 | 74.2 | 80.2 |
| 350 | 94.2 | 49.2 | 88.9 | 56.1 | 63.9 | 74.6 | 81.4 |
| 400 | 94.3 | 48.9 | 89.7 | 56.4 | 64.6 | 74.6 | 81.7 |
| 450 | 94.3 | 48.9 | 90.2 | 56.8 | 66.1 | 74.7 | 83.6 |
| 500 | 94.6 | 48.9 | 90.5 | 57 | 67.7 | 75.2 | 85.7 |
| (9) R52 Dataset | |||||||
| SVM | CNN | IG | ECE | GI | MI_avg | WOR | NDM |
| 50 | 73.6 | 42.9 | 63.5 | 43.3 | 44.2 | 53 | 51 |
| 100 | 79.6 | 42.6 | 69.8 | 43.6 | 47.5 | 57.4 | 58 |
| 150 | 82.2 | 42.4 | 72.3 | 43.9 | 54.1 | 61.3 | 64.2 |
| 200 | 84 | 42.3 | 74.7 | 44.3 | 55.1 | 66.2 | 69.6 |
| 250 | 85 | 41.9 | 76.7 | 44.5 | 55.1 | 67.4 | 72.7 |
| 300 | 86.4 | 42.1 | 77.7 | 44.6 | 55 | 67.7 | 73.7 |
| 350 | 87 | 41.9 | 78.8 | 44.8 | 55.1 | 68.7 | 75.7 |
| 400 | 87 | 41.8 | 79.7 | 45.1 | 55.1 | 69.3 | 77.1 |
| 450 | 87.5 | 41.3 | 80.8 | 45.3 | 55 | 69.3 | 77.3 |
| 500 | 87.9 | 41.5 | 81.1 | 45.4 | 54.9 | 69.7 | 78.1 |
| MNB | CNN | IG | ECE | GI | MI_avg | WOR | NDM |
| 50 | 71.9 | 42.8 | 62.2 | 43.2 | 44.7 | 59.6 | 53.3 |
| 100 | 81.2 | 42.6 | 69.6 | 43.8 | 49.4 | 65.3 | 61.3 |
| 150 | 84.5 | 42.6 | 72.9 | 44 | 54.8 | 69.1 | 66.3 |
| 200 | 86.1 | 42.4 | 75.2 | 44.3 | 56.9 | 72.7 | 71.9 |
| 250 | 87.4 | 42.2 | 78.1 | 44.5 | 56.9 | 73.7 | 73.9 |
| 300 | 88.6 | 42 | 79 | 44.6 | 56.9 | 74.4 | 75.9 |
| 350 | 88.9 | 41.8 | 80.8 | 44.9 | 56.9 | 75.2 | 78.2 |
| 400 | 89.3 | 41.7 | 81.9 | 45.2 | 56.6 | 75.6 | 79.2 |
| 450 | 89.7 | 41.5 | 82.9 | 45.4 | 56.5 | 75.7 | 80 |
| 500 | 89.8 | 41.2 | 83.3 | 45.4 | 43.8 | 75.9 | 80.6 |
| (1) CF Dataset | ||||||
| CNN vs. IG | CNN vs. ECE | CNN vs. GI | CNN vs. MI_avg | CNN vs. WOR | CNN vs. NDM | |
| SVM | 2.74 × 10⁻⁸ | 3.46 × 10⁻⁵ | 2.10 × 10⁻⁹ | 4.08 × 10⁻⁶ | 1.68 × 10⁻⁶ | 2.24 × 10⁻¹² |
| MNB | 9.64 × 10⁻⁸ | 3.25 × 10⁻⁵ | 1.57 × 10⁻⁷ | 1.06 × 10⁻⁷ | 1.68 × 10⁻⁶ | 2.23 × 10⁻⁸ |
| (2) CR Dataset | ||||||
| CNN vs. IG | CNN vs. ECE | CNN vs. GI | CNN vs. MI_avg | CNN vs. WOR | CNN vs. NDM | |
| SVM | 1.00 × 10⁻⁹ | 0.00 | 1.89 × 10⁻¹³ | 1.80 × 10⁻⁹ | 1.05 × 10⁻¹⁰ | 1.57 × 10⁻⁹ |
| MNB | 3.95 × 10⁻⁹ | 0.00 | 1.06 × 10⁻¹⁰ | 1.31 × 10⁻¹⁰ | 1.32 × 10⁻¹⁰ | 6.50 × 10⁻¹⁴ |
| (3) CNAE Dataset | ||||||
| CNN vs. IG | CNN vs. ECE | CNN vs. GI | CNN vs. MI_avg | CNN vs. WOR | CNN vs. NDM | |
| SVM | 4.16 × 10⁻¹¹ | 0.11 | 3.66 × 10⁻¹⁰ | 3.14 × 10⁻¹⁰ | 8.86 × 10⁻¹¹ | 3.25 × 10⁻¹⁰ |
| MNB | 2.07 × 10⁻¹⁰ | 0.07 | 5.91 × 10⁻¹⁰ | 1.86 × 10⁻¹⁰ | 2.61 × 10⁻¹⁰ | 2.16 × 10⁻¹⁰ |
| (4) IMDB Dataset | ||||||
| CNN vs. IG | CNN vs. ECE | CNN vs. GI | CNN vs. MI_avg | CNN vs. WOR | CNN vs. NDM | |
| SVM | 9.80 × 10⁻⁷ | 0.00 | 1.70 × 10⁻⁷ | 2.78 × 10⁻⁵ | 0.19 | 1.70 × 10⁻⁷ |
| MNB | 1.39 × 10⁻⁶ | 0.00 | 2.25 × 10⁻⁹ | 2.33 × 10⁻⁶ | 0.39 | 2.25 × 10⁻⁹ |
| (5) KDC Dataset | ||||||
| CNN vs. IG | CNN vs. ECE | CNN vs. GI | CNN vs. MI_avg | CNN vs. WOR | CNN vs. NDM | |
| SVM | 4.80 × 10⁻¹⁰ | 0.00 | 1.20 × 10⁻¹⁰ | 7.67 × 10⁻¹³ | 4.64 × 10⁻¹¹ | 5.55 × 10⁻¹³ |
| MNB | 2.16 × 10⁻⁹ | 0.00 | 9.36 × 10⁻¹⁰ | 1.35 × 10⁻¹² | 8.29 × 10⁻¹⁰ | 2.69 × 10⁻¹² |
| (6) TTC Dataset | ||||||
| CNN vs. IG | CNN vs. ECE | CNN vs. GI | CNN vs. MI_avg | CNN vs. WOR | CNN vs. NDM | |
| SVM | 1.78 × 10⁻⁹ | 8.74 × 10⁻⁵ | 4.42 × 10⁻¹⁰ | 6.71 × 10⁻⁷ | 7.34 × 10⁻¹⁰ | 1.29 × 10⁻⁸ |
| MNB | 2.06 × 10⁻¹¹ | 0.00 | 1.84 × 10⁻¹² | 8.24 × 10⁻⁶ | 3.87 × 10⁻¹² | 1.09 × 10⁻⁶ |
| (7) WEKBE Dataset | ||||||
| CNN vs. IG | CNN vs. ECE | CNN vs. GI | CNN vs. MI_avg | CNN vs. WOR | CNN vs. NDM | |
| SVM | 1.97 × 10⁻⁷ | 0.00 | 1.20 × 10⁻⁸ | 1.51 × 10⁻⁸ | 1.61 × 10⁻⁹ | 1.21 × 10⁻⁸ |
| MNB | 5.56 × 10⁻¹⁰ | 0.04 | 3.67 × 10⁻¹¹ | 5.44 × 10⁻¹³ | 6.97 × 10⁻⁹ | 9.28 × 10⁻⁷ |
| (8) R8 Dataset | ||||||
| CNN vs. IG | CNN vs. ECE | CNN vs. GI | CNN vs. MI_avg | CNN vs. WOR | CNN vs. NDM | |
| SVM | 2.29 × 10⁻¹¹ | 1.12 × 10⁻⁵ | 2.42 × 10⁻¹³ | 4.52 × 10⁻¹⁴ | 4.13 × 10⁻¹⁵ | 1.34 × 10⁻⁸ |
| MNB | 3.31 × 10⁻¹⁰ | 1.07 × 10⁻⁵ | 7.65 × 10⁻¹² | 2.14 × 10⁻¹⁴ | 1.62 × 10⁻¹² | 8.16 × 10⁻⁷ |
| (9) R52 Dataset | ||||||
| CNN vs. IG | CNN vs. ECE | CNN vs. GI | CNN vs. MI_avg | CNN vs. WOR | CNN vs. NDM | |
| SVM | 6.84 × 10⁻¹⁰ | 5.57 × 10⁻⁹ | 1.25 × 10⁻¹⁰ | 7.01 × 10⁻¹³ | 3.52 × 10⁻¹¹ | 5.99 × 10⁻⁶ |
| MNB | 2.63 × 10⁻⁹ | 9.65 × 10⁻⁸ | 7.61 × 10⁻¹⁰ | 8.86 × 10⁻⁹ | 8.08 × 10⁻¹² | 1.76 × 10⁻⁶ |
References
- Joachims, T. Transductive Inference for Text Classification Using Support Vector Machines. In Proceedings of the 16th International Conference on Machine Learning, Bled, Slovenia, 27–30 June 1999; pp. 200–209. [Google Scholar]
- Tan, A.H. Text Mining: The State of the Art and the Challenges. In Proceedings of the Pakdd Workshop on Knowledge Disocovery from Advanced Databases, Beijing, China, 26–28 April 1999; pp. 65–70. [Google Scholar]
- Mujtaba, G.; Shuib, L.; Raj, R.G. Detection of Suspicious Terrorist Emails Using Text Classification: A Review. Malays. J. Comput. Sci. 2019, 31, 271–299. [Google Scholar] [CrossRef]
- Srivastava, S.K.; Singh, S.K.; Suri, J.S. Effect of Incremental Feature Enrichment on Healthcare Text Classification System: A Machine Learning Paradigm. Comput. Methods Programs Biomed. 2019, 172, 35–51. [Google Scholar] [CrossRef] [PubMed]
- Wang, P.; Yang, Y.; Si, Y.D.; Zhu, G.C.; Zhan, X.P.; Wang, J.; Pan, R.S. Classification of Proactive Personality: Text Mining Based on Weibo Text and Short-Answer Questions Text. IEEE Access 2020, 8, 97370–97382. [Google Scholar] [CrossRef]
- Ostrogonac, S.J.; Rastovic, B.S.; Popovic, B. Automatic Job Ads Classification, Based on Unstructured Text Analysis. ACTA Polytech. Hung. 2021, 18, 191–204. [Google Scholar] [CrossRef]
- Li, R.; Yu, W.K.; Liu, Y.Y. Patent Text Classification Based on Deep Learning and Vocabulary Network. Int. J. Adv. Comput. Sci. Appl. 2023, 14, 54–61. [Google Scholar] [CrossRef]
- Kim, J.; Jang, S.; Park, E.; Choi, S. Text Classification Using Capsules. Neurocomputing 2020, 376, 214–221. [Google Scholar] [CrossRef]
- Dai, Y.; Shou, L.J.; Gong, M.; Xia, X.L.; Kang, Z.; Xu, Z.L.; Jiang, D.X. Graph Fusion Network for Text Classification. Knowl.-Based Syst. 2022, 236, 107659. [Google Scholar] [CrossRef]
- Zhan, Z.Q.; Hou, Z.F.; Yang, Q.C.; Zhao, J.Y.; Zhang, Y.; Hu, C.J. Knowledge Attention Sandwich Neural Network for Text Classification. Neurocomputing 2020, 406, 1–11. [Google Scholar] [CrossRef]
- Tezgider, M.; Yildiz, B.; Aydin, G. Text Classification Using Improved Bidirectional Transformer. Concurr. Comput.-Pract. Exp. 2022, 34, e6486. [Google Scholar] [CrossRef]
- Xu, Y.H.; Yu, Z.W.; Cao, W.M.; Chen, C.L.P. Adaptive Dense Ensemble Model for Text Classification. IEEE Trans. Cybern. 2022, 52, 7513–7526. [Google Scholar] [CrossRef]
- Wang, Y.Z.; Wang, C.X.; Zhan, J.Y.; Ma, W.J.; Jiang, Y.C. Text FCG: Fusing Contextual Information via Graph Learning for text classification. Expert Syst. Appl. 2023, 219, 119658. [Google Scholar] [CrossRef]
- Gan, S.F.; Shao, S.Q.; Chen, L.; Yu, L.J.; Jiang, L.X. Adapting Hidden Naive Bayes for Text Classification. Mathematics 2021, 9, 2378. [Google Scholar] [CrossRef]
- Shi, Z.; Fan, C.J. Short Text Sentiment Classification Using Bayesian and Deep Neural Networks. Electronics 2023, 12, 1589. [Google Scholar] [CrossRef]
- Rijcken, E.; Kaymak, U.; Scheepers, F.; Mosteiro, P.; Zervanou, K.; Spruit, M. Topic Modeling for Interpretable Text Classification from EHRs. Front. Big Data 2022, 5, 846930. [Google Scholar] [CrossRef]
- Sinoara, R.A.; Camacho-Collados, J.; Rossi, R.G.; Navigli, R.; Rezende, S.O. Knowledge-enhanced Document Embeddings for Text Classification. Knowl.-Based Syst. 2019, 163, 955–971. [Google Scholar] [CrossRef]
- Wang, H.Y.; Zeng, D.H. Fusing Logical Relationship Information of Text in Neural Network for Text Classification. Math. Probl. Eng. 2020, 2020, 5426795. [Google Scholar] [CrossRef]
- Shanavas, N.; Wang, H.; Lin, Z.W.; Hawe, G. Knowledge-driven Graph Similarity for Text Classification. Int. J. Mach. Learn. Cybern. 2021, 12, 1067–1081. [Google Scholar] [CrossRef]
- Sulaimani, S.A.; Starkey, A. Short Text Classification Using Contextual Analysis. IEEE Access 2021, 9, 149619–149629. [Google Scholar] [CrossRef]
- Tan, C.G.; Ren, Y.; Wang, C. An Adaptive Convolution with Label Embedding for Text Classification. Appl. Intell. 2023, 53, 804–812. [Google Scholar] [CrossRef]
- Witten, I.H.; Frank, E.; Hall, M.A.; Pal, C.J. Data Mining: Practical Machine Learning Tools and Techniques; Green, T., Ed.; Morgan Kaufmann: Burlington, NJ, USA, 2017. [Google Scholar]
- Bahassine, S.; Madani, A.; Al-Sarem, M.; Kissi, M. Feature Selection Using an Improved Chi-square for Arabic Text Classification. J. King Saud Univ.-Comput. Inf. Sci. 2020, 32, 225–231. [Google Scholar] [CrossRef]
- Cekik, R.; Uysal, A.K. A Novel Filter Feature Selection Method Using Rough Set for Short Text Data. Expert Syst. Appl. 2020, 160, 113691. [Google Scholar] [CrossRef]
- Zhou, H.F.; Ma, Y.M.; Li, X. Feature Selection Based on Term Frequency Deviation Rate for Text Classification. Appl. Intell. 2020, 51, 3255–3274. [Google Scholar] [CrossRef]
- Amazal, H.; Kissi, M. A New Big Data Feature Selection Approach for Text Classification. Sci. Program. 2021, 2021, 6645345. [Google Scholar] [CrossRef]
- Parlak, B.; Uysal, A.K. A Novel Filter Feature Selection Method for Text Classification: Extensive Feature Selector. J. Inf. Sci. 2021, 49, 59–78. [Google Scholar] [CrossRef]
- Cekik, R.; Uysal, A.K. A New Metric for Feature Selection on Short Text Datasets. Concurr. Comput.-Pract. Exp. 2022, 34, e6909. [Google Scholar] [CrossRef]
- Parlak, B. Class-index Corpus-index Measure: A Novel Feature Selection Method for Imbalanced Text Data. Concurr. Comput.-Pract. Exp. 2022, 34, e7140. [Google Scholar] [CrossRef]
- Jin, L.B.; Zhang, L.; Zhao, L. Feature Selection Based on Absolute Deviation Factor for Text Classification. Inf. Process. Manag. 2023, 60, 103251. [Google Scholar] [CrossRef]
- Verma, G.; Sahu, T.P. Deep Label Relevance and Label Ambiguity Based Multi-label Feature Selection for Text Classification. Eng. Appl. Artif. Intell. 2025, 148, 110403. [Google Scholar] [CrossRef]
- Ige, O.P.; Gan, K.H. Ensemble Filter-Wrapper Text Feature Selection Methods for Text Classification. CMES-Comput. Model. Eng. Sci. 2025, 141, 1847–1865. [Google Scholar] [CrossRef]
- Mohanrasu, S.S.; Janani, K.; Rakkiyappan, R. A COPRAS-based Approach to Multi-Label Feature Selection for Text Classification. Math. Comput. Simul. 2024, 222, 3–23. [Google Scholar] [CrossRef]
- Cekik, R. A New Filter Feature Selection Method for Text Classification. IEEE Access 2024, 12, 139316–139335. [Google Scholar] [CrossRef]
- Farek, L.; Benaidja, A. A Non-redundant Feature Selection Method for Text Categorization Based on Term Co-occurrence Frequency and Mutual Information. Multimed. Tools Appl. 2024, 83, 20193–20214. [Google Scholar] [CrossRef]
- Liu, X.; Wang, S.; Lu, S.Y.; Yin, Z.T.; Li, X.L.; Yin, L.R.; Tian, J.W.; Zheng, W.F. Adapting Feature Selection Algorithms for the Classification of Chinese Texts. Systems 2023, 11, 483. [Google Scholar] [CrossRef]
- Ashokkumar, P.; Shankar, G.S.; Srivastava, G.; Maddikunta, P.K.R.; Gadekallu, T.R. A Two-stage Text Feature Selection Algorithm for Improving Text Classification. ACM Trans. Asian Low-Resour. Lang. Inf. Process. 2021, 20, 49. [Google Scholar]
- Garg, M. UBIS: Unigram Bigram Importance Score for Feature Selection from Short Text. Expert Syst. Appl. 2022, 195, 116563. [Google Scholar] [CrossRef]
- Okkalioglu, M. A Novel Redistribution-based Feature Selection for Text Classification. Expert Syst. Appl. 2024, 246, 123119. [Google Scholar] [CrossRef]
- Lazhar, F.; Amira, B. Semantic Similarity-aware Feature selection and Redundancy Removal for Text Classification using joint mutual information. Knowl. Inf. Syst. 2024, 66, 6187–6212. [Google Scholar] [CrossRef]
- Rehman, S.U.; Jat, R.; Rafi, M.; Frnda, J. TransFINN “Transparent Feature Integrated Neural Network for Text Feature Selection and Classification”. IEEE Access 2025, 13, 118821–118829. [Google Scholar] [CrossRef]
- Chantar, H.; Mafarja, M.; Alsawalqah, H.; Heidari, A.A.; Aljarah, I.; Faris, H. Feature Selection Using Binary Grey Wolf Optimizer with Elite-based Crossover for Arabic Text Classification. Neural Comput. Appl. 2020, 32, 12201–12220. [Google Scholar] [CrossRef]
- Alsaleh, D.; Larabi-Marie-Sainte, S. Arabic Text Classification Using Convolutional Neural Network and Genetic Algorithms. IEEE Access 2021, 9, 91670–91685. [Google Scholar] [CrossRef]
- Thirumoorthy, K.; Muneeswaran, K. Feature Selection Using Hybrid Poor and Rich Optimization Algorithm for Text Classification. Pattern Recognit. Lett. 2021, 147, 63–70. [Google Scholar] [CrossRef]
- Hosseinalipour, A.; Gharehchopogh, F.S.; Masdari, M.; Khademi, A. A Novel Binary Farmland Fertility Algorithm for Feature Selection in Analysis of the Text Psychology. Appl. Intell. 2021, 51, 4824–4859. [Google Scholar] [CrossRef]
- Adel, A.; Omar, N.; Abdullah, S.; Al-Shabi, A. Co-Operative Binary Bat Optimizer with Rough Set Reducts for Text Feature Selection. Appl. Sci. 2022, 12, 1296. [Google Scholar] [CrossRef]
- Priya, S.K.; Karthika, K.P. An Embedded Feature Selection Approach for Depression Classification Using Short Text Sequences. Appl. Soft Comput. 2023, 147, 110828. [Google Scholar] [CrossRef]
- Singh, G.; Nagpal, A.; Singh, V. Optimal Feature Selection and Invasive Weed Tunicate Swarm Algorithm-based Hierarchical Attention Network for Text Classification. Connect. Sci. 2023, 35, 2231171. [Google Scholar] [CrossRef]
- Wu, X.; Fei, M.R.; Wu, D.K. Enhanced Binary Black Hole algorithm for text feature selection on resources classification. Knowl.-Based Syst. 2023, 274, 110635. [Google Scholar] [CrossRef]
- Kaya, C.; Kilimci, Z.H.; Uysal, M.; Kaya, M. Migrating Birds Optimization-based Feature Selection for Text Classification Fi cation. PeerJ Comput. Sci. 2024, 10, e2263. [Google Scholar] [CrossRef]
- Msallam, M.M.; Bin Idris, S.A. Unsupervised Text Feature Selection by Binary Fire Hawk Optimizer for Text Clustering. Clust. Comput.—J. Netw. Softw. Tools Appl. 2024, 27, 7721–7740. [Google Scholar] [CrossRef]
- Nachaoui, M.; Lakouam, I.; Hafidi, I. Hybrid Particle Swarm Optimization Algorithm for Text Feature Selection Problems. Neural Comput. Appl. 2024, 36, 7471–7489. [Google Scholar] [CrossRef]
- Dhal, P.; Azad, C. A Fine-tuning Deep Learning with Multi-objective-based Feature Selection Approach for the Classification of Text. Neural Comput. Appl. 2024, 36, 3525–3553. [Google Scholar] [CrossRef]
- Farek, L.; Benaidja, A. An Adaptive Binary Particle Swarm Optimization Algorithm with Filtration and Local Search for Feature Selection in Text Classification. Memetic Comput. 2025, 17, 45. [Google Scholar] [CrossRef]
- El-Hajj, W.; Hajj, H. An Optimal Approach for Text Feature Selection. Comput. Speech Lang. 2022, 74, 101364. [Google Scholar] [CrossRef]
- Saeed, M.M.; Al Aghbari, Z. ARTC: Feature Selection Using Association Rules for Text Classification. Neural Comput. Appl. 2022, 34, 22519–22529. [Google Scholar] [CrossRef]
- Farghaly, H.M.; Abd El-Hafeez, T. A High-quality Feature Selection Method Based on Frequent and Correlated Items for Text Classification. Soft Comput. 2023, 27, 11259–11274. [Google Scholar] [CrossRef]
- Sagbas, E.A. A Novel Two-stage Wrapper Feature Selection Approach Based on Greedy Search for Text Sentiment Classification. Neurocomputing 2024, 590, 127729. [Google Scholar] [CrossRef]
- Liu, Y.; Cheng, X.; Stephen, L.S.; Wei, S.S. Advancing Text Classification: A Novel Two-stage Multi-objective Feature Selection Framework. Inf. Technol. Manag. 2025. [Google Scholar] [CrossRef]
- Jalilian, E.; Hofbauer, H.; Uhl, A. Iris Image Compression Using Deep Convolutional Neural Networks. Sensors 2022, 22, 2698. [Google Scholar] [CrossRef]
- Xiao, Q.G.; Li, G.Y.; Chen, Q.C. Complex image classification by feature inference. Neurocomputing 2023, 544, 126231. [Google Scholar] [CrossRef]
- Tyagi, S.; Yadav, D. ForensicNet: Modern convolutional neural network-based image forgery detection network. J. Forensic Sci. 2023, 68, 461–469. [Google Scholar] [CrossRef]
- Wang, J.R.; Li, J.; Zhang, Y.R. Text3D: 3D Convolutional Neural Networks for Text Classification. Electronics 2023, 12, 3087. [Google Scholar] [CrossRef]
- Xu, S.J.; Guo, C.Y.; Zhu, Y.H.; Liu, G.G.; Xiong, N.L. CNN-VAE: An Intelligent Text Representation Algorithm. J. Supercomput. 2023, 79, 12266–12291. [Google Scholar] [CrossRef]
- Gasmi, K.; Ayadi, H.; Torjmen, M. Enhancing Medical Image Retrieval with UMLS-Integrated CNN-Based Text Indexing. Diagnostics 2024, 14, 1204. [Google Scholar] [CrossRef] [PubMed]
- Liu, X.Z.; Wang, Y.Y.; Niu, N.N.; Zhang, B.Y.; Li, J.S. A Hybrid Architecture for Enhancing Chinese Text Processing Using CNN and LLaMA2. Sci. Rep. 2025, 15, 24735. [Google Scholar] [CrossRef] [PubMed]
- Wahyu Trisna, K.; Huang, J.J.; Chen, Y.J.; Putra, I.G.J.E. Dynamic Text Augmentation for Robust Sentiment Analysis: Enhancing Model Performance with EDA and Multi-Channel CNN. IEEE Access 2025, 13, 31978–31991. [Google Scholar] [CrossRef]
- Wu, X.; Cai, Y.; Li, Q.; Xu, J.Y.; Leung, H.F. Combining Weighted Category-aware Contextual Information in Convolutional Neural Networks for Text Classification. World Wide Web-Internet Web Inf. Syst. 2020, 23, 2815–2834. [Google Scholar] [CrossRef]
- Xu, J.Y.; Cai, Y.; Wu, X.; Lei, X.; Huang, Q.B.; Leung, H.F.; Li, Q. Incorporating Context-relevant Concepts into Convolutional Neural Networks for Short Text Classification. Neurocomputing 2020, 386, 42–53. [Google Scholar] [CrossRef]
- Butt, M.A.; Khatak, A.M.; Shafique, S.; Hayat, B.; Abid, S.; Kim, K.I.; Ayub, M.W.; Sajid, A.; Adnan, A. Convolutional Neural Network Based Vehicle Classification in Adverse Illuminous Conditions for Intelligent Transportation Systems. Complexity 2021, 2021, 6644861. [Google Scholar] [CrossRef]
- Liang, Y.J.; Li, H.H.; Guo, B.; Yu, Z.W.; Zheng, X.L.; Samtani, S.; Zeng, D.D. Fusion of Heterogeneous Attention Mechanisms in Multi-view Convolutional Neural Network for Text Classification. Inf. Sci. 2021, 548, 295–312. [Google Scholar] [CrossRef]
- Liu, X.Y.; Tang, T.; Ding, N. Social Network Sentiment Classification Method Combined Chinese Text Syntax with Graph Convolutional Neural Network. Egypt. Inform. J. 2022, 23, 1–12. [Google Scholar] [CrossRef]
- Zhao, W.D.; Zhu, L.; Wang, M.; Zhang, X.L.; Zhang, J.M. WTL-CNN: A News Text Classification Method of Convolutional Neural Network Based on Weighted Word Embedding. Connect. Sci. 2022, 34, 2291–2312. [Google Scholar] [CrossRef]
- Qorich, M.; El Ouazzani, R. Text Sentiment Classification of Amazon Reviews Using Word Embeddings and Convolutional Neural Networks. J. Supercomput. 2023, 79, 11029–11054. [Google Scholar] [CrossRef]
- Thekkekara, J.P.; Yongchareon, S.; Liesaputra, V. An Attention-based CNN-BiLSTM Model for Depression Detection on Social Media Text. Expert Syst. Appl. 2024, 249, 123834. [Google Scholar] [CrossRef]
- Guo, X.L.; Liu, Q.Y.; Hu, Y.R.; Liu, H.J. MDCNN: Multi-Teacher Distillation-Based CNN for News Text Classification. IEEE Access 2025, 13, 56631–56641. [Google Scholar] [CrossRef]
- Liu, B.; Zhou, Y.; Sun, W. Character-level Text Classification via Convolutional Neural Network and Gated Recurrent Unit. Int. J. Mach. Learn. Cybern. 2020, 11, 1939–1949. [Google Scholar] [CrossRef]
- Zeng, S.F.; Ma, Y.; Zhang, X.Y.; Du, X.F. Term-Based Pooling in Convolutional Neural Networks for Text Classification. China Commun. 2020, 17, 109–124. [Google Scholar] [CrossRef]
- Lyu, S.F.; Liu, J.Q. Convolutional Recurrent Neural Networks for Text Classification. J. Databased Manag. 2021, 32, 65–82. [Google Scholar] [CrossRef]
- Wang, H.T.; Tian, K.K.; Wu, Z.J.; Wang, L. A Short Text Classification Method Based on Convolutional Neural Network and Semantic Extension. Int. J. Comput. Intell. Syst. 2021, 14, 367–375. [Google Scholar] [CrossRef]
- Liu, J.F.; Ma, H.Z.; Xie, X.L.; Cheng, J. Short Text Classification for Faults Information of Secondary Equipment Based on Convolutional Neural Networks. Energies 2022, 15, 2400. [Google Scholar] [CrossRef]
- Zhou, Y.J.; Li, J.L.; Chi, J.H.; Tang, W.; Zheng, Y.Q. Set-CNN: A Text Convolutional Neural Network Based on Semantic Extension for Short Text Classification. Knowl.-Based Syst. 2022, 257, 109948. [Google Scholar] [CrossRef]
- Xiong, Y.P.; Chen, G.L.; Cao, J.K. Research on Public Service Request Text Classification Based on BERT-BiLSTM-CNN Feature Fusion. Appl. Sci. 2024, 14, 6282. [Google Scholar] [CrossRef]
- Li, J.H.; Yang, Y.; Sun, J.; Wang, F.; Chen, S.L. DT-GCNN: Dynamic Triplet Network with GRU-CNN for Enhanced Text Classification. Int. J. Mach. Learn. Cybern. 2025, 16, 9555–9567. [Google Scholar] [CrossRef]
- Huang, M.H.; Xie, H.R.; Rao, Y.H.; Feng, J.R.; Wang, F.L. Sentiment Strength Detection with a Context-dependent Lexicon-based Convolutional Neural Network. Inf. Sci. 2020, 520, 389–399. [Google Scholar] [CrossRef]
- Krishnan, H.; Elayidom, M.S.; Santhanakrishnan, T. Optimization Assisted Convolutional Neural Network for Sentiment Analysis with Weighted Holoentropy-based Features. Int. J. Inf. Technol. Decis. Mak. 2021, 20, 1261–1297. [Google Scholar] [CrossRef]
- Usama, M.; Ahmad, B.; Song, E.; Hossain, M.S.; Alrashoud, M.; Muhammad, G. Attention-based Sentiment Analysis Using Convolutional and Recurrent Neural Network. Future Gener. Comput. Syst. 2020, 113, 571–578. [Google Scholar] [CrossRef]
- Wang, X.Y.; Li, F.; Zhang, Z.Q.; Xu, G.L.; Zhang, J.Y.; Sun, X. A Unified Position-aware Convolutional Neural Network for Aspect Based Sentiment Analysis. Neurocomputing 2021, 450, 91–103. [Google Scholar] [CrossRef]
- Ghorbanali, A.; Sohrabi, M.K.; Yaghmaee, F. Ensemble Transfer Learning-based Multimodal Sentiment Analysis Using Weighted Convolutional Neural Networks. Inf. Process. Manag. 2022, 59, 102929. [Google Scholar] [CrossRef]
- Huang, M.H.; Xie, H.R.; Rao, Y.H.; Liu, Y.W.; Poon, L.K.M.; Wang, F.L. Lexicon-Based Sentiment Convolutional Neural Networks for Online Review Analysis. IEEE Trans. Affect. Comput. 2022, 13, 1337–1348. [Google Scholar] [CrossRef]
- Murugaiyan, S.; Uyyala, S.R. Aspect-Based Sentiment Analysis of Customer Speech Data Using Deep Convolutional Neural Network and BiLSTM. Cogn. Comput. 2023, 15, 914–931. [Google Scholar] [CrossRef]
- Mutinda, J.; Mwangi, W.; Okeyo, G. Sentiment Analysis of Text Reviews Using Lexicon-Enhanced Bert Embedding (LeBERT) Model with Convolutional Neural Network. Appl. Sci. 2023, 13, 1445. [Google Scholar] [CrossRef]
- Alnowaiser, K. Scientific Text Citation Analysis Using CNN Features and Ensemble Learning Model. PLoS ONE 2024, 19, e0302304. [Google Scholar] [CrossRef]
- He, A.X.; Abisado, M. Text Sentiment Analysis of Douban Film Short Comments Based on BERT-CNN-BiLSTM-Att Model. IEEE Access 2024, 12, 45229–45237. [Google Scholar] [CrossRef]
- Chen, J.Y.; Yan, S.K.; Wong, K.C. Verbal Aggression Detection on Twitter Comments: Convolutional Neural Network for Short-text Sentiment Analysis. Neural Comput. Appl. 2020, 32, 10809–10818. [Google Scholar] [CrossRef]
- Qiu, M.; Zhang, Y.R.; Ma, T.Q.; Wu, Q.F.; Jin, F.Z. Convolutional-neural-network-based Multilabel Text Classification for Automatic Discrimination of Legal Documents. Sens. Mater. 2020, 32, 2659–2672. [Google Scholar] [CrossRef]
- Heo, T.S.; Kim, C.; Kim, J.D.; Park, C.Y.; Kim, Y.S. Prediction of Atrial Fibrillation Cases: Convolutional Neural Networks Using the Output Texts of Electrocardiography. Sens. Mater. 2021, 33, 393–404. [Google Scholar] [CrossRef]
- Li, Y.; Yin, C.B. Application of Dual-Channel Convolutional Neural Network Algorithm in Semantic Feature Analysis of English Text Big Data. Comput. Intell. Neurosci. 2021, 2021, 7085412. [Google Scholar] [CrossRef]
- Jian, L.H.; Xiang, H.Q.; Le, G.B. English Text Readability Measurement Based on Convolutional Neural Network: A Hybrid Network Model. Comput. Intell. Neurosci. 2022, 2022, 6984586. [Google Scholar] [CrossRef]
- Qiu, Q.J.; Xie, Z.; Ma, K.; Chen, Z.L.; Tao, L.F. Spatially Oriented Convolutional Neural Network for Spatial Relation Extraction from Natural Language Texts. Trans. GIS 2022, 26, 839–866. [Google Scholar] [CrossRef]
- Boukhers, Z.; Goswami, P.; Jurjens, J. Knowledge Guided Multi-filter Residual Convolutional Neural Network for ICD Coding from Clinical Text. Neural Comput. Appl. 2023, 35, 17633–17644. [Google Scholar] [CrossRef]
- Muppudathi, S.S.; Krishnasamy, V. Anomaly Detection in Social Media Texts Using Optimal Convolutional Neural Network. Intell. Autom. Soft Comput. 2023, 36, 1027–1042. [Google Scholar] [CrossRef]
- Fan, W.T. BiLSTM-Attention-CNN Model Based on ISSA Optimization for Cyberbullying Detection in Chinese Text. Inf. Technol. Control. 2024, 53, 659–674. [Google Scholar] [CrossRef]
- Zeng, Q.X. Enhanced Analysis of Large-scale News Text Data Using the Bidirectional-Kmeans-LSTM-CNN Model. Peerj Comput. Sci. 2024, 10, e2213. [Google Scholar] [CrossRef] [PubMed]
- Faseeh, M.; Khan, M.A.; Iqbal, N.; Qayyum, F.; Mehmood, A.; Kim, J. Enhancing User Experience on Q&A Platforms: Measuring Text Similarity Based on Hybrid CNN-LSTM Model for Efficient Duplicate Question Detection. IEEE Access 2024, 12, 34512–34526. [Google Scholar]
- Wu, H.C.; Li, H.X.; Fang, X.C.; Tang, M.Q.; Yu, H.Z.; Yu, B.; Li, M.; Jing, Z.R.; Meng, Y.H.; Chen, W.; et al. MDCNN: A Multimodal Dual-CNN Recursive Model for Fake News Detection via Audio- and Text-based Speech Emotion Recognition. Speech Commun. 2025, 175, 103313. [Google Scholar] [CrossRef]
- Hong, M.; Wang, H.Y. Filter feature selection methods for text classification: A review. Multimed. Tools Appl. 2024, 83, 2053–2091. [Google Scholar]
- Ganesan, K.; Zhai, C.X. Opinion-based Entity Ranking. Inf. Retr. 2012, 15, 116–150. [Google Scholar] [CrossRef]
- Ciarelli, P.M.; Oliveira, E. Agglomeration and Elimination of Terms for Dimensionality Reduction. In Proceedings of the 2009 Ninth International Conference on Intelligent Systems Design and Applications, Pisa, Italy, 30 November–2 December 2009; pp. 547–552. [Google Scholar]
- Ciarelli, P.M.; Salles, E.O.T.; Oliveira, E. An Evolving System Based on Probabilistic Neural Network. In Proceedings of the 2010 Eleventh Brazilian Symposium on Neural Networks, Sao Paulo, Brazil, 23–28 October 2010; Volume 1, pp. 182–187. [Google Scholar]
- Kotzias, D.; Denil, M.; De Freitas, N.; Smyth, P. From Group to Individual Labels Using Deep Features. In Proceedings of the 21th ACM SIGKDD International Conference on Knowledge Discovery and Data Mining, Sydney, NSW, Australia, 10–13 August 2015; pp. 597–606. [Google Scholar]
- Mustafa, A.M.; Rashid, T.A. Kurdish Stemmer Pre-processing Steps for Improving Information Retrieval. J. Inf. Sci. 2018, 44, 15–27. [Google Scholar] [CrossRef]
- Rashid, T.A.; Mustafa, A.M.; Saeed, A.M. A Robust Categorization System for Kurdish Sorani Text Documents. Inf. Technol. J. 2017, 16, 27–34. [Google Scholar] [CrossRef]
- Rashid, T.A.; Mustafa, A.M.; Saeed, A.M. Automatic Kurdish Text Classification Using KDC 4007 Dataset. In Proceedings of the 5th International Conference on Emerging Internetworking, Data & Web Technologies, Wuhan, China, 10–11 June 2017; Volume 6, pp. 187–198. [Google Scholar]
- Kilinç, D.; Özçift, A.; Bozyiğit, F.; Yildirim, P.; Yucalar, F.; Borandağ, E. Ttc-3600: A New Benchmark Dataset for Turkish Text Categorization. J. Inf. Sci. 2015, 43, 174–185. [Google Scholar] [CrossRef]
- Wang, G.; Lochovsky, F.H. Feature Selection with Conditional Mutual Information MaxiMin in Text Categorization. In Proceedings of the 2004 ACM CIKM International Conference on Information and Knowledge Management, Washington, DC, USA, 8–13 November 2004; pp. 342–349. [Google Scholar]
- Gao, Z.; Xu, Y.; Meng, F.; Qi, F.; Lin, Z.Q. Improved Information Gain-Based Feature Selection for Text Categorization. In Proceedings of the International Conference on Wireless Communications, Vehicular Technology, Information Theory and Aerospace & Electronic Systems (VITAE), Aalborg, Denmark, 11–14 May 2014; pp. 1–5. [Google Scholar]
- Zheng, Z.; Wu, X.; Srihari, R. Feature Selection for Text Categorization on Imbalanced Data. ACM SIGKDD Explor. Newsl. 2004, 6, 80–89. [Google Scholar] [CrossRef]
- Shang, W.; Huang, H.; Zhu, H.; Lin, Y.; Qu, Y.; Wang, Z. A Novel Feature Selection Algorithm for Text Categorization. Expert Syst. Appl. 2007, 33, 1–5. [Google Scholar] [CrossRef]
- Uğuz, H. A Two-stage Feature Selection Method for Text Categorization by Using Information Gain, Principal Component Analysis and Genetic Algorithm. Knowl.-Based Syst. 2011, 24, 1024–1032. [Google Scholar] [CrossRef]
- Azam, N.; Yao, J.T. Comparison of Term Frequency and Document Frequency Based Feature Selection Metrics in Text Categorization. Expert Syst. Appl. 2012, 39, 4760–4768. [Google Scholar] [CrossRef]
- Rehman, A.; Javed, K.; Babri, H.A. Feature Selection Based on a Normalized Difference Measure for Text Classification. Inf. Process. Manag. 2017, 53, 473–489. [Google Scholar] [CrossRef]
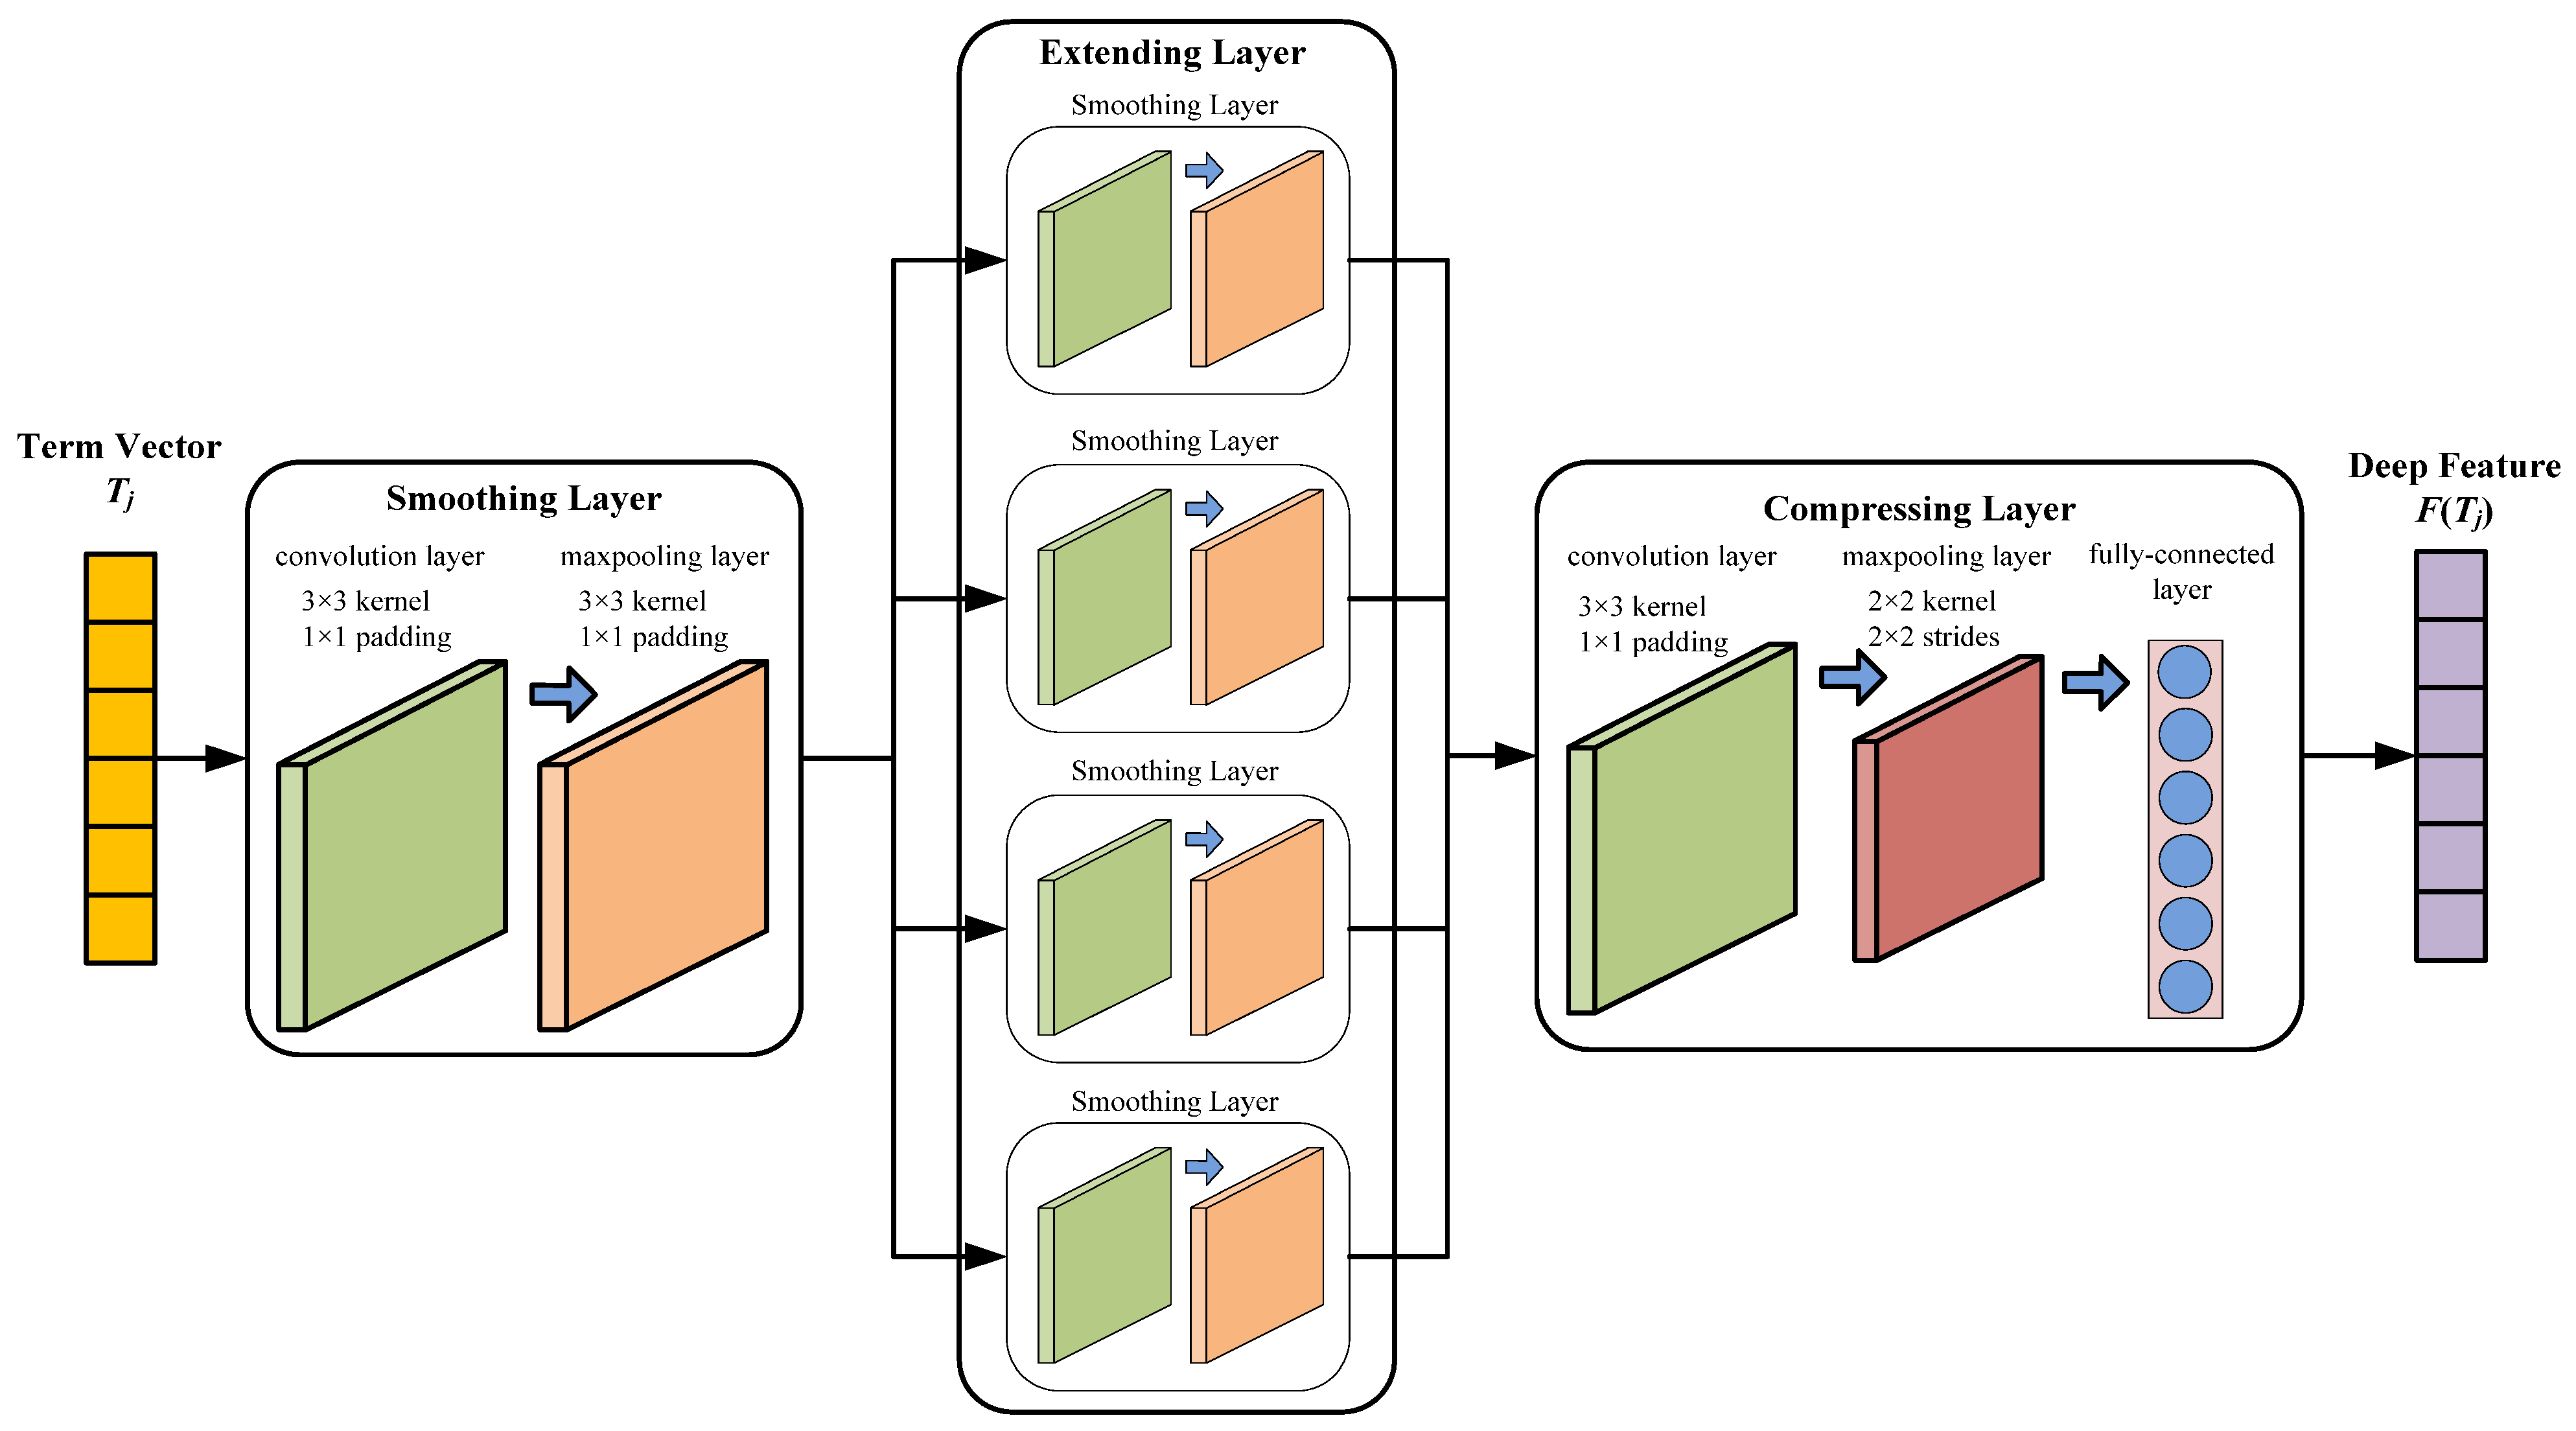
| Smoothing Layer | Extending Layer | Compression Layer | |||
|---|---|---|---|---|---|
| Layer | Params | Layer | Params | Layer | Params |
| A convolution layer | 3 × 3 kernel 1 × 1 padding | Four smoothing layers | A convolution layer | 3 × 3 kernel 1 × 1 padding | |
| A maxpooling layer | 3 × 3 kernel 1 × 1 padding | A maxpooling layer | 2 × 2 kernel 2 × 2 strides | ||
| A fully connected layer | weight matrix | ||||
| Name of Dataset | Quantity of Documents | Quantity of Terms | Number of Classes | Description |
|---|---|---|---|---|
| CF | 1007 | 1824 | 12 | User favorite description text of 12 different Toyota cars |
| CR | 1047 | 3956 | 12 | User review text of 12 different Toyota cars |
| CNAE | 1080 | 856 | 9 | Business description text of Brazilian companies from nine groups |
| IMDB | 1000 | 2422 | 2 | Positive and negative movie review text |
| KDC | 4007 | 13,201 | 8 | Turkish text of articles and news |
| TTC | 3600 | 3208 | 6 | |
| WEBKB | 4199 | 7684 | 4 | Collection of web pages of computer science departments of four universities |
| R8 | 7674 | 17,231 | 8 | Subset generated from the Reuters-21578 dataset |
| R52 | 9100 | 19,080 | 52 |
| Method | Description |
|---|---|
| Information Gain (IG) | |
| Expected Cross Entropy (ECE) | |
| Mutual Information (MI) | |
| Gini Index (GI) | |
| Weighted Odd Ratio (WOR) | |
| Normalized Difference Measure (NDM) |
Disclaimer/Publisher’s Note: The statements, opinions and data contained in all publications are solely those of the individual author(s) and contributor(s) and not of MDPI and/or the editor(s). MDPI and/or the editor(s) disclaim responsibility for any injury to people or property resulting from any ideas, methods, instructions or products referred to in the content. |
© 2025 by the authors. Licensee MDPI, Basel, Switzerland. This article is an open access article distributed under the terms and conditions of the Creative Commons Attribution (CC BY) license (https://creativecommons.org/licenses/by/4.0/).
Share and Cite
Xiao, J.; Hong, M. A Feature Selection Method Based on a Convolutional Neural Network for Text Classification. Electronics 2025, 14, 4615. https://doi.org/10.3390/electronics14234615
Xiao J, Hong M. A Feature Selection Method Based on a Convolutional Neural Network for Text Classification. Electronics. 2025; 14(23):4615. https://doi.org/10.3390/electronics14234615
Chicago/Turabian StyleXiao, Jiongen, and Ming Hong. 2025. "A Feature Selection Method Based on a Convolutional Neural Network for Text Classification" Electronics 14, no. 23: 4615. https://doi.org/10.3390/electronics14234615
APA StyleXiao, J., & Hong, M. (2025). A Feature Selection Method Based on a Convolutional Neural Network for Text Classification. Electronics, 14(23), 4615. https://doi.org/10.3390/electronics14234615


