Abstract
The continuously evolving cyber threat landscape necessitates not only resilient defense mechanisms but also the sustained capacity development of security personnel. However, conventional training pipelines are predominantly dependent on static real-world datasets, which fail to adequately reflect the diversity and dynamics of emerging attack tactics. To address these limitations, this study employs a Wasserstein GAN with Gradient Penalty (WGAN-GP) to synthesize realistic network traffic that preserves both temporal and statistical characteristics. Using the CIC-IDS-2017 dataset, which encompasses diverse attack scenarios including brute-force, Heartbleed, botnet, DoS/DDoS, web, and infiltration attacks, two training methodologies are proposed. The first trains a single conditional WGAN-GP on the entire dataset to capture the global distribution. The second employs multiple generators tailored to individual attack types, while sharing a discriminator pretrained on the complete traffic set, thereby ensuring consistent decision boundaries across classes. The quality of the generated traffic was evaluated using a Train on Synthetic, Test on Real (TSTR) protocol with LSTM and Random Forest classifiers, along with distribution similarity measures in the embedding space. The proposed approach achieved a classification accuracy of 97.88% and a Fréchet Inception Distance (FID) score of 3.05, surpassing baseline methods by more than one percentage point. These results demonstrate that the proposed synthetic traffic generation strategy provides advantages in scalability, diversity, and privacy, thereby enriching cyber range training scenarios and supporting the development of adaptive intrusion detection systems that generalize more effectively to evolving threats.
1. Introduction
The contemporary digital environment is characterized by increasingly sophisticated and large-scale cyber threats, which necessitate both resilient defense mechanisms and the continuous capacity development of security personnel [1]. Nevertheless, traditional training and education approaches remain heavily dependent on static real-world datasets, which fail to capture the diversity and dynamics of modern attack tactics. Such limitations can create gaps in the generalization performance and preparedness of intrusion detection models. In this context, synthetic data-based approaches have emerged as a promising alternative, as they mitigate issues of data sensitivity, collection costs, and class sparsity while simultaneously enriching training scenarios.
Among generative adversarial networks (GANs), the Wasserstein GAN with Gradient Penalty (WGAN-GP) has been recognized as an effective method for synthesizing realistic data that preserves complex temporal and statistical patterns. Building on this foundation, the present study proposes a dual training strategy for high-fidelity network traffic generation based on the CIC-IDS-2017 dataset, which encompasses diverse attack scenarios such as brute-force, Heartbleed, botnet, DoS/DDoS, web, and infiltration attacks [2]. The first approach trains a single conditional WGAN-GP on the entire dataset to capture the global distribution. The second approach employs separate generators for each attack type while sharing a single discriminator pretrained on the complete traffic set, thereby maintaining consistent decision boundaries across classes.
The quality of the generated traffic was evaluated using a Train on Synthetic, Test on Real (TSTR) protocol, wherein classifiers were trained on synthetic data and validated on real data, in addition to embedding-based Fréchet Inception Distance (FID) measures. The proposed method achieved an FID score of 3.05, ensuring statistical fidelity, and attained a classification accuracy of 97.88% in intrusion detection tasks using LSTM and Random Forest classifiers, outperforming baseline approaches by more than 1 percentage point. These findings suggest that scalable, diverse, and privacy-preserving synthetic traffic can enhance the realism of cyber range training environments and provide a foundation for developing adaptive intrusion detection systems that generalize more effectively to evolving threats.
2. Related Works
In the field of network intrusion detection, the scarcity of minority attack classes and overall category imbalance have consistently been reported as key factors degrading detectors’ recall and macro-level performance [3,4]. To overcome these limitations, generative model-based data augmentation techniques have emerged as a promising alternative. In particular, GAN-based approaches have been proven to provide consistent performance improvements on IDS datasets when adapted to mixed tabular distributions [5].
Recent studies have proposed various methodologies utilizing GANs for cyber threat detection [6], with research on data augmentation for industrial internet intrusion detection systems using VAE-WGAN-GP demonstrating practical applicability [7]. Furthermore, efforts to improve machine learning techniques using the CSE-CIC IDS dataset are also actively underway [8].
From a generative modeling perspective, WGAN-GP is recognized as a leading method for enhancing learning stability and mitigating mode collapse through its earth-mover distance objective function and gradient penalty term [9]. This framework is considered particularly well-suited for complex distributions containing both continuous and categorical variables, such as network flow data [9,10]. Furthermore, strategies integrating class conditions or explicitly partitioning models by attack type have been shown to better capture local modes of rare classes, improving recall for minority categories [11,12]. However, a trade-off exists: global models handling broad distributions may dilute fine patterns in rare classes, while class-specific models achieve high local fidelity but risk over-specialization and global statistical distortion. This underscores the need for systematic comparisons between the two approaches.
Parallel efforts to enhance the role of the discriminator have also progressed. Approaches such as integrating auxiliary classifier signals (e.g., AC-GAN variants) or using multiple parallel discriminators to provide diverse decision perspectives have been explored as means to strengthen label consistency and quality control of generated samples [11,13]. In the IDS context, hybrid architectures combining a globally trained discriminator with class-specific specialized discriminators have been observed to preserve rare class recovery without excessively distorting the overall decision boundary. This aligns well with experimental designs that jointly compare global and class-separate learning.
In particular, Lin et al. [6]. proposed a CGAN + VGG16 model (LB-CAD) focusing on feature representation learning for RT-IoT environments. While it achieved high classification performance, its contribution was limited to supervised feature extraction and was not primarily designed for rare-class augmentation.
Recent advances in synthetic tabular data generation have produced powerful frameworks such as CTGAN, TabDDPM, and CTAB-GAN/CTAB-GAN+. CTGAN leverages conditional sampling with mode-specific normalization to handle mixed-type features, consistently outperforming conventional GANs. TabDDPM introduces denoising diffusion modeling for tabular data, yielding superior sample fidelity, diversity, and privacy support. CTAB-GAN integrates domain-adaptive encoders and privacy-preserving objectives, while CTAB-GAN+ further improves downstream machine learning utility and differential privacy guarantees.
Collectively, these state-of-the-art approaches have demonstrated marked enhancements in sample fidelity, privacy, and classification utility. Their benchmark performance—measured by FID, recall, and per-class anomaly detection—reflects a growing trend toward the adoption of advanced generative models for IDS augmentation and comprehensive class balance recovery in cybersecurity contexts.
Wang and Zhang [7] developed a VAE-WGAN-GP framework for industrial IoT datasets, emphasizing stable augmentation; however, their method reported lower recall and F1-scores compared to our model, particularly under severe imbalance.
ZACARON et al. [8]. improved conventional machine learning techniques (e.g., XGBoost, Decision Trees) on the CSE-CIC-IDS dataset, but their approach did not leverage generative modeling and thus could not fundamentally resolve minority-class scarcity.
In contrast, our proposed hybrid Global-Split WGAN-GP framework directly tackles this imbalance by combining global distribution learning with class-specific generation, thereby ensuring both high overall classification metrics and enhanced recall for rare attack classes. Moreover, unlike prior studies that primarily emphasized performance gains within constrained experimental settings, our work explicitly focuses on practical applicability for IDS training and education systems. By generating high-quality synthetic traffic tailored for training pipelines, the proposed approach overcomes the limitations of previous methods when applied to real operational environments.
3. Proposed Framework: Hybrid Global-Split WGAN-GP Framework
This section presents the methodology of the proposed approach for generating high-quality data through a shared discriminator. Specifically, it describes the dataset preprocessing, model architecture, training procedure, optimization strategy, and evaluation metrics.
3.1. Dataset and Pre-Processing
A fundamental prerequisite for cyber-attack and defense training is the underlying network itself. Moreover, by isolating cyber threats in advance through network traffic patterns, it is possible to gain a strategic advantage in cyberspace. Accordingly, this study employs the CSE-CIC-IDS-2017 dataset, which contains approximately 2.8 million traffic records encompassing both normal and malicious attack types [7]. Table 1 summarizes the categories of normal traffic and attack types within the dataset, presenting the proportion of each attack type.

Table 1.
Attack types and class ratios in the CIC-IDS-2017 dataset after data cleaning.
The preprocessing pipeline consists of five stages: (i) label Encoding, (ii) automated feature selection, (iii) unified feature scaling, (iv) feature order consistency, and (v) invalid value handling. The entire procedure is implemented as a single pipeline to ensure that identical preprocessing rules are consistently applied across the training, validation, and evaluation phases. Figure 1 summarizes the preprocessing steps.
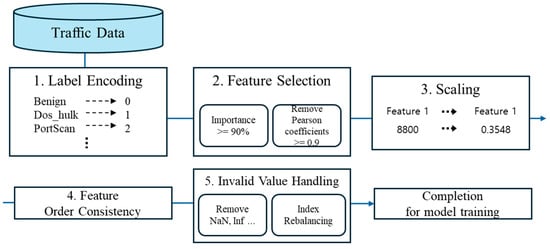
Figure 1.
5-Step Preprocessing.
- Label Encoding
The raw labels were first fitted using a single LabelEncoder, after which all subsequent transformations were performed with the same mapping to construct integer-based labels. This procedure ensures consistency in class identification for both model training and conditional data generation.
- Automated Feature Selection
The CIC-IDS-2017 dataset contains 78 feature columns. Consequently, eliminating irrelevant attributes and reducing dimensionality are essential steps. In this study, feature selection is conducted in two stages, based on an AutoML [14] framework.
- Importance-Based Selection: Feature importance was estimated using a LightGBM model. Features were retained until the cumulative importance reached 90%, while those with negligible contributions were discarded. This procedure proactively eliminates low-contributing attributes, thereby reducing dimensionality.
- Correlation-Based Redundancy Removal: For the remaining features after the first stage, the upper triangular matrix of the Pearson correlation coefficients was examined. Feature pairs with an absolute correlation greater than 0.9 were identified, and the feature with the higher degree of redundancy was removed. This step aims to mitigate multicollinearity and enhance training stability.
- Unified Feature Scaling
For the feature matrix, a Min–Max scaler was applied. Since negative values are absent in network traffic data, the feature range was fixed between 0 and 1. The scaler was fitted globally only once, and subsequent transformations were performed using the same parameters. This design prevents data leakage caused by refitting across different splits and ensures numerical consistency throughout the generation–classification pipeline.
- Feature Order Consistency and Structural Alignment
After preprocessing, the finalized global feature order was enforced across all data frames to prevent column-mapping inconsistencies during the training, generation, and evaluation stages. Furthermore, when updating the pipeline object, the scaled matrices were directly injected without refitting, thereby preserving and consistently reflecting the established preprocessing state.
- Invalid Value Handling
Invalid values such as NaN and ±inf, which may appear after preprocessing, were detected and removed on a row-wise basis, followed by reindexing. This procedure ensures numerical stability in subsequent scaling and model training stages.
3.2. Model Structure
GANs are typically composed of a single generator–discriminator pair. However, such a configuration often struggles to converge for minority classes with limited training samples, leading to degraded quality of synthetic data and class confusion (i.e., the generation of samples mislabeled as other classes). To mitigate this issue, prior studies adopting split-GAN approaches have proposed training independent generator–discriminator pairs for each class and subsequently integrating their outputs. In particular, for classes with few samples, this strategy aims to reduce training bias caused by class imbalance by performing data augmentation prior to training.
To address these limitations, the present study introduces a hybrid global–split strategy designed to simultaneously alleviate class imbalance and class confusion. Specifically, a global WGAN-GP is trained on the entire traffic dataset to capture shared characteristics and establish robust decision boundaries across classes. In parallel, class-specific generation paths are employed to complement the global model, mitigating mode collapse and quality degradation for minority classes. The proposed overall model structure is shown in Figure 2.
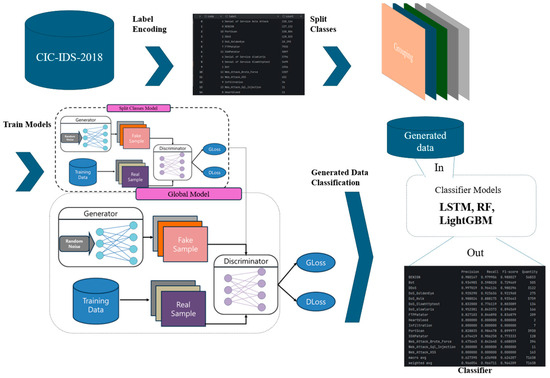
Figure 2.
Proposed Model Structure.
3.2.1. Generator and Discriminator
Generator: A multilayer perceptron (MLP)-based conditional architecture [15] was adopted, where latent noise and class labels are jointly provided as inputs to directly generate tabular feature vectors. The output layer produces linear outputs aligned with the data dimensionality , which are subsequently mapped back to the real space through the inverse scaling applied in preprocessing, together with domain-specific constraints (e.g., clipping). This design minimizes distributional distortions and enhances compatibility with the downstream classification evaluation pipeline.
Discriminator: In the proposed framework, both pathways leverage discriminators with complementary roles. The global discriminator serves as a reference to maintain distributional consistency and prevent class confusion, whereas the class-specific discriminator enhances sensitivity to the fine-grained distributions of each class. Importantly, the global discriminator also performs additional verification on samples generated by the class-specific models . This dual-discriminator validation ensures that the generated samples not only conform to the overall traffic distribution but also preserve the distinctive characteristics of the target attack category, thereby improving both quality and realism.
3.2.2. Objective Function
WGAN-GP combines the Wasserstein objective and gradient penalty. For real data , generated data = G(z, y), interpolated sample , and critic , the objectives for the discriminator (critic) and generator are defined as follows:
- Discriminator ()
- Generator ()
The specific value and optimization details of , the gradient penalty weight, are described in the experimental section.
3.2.3. Working Procedure
To simultaneously mitigate class imbalance and class confusion, we combine a path that learns the global distribution with a path that captures the fine-grained distribution per class. This involves two learning groups:
- Global Learning Groups: Trains a single conditional WGAN-GP on the entire dataset to capture common features and the decision boundary between classes. The discriminator learned at this stage is used as the global criterion.
- Class-specific Learning Groups: Trains class-specific generators for each class subset while sharing a single discriminator obtained at the global stage. This compensates for mode collapse and quality degradation in rare classes while maintaining consistency in global boundaries.
To assemble the final synthetic dataset for classifier training and evaluation, we employ the following procedure:
- Each minority class is synthesized independently by its class-specific generator, with the sample count capped such that no synthetic minority class exceeds 3 times the majority class.
- Regardless of whether a synthetic sample is produced by the global or class-specific generator, each is evaluated by the global discriminator. Only samples with discriminator scores above the 10th percentile (i.e., not in the bottom 10%) are retained. This ensures that all retained samples meet a unified global quality standard, thereby maintaining consistency with the overall data distribution.
- For minority classes known to suffer from mode collapse or labeling ambiguity, synthetic samples must receive high scores from both the global and class-specific critic. Only those samples passing both discriminators are retained to ensure mode coverage and labeling integrity.
- The final synthetic dataset exclusively comprises filtered samples, designed to achieve specified class proportions and to exclude low-quality outliers. This approach preserves essential minority-class behaviors and maximizes downstream evaluation robustness by unifying global and class-specific synthesis strengths under quality and balance constraints.
3.3. Evaluation Metrics
This study employs a combination of task-oriented and distribution similarity metrics to evaluate both the effectiveness (contribution to detection performance) and distribution fidelity (realism) of synthetic data. It also includes class-specific analysis and quality inspection procedures to ensure reliability, especially in the presence of class imbalance.
3.3.1. Usability Evaluation: TSTR [16]
We train intrusion detection classifiers using synthetic data and evaluate their performance on real (hold-out) data to assess how helpful synthetic data is for real-world tasks.
- Classifiers and Metrics
Classifiers such as Recurrent Neural Networks (LSTM) [17] and traditional ensemble/tree-based models (Random Forest [18], LightGBM [19]) are employed. The performance is evaluated using Accuracy, Precision, Recall, and F1 Score, with results presented as mean ± standard deviation across repeated experiments. Class-specific performance is analyzed alongside the macro F1 to account for class imbalance. The formulas for these metrics are as follows:
- Distribution similarity assessment (FID [20])
The distance between real and synthetic distributions is quantified by comparing their means and covariances in the embedding space. A lower value indicates a higher degree of similarity between the distributions. The FID score (Equation (7)) is computed for the synthetic samples while ensuring consistency in global scaling.
3.3.2. Reality Check Based on Discriminator (Critic) Score Distribution
Monitor the score distribution assigned by the trained critic to synthetic samples to indirectly check for mode collapse or unrealistic sample ratios during convergence. After training completion, perform critic predictions on synthetic data and cross-validate quality by observing both the score distribution and FID.
3.3.3. Label Consistency and Confusion Check
Using a strong classifier trained on real data (LightGBM), predict labels for synthetic data. Verify alignment with the target condition () and class distribution. Output and review the predicted label distribution for both the generated data and the target synthetic data to check for class bias or false labels.
3.3.4. Class-Wise Analysis
In environments with severe data imbalance, average metrics alone cannot adequately reflect the performance of rare classes. Therefore, we measure and analyze precision, recall, and F1 Score per class, focusing particularly on analyzing changes in recall for regression attack types. This approach is useful for identifying the phenomenon of 0 or low scores in rare classes.
3.3.5. Visual and Statistical Auxiliary Indicators
Present feature-wise histogram overlays and summary statistics (mean, standard deviation) for raw and generated data to verify whether distribution skew exists in specific features.
The quality evaluation of synthetic data is presented in the form of cross-validating distribution similarity (FID, critic score) and usefulness (TSTR performance).
4. Experiments
- Dataset and Partitioning
This study constructed a sample containing normal and various attack traffic using a public traffic dataset. All features were normalized using a global scaler, then stratified into training/test sets at a 60/40 ratio. The label distribution exhibited extreme imbalance: for example, the majority class (label 0) comprised millions of samples, while rare classes (e.g., labels 8, 9, 13) contained only single digit to dozens of samples.
Split preprocessing prevented data leakage by applying only the transformation step from the pipeline fitted to the training set to the test set. Part of the distribution of this data is shown in Figure 3.
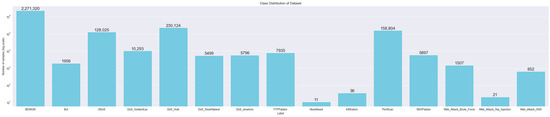
Figure 3.
Class Distribution of Dataset.
- Experimental Scenario
We employed a single conditional WGAN-GP trained on the entire dataset to capture both the global distribution and the class boundaries. For each class-specific subset, we trained an individual generator while sharing the globally trained discriminator to ensure distributional consistency across classes. The composition of label-specific subsets and the application of a global scaling procedure were consistently maintained throughout the training process.
To derive the model’s optimal performance, we conducted extensive hyperparameter exploration. During this process, we comprehensively analyzed the optimal trade-off point between stable performance and reliability by considering various performance metrics alongside the confidence intervals of the results. Using this confirmed optimal hyperparameter combination, we further enhanced the statistical reliability of the derived learning results by repeatedly training the model on the same dataset while changing the random seed multiple times.
- Optimization and Learning Schedule
The optimizer uses Adam with a learning rate of 1 × 10⁻³ and momentum coefficients β1 = 0.0, β2 = 0.9. The critic update schedule applies n_critic = 5, updating more frequently than the generator. Training was performed with a batch size of 512 over 100 epochs.
During the synthesis phase, a latent dimension of 512 was used. Large-scale samples (e.g., 100,000 instances) were generated via the generator.predict([z, y]) interface, followed by real-space reconstruction through inverse scaling and domain clipping.
- Hyperparameter Sensitivity Analysis (Ablation Study)
Based on the ablation and sensitivity analyses, we determined that setting both the latent dimension and batch size to 512 yields the best trade-off between classification accuracy, F1 scores, recall, precision, ROC-AUC, PR-AUC, and generative sample quality (FID). Performance metrics consistently improved with increasing values, and the results for batch size = 512 and latent dimension = 512 presented the highest overall scores with stable confidence intervals. Therefore, we adopted these settings as our final hyperparameter configuration in subsequent experiments. Figure 4 visualizes changes in key performance metrics based on latent dimension (left) and batch size (right). Each point represents the results of a seed-repeated experiment, while solid lines and shaded areas indicate the mean and 95% confidence interval. These results quantitatively support the aforementioned conclusion.
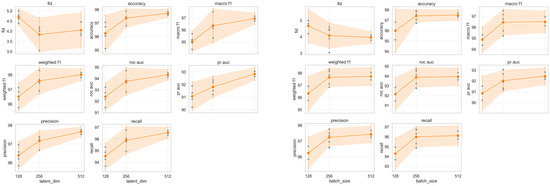
Figure 4.
Key metrics as functions of latent dimension (left) and batch size (right). Dots represent seed runs; lines and shading show mean and 95% CI.
- Recall
(Feature, label) pairs were batch-streamed, and both global and class-wise learning shared identical preprocessing, scaling, and feature ordering. To robustly assess the stability and reproducibility of our training procedure, each key experiment was repeated with 11 random seeds. For every run, we recorded d loss, g loss, and the main evaluation metrics: accuracy, macro F1-score, weighted F1-score, recall, precision, ROC-AUC, and PR-AUC. The summary results are presented in Table 2. The 95% confidence intervals were calculated using the total number of epochs as the sample size, and the Split model reports the average values across all its constituent models.
Table 2.
Training and evaluation summary for 11 independent random seed iterations of the global-only model and split-only model.
4.1. Comparison Methods (Baselines)
- Classifier-based comparison
LightGBM, LSTM, Random Forest, and other models were used for utility evaluation.
Class-specific metrics show high scores for most classes, while scores for the ultra-rare classes (single-digit to dozens of samples) converge toward zero, confirming the severity of the imbalance.
- Generated Data Label Consistency
We evaluated the accuracy of generated samples by predicting their labels using a classifier trained on real data and comparing them to the target labels. Under specific settings, we detected a phenomenon where the predicted label distribution for generated data collapsed into a single class (e.g., all classified as 0), suggesting the need for rare class reproducibility and stabilization of conditional synthesis.
4.2. Evaluation Protocols
- TSTR
We train classifiers using synthetic data from global learning and class-wise learning (with shared classifiers) to compare their actual performance.
- Distribution Invariance (FID)
Distribution fidelity is evaluated by calculating the FID, which compares the mean and covariance of real and synthetic data in the embedding space. Under identical preprocessing and scaling conditions, FID is calculated for a large-scale synthetic set, with the numerical values reported along with feature histograms and statistical summaries.
- Label consistency and confusion check
Distribution fidelity is evaluated by calculating the FID, which compares the mean and covariance of real data and synthetic data in the embedding space. The FID is computed for a large synthetic dataset under identical preprocessing and scaling conditions.
4.3. Metrics
Key indicators and distribution indicators are measured and analyzed separately.
- Key metrics: Accuracy, Precision, Recall, F1 Score. Considering class imbalance, Macro-F1 and per-class metrics are reported concurrently.
- Distribution metrics: FID, Inception Score (IS).
Critic score distributions and synthetic-real statistics summary tables are presented together to enhance interpretation.
The distribution of global discriminator critic scores, illustrated in Figure 5, reveals that the generated samples exhibit a wider spread—showing greater variability in both underestimation and overestimation—relative to the actual data. Nevertheless, the mean critic score remains largely comparable between the real and synthetic datasets, indicating that the generative model maintains overall fidelity. Presenting critic score distributions for both real and synthetic traffic enables direct visual assessment of mode collapse and batch-wise sample realism. Importantly, this approach aligns with the distributional quality evaluation methodologies established in leading recent works [5,15,17,21,22].
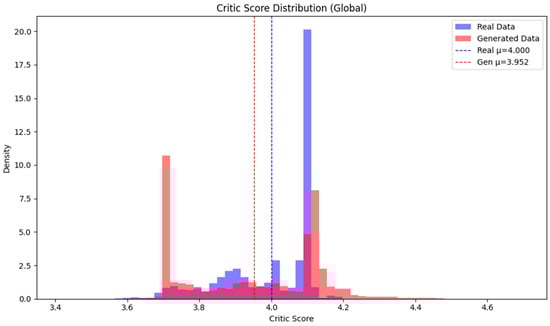
Figure 5.
Global Discriminator Critic Score Distribution.
The distribution of critic scores for the actual and generated data for the single-class SSHParator, which accounts for 0.21% of the total data, is shown in Figure 6. Real data exhibits a wide dispersion and distribution across various score intervals, while generated data shows a more concentrated distribution within a narrower interval (around 4.1). This pattern suggests that synthetic data is reliably recognized by the classifier as the ‘true’ class y = 0, indicating enhanced discriminative power (identification sensitivity) for the rare class.
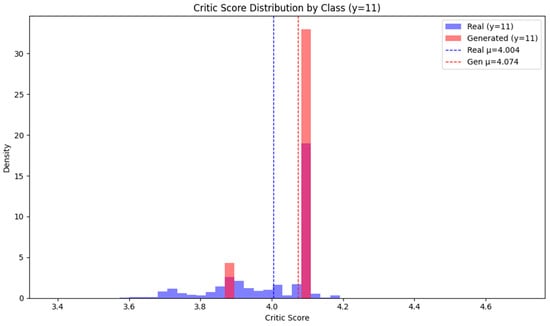
Figure 6.
Critic Score Distribution for the SSHParator Attack Type Discriminator.
4.4. Minority Class Enhancement and Filtering Procedure
- Class-specific synthesis ratio
Increase the target synthesis sample count for rare classes to correct imbalance, while setting an upper bound on the synthesis ratio per class to prevent overall distribution distortion (e.g., no more than k times that of the majority class). After synthesis, clip to the global range (real min/max) to remove unrealistic samples.
- Quality Filter
Remove samples below the q-percentile threshold based on global discriminator scores or use only samples passing the consensus of global criteria and class-specific criteria. This procedure suppresses the inclusion of oracle labels and mode collapse samples.
4.5. Operating the Synthetic Upper Bound, Class Balance, and Classifier Filter
To mitigate data imbalance, prevent distribution distortion, and eliminate mislabeled or low-quality samples, we define the following operational rules for synthetic data generation:
- Class-wise Target Count: The target synthetic sample count for each class i is determined by:where denotes the actual sample count of class in the training set, represents the median sample count across all classes, is the synthetic ratio upper bound multiplier, and defines the global upper limit for synthetic data generation.
- Synthesis Count Constraint: The number of synthetic samples for each class is constrained to not exceed .
- Minimum Support Correction: Classes with are adjusted to ensure for minimum support guarantee. The default value of is set to 1000.
- Quality Filtering: Samples with discriminator scores below the -th percentile threshold are removed to ensure quality control.
- Feature Range Clipping: After inverse scaling, each feature is clipped to its respective minimum/maximum values to maintain realistic data ranges.
Table 3 summarizes the descriptions and default values for each parameter.
Table 3.
Parameters Included in the Operating Rules.
4.6. Result
Experimental results showed that the loss values for training the Global WGAN-GP model were DLoss: 0.02 and GLoss: 2.28, indicating favorable performance. The Split WGAN-GP model recorded average values of DLoss: 0.07 and GLoss: 1.23. As shown in Figure 7, histogram comparisons with the original data confirmed that the generated data fell within the original data’s category range. Furthermore, the quality of the generated data (FID Score) was also measured at an excellent 3.05. When trained on the generated data and tested on real data, LightGBM achieved the highest accuracy (LSTM: 95.36%, RF: 91.93%, LightGBM: 97.88%), precision (LSTM: 95.18, RF: 92.42, LightGBM: 97.37%), and recall (LSTM: 95.71, RF: 92.57, LightGBM: 96.77). Overall, it demonstrated superior performance across all metrics.
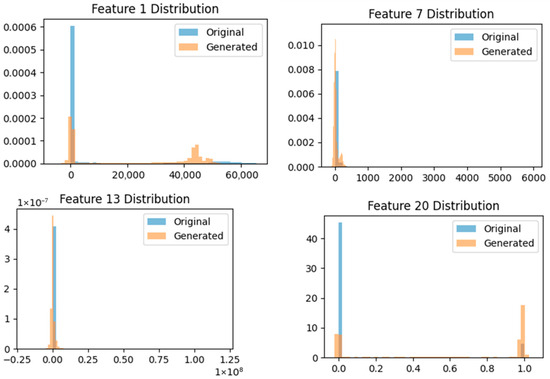
Figure 7.
Comparison of Feature Distributions Between Actual Traffic Data and Synthetic Data Generated by Hybrid WGAN-GP.
To further assess generative fidelity, Figure 7 compares the distribution of feature values between real traffic and synthetic samples generated by the hybrid WGAN-GP, using the SSHPatator attack type as an example. The synthetic data closely matches the empirical distribution of the real data, both visually and according to quantitative similarity metrics such as the FID score. This distributional alignment supports the reliability of the generated samples and underpins the observed improvements in minority-class recall and robust classifier performance (Table 4).
Table 4.
Attack-Type-Wise Minority-Class Recall and Performance Improvement (Hybrid WGAN-GP; CSE-CIC-IDS2017).
5. Security Analysis: Risks of Synthetic Data and Side-Channel Attacks
5.1. Threat Model and Problem Definition
Even in encrypted network environments, user behavior or visited services can be inferred solely from metadata patterns such as packet length, direction (up/down), timing, and burst structure. This means that even if the content payload is protected, the traffic shape can act as a side channel, potentially leaking sensitive information. Site identification in web environments has demonstrated high accuracy through large-scale Traffic fingerprinting attacks utilizing random forest-based techniques [23]. In mobile environments, it has been reported that estimations can extend to the level of apps, screen transitions, and user interactions [24]. The synthesis and detection pipeline in this study, premised on these threat models, also considers additional exposure points that may arise when utilizing generated data (e.g., when the synthetic distribution excessively preserves the original’s identifying burst patterns).
5.2. Connection to This Study: Security Considerations When Utilizing Synthetic Data
- Balancing Distribution Preservation and Information Leakage
While synthetic data preserves the global statistics and correlation structure of real data, excessively mimicking identifiable burst patterns can increase side-channel risks. This study incorporates procedures that suppress mode collapse and oracle labels through quality filtering and consistency checks against global discriminators, while mitigating overfitting of specific patterns.
- Security Implications of Label Consistency Diagnosis
Collapsing predicted labels or specific label biases in synthetic samples not only degrade detection utility but also suggests attackers could exploit biases in the synthetic distribution to attempt presence inference or pattern identification. Consequently, we explicitly enforce synthetic ratio caps, class-wise balance adjustments, and discriminator score-based filtering criteria.
5.3. Mitigation (Defense) Strategy Proposal
- Data Model Level
Upper Limit on Synthesis Ratio and Class-wise Balance Adjustment: To prevent distribution distortion during rare class augmentation, the target number per class is capped at an upper limit (k times), while the extremely low-frequency class is guaranteed a minimum support (). This suppresses the phenomenon where synthetic data excessively converges or collapses toward a specific class.
Discriminator Score-Based Filtering: Low-quality and mislabeled samples are blocked by removing samples below the q-percentile of the global discriminator’s scores. Subsequently, unrealistic outliers are refined through inverse scaling and clipping to the actual measurement range.
Evaluation Cross-Check: Simultaneously observes distribution similarity (FID) and classification performance (TSTR or actual classification performance) to verify that synthetic data maintains acceptable quality in both global statistics and task utility.
- Operational Level
Rule Disclosure and Reproducibility: Specify operational parameters such as k, , in the main text/appendix to ensure experiment reproducibility and policy consistency.
Quality Monitoring: Record the sample retention rate at each synthesis/refining stage, discriminator score distribution, and synthesis achievement rate per class to detect excessive bias or collapse early.
5.4. Summary
This study evaluated synthetic data quality primarily through distribution metrics (FID) and classification performance, excluding empirical evaluations of traffic-related channel attack metrics (e.g., site or activity phase identification accuracy). Additionally, class-specific generator training increases computational costs, and convergence stability remains limited for ultra-rare classes. Discriminator score-based filters also operate primarily on a global basis, limiting their ability to finely control class-specific patterns.
To mitigate these limitations, future work should focus on: (i) dynamically adjusting epochs and learning rates based on difficulty and sample size, and refining early stopping criteria; (ii) enhancing the robustness of distribution evaluation by reporting additional FID/MMD metrics in alternative representation spaces such as autoencoder embeddings, and (iii) introducing a consensus filter that combines global and class-specific score criteria to improve the balance between preserving fine-grained distributions and removing noise.
6. Conclusions
This study was conducted to deliver a practical solution for augmenting training data in cyber range and intrusion detection system environments, with particular emphasis on overcoming the scarcity of minority attack classes and the overall category imbalance. By proposing a hybrid WGAN-GP model that combines global distribution learning with class-specific synthetic data generation, this research not only addresses fundamental class imbalance challenges but also enables the creation of realistic, diverse, and privacy-preserving datasets for next-generation security training and automated detection platforms. Through extensive evaluation including Train on Synthetic, Test on Real (TSTR) protocols and distribution similarity assessments, our approach demonstrates significant improvements in both effective security training scenarios and detection accuracy for imbalanced and evolving threat environments.
Reviewing recent active research in this field reveals that enhancing intrusion detection performance through data augmentation is a key focus. To clearly demonstrate the performance and distinctiveness of the proposed model, we conducted comparisons with major studies published recently.
Table 5 presents all major classification metrics (Accuracy, Precision, Recall, F1-score, Macro F1, Weighted F1, ROC-AUC, PR-AUC) for widely used augmentation and GAN-based methods, including SMOTE, TabDDPM, CTGAN, and our proposed Hybrid Global-Split GAN, using the CIC-IDS2017 dataset. All experiments were performed using identical split ratios, classifier pipelines, and metric definitions for strict comparability. Metrics unavailable from prior publications are denoted as N/A.
Table 5.
Comparison of classification performance among various models trained on the CSE-CIC-IDS2017 dataset. The highest score for each evaluation metric represents the best performance achieved among the evaluated classifiers.
Our Hybrid GAN outperforms existing baselines across Accuracy, Precision, Recall, and both Macro and Weighted F1-Score, notably achieving balanced detection for minority attack classes. The ROC-AUC and PR-AUC scores underscore the model’s capacity for robust decision boundary learning and rare class recall, advancing over other generative approaches (e.g., CTGAN, TabDDPM) and oversampling methods (SMOTE). The VAE-WGAN-GP baseline, though demonstrating effective augmentation, reported lower Recall and F1-Score than our direct implementation, reaffirming the advantage of our hybrid framework for both global and minority detection in imbalanced settings.
These results highlight the need for comprehensive metric reporting and unified protocols in evaluating IDS augmentation and generative models. Our approach sets a strong precedent for advancing both practical deployment and future research in cybersecurity data synthesis and IDS training platforms.
This research presents a practical and differentiated solution for mitigating data imbalance, particularly the scarcity of minority classes, in both intrusion detection systems and cyber training environments through the generation of high-quality synthetic data. The proposed hybrid Global-Split WGAN-GP framework not only improves classifier performance for rare attack types but also enhances the diversity and realism of training datasets, thereby supporting more adaptive and effective capacity building for security personnel. These contributions highlight promising directions for future research on generative data augmentation for imbalanced datasets, with particular emphasis on deployment within cyber range training platforms and real-world security applications. Future work will further explore the robustness, scalability, and generalizability of the proposed approach across diverse operational scenarios.
Author Contributions
Conceptualization, J.J. and D.S.; methodology, J.J. and D.S.; software, J.J.; validation, H.P. and J.J.; formal analysis, H.P. and T.K.; investigation, J.J. and D.S.; resources, H.P.; data curation, H.P.; writing—original draft preparation, J.J. and D.S.; writing—review and editing, T.K. and D.S.; visualization, J.J.; supervision, D.S.; project administration, D.S.; funding acquisition, D.S. All authors have read and agreed to the published version of the manuscript.
Funding
This research was supported by the Future Challenge Defense Technology Research and Development Project (9150921) hosted by the Agency for Defense Development Institute in 2023.
Data Availability Statement
The data presented in this study are available on request from the corresponding author.
Conflicts of Interest
The authors declare no conflicts of interest.
References
- Miguel-Diez, A.; Campazas-Vega, A.; Álvarez-Aparicio, C.; Esteban-Costales, G.; Guerrero-Higueras, Á.M. A Systematic Literature Review of Unsupervised Learning Algorithms for Anomalous Traffic Detection Based on Flows. arXiv 2024, arXiv:2503.08293. [Google Scholar] [CrossRef]
- Zhao, X.; Fok, K.W.; Thing, V.L.L. Enhancing Network Intrusion Detection Performance using Generative Adversarial Networks. arXiv 2024, arXiv:2404.07464. [Google Scholar] [CrossRef]
- Sharafaldin, I.; Lashkari, A.H.; Ghorbani, A.A. Toward Generating a New Intrusion Detection Dataset and Intrusion Traffic Characterization. In Proceedings of the 4th International Conference on Information Systems Security and Privacy ICISSP, Funchal, Portugal, 22–24 January 2018; pp. 108–116. [Google Scholar] [CrossRef]
- Ferrag, M.A.; Maglaras, L.; Moschoyiannis, S.; Janicke, H. Deep Learning for Cyber Security Intrusion Detection: Approaches, Datasets, and Comparative Study. J. Inf. Secur. Appl. 2020, 22, 102419. [Google Scholar] [CrossRef]
- Xu, L.; Skoularidou, M.; Cuesta-Infante, A.; Veeramachaneni, K. Modeling Tabular Data Using Conditional GAN. In Proceedings of the 33rd International Conference on Neural Information Processing Systems NeurIPS, Vancouver, BC, Canada, 8–14 December 2019. [Google Scholar]
- Kotoju, R.; Veerabhadram, V. Generative Adversarial Networks for Cyber Threat Simulation and Defence Strategies. J. Theor. Appl. Inf. Technol. 2025, 103, 1388–1400. Available online: https://jatit.org/volumes/Vol103No4/19Vol103No4.pdf (accessed on 5 October 2025).
- Wang, Y.; Zhang, Z. Industrial Internet Intrusion Detection Method Based on VAE-WGAN-GP Data Enhancement. Acad. J. Comput. Inf. Sci. 2024, 7, 36–44. [Google Scholar] [CrossRef]
- Zacaron, A.M.; Lent, D.M.B.; Ruffo, V.G.d.S.; Carvalho, L.F.; Proença, M.L. Generative adversarial network models for anomaly detection in software-defined networks. J. Netw. Syst. Manag. 2024, 32, 93. [Google Scholar] [CrossRef]
- Gulrajani, I.; Ahmed, F.; Arjovsky, M.; Dumoulin, V.; Courville, A.C. Improved Training of Wasserstein GANs. In Proceedings of the 31st International Conference on Neural Information Processing Systems NeurIPS, Long Beach, CA, USA, 4–9 December 2017. [Google Scholar]
- Huang, H.; Wang, P.; Pei, J.; Wang, J.; Alexanian, S.; Niyato, D. Deep Learning Advancements in Anomaly Detection: A Comprehensive Survey. IEEE Internet Things J. 2025. [Google Scholar] [CrossRef]
- Odena, A.; Olah, C.; Shlens, J. Conditional Image Synthesis with Auxiliary Classifier GANs. In Proceedings of the 34th International Conference on Machine Learning ICML, Sydney, Australia, 6–11 August 2017. [Google Scholar]
- Jang, E.; Gu, S.; Poole, B. Categorical Reparameterization with Gumbel-Softmax. In Proceedings of the 5th International Conference on Learning Representations ICLR, Toulon, France, 24–26 April 2017. [Google Scholar]
- Durugkar, I.; Gemp, I.; Mahadevan, S. Generative Multi-Adversarial Networks. In Proceedings of the 5th International Conference on Learning Representations ICLR, Toulon, France, 24–26 April 2017. [Google Scholar]
- Yang, L.; Shami, A. IoT Data Analytics in Dynamic Environments: From An Automated Machine Learning Perspective. Eng. Appl. Artif. Intell. 2022, 116, 105366. [Google Scholar] [CrossRef]
- Zhao, Z.; Kunar, A.; Birke, R.; Van der Scheer, H.; Chen, L.Y. Ctab-gan+: Enhancing tabular data synthesis. Front. Big Data 2024, 6, 1296508. [Google Scholar] [CrossRef] [PubMed]
- Aceto, G.; Giampaolo, F.; Guida, C.; Izzo, S.; Pescapè, A.; Piccialli, F.; Prezioso, E. Synthetic and privacy-preserving traffic trace generation using generative AI models for training Network Intrusion Detection Systems. J. Netw. Comput. Appl. 2024, 229, 103926. [Google Scholar] [CrossRef]
- Hochreiter, S.; Schmidhuber, J. Long short-term memory. Neural Comput. 1997, 9, 1735–1780. [Google Scholar] [CrossRef] [PubMed]
- Breiman, L. Random forests. Mach. Learn. 2001, 45, 5–32. [Google Scholar] [CrossRef]
- Ke, G.; Meng, Q.; Finley, T.; Wang, T.; Chen, W.; Ma, W.; Ye, Q.; Liu, T.-Y. Lightgbm: A highly efficient gradient boosting decision tree. In Proceedings of the 31st Conference on Neural Information Processing Systems (NIPS 2017), Long Beach, CA, USA, 4–9 December 2017; Available online: https://www.microsoft.com/en-us/research/wp-content/uploads/2017/11/lightgbm.pdf (accessed on 5 October 2025).
- Heusel, M.; Ramsauer, H.; Unterthiner, T.; Nessler, B.; Hochreiter, S. GANs Trained by a Two Time-Scale Update Rule Converge to a Local Nash Equilibrium. arXiv 2017, arXiv:1706.08500. [Google Scholar]
- Kotelnikov, A.; Baranchuk, D.; Rubachev, I.; Babenko, A. Tabddpm: Modelling tabular data with diffusion models. In Proceedings of the 40th International Conference on Machine Learning, Honolulu, HI, USA, 23–29 July 2023; pp. 17564–17579. [Google Scholar]
- Zhao, Z.; Kunar, A.; Birke, R.; Chen, L.Y. Ctab-gan: Effective table data synthesizing. In Proceedings of the 13th Asian Conference on Machine Learning, Virtual Event, 17–19 November 2021; pp. 97–112. [Google Scholar]
- Hayes, J.; Danezis, G. k-fingerprinting: A robust scalable website fingerprinting technique. In Proceedings of the 25th USENIX Security Symposium (USENIX Security 16), Austin, TX, USA, 10–12 August 2016; Available online: https://www.usenix.org/conference/usenixsecurity16/technical-sessions/presentation/hayes (accessed on 5 October 2025).
- Ni, T.; Lan, G.; Wang, J.; Zhao, Q.; Xu, W. Eavesdropping mobile app activity via {Radio-Frequency} energy harvesting. In Proceedings of the 32nd USENIX Security Symposium (USENIX Security 23), Anaheim, CA, USA, 9–11 August 2023; pp. 3511–3528. Available online: https://www.usenix.org/conference/usenixsecurity23/presentation/ni (accessed on 5 October 2025).


Disclaimer/Publisher’s Note: The statements, opinions and data contained in all publications are solely those of the individual author(s) and contributor(s) and not of MDPI and/or the editor(s). MDPI and/or the editor(s) disclaim responsibility for any injury to people or property resulting from any ideas, methods, instructions or products referred to in the content. |
© 2025 by the authors. Licensee MDPI, Basel, Switzerland. This article is an open access article distributed under the terms and conditions of the Creative Commons Attribution (CC BY) license (https://creativecommons.org/licenses/by/4.0/).