Abstract
As the demand for land use monitoring continues to grow, high-precision remote sensing products have become increasingly important. Compared to traditional methods, deep learning networks demonstrate significant advantages in automatic feature extraction, handling complex scenes, and improving classification accuracy. However, as the complexity of these networks increases, so does the computational cost. To address this challenge, we propose an innovative knowledge distillation model, integrating two key modules—spatial-global attention feature distillation (SGAFD) and channel attention-based relational distillation (CARD). This model enables a lightweight “student” network to be guided by a large “teacher” network, enhancing classification performance while maintaining a compact model size. We validated our approach on the large-scale public remote sensing datasets GID15 and LoveDA, and the results show that these modules effectively improve classification performance, overcoming the limitations of lightweight models and advancing the practical applications of land use monitoring.
1. Introduction
With the rapid development of remote sensing technology, the application of remote sensing products has become increasingly indispensable in various fields [1]. For instance, in agriculture, remote sensing technology is used for crop monitoring and yield prediction [2]; in urban planning, it supports land use analysis and building layout design [3]; in ecological monitoring, it helps assess environmental changes and forest cover [4]. The core technology that generates these products is remote sensing image interpretation. Compared with traditional field surveys and mapping methods, remote sensing images provide large-scale, multi-resolution, and multi-angle data [5]. Through image interpretation techniques, various land use types can be extracted, allowing for tailored products to be generated according to specific task requirements, significantly enhancing the efficiency of environmental management and social development.
After decades of development, remote sensing image interpretation has evolved from traditional methods like visual interpretation and human-computer interactive interpretation to intelligent interpretation, with deep learning networks being the most representative [6]. Deep learning networks can extract feature information from vast amounts of data, achieving classification accuracy that is difficult for traditional methods to reach. Convolutional neural networks (CNNs) have been widely applied in the field of computer vision due to their unique convolutional structure, excelling in tasks such as image classification, object detection, and semantic segmentation [7]. Semantic segmentation is one of the core research tasks in computer vision, aiming to achieve pixel-level classification [8]. Earlier semantic segmentation algorithms, such as thresholding methods based on color or grayscale [9] and region-growing methods [10], dominated before the rise of deep learning. Thresholding methods perform segmentation by setting color or grayscale thresholds, which is simple and efficient but relies on manual experience, making it difficult to adapt to complex backgrounds and lighting variations. Additionally, it cannot capture contextual information in images, leading to poor segmentation results. The region-growing method merges neighboring pixels based on similarity criteria, which is useful for irregular targets. However, the selection of seed points and the setting of similarity criteria significantly impact the results. In complex scenes, it may lead to over-segmentation or under-segmentation. Compared to traditional methods, deep learning, especially convolutional neural networks (CNNs), can automatically learn image features and adjust the model to suit different tasks. CNNs extract local features through convolutional layers and capture global context, effectively handling complex backgrounds, lighting variations, and scale differences [11].
The development of convolutional neural networks began with LeNet In 1998 [12], which innovatively used backpropagation algorithms to train multi-layer networks, successfully applied in handwritten digit recognition. The success of LeNet inspired subsequent deeper networks, such as AlexNet [13], which achieved a breakthrough in the 2012 ImageNet competition. Later, VGGNet [14] and GoogLeNet [15] further increased network depth and complexity, promoting the widespread application of deep learning. However, as the number of network layers increased, the vanishing gradient problem became a bottleneck for deeper networks, until ResNet [16] solved this problem by introducing the residual block structure, leading to the broad application of deep networks in various vision tasks.
In the task of semantic segmentation, fully convolutional networks (FCNs) [17] marked a significant breakthrough by replacing the fully connected layers in convolutional networks with convolutional layers, achieving spatial mapping instead of classification scores and greatly improving segmentation efficiency. Meanwhile, the application of the encoder–decoder structure [11] significantly enhanced the performance of semantic segmentation. The encoder extracts features, and the decoder progressively restores compact features to generate pixel-level classification results. This architecture has been widely applied in fields such as medical image processing, autonomous driving, and remote sensing image interpretation [18,19,20].
With the introduction of transformer models, the performance of semantic segmentation tasks has been further improved [21]. Compared to traditional convolutional neural networks (CNNs), transformers have demonstrated significant advantages in handling global contextual information. By utilizing the self-attention mechanism, transformers can effectively capture relationships between distant pixels in an image, which is particularly important for understanding complex scenes and recognizing cross-scale objects in remote sensing imagery. In particular, recent architectures such as ViT (vision transformer) [22] and Swin transformer [23] have made significant progress in semantic segmentation tasks, showcasing the powerful ability of transformers to model image features.
However, despite the revolutionary breakthroughs that deep learning has brought to remote sensing image interpretation, it still faces a series of challenges. The high resolution, multispectral features, and complex scenes with cross-scale targets in remote sensing images pose significant challenges to traditional deep learning models [24,25,26]. To address these challenges, an increasing number of studies are exploring hybrid models that combine traditional methods with deep learning in order to better extract multi-level spatial features [27,28]. Additionally, with the continuous increase in remote sensing image data, improving the computational efficiency and storage efficiency of models has become an important direction for future research [29]. Studies have shown that more than 85% of the weights in a large trained network are redundant, and removing these redundant parts has minimal impact on model performance [30]. To address this issue, many network compression techniques have emerged, including model quantization [31], model pruning [32], tensor decomposition [33], and knowledge distillation [34]. The core idea of knowledge distillation is to transfer knowledge from a large teacher model to a student model during training, thereby improving the performance of the student model. The knowledge distillation technique, first proposed by Hinton et al., provides richer training information to the student model through soft labels, and subsequent studies have gradually introduced intermediate feature distillation [35], attention mechanism distillation [36], and feature relationship-based distillation methods [37].
During the development of knowledge distillation, researchers realized that relying solely on soft labels or intermediate feature transfer might be insufficient to comprehensively enhance the performance of student models, especially when dealing with complex feature relationships [38]. Structure-based feature distillation methods further enhance the student model’s ability to understand and extract multi-level features [39,40]. By combining multi-level knowledge distillation with soft label outputs, intermediate features, and feature relationships, student models can effectively approach the performance of teacher models [41].
Remote sensing images exhibit complex and diverse scenes and significant target scale differences, making it a great challenge for networks to accurately identify multiple targets in such scenes. Existing knowledge distillation methods are mainly applied to urban street scenes like cityscapes and indoor scenes like ADE20K [42], where the scene structure is relatively simple and the target scale variation is limited. In contrast, remote sensing images present more complexity due to the diversity of land use types, uneven target distribution, and significant scale variations. For example, small-scale targets (such as rural roads or farmlands) coexist with large-scale targets (such as urban buildings or water bodies) in remote sensing images, and traditional distillation techniques struggle to capture these cross-scale features [43]. Additionally, feature representation is crucial. Previous knowledge distillation methods often suffer from significant information redundancy in feature representations, rarely utilizing deep-level features, and tend to lose important information during the transfer process [44,45]. Furthermore, optimization for specific tasks in remote sensing images often relies on approaches designed for traditional visual tasks, without specialized adaptations. These issues limit the effectiveness and application of knowledge distillation in complex remote sensing tasks [46].
To address this issue, we propose two distillation modules specifically designed for remote sensing images: the spatial-global attention feature distillation (SGAFD) module and the channel attention-based relational distillation (CARD) module. The SGAFD module enhances the network’s ability to perceive targets of different scales by combining spatial and global attention mechanisms, capturing global information about large-scale scenes and details in remote sensing images. The CARD module further utilizes the channel attention mechanism to optimize the modeling of relationships between features, improving the network’s ability to distinguish between complex land use classes. Through the synergistic effect of these two modules, the “student network” can effectively learn the rich knowledge from the “teacher network” in complex remote sensing scenes, thereby significantly improving performance in multi-target remote sensing image tasks.
In summary, the main contributions of this paper are as follows:
The SGAFD module is proposed, which enhances the student network’s ability to capture both global and local features by incorporating spatial and global attention mechanisms, thereby improving segmentation accuracy.
The CARD module leverages channel attention mechanisms to refine the extraction and representation of feature relationships, further improving classification accuracy and boundary handling capabilities.
2. Methods
In this section, we will provide a detailed introduction to the architecture and implementation principles of the proposed remote sensing semantic segmentation distillation method.
2.1. Overview
Figure 1 presents the overall framework of the method, which includes both the teacher model and the student model. The feature maps extracted by each model are passed into the core distillation module, which consists of two parts: the channel attention-based relational distillation module (CARDM) and the spatial-global attention feature distillation module (SGAFDM). These two modules efficiently facilitate knowledge transfer between the teacher and student models, enabling the student model to learn global spatial information and critical channel information, thereby enhancing the model’s overall performance. During this process, the distillation loss is generated separately by these two core modules and is combined with the student model’s regular task loss to form the complete distillation framework loss. The regular task loss for the student model measures the similarity between the predicted class distribution and the true class distribution, as expressed in the following equation:
where represents the total number of pixels in the image, typically , and represents the number of classes. denotes the true label of pixel for class , and represents the predicted probability that pixel belongs to class .
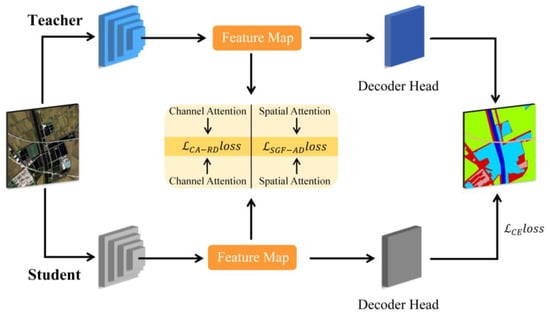
Figure 1.
Distillation architecture.
Through the above design, we aim to significantly enhance the performance of the student model in remote sensing semantic segmentation tasks while ensuring the model remains lightweight.
2.2. Spatial-Global Attention Feature Distillation Module
Convolution operations possess a unique local receptive field and translation invariance, enabling the efficient extraction of local features such as edges and textures. Thanks to translation invariance, the convolutional kernels can detect the same features regardless of the object’s translation or rotation within the image. These characteristics give convolution operations a significant advantage in the field of computer vision. However, due to the limited size of the receptive field, convolution has certain limitations when handling multi-scale objects. Although stacking multiple layers can expand the receptive field, the efficiency of capturing global contextual information diminishes significantly. Additionally, objects in images often exhibit a certain degree of global correlation with surrounding pixels, and capturing these global relationships helps the network better understand the contextual information, ultimately improving segmentation accuracy.
To address this issue, we propose the spatial-global attention feature distillation (SGAFD) module (as shown in Figure 2). This module innovatively combines spatial attention with global attention, allowing it to retain the detailed information of local features while also capturing reliable global contextual information. As a result, the network’s overall performance is enhanced.
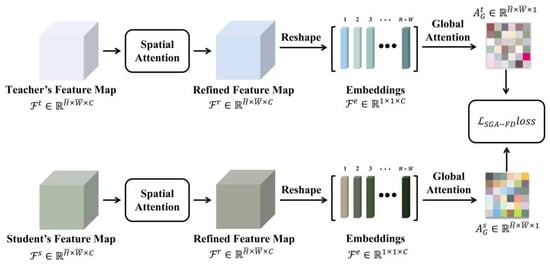
Figure 2.
Spatial-global attention feature distillation.
The structure of the spatial attention module is illustrated in Figure 3. This structure extracts key spatial information locations using max pooling and average pooling operations. Subsequently, a convolution operation is applied to integrate the results of the two pooling operations, generating attention weights. Finally, the weights are applied to the original feature map, resulting in an enhanced feature map. The specific implementation formulas are as follows:
where and represent max pooling and average pooling operations, respectively, denotes a convolutional kernel, and refers to the sigmoid activation function.
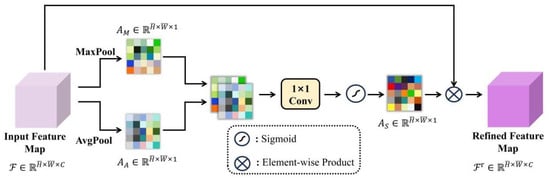
Figure 3.
Spatial attention.
The feature map processed by the spatial attention mechanism is reshaped, followed by the calculation of cosine similarity between vectors to generate a global feature map. Finally, the loss value of this module is obtained by calculating the difference between the teacher model and the student model. The formula is as follows:
Here, represents the computation of global feature weights between two elements, where and denote the indices of the vectors after the operation, denotes the reshaping of the feature map into a vector, stands for element-wise multiplication, represents the dot product between two elements, and denotes the computation of the norm of an element, denotes the Mean Squared Error (MSE) between two vectors, which involves computing the original difference for each pair of elements, squaring the differences, and then averaging the squared differences.
The innovation of this module lies in the introduction of the spatial attention mechanism, which captures more refined spatial dependencies by calculating global feature weights between different locations. In traditional methods, global statistical information of the feature map is typically matched, often overlooking local details and spatial relationships. However, in this module, the introduction of the global attention module is of significant importance, aiming to address the limitations of convolution operations in capturing global contextual information. Convolution operations typically rely on local receptive fields, which efficiently extract local features from images but struggle to handle cross-scale or long-range dependencies. This poses a challenge for many computer vision tasks, particularly in remote sensing image analysis.
The global attention module calculates global feature weights to help the network capture dependencies between distant regions of the image, thereby improving the understanding of the image’s overall structure and spatial distribution. Specifically, the module assigns a weight to each position in the image based on its relevance to the global context, allowing the network to not only extract local features but also incorporate global information into the feature map. This enables the network to enhance its understanding of the image’s global context while building on the local features, thereby improving the model’s performance and robustness in complex scenes.
This is particularly important in remote sensing imagery, where images often contain objects at multiple scales and complex background information. Cross-scale and multi-object scenes are often key factors in remote sensing tasks.
2.3. Channel Attention-Based Relational Distillation Module
Channel information is crucial in convolutional neural networks. As a core component of feature maps, each channel carries unique attribute information, such as edges, colors, textures, and other high-level semantic features. Typically, the number of channels is large, and in image segmentation tasks, these channels provide the network with multi-scale details that aid in a more accurate understanding of the semantic meaning in different regions of the image. However, the channel information that the student model can access is often significantly less than that of the teacher model, which means the student model is limited in its channel representation capabilities. To address this issue, we propose a channel attention-based relational distillation module (CARDM), as shown in Figure 4. This module enhances the student’s imitation of the teacher network, helping the student effectively learn the critical information within the channels, thereby improving the model’s feature representation ability.
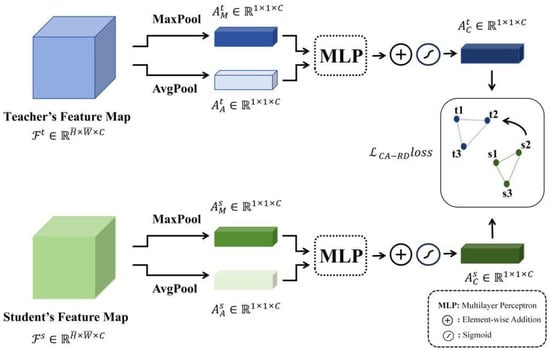
Figure 4.
Channel attention-based relational distillation module.
This module can be divided into two parts: the extraction of channel weights and the relational distillation computation. The channel weights are extracted using a channel attention mechanism, with the formula as follows:
here, and represent the max pooling and average pooling operations, respectively, while denotes a multilayer perceptron. The max pooling and average pooling results undergo nonlinear transformations to learn the inter-channel weights, ultimately outputting the importance score for each channel. represents the sigmoid activation function, which is used to map the final output to a range between 0 and 1, facilitating uniformity in subsequent distillation calculations.
The obtained channel attention weig”ts a’e fed Into the relational distillation module to compute the angle-based relational loss (Equation (6)) and the distance-based relational loss (Equation (7)). The formulas are as follows:
where represents the dot product between the teacher’s and student’s channel feature weights, while and represent the norms of the two weights. Finally, the two relational losses are summed to obtain the final CA-RD loss, as shown in the following formula:
Traditional channel-wise distillation methods channel-wise distillation [47] aim to align each channel of the teacher model with the student model individually. While this alignment enhances the consistency of local features, it neglects the information interaction between channels and the overall contextual relationships. In contrast, relational distillation methods take into account the global dependencies between features, helping the student model capture spatial relationships and global consistency between different categories in the feature structure, thereby achieving better performance improvements in fine-grained classification tasks.
3. Experiments
In this section, we designed a series of extensive experiments to validate the reliability of the proposed method.
3.1. Dataset
We used two widely recognized public remote sensing segmentation datasets for our experiments: the Gaofen Image Dataset (GID-15), as shown in Figure 5 [48], and the LoveDA dataset, shown in Figure 6 [49]. Each of these datasets has unique characteristics, covering different geographic regions, land use types, and spatial resolutions, providing diverse and rich samples for remote sensing image segmentation tasks.
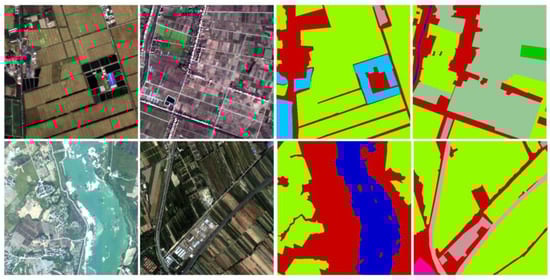
Figure 5.
GID15 dataset presentation.
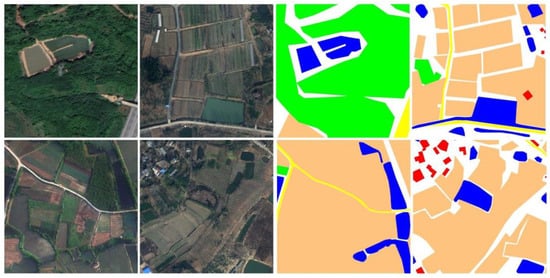
Figure 6.
LoveDA dataset presentation.
GID-15: The GID-15 dataset is a high-resolution remote sensing land use dataset developed and published by Wuhan University, based on Gaofen-2 satellite data. It covers a large area of over 50,000 square kilometers across more than 60 cities in China. The dataset is divided into two parts: the large-scale classification dataset (GID-5) and the fine-grained land use dataset (GID-15). GID-5 includes five categories: buildings, farmland, forest, grassland, and water bodies, with a total of 150 Gaofen-2 satellite images, each measuring 6800 × 7200 pixels. GID-15, as the fine-grained land use dataset, contains 15 categories, including paddy fields, dry land, orchards, natural grassland, urban residential areas, rural residential areas, and more. It consists of 10 Gaofen-2 satellite images. For our task, these images were cropped into patches of 512 × 512 pixels with a 50% overlap, resulting in a total of 67,500 image patches. The dataset was split into training and validation sets in an 80:20 ratio. In this paper, the GID-15 dataset is used as the experimental dataset to better evaluate the performance of semantic segmentation models.
LoveDA: The LoveDA dataset consists of a total of 5987 high-resolution images (0.3 m) from three different cities, with each image having a resolution of 1024 × 1024 pixels. The dataset covers two domains—urban and rural—featuring complex ground conditions, varying scales of segmentation objects, and uneven sample distributions, all of which present significant challenges for segmentation tasks. The dataset categorizes ground objects into seven classes: background, building, road, water, barren, forest, and agriculture. Since the official dataset does not provide ground truth labels for the test set, the validation set is used as the test set for evaluation purposes.
3.2. Implementation Details
Semantic Segmentation Model Frameworks: In this experiment, we employ two semantic segmentation model frameworks: DeepLabv3+ [50] and PSPNet [51]. DeepLabv3+ utilizes an encoder–decoder architecture, where features are encoded by the backbone network and then progressively decoded to restore pixel-level classification results at the original image resolution. DeepLabv3+ incorporates the Atrous spatial pyramid pooling (ASPP) module, which enhances multi-scale feature extraction and fusion, enabling more refined segmentation results in complex scenes. PSPNet, on the other hand, introduces the pyramid pooling module (PPM), which excels at integrating global contextual information. By aggregating global context at multiple scales, PSPNet can achieve finer segmentation results, particularly in large and complex scenes.
Backbone Networks: In this experiment, we use the ResNet series as the feature extractor. ResNet introduced the innovative residual structure, which effectively addresses the vanishing or exploding gradient problems that arise with deeper networks, enabling the development of much deeper neural networks. This has significantly advanced deep learning, particularly in the areas of image classification, object detection, and semantic segmentation, where ResNet has demonstrated outstanding performance and wide applicability. In our setup, ResNet101 serves as the backbone for the teacher model, while ResNet18 is used as the backbone for the student model.
Training Setup: In this experiment, we utilize PyTorch 1.10.0 as the deep learning framework, with all networks built on the mmsegmentation. The training hardware consists of an NVIDIA RTX 3090 Ti GPU (24 GB). The batch size is set to 12, and the total number of training iterations is 80,000. The optimizer used is stochastic gradient descent (SGD) [52], a widely used optimization algorithm in deep learning, known for its simplicity and efficiency. The initial learning rate is set to 0.01 to ensure the stability and effectiveness of the training process. The momentum is set to 0.9, which helps smooth oscillations in areas with steep gradients, particularly when encountering sharp gradients during training. Weight decay is set to 0.0005 to regularize the model, preventing overfitting and suppressing excessively large weights. We employ the PolyLR learning rate scheduling strategy [53], where the learning rate decays polynomially with the number of training iterations. This setup helps balance training speed and model performance, ensuring that the model converges at the appropriate time while avoiding overfitting. Additionally, various data augmentation techniques are applied to the training data, including random scaling, cropping, flipping, and color adjustment, to enhance the model’s generalization capability.
Evaluation Metrics: We use two key evaluation metrics that best reflect the performance of semantic segmentation models: mean accuracy (mAcc) [54] and mean intersection over union (mIoU) [55]. mAcc is the average classification accuracy across all classes, representing the proportion of correctly classified instances for each class. It focuses on the individual performance of each class and is not influenced by class imbalance. The formula for mAcc is:
where denotes the total number of classes, (true positives) represents the number of pixels correctly classified as a particular class, while (false negatives) refers to the pixels that belong to a specific class but were incorrectly classified as another class.
mIoU represents the overlap between the model’s predictions and the ground truth labels. It is calculated by first determining the intersection over union (IoU) for each class, and then averaging the IoU across all classes. The formula is:
where represents false negatives. mIoU, as a global evaluation metric, is well suited for assessing the overall quality of segmentation.
4. Results and Analysis
4.1. Performance Comparison
Under the DeepLabV3+ architecture, as shown in Table 1, the baseline performance of the student network on the LoveDA dataset (with an mIoU of 48.7% and mAcc of 61.2%) was improved to varying degrees through several classic distillation methods (KD, CWD, FitNet). Specifically, the KD method improved the mIoU by 0.22%, the CWD method by 0.23%, and the FitNet method showed the greatest improvement, with an increase of 0.55%. In contrast, our proposed method significantly enhanced the network’s performance, with an mIoU increase of 0.91%, reaching a final mIoU of 49.61% and mAcc of 63.38%, clearly demonstrating the superiority of our method on the LoveDA dataset.

Table 1.
Comparison of accuracy under Deeplabv3+ architecture.
On the GID15 dataset, the baseline performance of the student network (with an mIoU of 81.79% and mAcc of 90.76%) was also improved with the help of classic distillation methods, where the KD method increased the mIoU by 2.54%, the CWD method by 2.42%, and the FitNet method by 2.86%. Compared to these methods, our approach achieved a more significant improvement, with an mIoU increase of 4.14%, resulting in a final mIoU of 85.96% and mAcc of 92.06%.
Similarly, under the PSPNet architecture, as shown in Table 2, the baseline performance of the student network on the LoveDA dataset was an mIoU of 47.49% and mAcc of 58.4%. While the KD method only increased the mIoU by 0.08%, the CWD method showed a slight decline, and the FitNet method provided a 0.38% improvement, our proposed method achieved a 1.41% improvement in mIoU, reaching a final mIoU of 48.9% and mAcc of 60.8%, significantly outperforming the other methods.
Table 2.
Comparison of accuracy under PSPNet architecture.
In the GID15 dataset, the baseline performance of the student network (with an mIoU of 81.2% and mAcc of 88.19%) improved by 1.5% using the KD method, by 1.38% using the CWD method, and by 2.57% using the FitNet method. Our method, however, resulted in an mIoU improvement of 2.81%, achieving a final mIoU of 84.01% and mAcc of 89.39%.
The experimental results not only validate the effectiveness of our proposed distillation method across different architectures and datasets but also provide insights into the reasons behind its superior performance. Compared to classical distillation methods, our approach exhibits stronger knowledge transfer capabilities and generalization, especially in complex remote sensing scenarios. This advantage is attributed to the synergistic effect of the two key modules (SGAFD and CARD) we designed. Specifically, the SGAFD module enhances the network’s ability to perceive targets at varying scales by integrating spatial and global attention mechanisms. Remote sensing images often contain objects with significant scale differences (e.g., large urban buildings versus small vegetation areas), and traditional methods typically struggle to effectively address these scale variations. By combining spatial and global contextual information, the SGAFD module enables the network to better capture features across multiple scales, thereby improving its ability to recognize and robustly classify objects of varying sizes. This becomes particularly important in remote sensing images, where different land cover types can exhibit significantly different characteristics at various resolutions, making scale sensitivity a key factor in enhancing classification performance.
The CARD module further optimizes the modeling of relationships between features, improving the network’s ability to distinguish complex land cover types. In remote sensing images, land cover types often exhibit complex spatial relationships and dependencies, which simple feature extraction methods may fail to capture, leading to reduced classification accuracy. The CARD module introduces a channel attention mechanism that refines the relationships between feature channels, enabling the student network to more accurately learn contextual dependencies between different land cover classes. This is especially beneficial in distinguishing land cover types such as urban areas, forests, and water bodies, where boundaries between classes are often blurred and traditional methods may struggle to differentiate them effectively.
These advantages allow the student network to more effectively learn multi-level feature knowledge from the teacher network, especially in remote sensing images that present significant challenges such as scale variations and imbalanced sample distributions. Land cover types in remote sensing images are often unevenly distributed, with large categories (such as urban buildings) and small categories (such as wetlands and sparse vegetation) having significantly different sample sizes. Through the optimization of feature relationships in the CARD module, the student network can balance the learning of all categories, preventing overfitting to the large categories and improving classification accuracy for smaller classes.
Overall, the synergistic effect of the SGAFD and CARD modules not only enables the student network to better extract and transfer multi-level feature knowledge from the teacher network but also enhances the network’s generalization ability in remote sensing images, significantly improving classification accuracy and stability. This makes our distillation method outperform traditional methods, especially in complex remote sensing scenarios.
4.2. Ablation Study
This section presents ablation experiments to evaluate the effectiveness of the proposed SGAFD and CARD modules. We selected two popular semantic segmentation architectures: DeepLabv3+ and PSPNet, with ResNet101 as the teacher network and ResNet18 as the student network. Table 3 and Table 4 show the experimental results under different configurations, reporting the performance in terms of mIoU (%) and mAcc (%).
Table 3.
Experimental results of Deeplabv3+ ablation using the LoveDA dataset.
Table 4.
Experimental results of PSPNet ablation using the LoveDA dataset.
As shown in Table 3, the student network (DeepLabv3+_ResNet18) achieves an mIoU of 48.7% and an mAcc of 61.2% without introducing any modules, indicating that ResNet18, as a smaller network, has limitations in feature representation and cannot reach the performance of the teacher network. After introducing the SGAFD module, the mIoU increased by 0.81% (to 49.51%), and the mAcc increased by 2.53% (to 63.73%), demonstrating that the SGAFD module significantly enhances the student network’s feature representation by incorporating spatial and global attention mechanisms. When the CARD module is introduced alone, the mIoU improves slightly by 0.04% (to 48.74%), but the mAcc improves by 1.09% (to 62.29%), indicating that the CARD module primarily improves classification accuracy, with a limited impact on mIoU. When both the SGAFD and CARD modules are introduced, the model achieves the best performance, with the mIoU increasing to 49.61% and the mAcc increasing to 63.38%, representing improvements of 0.91% and 2.18% over the baseline, respectively.
In the PSPNet architecture, as shown in Table 4, the student network (PSPNet_ResNet18) achieves an mIoU of 47.49% and an mAcc of 58.4% without introducing any modules, showing slightly lower performance compared to the DeepLabv3+ architecture. This may be due to PSPNet’s feature extraction capabilities not being fully realized in smaller networks. After introducing the SGAFD module, the mIoU increased by 1.08% (to 48.57%), and the mAcc increased by 2.44% (to 60.84%), indicating that the SGAFD module also significantly improves the performance of the student network under the PSPNet architecture. When the CARD module is introduced, the mIoU increased by 1.14% (to 48.63%) and the mAcc increased by 1.87% (to 60.27%). When both modules are introduced together, the mIoU increased by 1.41% and the mAcc increased by 2.4%, demonstrating that the combination of the SGAFD and CARD modules significantly improves the performance of the student network under the PSPNet architecture.
The experimental results show that the SGAFD module provides particularly notable improvements in both architectures, especially in terms of mAcc. This indicates that the SGAFD module helps capture spatial and global features, contributing to improved semantic segmentation accuracy. In contrast, although the CARD module has a limited impact on mIoU, it excels in improving overall classification accuracy (mAcc), highlighting its advantage in refining feature maps. The combination of the two modules consistently achieved optimal performance across different configurations, proving their synergistic effect in knowledge distillation tasks and further confirming their effectiveness in enhancing semantic segmentation results.
From this set of heatmaps, as shown in Figure 7, we can observe that the original image (1) provides the foundational surface features of the remote sensing image, including vegetation, water bodies, roads, and buildings. The heatmap generated by ResNet18 (2) shows the limitations of the network in capturing local and global features without introducing any modules. The highlighted areas (red regions) are relatively scattered and lack concentration, indicating insufficient attention to important regions and limited feature representation capabilities of the network. After introducing the SGAFD module (3), the highlighted areas in the heatmap become more focused and cover more key regions, reflecting that the SGAFD module significantly enhances the network’s feature representation ability by incorporating spatial and global attention mechanisms. It performs particularly well in capturing both global and local information.
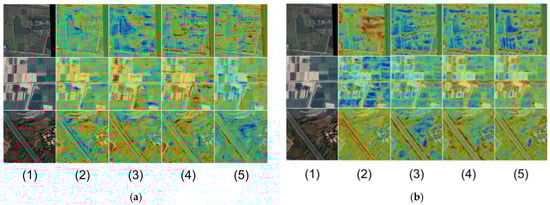
Figure 7.
Comparison using heatmaps under the Deeplabv3+ (a) and PSPNet (b) architecture: (1) original image, (2) student network, (3) SGAFD, (4) CARD, (5) ours.
The heatmap generated by introducing the CARD module alone (4) shows improvement over the original ResNet18 result, especially in more detailed extraction of local features. However, the overall improvement in the highlighted areas is not as pronounced as with the SGAFD module, suggesting that the CARD module primarily plays a role in refining feature maps and improving classification accuracy. When both the SGAFD and CARD modules are introduced together (5), the heatmap achieves the best performance, with the highlighted areas distributed more reasonably and concentrated.
The combination of SGAFD’s ability to capture global and local information and CARD’s enhancement of detailed features showcases the advantages of these two modules working in synergy. This significantly improves the network’s attention to important regions, further strengthening feature representation and performance.
4.3. Comparison of Segmentation Results
As shown in Figure 8, the experimental results using the DeepLabV3+ architecture demonstrate that the enhanced model significantly outperforms ResNet18 and ResNet50 in segmentation performance. The comparison shows that the enhanced model handles boundaries and captures details with greater accuracy, particularly in the second row of images where the segmentation of the green region is closer to the ground truth. This avoids the misclassification and omission issues observed in ResNet18, which occur due to its smaller network size, making it prone to classification errors and blurry boundaries in complex scenes. Moreover, the enhanced model’s performance approaches that of ResNet50, as it effectively learns and absorbs knowledge from the ResNet101 teacher model, exhibiting segmentation capabilities comparable to larger models, especially in the precise classification of complex objects.
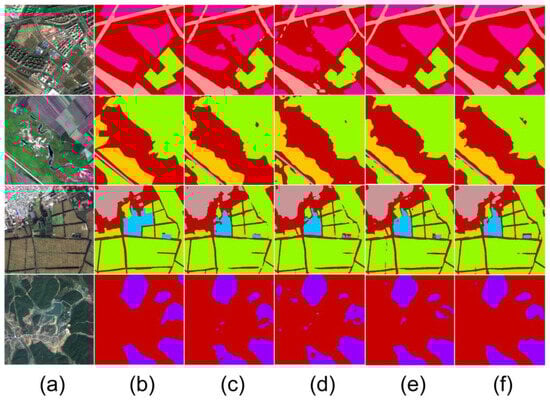
Figure 8.
Segmentation performance comparison under the Deeplabv3+ architecture: (a) remote sensing image, (b) ground truth, (c) our proposed method, (d) ResNet18, (e) ResNet50, (f) ResNet101.
As illustrated in Figure 9, within the PSPNet architecture, the enhanced model also demonstrates outstanding performance. Compared to ResNet18, the improved model’s segmentation results across multiple categories are much closer to the ground truth, particularly in the third row’s water body region, where the handling of category boundaries is almost identical to the ground truth. This clearly highlights the effectiveness of the SGAFD and CARD modules within this architecture. In contrast, ResNet18 still suffers from significant boundary blurring and misclassification in complex scenes. The improved model has also approached the performance of ResNet50 in several scenarios, further proving that the proposed knowledge distillation method can effectively enhance the segmentation performance of the student network in remote sensing imagery without increasing the model’s parameter count.
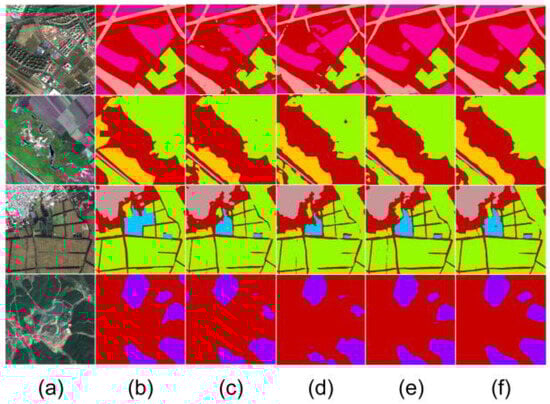
Figure 9.
Segmentation performance comparison under the PSPNet architecture: (a) remote sensing image, (b) ground truth, (c) our proposed method, (d) ResNet18, (e) ResNet50, (f) ResNet101.
4.4. Category-Wise Improvement Comparison
In the GID15 dataset, the improved network performed exceptionally well in several natural land use categories, as shown in Figure 10. For example, the mIoU for the “GP” (garden plot) and “SL” (shrub land) categories increased by 14.6% and 16.5%, respectively, demonstrating the superiority of our proposed method in handling complex natural scenes and multi-scale object recognition. Additionally, the mIoU for categories such as “TL” (traffic land) and “RR” (rural residential) increased by 10% and 9.6%, respectively, indicating that the SGAFD and CARD modules effectively enhance the network’s ability to distinguish between land use categories. Even for water-related targets such as “R” (river) and “L” (lake), although the improvement was relatively smaller, the enhanced network still exhibited stable performance gains in these categories.
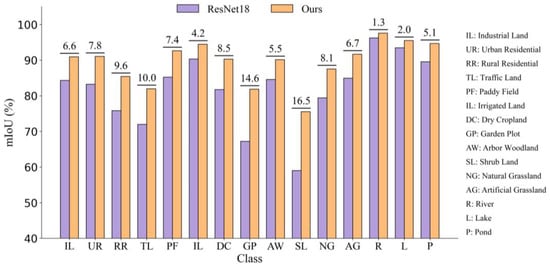
Figure 10.
Accuracy improvement across different categories in the GID15 dataset.
In the LoveDA dataset, as shown in Figure 11, the improved network performed particularly well in the “Forest” category, with a 3.8% increase in mIoU, demonstrating the method’s broad adaptability to complex natural scenes. Similarly, in artificial object categories such as “Road” and “Building,” the network achieved increases of 3.4% and 2.9%, respectively, indicating that the proposed modules also provide strong performance improvements in handling complex artificial scene recognition tasks. Although the improvement in the “Water” category was relatively smaller, at only 1.4%, it still outperformed the original ResNet18 network. These experimental results clearly show that the introduction of the SGAFD and CARD modules significantly improves the student network’s generalization ability across various scenes and categories, particularly in addressing complex land use classification tasks in remote sensing imagery, enhancing the network’s feature extraction capabilities and classification accuracy.
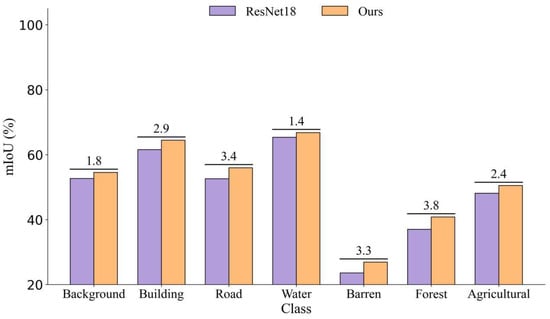
Figure 11.
Accuracy improvement across different categories in the LoveDA dataset.
5. Discussions
This study introduces the spatial-global attention feature distillation (SGAFD) module and the channel attention-based relational distillation (CARD) module, successfully addressing the bottlenecks in extracting complex spatial structures and channel features in remote sensing images. Compared to traditional knowledge distillation methods, the SGAFD and CARD modules not only significantly improve classification accuracy but also maintain the lightweight characteristics of the model, making it capable of efficient inference in resource-constrained environments. Experimental results show that the SGAFD module excels at capturing the interaction between global and local information, allowing the model to better handle land use types with high heterogeneity. Meanwhile, the CARD module models relationships between channels, enhancing the model’s ability to distinguish between different categories, thereby effectively improving classification accuracy in complex scenarios.
However, a limitation of this study is that the experiments were mainly focused on two datasets with fixed resolution and specific regions (such as LoveDA and GID15). Although these datasets demonstrate the superiority of the proposed modules under specific conditions, their limited resolution and geographic coverage may restrict the applicability of the experimental results. The LoveDA dataset has relatively high resolution but limited geographic coverage, while the GID15 dataset, although diverse in land use types, still has certain limitations in geographic coverage and spatial resolution. Therefore, while significant performance improvements were observed on these datasets, in practical applications, the resolution, spatial features, and land use data from different regions in remote sensing images may exhibit higher variability, which could affect the model’s generalization ability.
To validate the broad applicability of the proposed modules, future research could further evaluate the model’s generalization performance by conducting experiments on remote sensing datasets with varying spatial resolutions and diverse geographic regions. For instance, applying the model to low-resolution remote sensing datasets (such as satellite imagery) and high-resolution datasets (such as UAV or aerial imagery) could examine its performance across different scales. Additionally, the diversity of the datasets should include samples from different geographic areas (e.g., urban, rural, forest, and desert regions) to assess the model’s adaptability to various complex landscapes, climate conditions, and land use patterns.
In addition, the choice of the teacher model plays a crucial role in the knowledge distillation process, as its performance and complexity directly impact the learning outcome and final performance of the student model. The accuracy, capacity, and structural complexity of the teacher model all significantly affect the distillation effect on the student model. Future research should focus on more effective strategies for selecting and training teacher models, especially modern models such as transformers. As one of the most advanced models, transformers not only achieve remarkable accuracy but also have a structure that is fundamentally different from traditional CNNs. Their powerful modeling capabilities and advantages in handling complex pattern recognition tasks make them ideal candidates as teacher models. Therefore, exploring cross-architecture distillation (e.g., distillation between CNNs and transformers) offers new opportunities for improving student model performance, allowing it to leverage the strengths of different structural models, thus further enhancing the distillation effect and final classification accuracy.
Experimental results show that the network achieves classification accuracy close to that of the large model while using only about one-fifth of the parameter count, which is significant for applications on edge devices with limited hardware resources. Compared to the large model, the distilled lightweight model not only significantly improves inference speed but is also particularly suited for real-time monitoring scenarios based on drones. Considering the challenges of data transmission, performing feature extraction directly on the drone and generating smaller result datasets can greatly enhance system efficiency. This approach reduces the transmission burden compared to sending the data back for processing before feature extraction. Given the hardware constraints of drones, maintaining model compactness and high accuracy is crucial. Therefore, deploying the distilled lightweight model on drones ensures efficient operation while maintaining the precision and responsiveness required for real-time monitoring.
Overall, this study proposes a novel knowledge distillation approach, significantly improving the performance of remote sensing land use semantic segmentation through the SGAFD and CARD modules. However, further research is needed to validate and optimize these modules, particularly in broader remote sensing datasets and application scenarios (such as drone-based real-time monitoring), to ensure their generalization capability and practicality.
6. Conclusions
This study proposes two knowledge distillation-based modules for remote sensing land use monitoring and semantic segmentation: the spatial-global attention feature distillation (SGAFD) module and the channel attention-based relational distillation (CARD) module. The experimental results show that these modules not only improve classification accuracy but also maintain the lightweight characteristics of the model, making it better suited for large-scale land use monitoring tasks.
The SGAFD module enhances the model’s ability to capture the interaction between global and local spatial information, improving its monitoring capabilities in complex land use scenarios. Meanwhile, the CARD module models the relationships between channels, significantly boosting the model’s ability to distinguish between different categories, especially in land use environments with high heterogeneity.
Through experiments on the LoveDA and GID15 datasets, the proposed modules’ effectiveness and generalization ability across diverse land use types have been validated. These findings lay a solid foundation for future optimization and applications in large-scale remote sensing land use monitoring tasks.
Author Contributions
Conceptualization, Y.W., J.L., Y.C. and J.G.; methodology, Y.W. and Y.C.; software, Y.W. and Y.C.; validation, Y.C. and J.G.; formal analysis, Y.W., J.L., Y.C. and J.G.; investigation, Y.W., J.L., Y.C. and J.G.; resources, Y.W., J.L. and J.G.; data curation, Y.W., J.L., Y.C. and J.G.; writing—original draft preparation, Y.W. and J.G.; writing—review and editing, Y.C.; visualization, Y.W., J.L. and J.G.; supervision, Y.C.; project administration, Y.C. and J.G.; funding acquisition, J.G. All authors have read and agreed to the published version of the manuscript.
Funding
This research was funded by National Natural Science Foundation of China (No. 42071123), Spatiotemporal Differentiation and Optimization of Land Ecosystem Service Trade-offs in the Guangdong-Hong Kong-Macao Greater Bay Area.
Data Availability Statement
Dataset available on request from the authors.
Conflicts of Interest
The authors declare no conflicts of interest.
References
- Navalgund, R.R.; Jayaraman, V.; Roy, P.S. Remote Sensing Applications: An Overview. Curr. Sci. 2007, 93, 1747–1766. [Google Scholar]
- Sishodia, R.P.; Ray, R.L.; Singh, S.K. Applications of Remote Sensing in Precision Agriculture: A Review. Remote Sens. 2020, 12, 3136. [Google Scholar] [CrossRef]
- Pham, H.M.; Yamaguchi, Y.; Bui, T.Q. A Case Study on the Relation between City Planning and Urban Growth Using Remote Sensing and Spatial Metrics. Landsc. Urban Plan. 2011, 100, 223–230. [Google Scholar] [CrossRef]
- Kerr, J.T.; Ostrovsky, M. From Space to Species: Ecological Applications for Remote Sensing. Trends Ecol. Evol. 2003, 18, 299–305. [Google Scholar] [CrossRef]
- Campbell, J.B.; Wynne, R.H. Introduction to Remote Sensing; The Guilford Press: New York, NY, USA, 2011. [Google Scholar]
- Zhu, X.X.; Tuia, D.; Mou, L.; Xia, G.-S.; Zhang, L.; Xu, F.; Fraundorfer, F. Deep Learning in Remote Sensing: A Comprehensive Review and List of Resources. IEEE Geosci. Remote Sens. Mag. 2017, 5, 8–36. [Google Scholar] [CrossRef]
- O’Shea, K. An Introduction to Convolutional Neural Networks. arXiv 2015, arXiv:1511.08458. [Google Scholar]
- Hao, S.; Zhou, Y.; Guo, Y. A Brief Survey on Semantic Segmentation with Deep Learning. Neurocomputing 2020, 406, 302–321. [Google Scholar] [CrossRef]
- Zhang, J.; Hu, J. Image Segmentation Based on 2D Otsu Method with Histogram Analysis. In Proceedings of the 2008 International Conference on Computer Science and Software Engineering, Wuhan, China, 12–14 December 2008; Volume 6, pp. 105–108. [Google Scholar]
- Adams, R.; Bischof, L. Seeded Region Growing. IEEE Trans. Pattern Anal. Mach. Intell. 1994, 16, 641–647. [Google Scholar] [CrossRef]
- Ronneberger, O.; Fischer, P.; Brox, T. U-Net: Convolutional Networks for Biomedical Image Segmentation. In Proceedings of the Medical Image Computing and Computer-Assisted Intervention–MICCAI 2015: 18th International Conference, Munich, Germany, 5–9 October 2015; pp. 234–241. [Google Scholar]
- Lecun, Y.; Bottou, L.; Bengio, Y.; Haffner, P. Gradient-Based Learning Applied to Document Recognition. Proc. IEEE 1998, 86, 2278–2324. [Google Scholar] [CrossRef]
- Krizhevsky, A.; Sutskever, I.; Hinton, G.E. Imagenet Classification with Deep Convolutional Neural Networks. Adv. Neural Inf. Process. Syst. 2012, 60, 84–90. [Google Scholar] [CrossRef]
- Simonyan, K.; Zisserman, A. Very Deep Convolutional Networks for Large-Scale Image Recognition. arXiv 2014, arXiv:1409.1556. [Google Scholar]
- Szegedy, C.; Liu, W.; Jia, Y.; Sermanet, P.; Reed, S.; Anguelov, D.; Erhan, D.; Vanhoucke, V.; Rabinovich, A. Going Deeper with Convolutions. In Proceedings of the 2015 IEEE Conference on Computer Vision and Pattern Recognition (CVPR), Boston, MA, USA, 7–12 June 2015; pp. 1–9. [Google Scholar]
- He, K.; Zhang, X.; Ren, S.; Sun, J. Deep Residual Learning for Image Recognition. In Proceedings of the 2016 IEEE Conference on Computer Vision and Pattern Recognition (CVPR), Las Vegas, NV, USA, 27–30 June 2016; pp. 770–778. [Google Scholar]
- Long, J.; Shelhamer, E.; Darrell, T. Fully Convolutional Networks for Semantic Segmentation. In Proceedings of the IEEE Conference on Computer Vision and Pattern Recognition, Boston, MA, USA, 7–12 June 2015; pp. 3431–3440. [Google Scholar]
- Zhou, Z.; Rahman Siddiquee, M.M.; Tajbakhsh, N.; Liang, J. Unet++: A Nested u-Net Architecture for Medical Image Segmentation. In Deep Learning in Medical Image Analysis and Multimodal Learning for Clinical Decision Support: Proceedings of the 4th International Workshop, DLMIA 2018, and 8th International Workshop, ML-CDS 2018, Held in Conjunction with MICCAI 2018, Granada, Spain, 20 September 2018; Proceedings 4; Springer: Berlin/Heidelberg, Germany, 2018; pp. 3–11. [Google Scholar]
- Feng, D.; Haase-Schütz, C.; Rosenbaum, L.; Hertlein, H.; Glaeser, C.; Timm, F.; Wiesbeck, W.; Dietmayer, K. Deep Multi-Modal Object Detection and Semantic Segmentation for Autonomous Driving: Datasets, Methods, and Challenges. IEEE Trans. Intell. Transp. Syst. 2020, 22, 1341–1360. [Google Scholar] [CrossRef]
- Nogueira, K.; Dalla Mura, M.; Chanussot, J.; Schwartz, W.R.; Dos Santos, J.A. Dynamic Multicontext Segmentation of Remote Sensing Images Based on Convolutional Networks. IEEE Trans. Geosci. Remote Sens. 2019, 57, 7503–7520. [Google Scholar] [CrossRef]
- Vaswani, A.; Shazeer, N.; Parmar, N.; Uszkoreit, J.; Jones, L.; Gomez, A.N.; Kaiser, L.; Polosukhin, I. Attention Is All You Need. Adv. Neural Inf. Process. Syst. 2017, 30, 6000–6010. [Google Scholar]
- Dosovitskiy, A. An Image Is Worth 16x16 Words: Transformers for Image Recognition at Scale. arXiv 2020, arXiv:2010.11929. [Google Scholar]
- Liu, Z.; Lin, Y.; Cao, Y.; Hu, H.; Wei, Y.; Zhang, Z.; Lin, S.; Guo, B. Swin Transformer: Hierarchical Vision Transformer Using Shifted Windows. In Proceedings of the IEEE/CVF International Conference on Computer Vision, Montreal, QC, Canada, 10–17 October 2021; pp. 10012–10022. [Google Scholar]
- Sdraka, M.; Papoutsis, I.; Psomas, B.; Vlachos, K.; Ioannidis, K.; Karantzalos, K.; Gialampoukidis, I.; Vrochidis, S. Deep Learning for Downscaling Remote Sensing Images: Fusion and Super-Resolution. IEEE Geosci. Remote Sens. Mag. 2022, 10, 202–255. [Google Scholar] [CrossRef]
- He, T.; Wang, S. Multi-Spectral Remote Sensing Land-Cover Classification Based on Deep Learning Methods. J. Supercomput. 2021, 77, 2829–2843. [Google Scholar] [CrossRef]
- Kemker, R.; Salvaggio, C.; Kanan, C. Algorithms for Semantic Segmentation of Multispectral Remote Sensing Imagery Using Deep Learning. ISPRS J. Photogramm. Remote Sens. 2018, 145, 60–77. [Google Scholar] [CrossRef]
- Man, Q.; Dong, P.; Guo, H. Pixel-and Feature-Level Fusion of Hyperspectral and Lidar Data for Urban Land-Use Classification. Int. J. Remote Sens. 2015, 36, 1618–1644. [Google Scholar] [CrossRef]
- Sun, X.; Liu, L.; Li, C.; Yin, J.; Zhao, J.; Si, W. Classification for Remote Sensing Data with Improved CNN-SVM Method. IEEE Access 2019, 7, 164507–164516. [Google Scholar] [CrossRef]
- Li, T.; Li, J.; Liu, Z.; Zhang, C. Few Sample Knowledge Distillation for Efficient Network Compression. In Proceedings of the IEEE/CVF Conference on Computer Vision and Pattern Recognition, Seattle, WA, USA, 13–19 June 2020; pp. 14639–14647. [Google Scholar]
- Han, S.; Mao, H.; Dally, W.J. Deep Compression: Compressing Deep Neural Networks with Pruning, Trained Quantization and Huffman Coding. arXiv 2015, arXiv:1510.00149. [Google Scholar]
- Jacob, B.; Kligys, S.; Chen, B.; Zhu, M.; Tang, M.; Howard, A.; Adam, H.; Kalenichenko, D. Quantization and Training of Neural Networks for Efficient Integer-Arithmetic-Only Inference. In Proceedings of the IEEE Computer Vision and Pattern Recognition, Salt Lake City, UT, USA, 18–23 June 2018; pp. 2704–2713. [Google Scholar]
- Han, S.; Pool, J.; Tran, J.; Dally, W.J. Learning Both Weights and Connections for Efficient Neural Network. Adv. Neural Inf. Process. Syst. 2015, 28, 1135–1143. [Google Scholar]
- Kolda, T.G.; Bader, B.W. Tensor Decompositions and Applications. SIAM Rev. 2009, 51, 455–500. [Google Scholar] [CrossRef]
- Hinton, G. Distilling the Knowledge in a Neural Network. arXiv 2015, arXiv:1503.0253. [Google Scholar]
- Romero, A.; Ballas, N.; Kahou, S.E.; Chassang, A.; Gatta, C.; Bengio, Y. Fitnets: Hints for Thin Deep Nets. arXiv 2014, arXiv:1412.6550. [Google Scholar]
- Zagoruyko, S.; Komodakis, N. Paying More Attention to Attention: Improving the Performance of Convolutional Neural Networks via Attention Transfer. arXiv 2016, arXiv:1612.03928. [Google Scholar]
- Park, W.; Kim, D.; Lu, Y.; Cho, M. Relational Knowledge Distillation. In Proceedings of the IEEE/CVF Conference on Computer Vision and Pattern Recognition, Long Beach, CA, USA, 15–20 June 2019; pp. 3967–3976. [Google Scholar]
- Yim, J.; Joo, D.; Bae, J.; Kim, J. A Gift from Knowledge Distillation: Fast Optimization, Network Minimization and Transfer Learning. In Proceedings of the IEEE Conference on Computer Vision and Pattern Recognition, Honolulu, HI, USA, 21–26 July 2017; pp. 4133–4141. [Google Scholar]
- Liu, Y.; Cao, J.; Li, B.; Yuan, C.; Hu, W.; Li, Y.; Duan, Y. Knowledge Distillation via Instance Relationship Graph. In Proceedings of the IEEE/CVF Conference on Computer Vision and Pattern Recognition, Long Beach, CA, USA, 15–20 June 2019; pp. 7096–7104. [Google Scholar]
- Xu, X.; Zou, Q.; Lin, X.; Huang, Y.; Tian, Y. Integral Knowledge Distillation for Multi-Person Pose Estimation. IEEE Signal Process. Lett. 2020, 27, 436–440. [Google Scholar] [CrossRef]
- Gou, J.; Yu, B.; Maybank, S.J.; Tao, D. Knowledge Distillation: A Survey. Int. J. Comput. Vis. 2021, 129, 1789–1819. [Google Scholar] [CrossRef]
- Liu, Y.; Chen, K.; Liu, C.; Qin, Z.; Luo, Z.; Wang, J. Structured Knowledge Distillation for Semantic Segmentation. In Proceedings of the IEEE/CVF Conference on Computer Vision and Pattern Recognition, Long Beach, CA, USA, 15–20 June 2019; pp. 2604–2613. [Google Scholar]
- Lillesand, T.; Kiefer, R.W.; Chipman, J. Remote Sensing and Image Interpretation; John Wiley & Sons: Hoboken, NJ, USA, 2015. [Google Scholar]
- Qin, D.; Bu, J.-J.; Liu, Z.; Shen, X.; Zhou, S.; Gu, J.-J.; Wang, Z.-H.; Wu, L.; Dai, H.-F. Efficient Medical Image Segmentation Based on Knowledge Distillation. IEEE Trans. Med. Imaging 2021, 40, 3820–3831. [Google Scholar] [CrossRef]
- Yang, C.; Zhou, H.; An, Z.; Jiang, X.; Xu, Y.; Zhang, Q. Cross-Image Relational Knowledge Distillation for Semantic Segmentation. In Proceedings of the IEEE/CVF Conference on Computer Vision and Pattern Recognition, New Orleans, LA, USA, 18–24 June 2022; pp. 12319–12328. [Google Scholar]
- Zhou, W.; Fan, X.; Yan, W.; Shan, S.; Jiang, Q.; Hwang, J.-N. Graph Attention Guidance Network with Knowledge Distillation for Semantic Segmentation of Remote Sensing Images. IEEE Trans. Geosci. Remote Sens. 2023, 61, 4506015. [Google Scholar] [CrossRef]
- Shu, C.; Liu, Y.; Gao, J.; Yan, Z.; Shen, C. Channel-Wise Knowledge Distillation for Dense Prediction. In Proceedings of the IEEE/CVF International Conference on Computer Vision, Montreal, QC, Canada, 10–17 October 2021; pp. 5311–5320. [Google Scholar]
- Tong, X.-Y.; Xia, G.-S.; Lu, Q.; Shen, H.; Li, S.; You, S.; Zhang, L. Land-Cover Classification with High-Resolution Remote Sensing Images Using Transferable Deep Models. Remote Sens. Environ. 2020, 237, 111322. [Google Scholar] [CrossRef]
- Wang, J.; Zheng, Z.; Ma, A.; Lu, X.; Zhong, Y. LoveDA: A Remote Sensing Land-Cover Dataset for Domain Adaptive Semantic Segmentation. arXiv 2021, arXiv:2110.08733. [Google Scholar]
- Chen, L.-C.; Zhu, Y.; Papandreou, G.; Schroff, F.; Adam, H. Encoder-Decoder with Atrous Separable Convolution for Semantic Image Segmentation. In Proceedings of the European Conference on Computer Vision (ECCV), Munich, Germany, 8–14 September 2018; pp. 801–818. [Google Scholar]
- Zhao, H.; Shi, J.; Qi, X.; Wang, X.; Jia, J. Pyramid Scene Parsing Network. In Proceedings of the IEEE Conference on Computer Vision and Pattern Recognition, Honolulu, HI, USA, 21–26 July 2017; pp. 2881–2890. [Google Scholar]
- Robbins, H.; Monro, S. A Stochastic Approximation Method. Ann. Math. Stat. 1951, 22, 400–407. [Google Scholar] [CrossRef]
- Loshchilov, I.; Hutter, F. Sgdr: Stochastic Gradient Descent with Warm Restarts. arXiv 2016, arXiv:1608.03983. [Google Scholar]
- Badrinarayanan, V.; Kendall, A.; Cipolla, R. Segnet: A Deep Convolutional Encoder-Decoder Architecture for Image Segmentation. IEEE Trans. Pattern Anal. Mach. Intell. 2017, 39, 2481–2495. [Google Scholar] [CrossRef]
- Redmon, J. You Only Look Once: Unified, Real-Time Object Detection. In Proceedings of the IEEE Conference on Computer Vision and Pattern Recognition, Las Vegas, NV, USA, 27–30 June 2016. [Google Scholar]
Disclaimer/Publisher’s Note: The statements, opinions and data contained in all publications are solely those of the individual author(s) and contributor(s) and not of MDPI and/or the editor(s). MDPI and/or the editor(s) disclaim responsibility for any injury to people or property resulting from any ideas, methods, instructions or products referred to in the content. |
© 2025 by the authors. Licensee MDPI, Basel, Switzerland. This article is an open access article distributed under the terms and conditions of the Creative Commons Attribution (CC BY) license (https://creativecommons.org/licenses/by/4.0/).