Abstract
The three-dimensional (3D) reconstruction of the hepatic duct tree is significant for the minimally invasive surgery of hepatobiliary stone disease, which can be influenced by the quantity of the CT scans of hepatic ducts. If insufficient CT scans with low inter-slice resolution are directly utilized for 3D reconstruction, discontinuities and gaps will emerge in the reconstructed hepatic duct tree. In this paper, a novel end-to-end deep learning framework is designed for the inter-slice super-resolution segmentation of the CT slices of hepatic ducts, which can improve the 3D reconstruction performance in the inter-slice dimension. Specifically, the framework cascades into an inter-slice super-resolution subnetwork and a segmentation subnetwork. A deep learning network is introduced as the inter-slice super-resolution subnetwork to generate an intermediate slice between two adjacent CT slices in the simulated CT scans with low inter-slice resolution. To capture the spatiotemporal correlation existing in the CT scans of hepatic ducts, the ConvLSTM is introduced into the U-Net-like segmentation subnetwork in the high-dimensional feature space. To further suppress the problems of discontinuities and gaps, a structure-aware loss function is proposed by incorporating the structural similarity index measure (SSIM) as a regulator to dynamically assign the contribution of the generated CT slice to the total loss of the designed framework. Experimental results demonstrate that our proposed framework performs better segmentations for hepatic ducts than several existing deep learning networks with the performance of 0.7690 DICE and a 0.7712 F1-score, which is beneficial for the 3D reconstruction of the hepatic duct tree.
1. Introduction
In recent years, the incidence of hepatobiliary stone disease has been rising annually in countries and regions worldwide, which is becoming one of the common liver diseases. This disease can cause recurrent infections that may trigger localized hepatic atrophy, thereby elevating the risk of intrahepatic cholangiocarcinoma [1,2]. A mainstream therapeutic approach [3,4,5], namely Percutaneous Transhepatic Cholangioscopy (PTCS) [5], has been clinically employed to investigate and extract stones from the hepatic ducts within the liver, which is a minimally invasive surgery. Compared with conventional hepatectomy, this type of surgery has the advantages of fewer sessions of anesthesia, less trauma to the patient, and a shorter postoperative hospital stay [5].
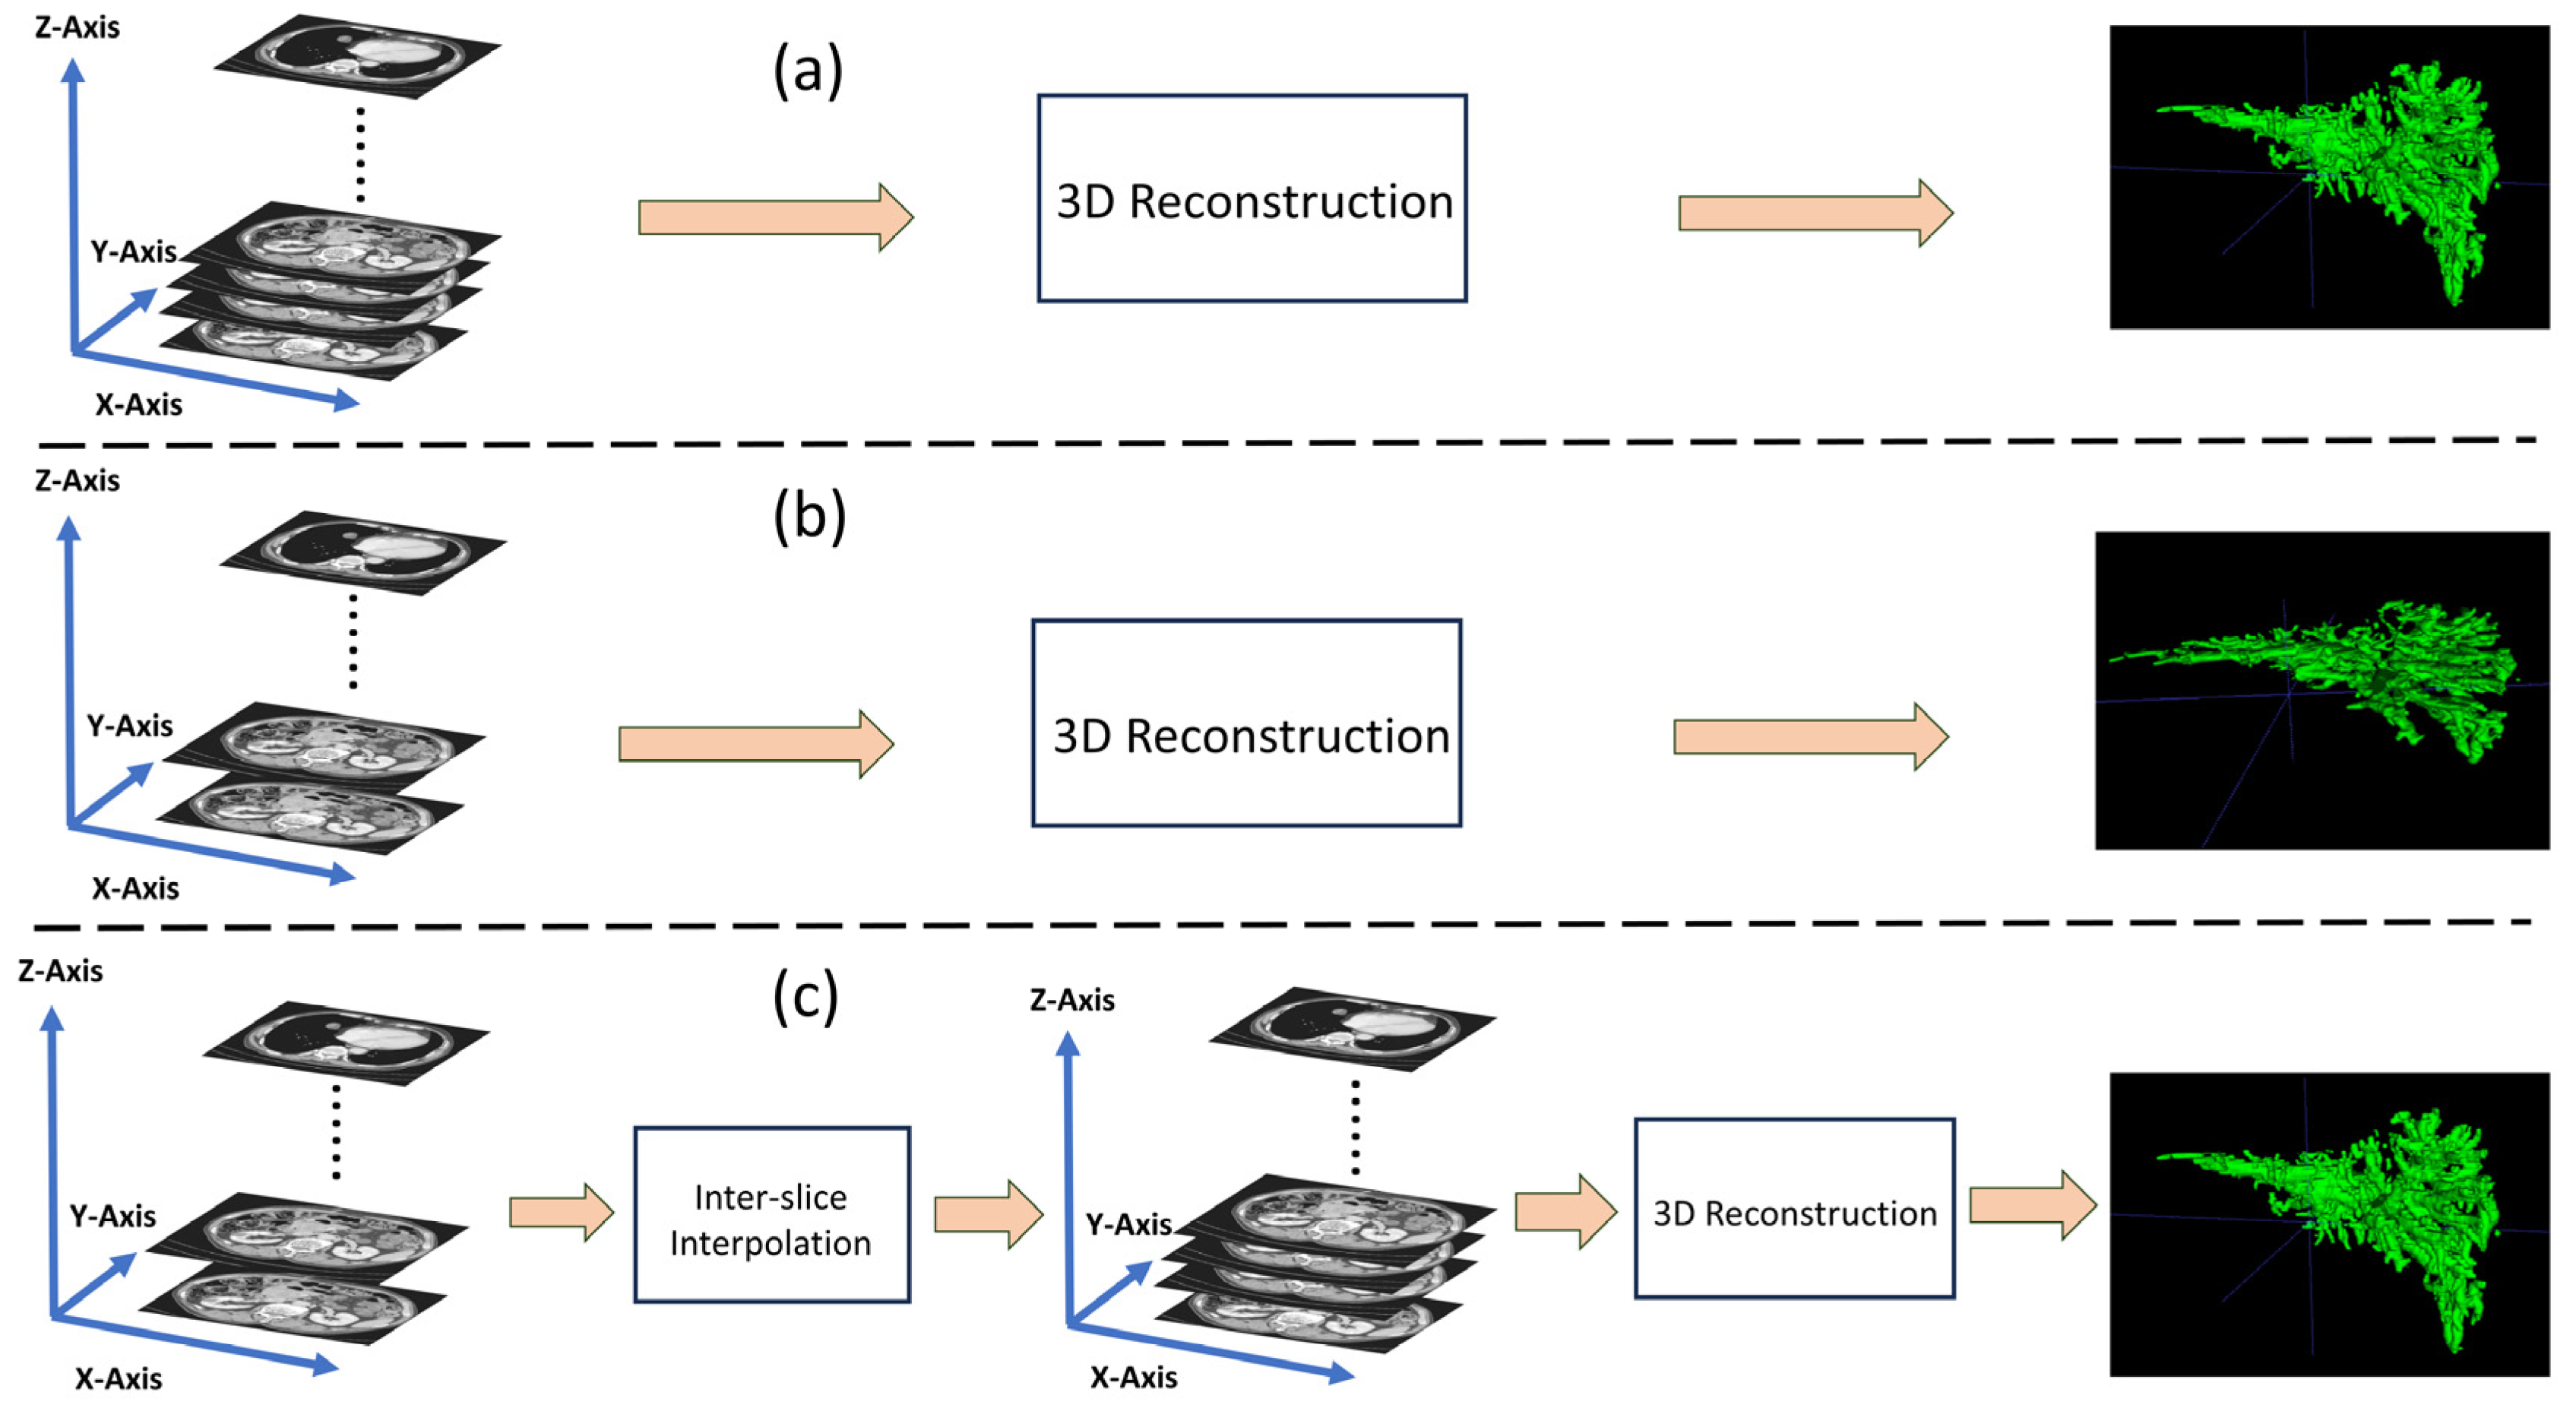
Before the surgery of PTCS, the surgeons can utilize the medical imaging techniques to determine the spatial structure of the hepatic duct tree and further localize the hepatobiliary stone in the hepatic duct tree, involving computed tomography (CT) techniques [6,7,8,9] and three-dimensional (3D) reconstruction techniques. The 3D reconstruction techniques can assist the surgeons in obtaining comprehensive preoperative diagnostic information and efficiently refining the pathway for cholangioscopic stone extraction during the surgery [10]. The CT techniques are utilized to acquire image sequences covering the patient’s liver, surrounding blood vessels, and other bodily tissues by using X-ray, which can be subsequently employed to reconstruct the 3D model of the affected tissues [11,12]. Generally, as the dose of X-ray increases, the quality of the images acquired by CT improves, which is beneficial for the fidelity of 3D reconstruction [13]. However, prolonged exposure to such high doses of X-ray can cause irreversible harm to the human body. One direct way to mitigate this issue is to enhance the performance of the equipment to accelerate the CT scanning speed. Another way is to reduce the frequency (or time) of CT scanning, which can easily lead to low inter-slice resolution for the acquired CT scans [14]. That is, the CT scans with low inter-slice resolution involve less slices than those with high inter-slice resolution. Thanks to the development of CT technology, modern CT devices are equipped with various inter-slice interpolation methods to increase the quantity of CT slices for the improvement of 3D reconstruction quality. Inter-slice interpolation can be considered a form of specialized super-resolution reconstruction, performed in the inter-slice dimension (z-axis) rather than in the intra-slice dimension (xy-axis). For clear explanations, Figure 1 illustrates the 3D reconstructed examples for the CT devices with high inter-slice resolution and with low inter-slice resolution. As indicated in Figure 1, after the CT scan acquired by the CT device with low inter-slice resolution is inter-slice interpolated, its corresponding reconstructed hepatic duct tree has a similar high quality to that reconstructed by the CT device with high inter-slice resolution. This illustration demonstrates that inter-slice interpolation allows even normal CT devices to compensate to some extent for the low inter-slice resolution in the generated CT scans, which is also an economical solution for many regional hospitals. Commonly, most normal CT devices integrate traditional inter-slice interpolation methods, such as linear interpolation [15] and spline interpolation [16], which can be further improved for high-resolution 3D reconstruction.

Figure 1.
Three-dimensional reconstruction of the hepatic duct tree. (a) Directly via the CT scans with high inter-slice resolution. (b) Directly via the CT scans with low inter-slice resolution. (c) Via the inter-slice interpolated CT scans, which are originally in low inter-slice resolution.
Due to its strong feature extraction and generalization capability, deep learning has been successfully employed in the field of medical image segmentation, which is beneficial for high-quality 3D construction. However, most deep learning models for segmentation still face the problem of discontinuities and gaps [17,18] when they are directly utilized to subsequently reconstruct 3D medical images by insufficient CT scans with low inter-slice resolution. To deal with this problem, some studies attempt to employ inter-slice interpolation to increase the number of CT scans, which is followed by segmentation [19]. This type of two-stage methods will bring two issues. One is that it does not fully consider the inter-slice relationship between the synthesized slices and the adjacent slices during segmentation, which may result in the undesirable discontinuities and gaps in the reconstructed 3D images [20]. Second, simply overlaying these two methods without a mechanism for interaction between them can result in an inherent problem, which is that accumulative errors from the two stages will notably degrade the segmentation of the tissues and further influence the 3D reconstruction, especially of the hepatic ducts with complex and tenuous shapes.
To address these limitations of the aforementioned two-stage methods, we designed a one-stage inter-slice super-resolution segmentation deep learning framework to segment the CT scans of hepatic ducts, cascading an inter-slice super-resolution subnetwork for inter-slice interpolation and a segmentation subnetwork for CT scan segmentation. It is noted that the two subnetworks are jointly trained in an end-to-end mode. Due to it being composed of two U-Net-like networks, it is termed a W-shaped Net for simplicity. To capture the correlations of adjacent slices, the ConvLSTM [21] is introduced into the decoder of the U-Net-like segmentation subnetwork. To build the connection between two subnetworks and suppress the potential accumulative errors, a novel structure-aware loss function is proposed to jointly optimize the inter-slice super-resolution subnetwork and the segmentation subnetwork.
In summary, our study has several main contributions, described as follows.
- (1)
- To deal with the problems of discontinuities and gaps that arise from the segmentation of insufficient CT scans acquired by CT equipment with low inter-slice resolution, a one-stage deep learning framework is designed to jointly integrate an inter-slice super-resolution subnetwork for inter-slice interpolation and a segmentation subnetwork for CT scan segmentation.
- (2)
- Since the spatiotemporal correlation exists in the CT scans of hepatic ducts, a U-Net-like segmentation subnetwork is designed by introducing a ConvLSTM to mine this spatiotemporal correlation in the high-dimensional feature space, which can alleviate the problems of discontinuities and even the wrong assignments of two segments of the same hepatic duct in two adjacent CT slices.
- (3)
- Subtle differences between the generated CT slices and the real ones will result in the discontinuities emerging between the segmented hepatic ducts in the generated CT slice and those in the two adjacent ones. To this end, a novel structure-aware loss function is proposed to jointly constrain the two subnetworks, in which the structural similarity index measure (SSIM) is incorporated as a regulator to dynamically assign the contribution of the generated CT slice to the total loss of the proposed framework.
2. Related Work
2.1. Deep Learning-Based Inter-Slice Interpolation for Medical Images
Recently, deep learning has been employed for inter-slice interpolation to generate some slices in the medical image sequences for subsequent processing, which mainly rely on optical flow techniques.
Wu et al. [19] designed an intermediate slice synthesis deep model for CT inter-slice augmentation, consisting of an optical flow estimation module based on the U-Net architecture and a global–local dual discriminator based on attention mechanisms. Guo et al. [22] designed a spatiotemporal volumetric interpolation network (SVIN) for 4D dynamic medical images (including 4D CT and 4D flow MRI), comprising a motion network for the construction of a spatiotemporal motion field and an interpolation network with a regression-based module for sequence volumetric interpolation.
Although these optical-flow-based deep learning methods can augment the medical slices by interpolating some slices between the adjacent slices and achieve good interpolation results, they heavily rely on optical flow estimation and pixel-level warping processing, resulting in substantially computational costs and memory usage. In this study, we introduce the Speconv [23], a flow-free deep convolutional network, as our inter-slice super-resolution subnetwork.
2.2. Deep Learning-Based Image Segmentation for Tubular Tissues in the Livers
Due to its superior capability of feature extraction and flexible network structure, U-Net and its variants have been widely employed for medical image segmentation [24]. Also, some studies have employed U-Net-like networks to segment the tubular tissues in the liver, such as hepatic vessels and hepatic ducts, from the medical images.
Huang et al. [25] employed a 3D U-Net for hepatic vessel segmentation in which a loss function with a variant of the DICE was proposed to address the pixel imbalance between the hepatic vessels and the background. Yan et al. [26] designed a novel 3D U-Net for hepatic vessel segmentation, which incorporated several attention-guided concatenation modules between the encoder and decoder to extract contextual information from lower-dimensional features guided by higher-dimensional features. Li et al. [27] integrated a graph connectivity constraint module into a lightweight 3D U-Net for hepatic vessel segmentation. Zhou et al. [28] proposed a sequence-based context-aware association network for hepatic vessel segmentation, integrating a slice-level attention module and a graph association module into the U-Net architecture.
Compared with the segmentation of hepatic vessels, the segmentation of hepatic ducts has several challenging issues, such as lower contrasts and sparser distributions. Thus, only a few studies focus on the segmentation of hepatic ducts. Fu et al. [29] proposed an end-to-end fully convolutional network for the segmentation of hepatic ducts, which integrated multi-scale dilated convolutions to extract abundant semantic features and various scale contextual information. To well constrain the designed network, they proposed a novel loss function by combining the online bootstrapped method and cross entropy.
Although these deep learning methods can segment the tubular tissues from the liver images, the discontinuities and gaps will emerge in the constructed 3D tissue image if they are directly utilized to segment insufficient CT scans with low inter-slice resolution.
3. Materials
The abdominal CT slices in this study were provided by the Department of Hepatobiliary Surgery at the First Affiliated Hospital of Guangzhou Medical University, which were acquired by a 256-row spiral CT equipment with the spatial resolution of 512 × 512 and the pixel spacing ranging between 0.56 mm and 0.74 mm. The thicknesses of the acquired CT slices ranged between 0.625 mm and 2.500 mm, which differ from those of ordinary spiral CT slices ranging between 2.5 mm and 5 mm. These acquired CT slices are considered as the ground truths with high inter-slice resolution. In this study, due to the limitations such as CT equipment and scanning time, we are unable to acquire CT slices with lower inter-slice resolution. Even though we have the slices with low inter-slice resolution, we could not evaluate whether the inter-slice interpolated slices have high qualities for 3D reconstruction, due to no real ones with high inter-slice resolution. Hence, we extracted the CT slices at intervals from the ground truths to simulate the CT scans with low inter-slice resolution. For example, assume that the CT scans have a total of 100 CT slices {1, 2, 3, 4, 5, …, 100}, then slice sampling with intervals can simulate the generation of the CT scans with low inter-slice resolution, i.e., the CT slices {1, 3, 5, …, 99}. Then, our motivation is to restore the filtered-out 50 CT slices {2, 4, 6, …, 100}, along with the CT slices {1, 3, 5, …, 99}, for the subsequent 3D reconstruction of the hepatic duct tree.
In this study, a total of 24 patients were recruited, and each patient’s CT data comprised approximately 100 to 200 high inter-slice resolution CT slices available for the inter-slice super-resolution segmentation of hepatic ducts. A total of 2522 CT slices with high inter-slice resolution were acquired for these cases, which were randomly divided into a training set with 1913 CT slices and a test set with 609 CT slices. All patient data collected for research purposes were obtained with informed consent, but due to confidentiality agreements, this dataset is currently not available for public access. Experienced hepatobiliary surgeons utilized the ITKSNAP [30] to perform the ground truth segmentation of hepatic ducts.
All the experiments in this paper were conducted on a desktop computer equipped with an NVIDIA GTX 3090 24G GPU and Ubuntu 20.04 Linux operating system. The code was implemented by using Pytorch v1.6. The proposed W-shaped Net was trained by the Adam optimizer with a batch size of 4, a learning rate of 0.001, and exponential decay rates (beta 1 and beta 2) with 0.9 and 0.999, respectively. The training process was conducted over 200 epochs. Here, several commonly used metrics were utilized to assess different networks for the segmentation of hepatic ducts, involving the dice similarity coefficient (DICE), sensitivity, specificity, and F1-score.
4. Methods
4.1. The Architecture of the W-Shaped Net
As illustrated in Figure 2, the designed W-shaped Net is composed of two cascading U-Net-like subnetworks, which are an inter-slice super-resolution subnetwork and a segmentation subnetwork, respectively. The former subnetwork consists of an encoder–decoder structure and a separable kernel estimation (SKE) module. Specifically, the encoder/decoder involves five downsampling blocks with a 2 × 2 AveragePooling layer and a 3 × 3 convolutional block (ConvB), and four upsampling blocks with a bilinear upsampling block (BUB) and a 3 × 3 ConvBs, respectively. The SKE involves four parallel blocks successively with a 3 × 3 ConvB, a bilinear upsampling layer (BUL) and a 3 × 3 convolutional layer (ConvL), which is utilized to produce the generated slices (or intermediate slices) between the adjacent abdominal CT slices. It is noted that the 3 × 3 ConvBs utilized in the encoder, decoder, and the SKE have the same network structure with three 3 × 3 ConvL-ReLU layers. The BUB involves BUL-3 × 3 ConvL-ReLU blocks. The segmentation subnetwork includes a CNN backbone with four residual blocks, a transformer block with 12 transformer layers, two high-dimensional ConvLSTM-3 × 3 ConvL-ReLU-batch normalization (BN) blocks, and three BUL-3 × 3 ConvL-ReLU-BN blocks. Two adjacent CT slices are input into the W-shaped Net to finally achieve three segmented CT slices with hepatic ducts.
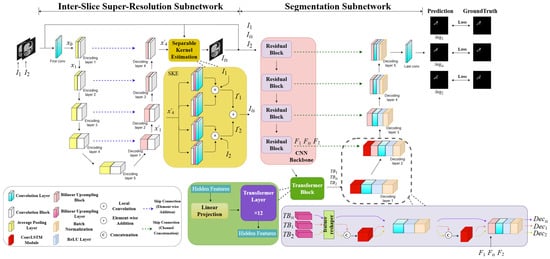
Figure 2.
The architecture of the W-shaped Net.
4.2. Inter-Slice Super-Resolution Subnetwork
Our network configuration of an inter-slice super-resolution subnetwork is shown in Table 1. Since the flow-free network in [23] has the advantages of relatively small memory demand, high computational efficiency, and good interpolation performance, it is introduced into our proposed W-shaped Net as the inter-slice super-resolution subnetwork.

Table 1.
The network configuration of our inter-slice super-resolution subnetwork.
As illustrated in Figure 2, assume the two adjacent slices as ; they are initially concatenated along the channel dimension and subsequently pass through the encoder for downsampling to the high-dimensional feature maps with the size of . Thus, the low-dimensional features can primarily capture the contours, grayscale, and shapes of hepatic ducts in the slices, while the high-dimensional features can primarily represent the global semantic information of various tissues. This encoding can be formulated as
where and represent the operations of 3 × 3 ConvB and AveragePooling (AP), respectively. represents the 3 × 3 convolution operation. and denote the input features of the encoder and the output feature maps of the i-th layer in the encoder.
During the decoding process, the feature maps from each lower layer undergo the upsampling operation, followed by a residual addition with the corresponding outputs of the encoding layer. Next, they pass through the 3 × 3 convolution operation. The decoding can be formulated as
where and represent the operations of an element-wise addition and a bilinear upsampling block, respectively. denotes the output feature maps of the j-th layer in the decoder. Subsequently, the extract feature maps from the decoder are inputted into the SKE module to generate an intermediate slice. Specifically, the SKE module is designed as a fully convolutional module for convolution-based interpolation. It has four 1D kernel operations, each pair of which is used to extract vertical and horizontal information from the feature maps from the decoder. Then, two types of paired information are correspondingly convolved with and to compute the colors of the pixels of the paired feature maps. The mechanism of the SKE, which approximates as a 2D kernel by estimating a pair of 1D kernels, can reduce the number of kernel parameters and accelerate the training speed, ultimately improving the visual quality of the generated slice. Finally, the paired feature maps are element-wise added to obtain the generated slice. The process of the SKE module can be formulated as
where and represent the local convolution operation and bilinear upsampling operation. and denote the convolution operation for vertical feature information and for horizontal feature information, respectively. denotes the generated slice between the adjacent abdominal CT slices generated by the inter-slice super-resolution subnetwork.
4.3. Segmentation Subnetwork
Our network configuration of the segmentation subnetwork is shown in Table 2. We designed a segmentation subnetwork with the similar network architecture in [31]. Different from the network in [31] for single-image segmentation, our subnetwork is to deal with the CT scans, which can focus on the correlation among the two adjacent CT slices as well as the generated slice. Thus, to fully reveal this potential correlation, the ConvLSTM module is introduced into the high-dimensional feature space to mine the spatiotemporal correlation of the three CT slices, compared to the network in [31].
Table 2.
The network configuration of our segmentation subnetwork.
The three slices, , are simultaneously input into the segmentation subnetwork, and they individually pass through four residual blocks and a transformer block [32,33] to generate their corresponding high-dimensional semantic features , formulated as
where represents the operation of the transformer block with 12 transformer layers. denote the four residual operations, whose structure is illustrated in [34].
During the decoding process, high-dimensional semantic features successively pass through five decoding blocks followed by a 3 × 3 convolutional layer to achieve the three segmented CT slices with hepatic ducts. It is noted that the ConvLSTM module is introduced into the first two decoding blocks to mine the spatiotemporal correlation of the three CT slices in the high-dimensional feature space. Moreover, the ConvLSTM module is only performed on the adjacent slices rather than the generated slice, since the generated slice possibly introduces a correlation bias if it is performed by this module. These operations can be formulated as
where and denote the segmented intermediate slice and the two segmented adjacent slices, respectively, in which hepatic ducts are extracted from the slices. and represent five decoding blocks without and with the ConvLSTM module, respectively. Each decoding block with the ConvLSTM module involves a ConvLSTM module, a 3 × 3 convolutional layer, a ReLU layer, and a BN layer. It is noted that a bilinear upsampling layer (BUL) is added to the second decoder block and a skip connection is performed ahead of the BN layer from it, as illustrated in Figure 1.
4.4. Loss Function
The generated CT slice from the inter-slice super-resolution subnetwork is subtly different in appearance from the real slice, which influences the subsequent segmentation. To well constrain the inter-slice super-resolution subnetwork and the segmentation subnetwork, the quality evaluation of the generated slice should be considered in the total loss of the W-shaped Net. Three metrics are commonly used for image quality evaluation, involving Mean Squared Error (MSE), Peak Signal-to-Noise Ratio (PSNR), and SSIM. Specifically, MSE calculates the difference between two images at each pixel, solely based on the pixel values at the current two pixels and neglecting the relationships with other pixels. Similarly, PSNR is calculated based on MSE. So, MSE and PSNR both disregard the local structural information of the image. SSIM evaluates the difference between the paired images at each pixel by considering not only individual pixels but also the local structural information, which is computed from three perspectives: luminance, contrast, and structure. Thus, we integrate the SSIM metric into the total loss of the W-shaped Net, which is utilized to regulate the influence of the generated CT slice. That is, a novel structure-aware loss function is defined as the total loss of the W-shaped Net, formulated as
where represents the Charbonnier loss function [35]. is the combined loss function commonly used in medical image segmentation, comprising cross-entropy loss and DICE loss, defined as
where and denote the ground truth and the predicted classes for the i-th pixel in the CT slice. In this work, we use the SSIM [36] as a regulator to dynamically assign the contribution of the generated CT slice to the total loss of the proposed framework, defined as
where is the SSIM value computed by the generated slice and its ground truth. The higher the quality of the generated slice is, the more significantly it contributes to the total loss, and vice versa.
5. Results
5.1. Comparisons of the Existing Deep Learning-Based Methods
As described in Section 3, our proposed W-shaped Net cascades the two subnetworks, i.e., the inter-slice super-resolution subnetwork and the segmentation subnetwork. The SpeConv [23] is introduced for the former subnetwork. The segmentation subnetwork is elaboratively designed by the inspiration of the Chen et al. method [31]. Thus, in this subsection, we conducted comparison experiments to validate the proposed W-shape Net in which several cascaded networks combining the SpeConv and different segmentation networks were employed for comparisons.
Comparison experiments are illustrated in Table 3. Walsh et al. [37] and Wang et al. [38] cannot well grasp the spatial relationships of different pixels since it performs the segmentation by means of the operations of convolutions and upsampling. Thus, they cannot precisely localize the tenuous hepatic ducts with complex traveling structures, which results in the two models, the SpeConv + Walsh et al. [37] method and the SpeConv + Wang et al. [38] method, not being able to achieve fair segmentation performance. Although the Cao et al. [39] method employs the window-based self-attention mechanism to capture global and local spatial information, it is a pure transformer-based network requiring a larger volume of data for training. This fact influences the segmentation of the SpeConv + Cao et al. [39] method with the worst performance of a 0.6589 DICE and a 0.6653 F1-score. Imran et al. [40] adopts an appropriate dense connection design and uses a CNN-based feature-preserving block to mitigate the loss of spatial information, which results in it achieving better segmentation results when combined with SpeConv+, compared to the two CNN-based methods, i.e., Walsh et al. [37] and Wang et al. [38]. However, its pure CNN architecture cannot capture global long-term dependencies among CT slices well, which degrades its segmentation, with the DICE of 0.7210 and the F1-score of 0.7215.
Table 3.
Comparative experiments with different two-stage deep learning-based methods.
AlSalmi et al. [41] introduces an attention gate (AG) mechanism in the fusion of multi-scale information, leading to the network overly focusing on boundary areas with gray values similar to the hepatic ducts. Although this improves the probability of correctly predicting the target areas with the best performance of 0.7959 sensitivity, it also leads to an increase in false predictions. Both the Chen et al. [31] and our network introduce the self-attention blocks after the CNN-based feature extraction to allow for a more effective focus on relevant high-level features and thus to avoid the prediction of more erroneous areas. So, the SpeConv + Chen et al. [31] method and ours can achieve the two best segmentation performances for hepatic ducts. Especially, our model achieves the best performance of a 0.7690 DICE and a 0.7712 F1-score. It can be attributed to two reasons. One is that the ConvLSTM can well reveal the spatiotemporal correlation existing in the CT scans of hepatic ducts in the high-dimensional feature space. The other is that structure-aware loss function involving the SSIM regulator can assign the contribution of the generated CT slice to the total loss of the proposed framework.
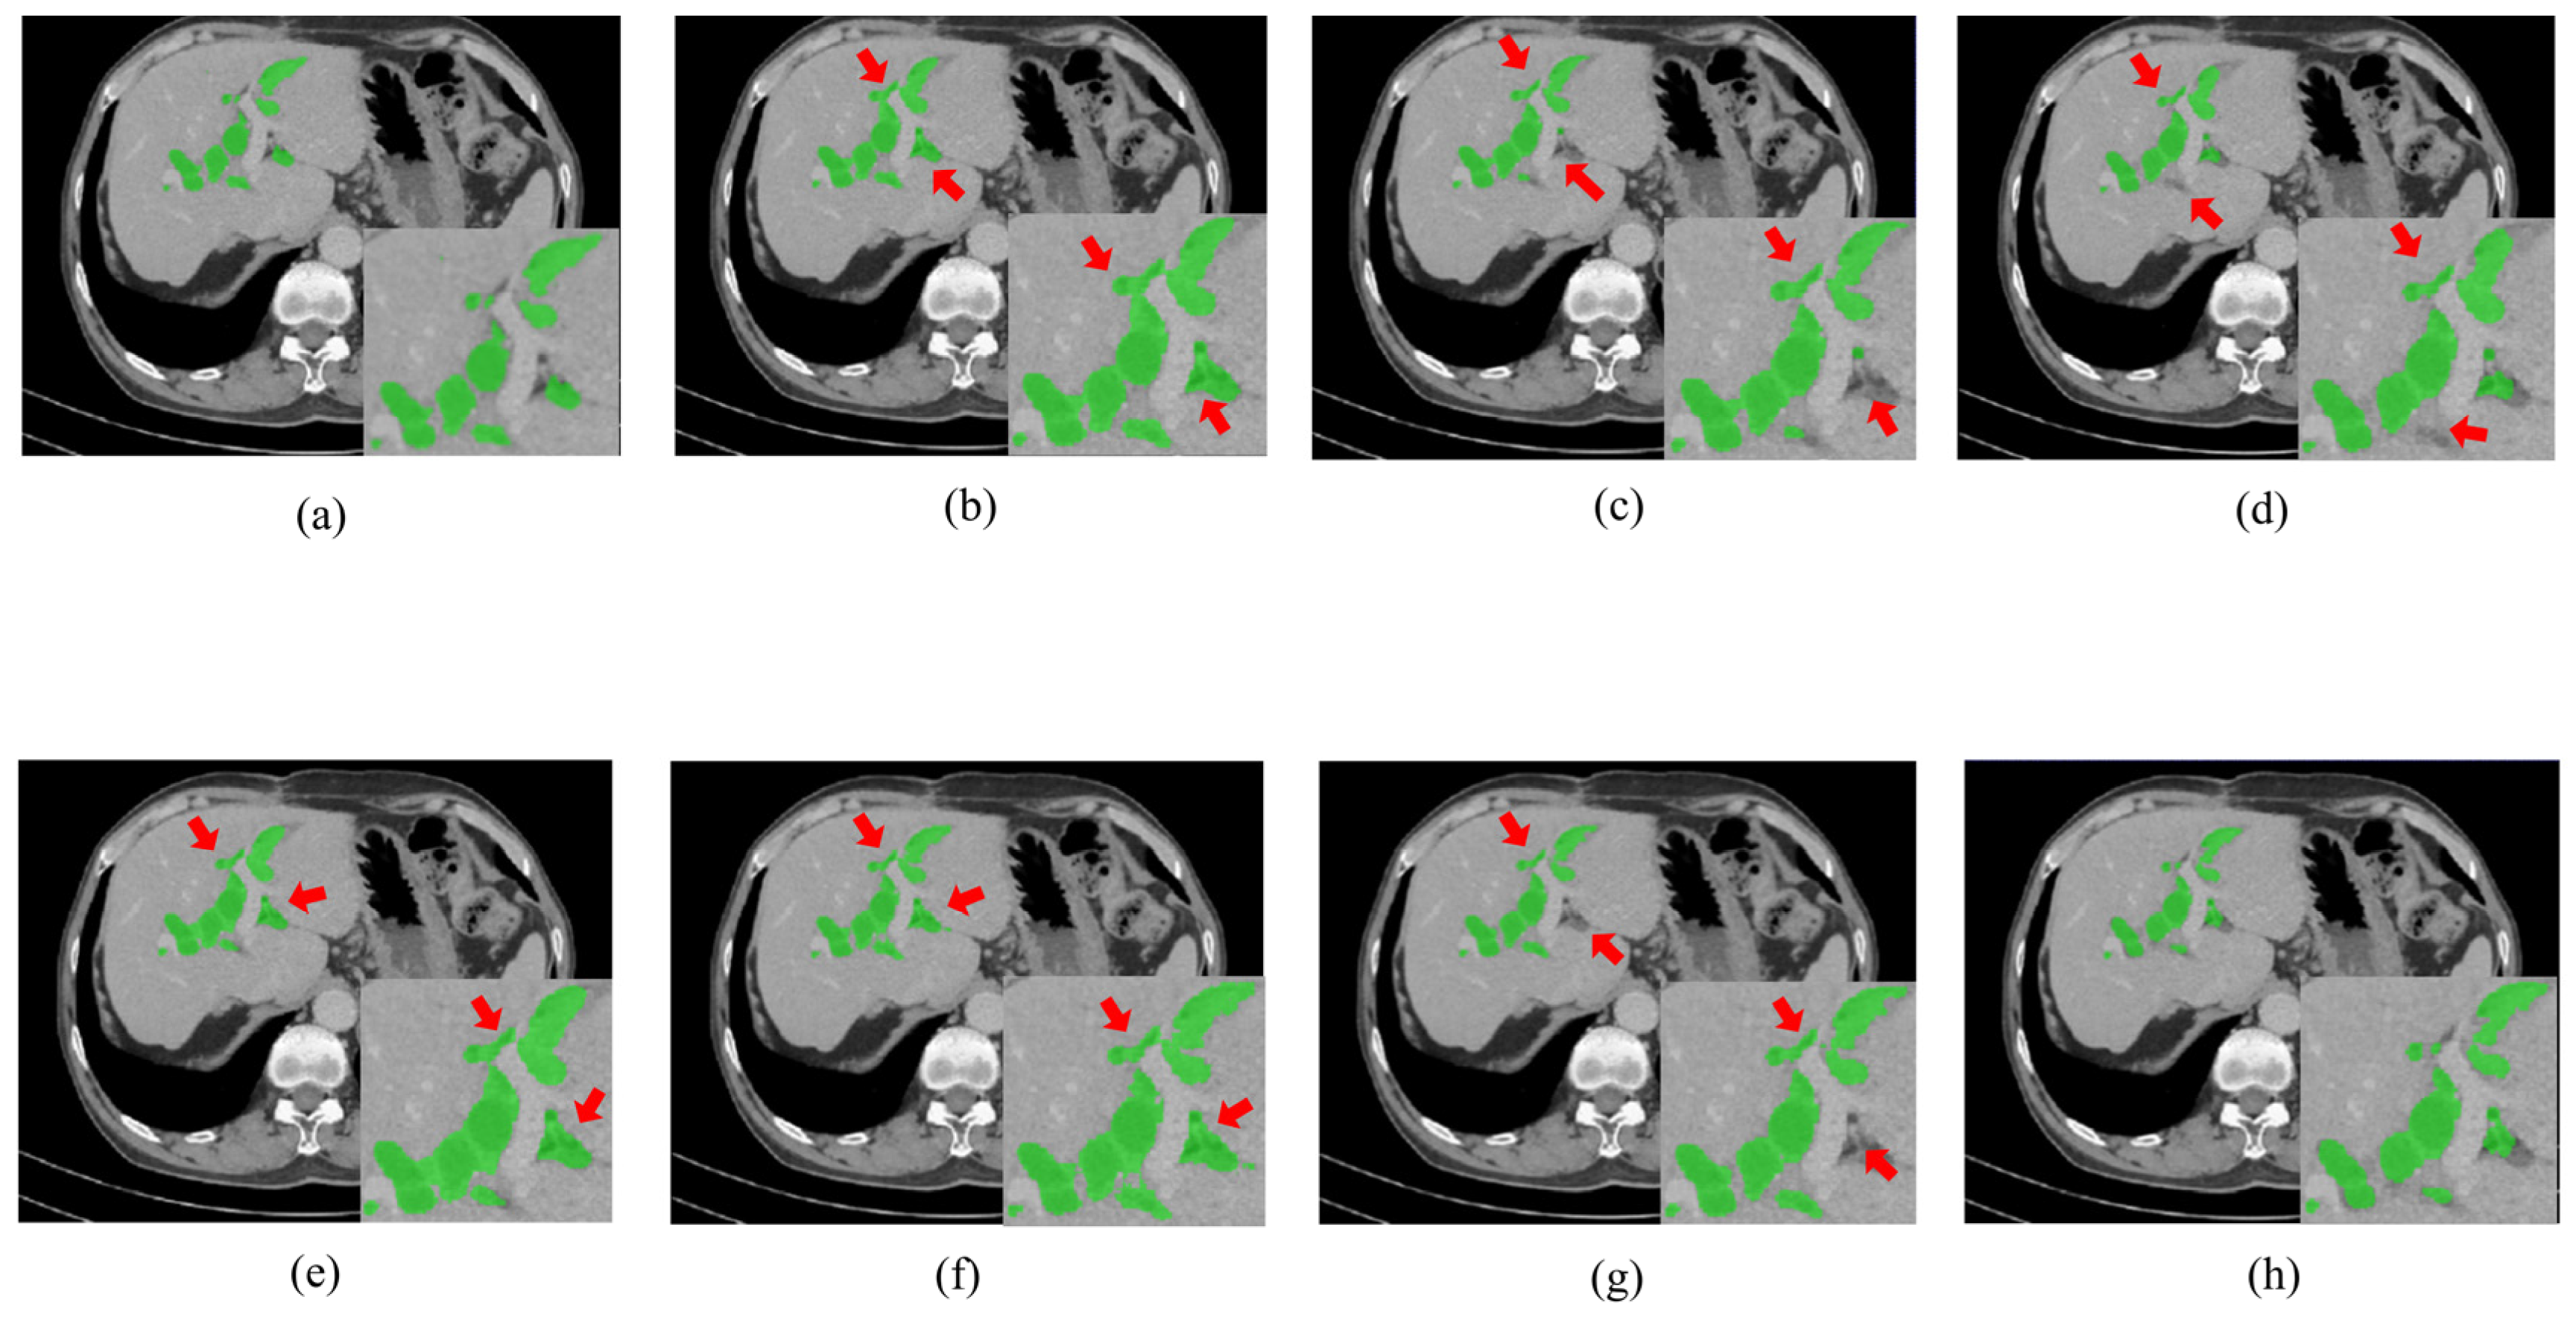
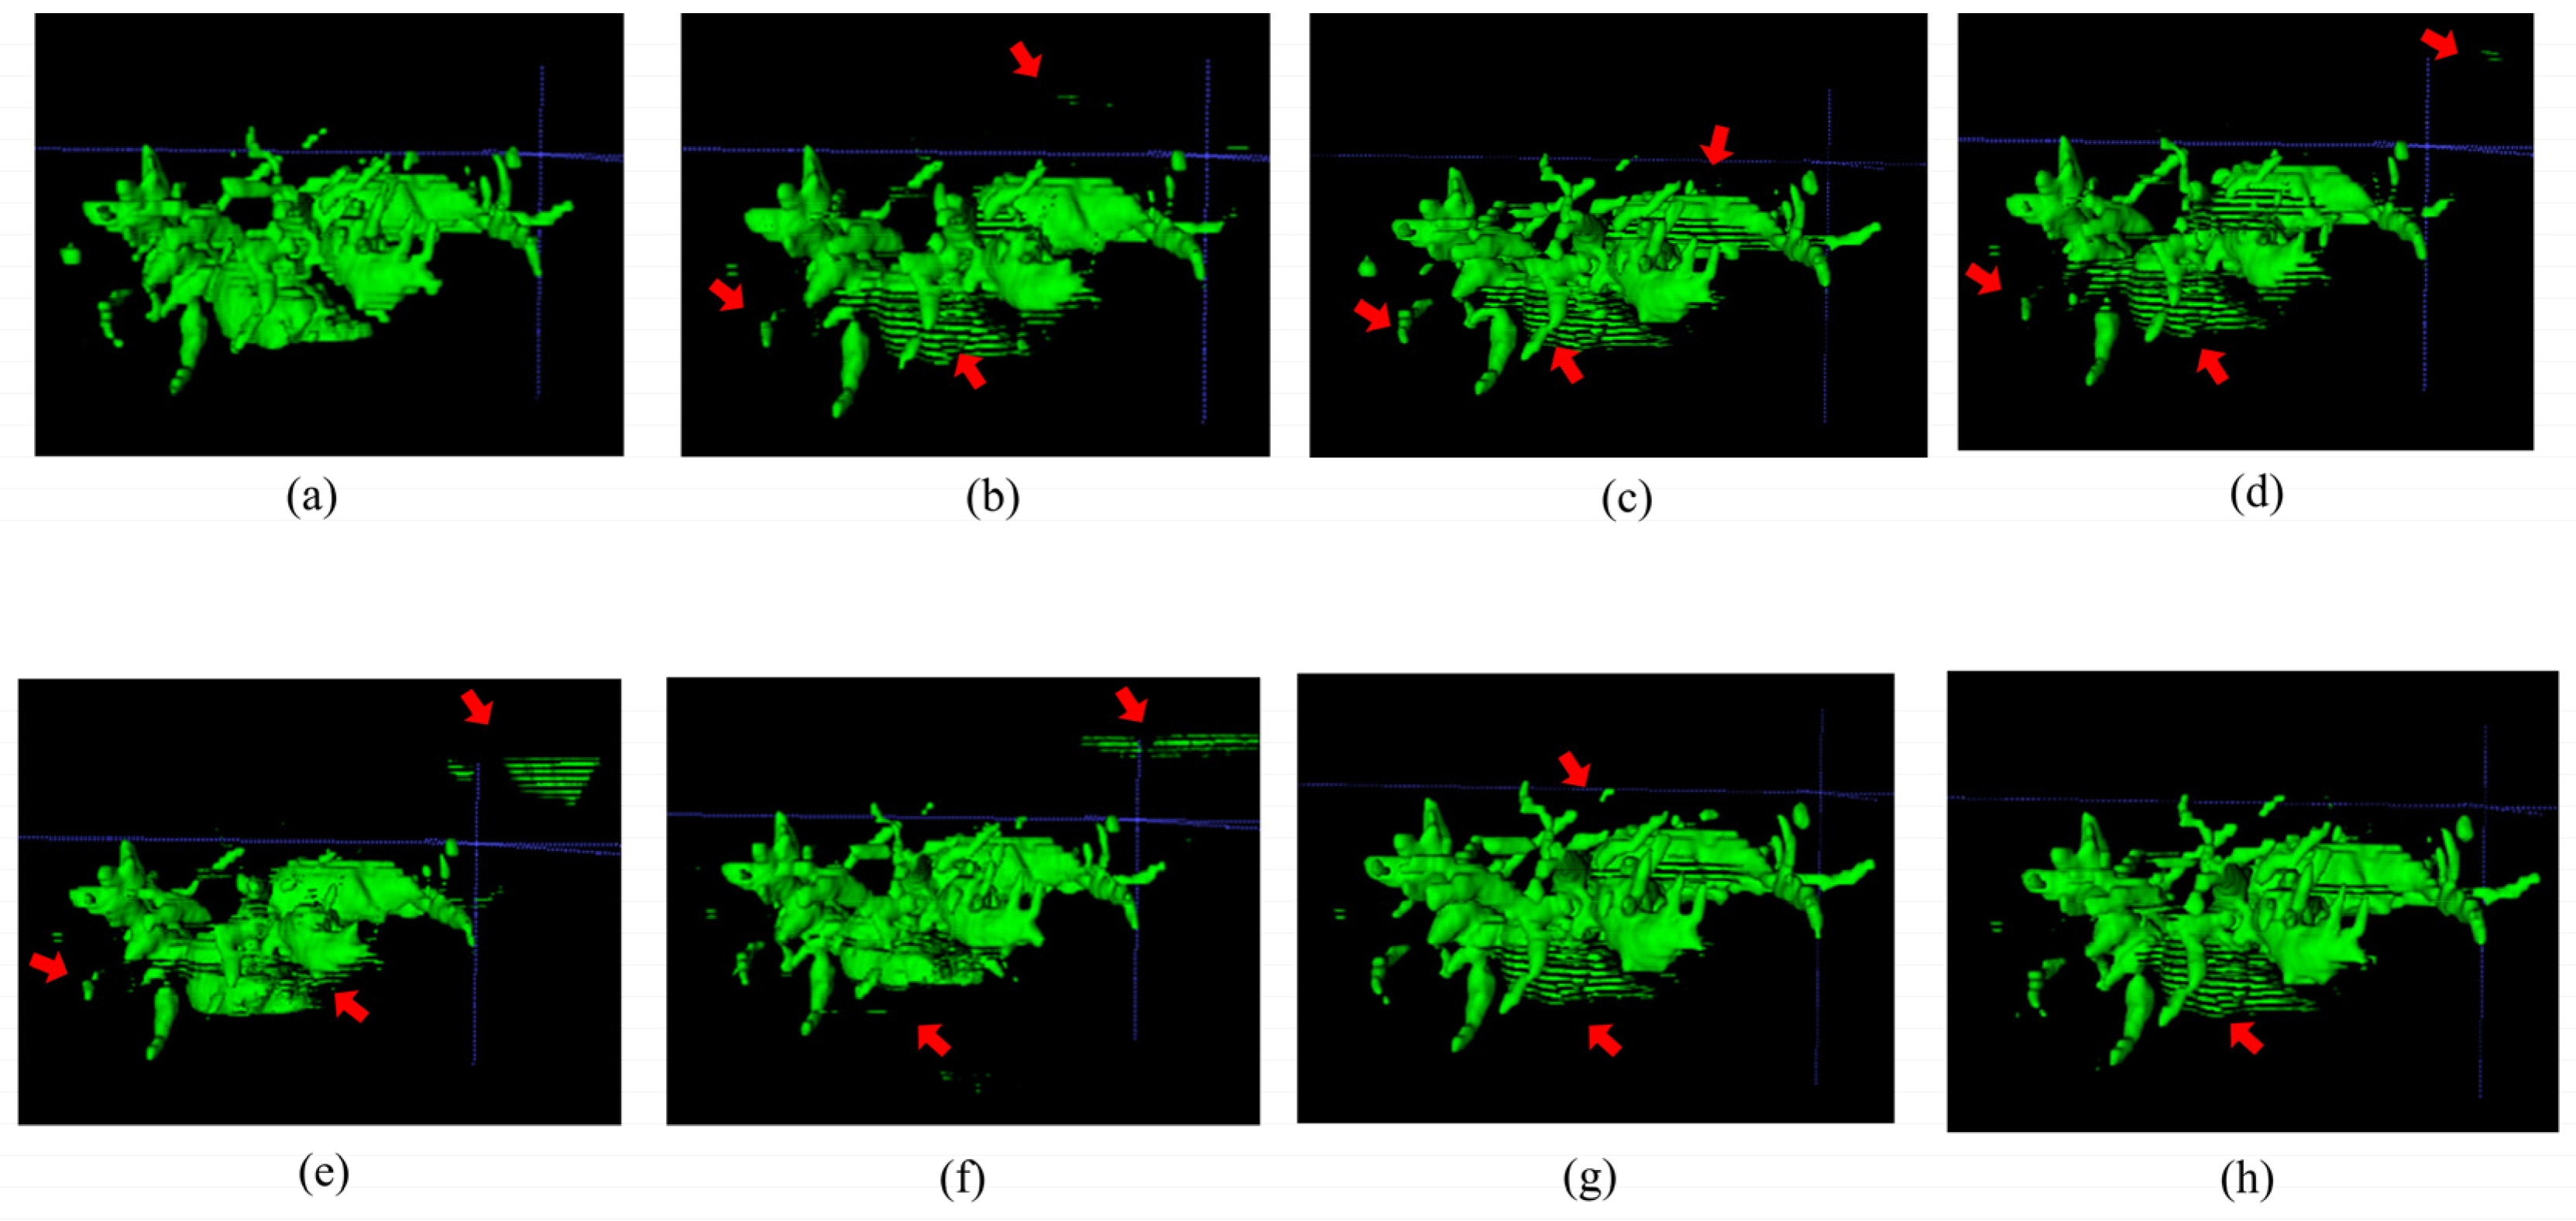
Figure 3 and Figure 4, respectively, illustrate the segmentation results for hepatic ducts and corresponding 3D reconstruction visualizations achieved by different models. In Figure 3, it is evident that when the Speconv network is separately paired by Walsh et al. [41] and Cao et al. [39], the resulting visual segmentations exhibit many over-segmentations and mis-segmentations. When the Speconv network is combined with Chen et al. [31], some missed segmentations emerge. Our designed W-shaped Net demonstrates superior accuracy in hepatic duct segmentation, closely resembling real hepatic duct segmentation results. Moreover, as shown in Figure 4, the 3D reconstruction obtained by our model exhibits fewer artifacts and discontinuities compared to other models, which is highly similar to the ground truth.
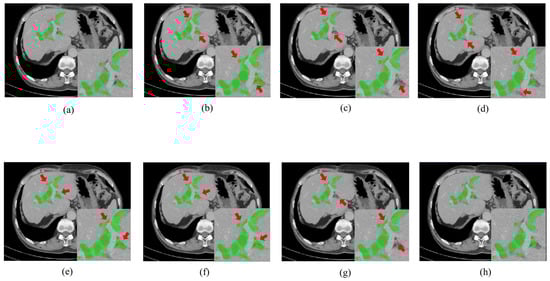
Figure 3.
Segmentation results for hepatic ducts via different methods. (Green regions represent the hepatic ducts. The regions pointed out by the red arrow are mis-segmentations or missed segmentations.). (a) Ground Truth; (b) SpeConv + Walsh et al. [37]; (c) SpeConv + Imran et al. [40]; (d) SpeConv + Wang et al. [38]; (e) SpeConv + AlSalmi et al. [41]; (f) SpeConv + Cao et al. [39]; (g) SpeConv + Chen et al. [31]; (h) Ours.
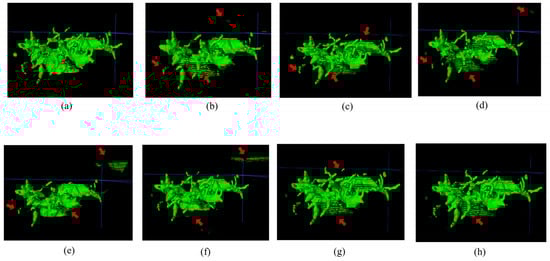
Figure 4.
Visualization of 3D reconstruction of hepatic ducts by means of the segmentation results via different methods (the regions pointed out by the red arrow are those where artifacts or discontinuities have occurred). (a) Ground Truth; (b) SpeConv + Walsh et al. [37]; (c) SpeConv + Imran et al. [40]; (d) SpeConv + Wang et al. [38]; (e) SpeConv + AlSalmi et al. [41]; (f) SpeConv + Cao et al. [39]; (g) SpeConv + Chen et al. [31]; (h) Ours.
5.2. Ablation Experiments
5.2.1. Influence of ConvLSTM
In this subsection, we conducted experiments to discuss the influence of the ConvLSTM module on the proposed W-shaped Net in which the networks without/with several ConvLSTM modules were established for the segmentation of hepatic ducts.
As indicated in Table 4, the W-shaped Net without ConvLSTM performs worse than those with the ConvLSTM modules in the first decoder block and in the first two decoder blocks. This is because the ConvLSTM effectively learns the high-dimensional correlations of the adjacent CT slices involving hepatic ducts. Especially, the model with two ConvLSTM modules achieves the best performance of 0.7690 DICE and a 0.7712 F1-score. However, it is interesting that the segmentation performance decreases significantly when the ConvLSTM modules are integrated into the decoders at the high-dimensional and low-dimensional spaces. This is possibly because the feature information of other tissues is wrongly integrated at the low-dimensional feature spaces due to their subtle grayscale differences from the hepatic ducts. Moreover, when the ConvLSTM modules are simultaneously incorporated into the first three decoders, the corresponding model achieves the best sensitivity of 0.8346 but the worst performance for three metrics. The facts indicate that many pixels of other tissues are wrongly considered as those of hepatic ducts, which will puzzle the pre-operation and even influence the precise minimally invasive surgery for the extraction of hepatobiliary stones.
Table 4.
Segmentation results achieved by the W-shaped Net with different ConvLSTM modules.
5.2.2. Influence of the Regulator in the Loss Function
As indicated in Equation (10), the SSIM is introduced as a regulator to dynamically assign the contribution of the generated CT slice to the total loss of the designed W-shaped Net. In this subsection, we conducted several experiments to demonstrate its influence on the designed network.
As indicated in (10), the smaller the SSIM regulator is, the larger the difference between the generated CT slice and the ground truth is, the lesser influence of the generated CT slice and the stronger influence of the two adjacent CT slices on the W-shaped Net are, and vice versa. Thus, as shown in Table 5, the total loss with the SSIM regulator results in higher segmentation performance in model predictions compared to that without SSIM, which demonstrates its ability of dynamically allocating the contribution of generated inter-slices to the segmentation subnetwork. Moreover, the models with the MSE regulator and with the PSNR regulator perform worse than those without any loss regulator, which further demonstrates that the SSIM can better characterize the structural correlations of hepatic ducts in different CT slices.
Table 5.
Segmentation results achieved by the W-shaped Net with different loss regulators.
6. Discussions
6.1. Interpretability of the W-Shaped Net
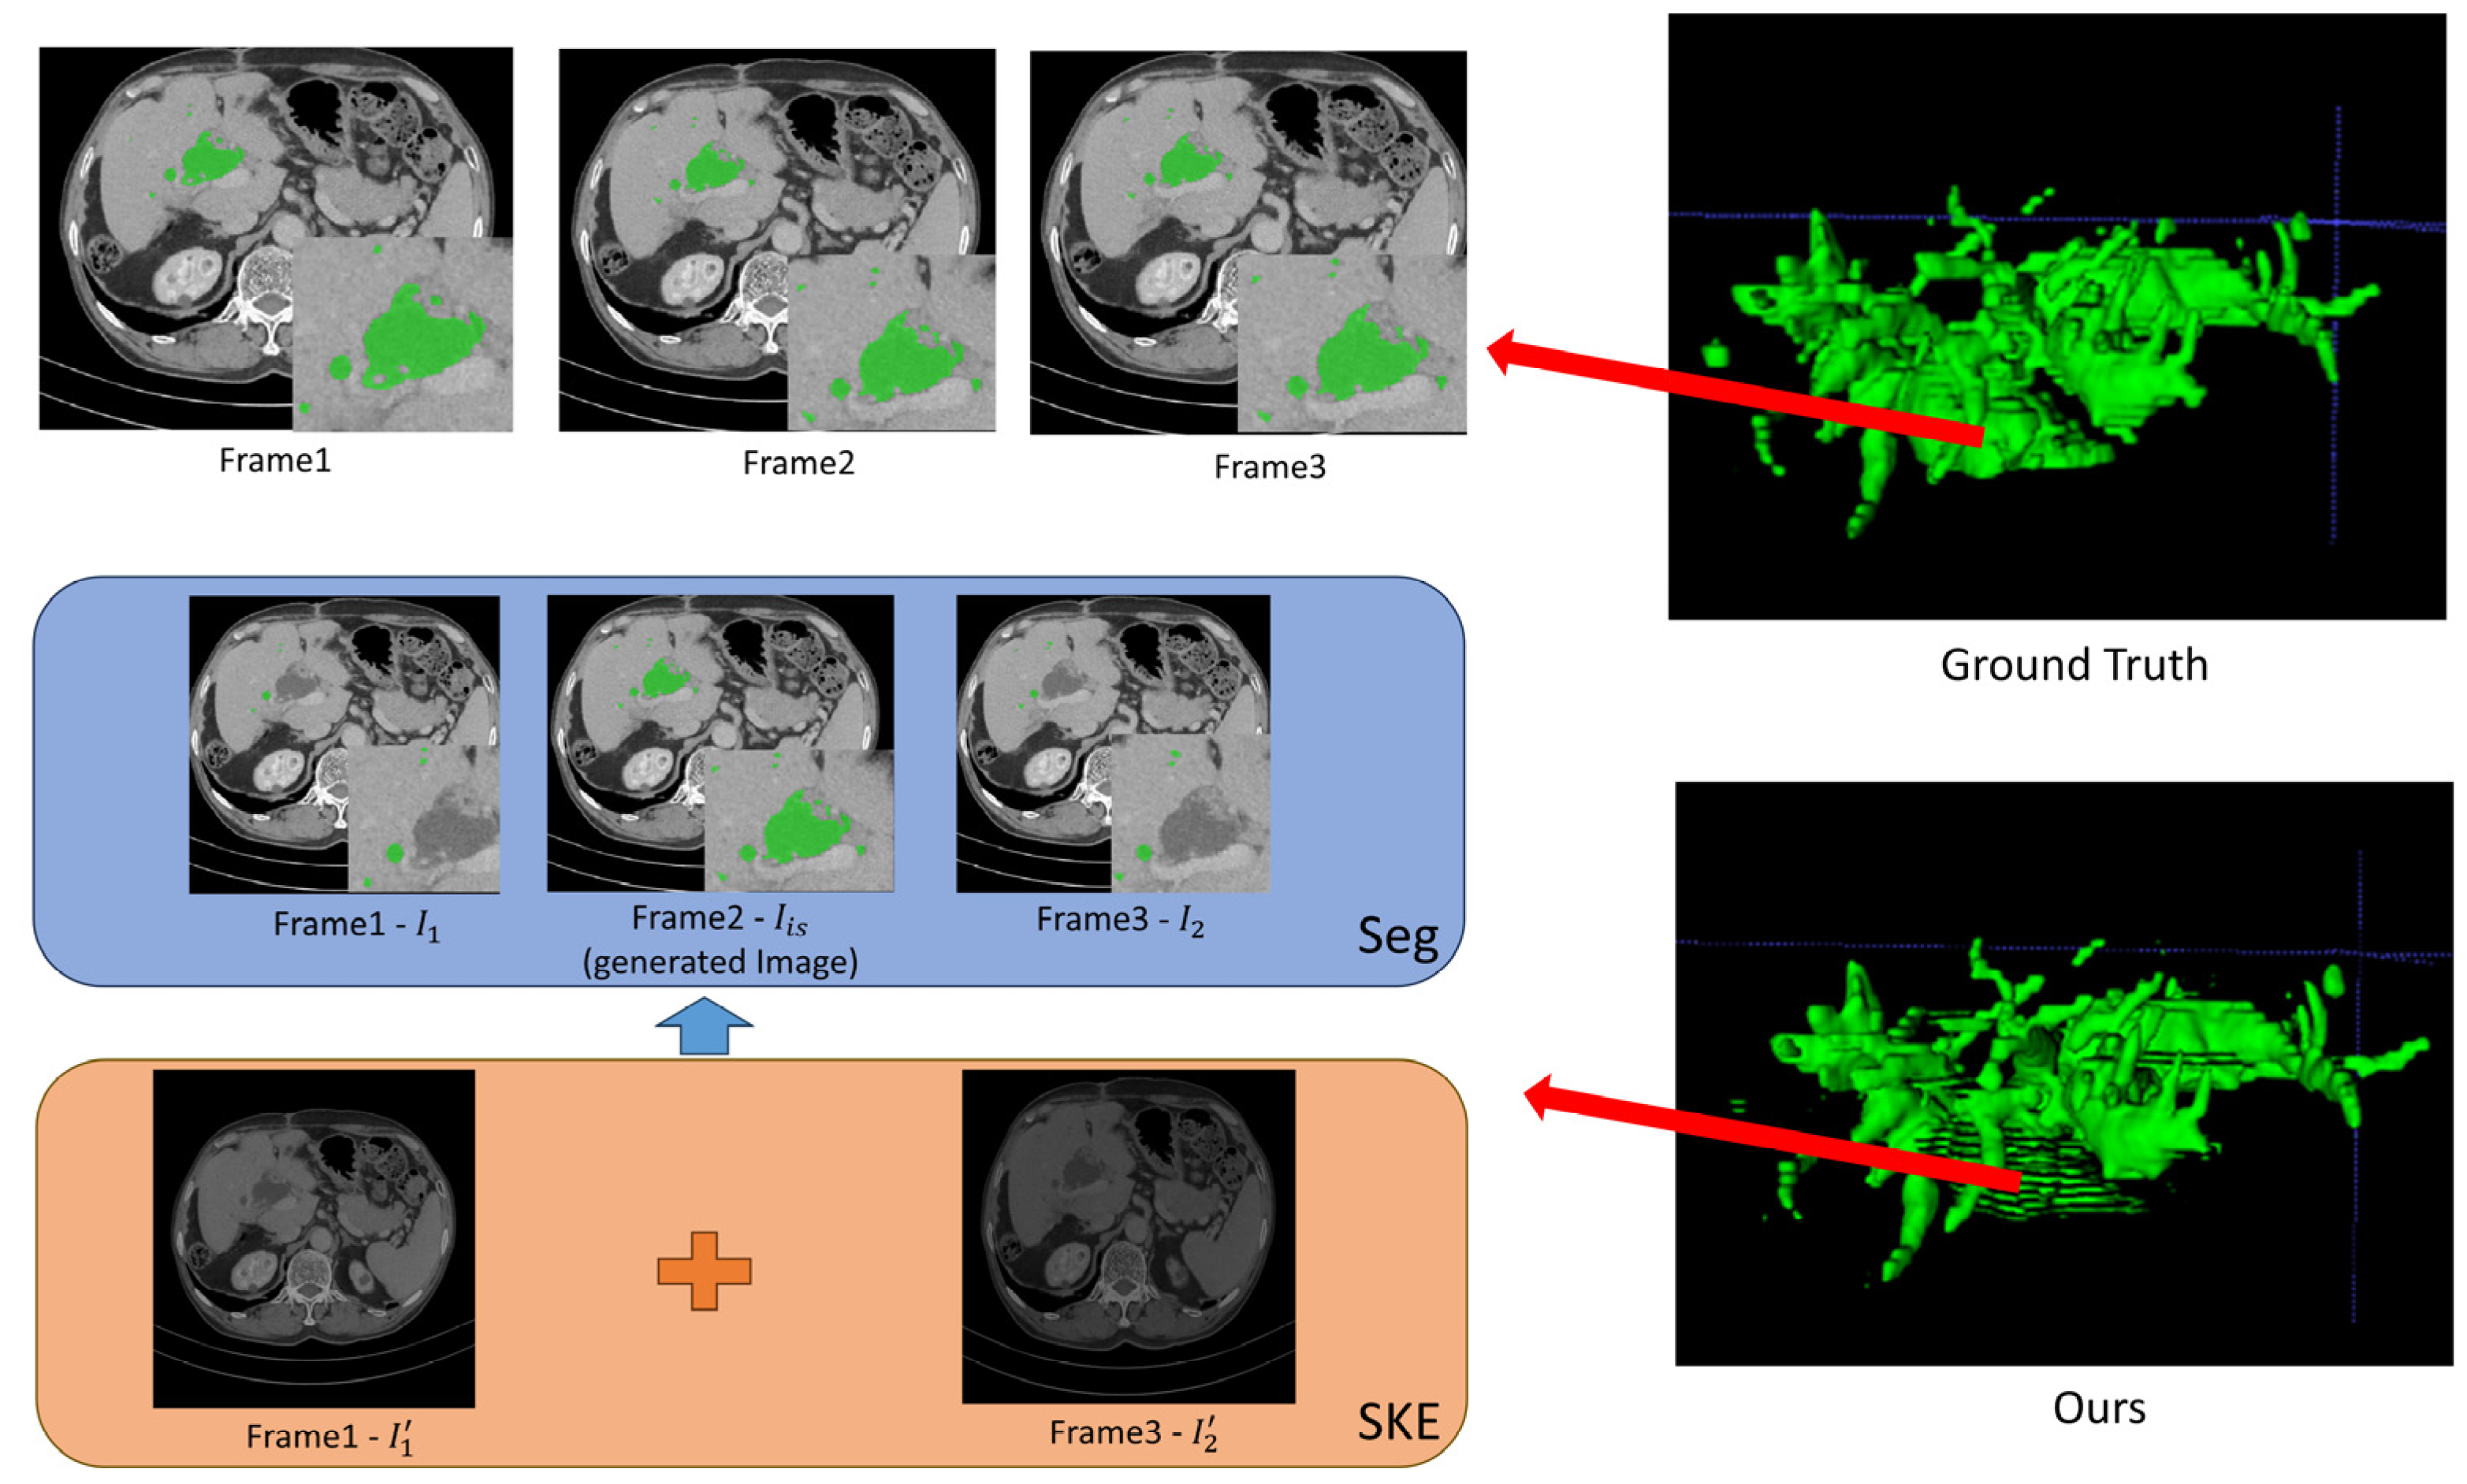
In this section, we visually evaluate the qualities of the generated CT slices and the segmented results achieved by our designed W-shaped Net. To do so, one duct tree is utilized to visually illustrate its reconstructed 3D image and some slices extracted from the 3D image, as illustrated in Figure 5 and Figure 6.
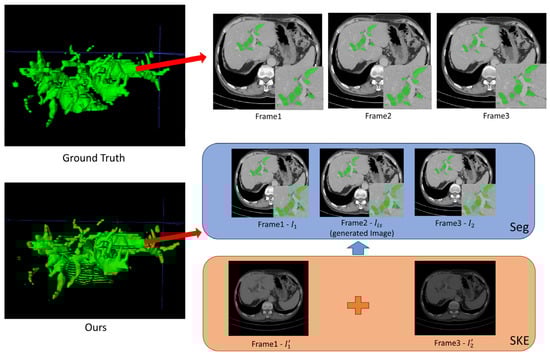
Figure 5.
Good segmentation visualization of three successive CT slices achieved by the W-shaped Net.
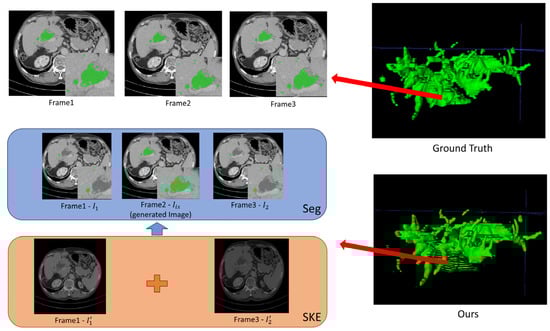
Figure 6.
Poor segmentation visualization of three successive CT slices achieved by the W-shaped Net.
For the inter-slice super-resolution subnetwork, the SKE module is employed to estimate the two input slices using 1D kernels, and ultimately to obtain the generated slice. This module can compute the weights of the two input slices based on internal kernel parameters, which are visually displayed in Figure 5 and Figure 6. As indicated in Figure 5 and Figure 6, one of two weight maps has a higher brightness than the other one, which indicates that the information (pixel values) for the generated slice mainly comes from the weight map with high brightness. Moreover, the generated CT slices are visually similar to the ground truth slices, which demonstrates that the inter-slice super-resolution subnetwork works.
As indicated in Figure 5, the well-reconstructed region in the 3D image demonstrates a dispersed distribution within a certain area in the ground truth. The segmentation of three successive CT slices achieved by the W-shaped Net is highly prone to the ground truth, which demonstrates the effectiveness of the fusion mechanism between the CNN for local feature extraction and the transformer for global feature extraction. As indicated in Figure 6, the poorly reconstructed region in the 3D image demonstrates a wide continuous distribution within a certain area in the ground truth. Except for the generated slice, many hepatic duct regions are not well segmented from the two adjacent slices. This is possibly attributed to the poor handling of correlations among successive slices, since the ConvLSTM module may pay more attention to local correlations and overlook the global correlations.
6.2. Comparisons of Traditional Inter-Slice Interpolation
Normal CT devices mostly involve traditional inter-slice interpolation methods to improve the inter-slice resolution. In our study, we utilize deep learning (DL) for inter-slice interpolation. Thus, in this section, we conducted a comparison experiment to demonstrate the superiority of our inter-slice interpolation subnetwork, in which two widely used traditional inter-slice interpolation methods (linear and spline) are separately substituted for this subnetwork.
As indicated in Table 6 and Table 7, compared to the two traditional methods, our inter-slice interpolation subnetwork can generate better inter-slices, with an SSIM of 0.9855 and a PSNR of 36.90, which can further improve the subsequent segmentation performance with a DICE of 0.7690 and an F1-score of 0.7254.
Table 6.
Generated results via the W-shaped Net with different inter-slice interpolation methods.
Table 7.
Segmentation results via the W-shaped Net with different inter-slice interpolation methods.
6.3. Influence of the Number of Interpolated Inter-Slices
In this section, we conducted an experiment to discuss the segmentation performance of our method with different numbers of interpolated inter-slices between the two adjacent slices in the simulated CT scans with low inter-slice resolution. It is noted that we filtered out three slices from every four slices in the ground truth CT scans to simulate the generation of other CT slices with low inter-slice resolution. That is, assume that the CT scans have a total of 100 CT slices {1, 2, 3, 4, 5, …, 100}, then slice sampling with intervals can simulate the generation of the CT scans with low inter-slice resolution, i.e., the CT slices {1, 5, 9, …, 97}. Then, our method is separately performed on the two types of CT scans with low inter-slice resolution, i.e., for example, with twenty-five slices and with fifty slices, which indicates that three slices and one slice should, respectively, be generated between the two adjacent CT slices in the simulated CT scans with low inter-slice resolution.
As indicated in Table 8, our method can also generate three inter-slices to achieve a fairly good segmentation performance. The decrease in the segmentation performance is attributed to the generation of more inter-slices.
Table 8.
Segmentation results for different numbers of interpolated inter-slices.
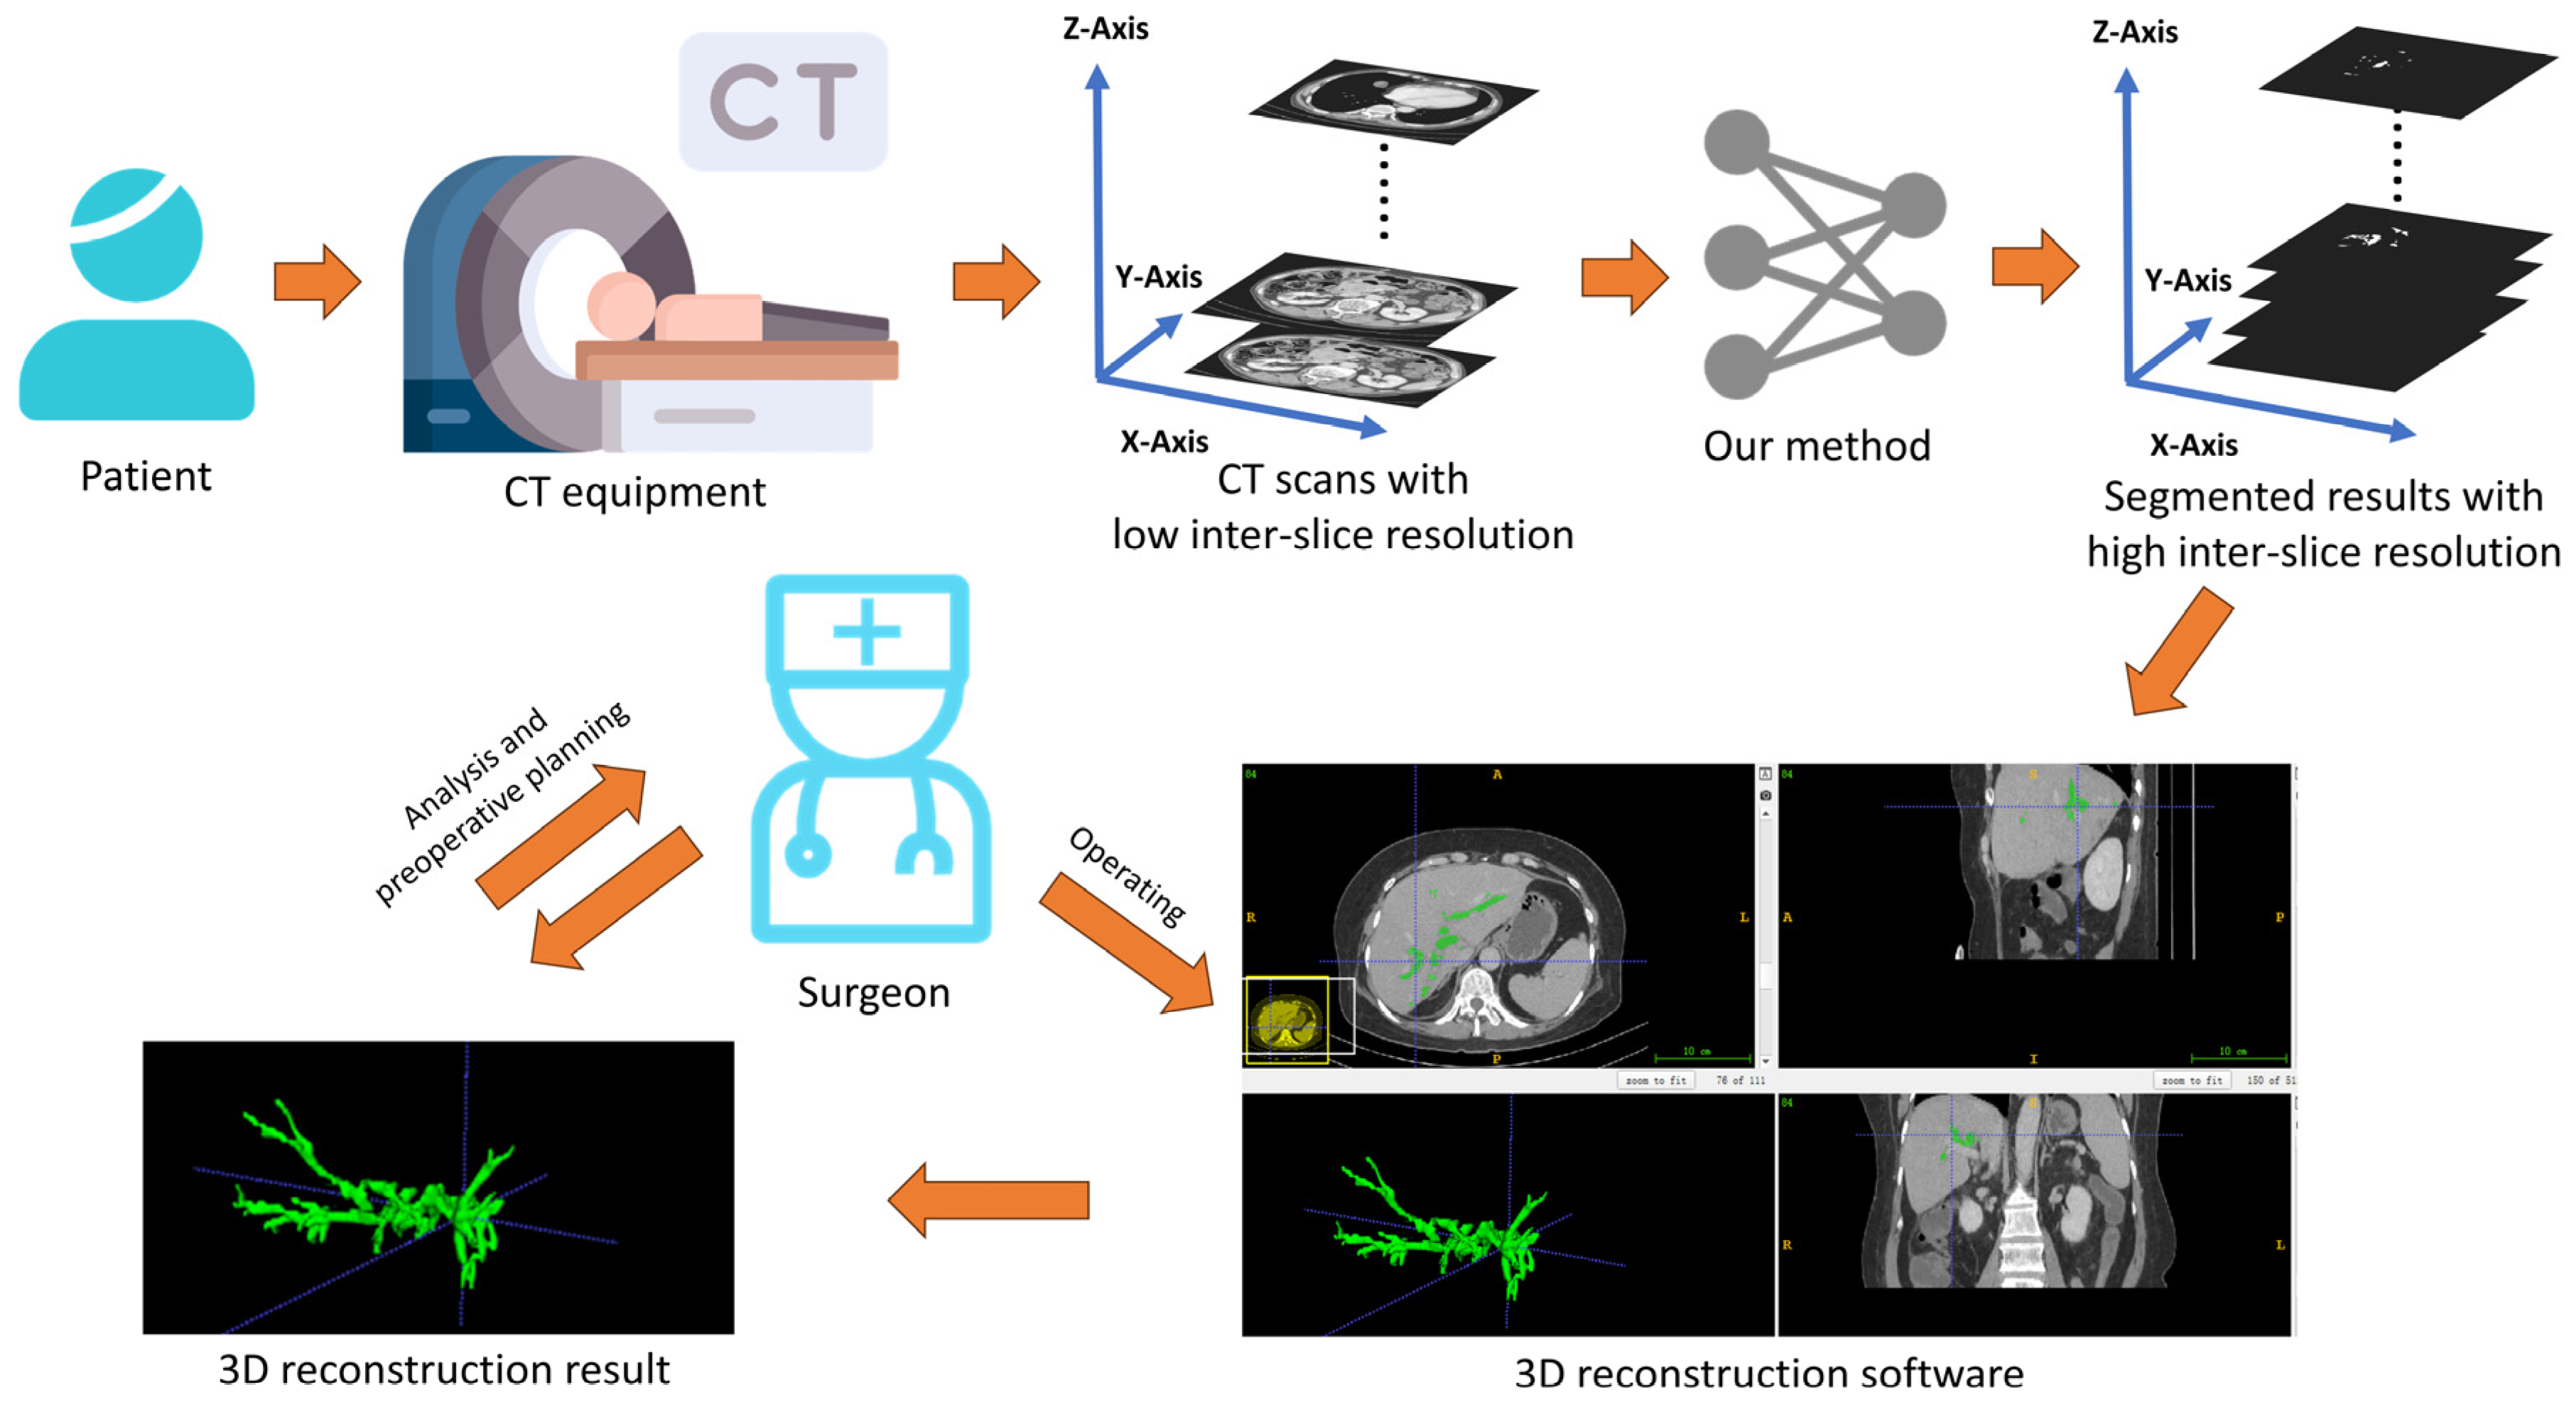
6.4. Discussion on Practical Implications
As indicated in Figure 7, after scanning the patient with the CT equipment, some CT scans are obtained with possible low inter-slice resolution. Since our method can simultaneously perform both inter-slice interpolation and segmentation tasks, once these slices are input into our W-shaped Net model, it can generate segmentation results with high inter-slice resolution. Experienced surgeons then use 3D reconstruction software (like ITKSNAP 3.8) to convert these segmentation results into a 3D hepatic tree, which is subsequently analyzed and used for preoperative planning.
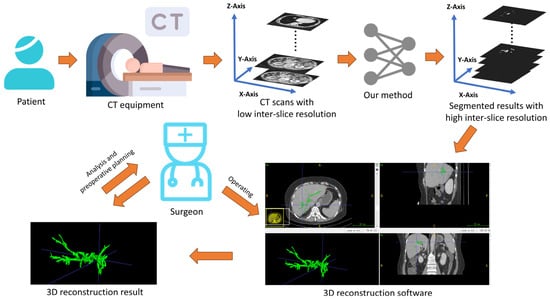
Figure 7.
Practical implications based on the obtained results via the W-shaped Net.
6.5. Limitations and Future Work
Although our designed W-shaped Net demonstrates superior segmentation performance and 3D reconstruction results for CT scans with improving inter-slice resolution, several issues will still need to be addressed in the future.
First, in this study, there are only 24 cases used for training, with only 1913 slices in total. Training with such a small dataset possibly leads to a potential overfitting issue for further poor generalization. As indicated in Figure 5 and Figure 6, when the hepatic ducts have a dispersed distribution within a certain area, our method performs well. However, when the hepatic ducts have a wide continuous distribution within a certain area, our method is not sensitive for good segmentation. Except for the mechanism of ConvLSTM, another possible reason is the insufficient training data where the hepatic ducts exhibit a continuous and large-range distribution. In the future, we will collect a large number of cases from hospitals through research cooperation, which can to some extent address this generalization issue.
Second, since the non-local block [42] has the ability of adaptively modeling along the temporal dimension to capture temporal cues well [43], this can be adapted to different scenarios by switching kernel functions. Thus, in the future, we will incorporate the non-local block into our proposed model to address the issue of ConvLSTM’s limited ability to capture global correlations among CT slices.
Third, for convenience, we adopted an existing inter-slice interpolation network (SpeConv [23]) as the inter-slice super-resolution subnetwork to generate the inter-slice between two adjacent CT slices. In the future, we will design a new inter-slice super-resolution subnetwork that dynamically adjusts the number of generated inter-slices according to the acquired CT scans with low inter-slice resolution to ensure that the 3D reconstruction of hepatic ducts meets the medical requirements well.
Fourth, the CT scans with low inter-slice resolution are simulated by slice sampling with intervals of CT scans with high inter-slice resolution, which inevitably have some discrepancies compared to the real-world data. In the future, we will validate our designed model in real-world slices with low inter-slice resolution for real clinical applications.
Also, since our W-shaped Net performs well for inter-slice interpolation and segmentation on complex and elongated hepatic duct structures, it can theoretically be extended to related fields involving similar structures. In the future, we will adapt our W-shaped Net to other medical CT data with similar anatomic structures.
7. Conclusions
Due to the limitations of low-performance CT equipment at some local hospitals, the acquired CT scans with a low inter-slice resolution cannot reconstruct high-resolution 3D hepatic duct trees. Even with the usage of some interpolation methods, the 2D segmentation results and 3D reconstruction results may not be ideal, which will influence the precise minimally invasive surgery for hepatobiliary stone disease.
In this paper, we design an end-to-end inter-slice super-resolution segmentation network for hepatic ducts, which cascades two U-Net-like subnetworks for two different tasks. The SpeConv is introduced as the inter-slice super-resolution subnetwork to obtain a generated slice between two adjacent abdominal CT slices involving hepatic ducts. The segmentation subnetwork is also an encoder–decoder structure, with several residual blocks and 12 transformer blocks for the encoder, and several upsampling blocks for the decoder. In the high-dimensional feature space, the ConvLSTM is introduced to deeply reveal spatiotemporal information among the CT scans of hepatic ducts. Our joint loss function with the SSIM regulator is designed to strengthen the interaction between two subnetworks.
Ablation experiments validate the significances of the introduction of the ConvLSTM and the SSIM regulator for the total loss on the designed W-shaped Net for hepatic duct segmentation. Comparative experiments indicate that our model outperforms the existing deep learning frameworks in terms of a 0.7690 DICE and a 0.7712 F1-score, which results in commendable 3D reconstruction for the hepatic duct tree.
Author Contributions
Conceptualization, N.C.; methodology, N.C. and Z.H.; software, L.L. and Y.Z. (Yu Zheng); validation, Z.H. and Y.Z. (Yu Zheng); formal analysis, N.C.; investigation, L.L.; resources, Z.H. and L.L.; data curation, Z.H. and L.L.; writing—original draft preparation, N.C. and Z.H.; writing—review and editing, N.C.; visualization, L.L. and Y.Z. (Yu Zheng); supervision, Y.Z. (Yinghong Zhou) and S.X.; project administration, Y.Z. (Yinghong Zhou) and S.X.; funding acquisition, N.C. and Y.Z. (Yinghong Zhou). All authors have read and agreed to the published version of the manuscript.
Funding
This research was funded by the grants from the National Natural Science Foundation of China, Grant number 82172019.
Data Availability Statement
It should be noted that the data collected for research purposes are subject to informed patient consent, but due to confidentiality agreements, the dataset does not sup-port open access at this time.
Acknowledgments
We thank all authors for their contributions to this work.
Conflicts of Interest
The authors declare no conflicts of interest.
References
- Dilek, O.N.; Atasever, A.; Acar, N.; Karasu, Ş.; Gür, E.Ö.; Özşay, O.; Çamyar, H.; Dilek, F.H. Hepatolithiasis: Clinical series, review and current management strategy. Turk. J. Surg. 2020, 36, 382–392. [Google Scholar] [CrossRef] [PubMed]
- Shen, H.; Zhang, S.; Xia, Y.; Chen, C.; Huo, L.; Gan, L.; Li, J.; Wang, K.; Pawlik, T.M.; Lau, W.Y.; et al. A nomogram in predicting risks of intrahepatic cholangiocarcinoma after partial hepatectomy for hepatolithiasis. J. Gastrointest. Surg. 2021, 25, 2258–2267. [Google Scholar] [CrossRef]
- Lin, W.; Chen, M.; Li, B.; Wang, W.; Li, S.; Lyu, G. Intraoperative ultrasound-guided percutaneous hepatocholangiostomy applied in the cholangioscopic lithotripsy for hepatolithiasis and choledocholithiasis. Surg. Endosc. 2023, 37, 486–493. [Google Scholar] [CrossRef]
- Uribe Rivera, A.K.; Seeliger, B.; Saldivar, C.A.; Houghton, E.; Rodríguez, F.; Acquafresca, P.; Palermo, M.; Giménez, M.E. Percutaneous transhepatic cholangioscopy for benign and malignant biliary disease using a novel short single-operator cholangioscope. Surg. Endosc. 2023, 37, 7774–7783. [Google Scholar] [CrossRef] [PubMed]
- Arnau, A.B.M.; Espelt, A.M.; Auñon, J.V.; Sánchez-Cabús, S. Percutaneous transhepatic cholangioscopy in the management of hepatolithiasis. Cirugía Española (Engl. Ed.) 2024, 102, 599–604. [Google Scholar] [CrossRef]
- Wu, T.; Guo, Y.; Bi, J.; He, B.; Bao, S. Outcomes of reoperation for hepatolithiasis with 3D imaging individualized preoperative planning technique: A single-center experience. Minerva Surg. 2020, 76, 62–71. [Google Scholar] [CrossRef] [PubMed]
- Li, S.; Yu, L.; Liu, B.; Lin, Q.; Huang, J. Application analysis of ai technology combined with spiral CT scanning in early lung cancer screening. arXiv 2024, arXiv:2402.04267. [Google Scholar] [CrossRef]
- Guo, Q.; Chen, J.; Pu, T.; Zhao, Y.; Xie, K.; Geng, X.; Liu, F. The value of three-dimensional visualization techniques in hepatectomy for complicated hepatolithiasis: A propensity score matching study. Asian J. Surg. 2023, 46, 767–773. [Google Scholar] [CrossRef]
- Ye, Y.Q.; Cao, Y.W.; Li, R.Q.; Li, E.Z.; Yan, L.; Ding, Z.W.; Fan, J.M.; Wang, P.; Wu, Y.X. Three-dimensional visualization technology for guiding one-step percutaneous transhepatic cholangioscopic lithotripsy for the treatment of complex hepatolithiasis. World J. Gastroenterol. 2024, 30, 3393. [Google Scholar] [CrossRef] [PubMed]
- Zhang, W.G.; Chai, N.L.; Zhang, B.; Li, X.; Wang, J.F.; Dong, H.; Feng, Y.J.; Linghu, E.Q. Cholangioscopy-assisted extraction through novel papillary support for small-calibre and sediment-like common hepatic duct stones. World J. Gastroenterol. 2023, 29, 2495. [Google Scholar] [CrossRef] [PubMed]
- Rossi, T.; Williams, A.; Sun, Z. Three-dimensional printed liver models for surgical planning and intraoperative guidance of liver cancer resection: A systematic review. Appl. Sci. 2023, 13, 10757. [Google Scholar] [CrossRef]
- Withers, P.J.; Bouman, C.; Carmignato, S.; Cnudde, V.; Grimaldi, D.; Hagen, C.K.; Maire, E.; Manley, M.; Du Plessis, A.; Stock, S.R. X-ray computed tomography. Nat. Rev. Methods Primers 2021, 1, 18. [Google Scholar] [CrossRef]
- Xuanhao, Z.; Lijuan, S.; Bo, W.; Bing, P. Effect of the number of projections in X-ray CT imaging on image quality and digital volume correlation measurement. Measurement 2022, 194, 111061. [Google Scholar] [CrossRef]
- Zhang, Z.; Yu, L.; Liang, X.; Zhao, W.; Xing, L. TransCT: Dual-path transformer for low dose computed tomography. In Proceedings of the Medical Image Computing and Computer Assisted Intervention–MICCAI 2021, Strasbourg, France, 27 September–1 October 2021; Part VI 24. Springer International Publishing: Berlin/Heidelberg, Germany, 2021; pp. 55–64. [Google Scholar]
- Koetzier, L.R.; Mastrodicasa, D.; Szczykutowicz, T.P.; van der Werf, N.R.; Wang, A.S.; Sandfort, V.; van der Molen, A.J.; Fleischmann, D.; Willemink, M.J. Deep learning image reconstruction for CT: Technical principles and clinical prospects. Radiology 2023, 306, e221257. [Google Scholar] [CrossRef] [PubMed]
- Desai, S.D.; Naik, P.; Baligar, V.P.; Meena, S.M. Interpolation based low dose ct image reconstruction. Procedia Comput. Sci. 2020, 171, 2760–2769. [Google Scholar] [CrossRef]
- Zi, Y.; Wang, Q.; Gao, Z.; Cheng, X.; Mei, T. Research on the application of deep learning in medical image segmentation and 3d reconstruction. Acad. J. Sci. Technol. 2024, 10, 8–12. [Google Scholar] [CrossRef]
- Yang, H.; Wang, W.; Shang, J.; Wang, P.; Lei, H.; Chen, H.S.; Fang, D. Segmentation of computed tomography images and high-precision reconstruction of rubber composite structure based on deep learning. Compos. Sci. Technol. 2021, 213, 108875. [Google Scholar] [CrossRef]
- Zhaotao, W. Inter-slice image augmentation based on frame interpolation for boosting medical image segmentation accuracy. arXiv 2020, arXiv:2001.11698. [Google Scholar]
- Parihar, A.S.; Varshney, D.; Pandya, K.; Aggarwal, A. A comprehensive survey on video frame interpolation techniques. Vis. Comput. 2022, 38, 295–319. [Google Scholar] [CrossRef]
- Ahmed, I.; Ahmad, M.; Chehri, A.; Jeon, G. A heterogeneous network embedded medicine recommendation system based on LSTM. Future Gener. Comput. Syst. 2023, 149, 1–11. [Google Scholar] [CrossRef]
- Guo, Y.; Bi, L.; Ahn, E.; Feng, D.; Wang, Q.; Kim, J. A spatiotemporal volumetric interpolation network for 4d dynamic medical image. In Proceedings of the IEEE/CVF Conference on Computer Vision and Pattern Recognition 2020, Seattle, WA, USA, 13–19 June 2020; pp. 4726–4735. [Google Scholar]
- Niklaus, S.; Mai, L.; Liu, F. Video frame interpolation via adaptive separable convolution. In Proceedings of the IEEE International Conference on Computer Vision 2017, Venice, Italy, 22–29 October 2017; pp. 261–270. [Google Scholar]
- Siddique, N.; Paheding, S.; Elkin, C.P.; Devabhaktuni, V. U-net and its variants for medical image segmentation: A review of theory and applications. IEEE Access 2021, 9, 82031–82057. [Google Scholar] [CrossRef]
- Huang, Q.; Sun, J.; Ding, H.; Wang, X.; Wang, G. Robust liver vessel extraction using 3D U-Net with variant dice loss function. Comput. Biol. Med. 2018, 101, 153–162. [Google Scholar] [CrossRef]
- Yan, Q.; Wang, B.; Zhang, W.; Luo, C.; Xu, W.; Xu, Z.; You, Z. Attention-guided deep neural network with multi-scale feature fusion for liver vessel segmentation. IEEE J. Biomed. Health Inform. 2020, 25, 2629–2642. [Google Scholar] [CrossRef] [PubMed]
- Li, R.; Huang, Y.J.; Chen, H.; Liu, X.; Yu, Y.; Qian, D.; Wang, L. 3d graph-connectivity constrained network for hepatic vessel segmentation. IEEE J. Biomed. Health Inform. 2021, 26, 1251–1262. [Google Scholar] [CrossRef] [PubMed]
- Zhou, Y.; Zheng, Y.; Tian, Y.; Bai, Y.; Cai, N.; Wang, P. SCAN: Sequence-based context-aware association network for hepatic vessel segmentation. Med. Biol. Eng. Comput. 2024, 62, 817–827. [Google Scholar] [CrossRef]
- Fu, X.; Cai, N.; Huang, K.; Wang, H.; Wang, P.; Liu, C.; Wang, H. M-Net: A novel U-Net with multi-stream feature fusion and multi-scale dilated convolutions for hepatic ducts and hepatolith segmentation. IEEE Access 2019, 7, 148645–148657. [Google Scholar] [CrossRef]
- Yushkevich, P.A.; Gao, Y.; Gerig, G. ITK-SNAP: An interactive tool for semi-automatic segmentation of multi-modality biomedical images. In Proceedings of the 2016 38th Annual International Conference of the IEEE Engineering in Medicine and Biology Society (EMBC), Orlando, FL, USA, 16–20 August 2016; pp. 3342–3345. [Google Scholar]
- Chen, J.; Lu, Y.; Yu, Q.; Luo, X.; Adeli, E.; Wang, Y.; Lu, L.; Yuille, A.L.; Zhou, Y. Transunet: Transformers make strong encoders for medical image segmentation. arXiv 2021, arXiv:2102.04306. [Google Scholar]
- Vaswani, A.; Shazeer, N.M.; Parmar, N.; Uszkoreit, J.; Jones, L.; Gomez, A.N.; Kaiser, L.; Polosukhin, I. Attention is All you Need. arXiv 2017, arXiv:1706.03762. [Google Scholar]
- Dosovitskiy, A. An image is worth 16x16 words: Transformers for image recognition at scale. arXiv 2020, arXiv:2010.11929. [Google Scholar]
- Mehnatkesh, H.; Jalali, S.M.J.; Khosravi, A.; Nahavandi, S. An intelligent driven deep residual learning framework for brain tumor classification using MRI images. Expert Syst. Appl. 2023, 213, 119087. [Google Scholar] [CrossRef]
- Lai, W.S.; Huang, J.B.; Ahuja, N.; Yang, M.H. Fast and accurate image super-resolution with deep laplacian pyramid networks. IEEE Trans. Pattern Anal. Mach. Intell. 2018, 41, 2599–2613. [Google Scholar] [CrossRef] [PubMed]
- Setiadi, D.R.I.M. PSNR vs SSIM: Imperceptibility quality assessment for image steganography. Multimed. Tools Appl. 2021, 80, 8423–8444. [Google Scholar] [CrossRef]
- Walsh, J.; Othmani, A.; Jain, M.; Dev, S. Using U-Net network for efficient brain tumor segmentation in MRI images. Healthc. Anal. 2022, 2, 100098. [Google Scholar] [CrossRef]
- Wang, J.; Peng, Y.; Jing, S.; Han, L.; Li, T.; Luo, J. A deep-learning approach for segmentation of liver tumors in magnetic resonance imaging using UNet++. BMC Cancer 2023, 23, 1060. [Google Scholar] [CrossRef] [PubMed]
- Cao, H.; Wang, Y.; Chen, J.; Jiang, D.; Zhang, X.; Tian, Q.; Wang, M. Swin-unet: Unet-like pure transformer for medical image segmentation. In Proceedings of the European Conference on Computer Vision 2022, Tel Aviv, Israel, 23–27 October 2022; pp. 205–218. [Google Scholar]
- Imran, S.M.A.; Saleem, M.W.; Hameed, M.T.; Hussain, A.; Naqvi, R.A.; Lee, S.W. Feature preserving mesh network for semantic segmentation of retinal vasculature to support ophthalmic disease analysis. Front. Med. 2023, 9, 1040562. [Google Scholar] [CrossRef]
- AlSalmi, H.; Elsheikh, A.H. Automated seismic semantic segmentation using attention U-Net. Geophysics 2024, 89, WA247–WA263. [Google Scholar] [CrossRef]
- Wang, X.; Girshick, R.; Gupta, A.; He, K. Non-local neural networks. In Proceedings of the IEEE Conference on Computer Vision and Pattern Recognition 2018, Salt Lake City, UT, USA, 18–23 June 2018; pp. 7794–7803. [Google Scholar]
- Liu, Z.; Wang, L.; Wu, W.; Qian, C.; Lu, T. Tam: Temporal adaptive module for video recognition. In Proceedings of the IEEE/CVF International Conference on Computer Vision 2021, Montreal, BC, Canada, 11–17 October 2021; pp. 13708–13718. [Google Scholar]


Disclaimer/Publisher’s Note: The statements, opinions and data contained in all publications are solely those of the individual author(s) and contributor(s) and not of MDPI and/or the editor(s). MDPI and/or the editor(s) disclaim responsibility for any injury to people or property resulting from any ideas, methods, instructions or products referred to in the content. |
© 2025 by the authors. Licensee MDPI, Basel, Switzerland. This article is an open access article distributed under the terms and conditions of the Creative Commons Attribution (CC BY) license (https://creativecommons.org/licenses/by/4.0/).