Abstract
Assessment of a badminton player’s footwork is critical. However, the automated footwork assessment method is lacking. The purpose of the study is to investigate how seismographs can be used to collect vibration signals to locate the footsteps of a player on the badminton court. Four seismographs are positioned at the four corners of the badminton court to acquire the vibration signals of two players’ footsteps. After signal preprocessing, multiple features are extracted from the preprocessed vibration signals, including the maximum amplitude , the index of the maximum amplitude , and area under the waveform of the signal . The latter two features are selected to predict the localization of the footstep after correlation analysis of the features. A multilayer perceptron (MLP) and a support vector machine (SVM) are trained to combine all the features to predict the locations of the footsteps into one of the eighteen zones of the badminton court. Six-fold and leave-one-out (LOO) cross-validations are used to estimate the accuracy of the localization method. All three extracted features are correlated with the footstep location, and and are highly correlated. Both the six-fold and LOO cross-validations indicate that the overall accuracy is 98–99%, using either the MLP or the SVM. These promising results indicate that the proposed approach has a potential to trace badminton player’s footwork accurately and future studies are warranted to investigate the utilities of the vibration signals in badminton player’s footwork assessment.
1. Introduction
Badminton is a widely played racket sport [1]. In the fast-paced sport, a player has to move quickly enough to cover all corners of the court to return the shuttlecock, usually within 1 s [1]. Different foot movements have to be used, including chasse step, shuffle, split-step, half lunge, forward lunge, scissors kick, among others, since the game requires quick reaction time, speed, and agility [2]. Despite the importance of footwork, only a limited number of studies focus specifically on assessment of players’ movement on the court [3].
Traditionally, quantitative assessment of badminton footwork relied heavily on human observations, with protocols developed to extract the on-court movement from videotaped competitive games [3,4]. The utility of the protocols was limited because the data collection was labor-intensive and time-consuming [5,6].
More technically advanced studies introduced computer-based video processing algorithms. For example, binocular cameras were used to study different badminton lunge techniques [7]. In a separate study, a 3D motion capture system with eight cameras was employed to investigate the right-forward lunging steps [8]. More recently, a monocular vision system was developed to detect when the shuttlecock was hit by the use of the position information of a badminton player [9,10]. The skeleton of the player was estimated to determine the player’s position [11]. However, although the position of the player was estimated, these studies often omitted detailed assessment of footwork quality.
In recent years, wearable sensor-based human activity recognition gained traction in sports sciences [12,13,14,15,16]. Although offering potential in sports training or relevant fields [17,18,19,20,21], these sensors must be affixed to players’ bodies, likely impeding natural movement. Furthermore, there remains a scarcity of research focusing on the quality of badminton footwork.
For the purpose of developing a new method to assess badminton footwork, in this pilot study, the possibility is explored that seismographs [22,23] might be used to locate a badminton player’s footsteps on the court. The proposed method offers several potential advantages over existing human action recognition approaches. First, it is a passive technique that require no player compliance and does not interfere with gameplay. Second, the measuring system can be deployed quickly and easily, minimizing setup time. Third, the signal processing method is straightforward and much less demanding compared with previous techniques. With multiple features of the vibration signals recorded by the seismographs, the proposed method is able to localize the on-court footsteps accurately and more thorough investigations are warranted to reveal the potential of the approach.
2. Materials and Methods
2.1. Seismographs
Four compact all-in-one digital posthole wide-band seismographs (Meridian, Nanometrics, ON, Canada) were used to detect and record the vibration signals generated by footsteps on a badminton court. Inside the seismograph, the Trillium compact seismometer serves as the vibration sensor, and 24-bit analog-to-digital converters are used to sample the vibration signals at a given frequency in three perpendicular directions simultaneously. The sensitivity of the device can be set from 300 to 3000 counts/(μm/s) at an accuracy of 1%. The sample rates can be set to 1 to 5000 samples per second.
2.2. Test Badminton Court
A wooden indoor badminton court, which was the only court type available to the research team, was used to test the performance of the seismographs. As shown in Figure 1, four Meridian digital seismographs are placed at each corner of the badminton court to collect vibration signals independently and simultaneously.
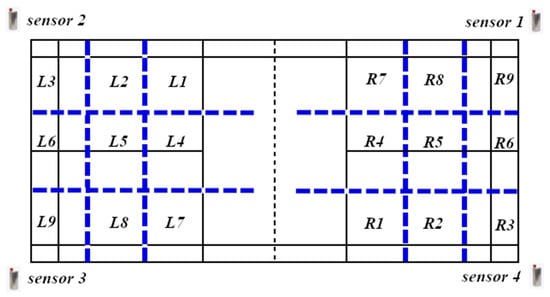
Figure 1.
The placement of the 4 seismographs (sensors 1–4) on the test badminton court and the court division for footstep localization (zones 1–9). Both left (L) and right (R) half courts are divided into 9 zones in the same way. The black solid lines are the original badminton court lines, while the black dashed line indicats the location of the net, and the dashed blue lines are virtually placed to indicate the zonal devision.
Each side of the court is divided into 9 zones, as demonstrated in Figure 1. Zones 1, 4, and 7 represent the left, center, and right net courts, respectively. Zones 2, 5, and 8 represent the left, center, and right middle courts, respectively, and zones 3, 6, and 9 represent the left, center, and right deep courts, respectively.
2.3. Data Acquisition
After all seismographs were placed in position (Figure 1), each seismograph was configured for synchronization. All seismographs started to record at the same time once the data acquisition experiment started. The orientation of the seismographs was adjusted so that channels 1–3 were in north–south, east–west, and vertical directions, respectively. Therefore, both channels 1 and 2 were sensitive to the compressive wave signals while channel 3 was sensitive to the transverse wave. Seismographic data were acquired continuously for the entire experiment. Vibration signals were digitized at 200 Hz (or equivalently, a sampling interval of 0.005 s) in three perpendicular directions. Data were saved in MiniSEED format for further analysis.
Two adult male players are enrolled as the participants. During the experiment, the players independently placed footsteps in the 18 zones (L1–L9 on the left half and R1–R9 on the right half of the test court) on the test badminton court to generate vibration signals. Inside each of the 18 zones, the footsteps were repeated 6 times, resulting in a well-balanced dataset of 108 footsteps. Since the footstep signals from different players did not appear differently based on visual inspection, the player information was not further analyzed.
2.4. Data Preprocessing
Since the raw data were subject to drifting, a median filter was used to remove the drifting baselines in all channels for each of the seismographs. The structuring element of the median filter was empirically selected.
Vibration signals in three orthogonal directions were combined following the square root of sum of squares rule. Mathematically, the combined signal is calculated by
where S represents the combined vibration signal, , , and are the vibration signals recorded in three orthogonal directions, respectively.
The combined vibration signal was cropped into segments, corresponding to each of the heavy steps. The segments were 1 s long and the initial starting time was manually aligned.
2.5. Feature Extraction
The combined vibration signal segments were further processed and three features were extracted, including the maximum amplitude, the index of the maximum amplitude, and the area under the waveform of the signal segment.
The maximum amplitude of a combined vibration signal segment was extracted by
where max(•) represents the operation finding the maximum of a given combined vibration signal segment .
The index of the maximum amplitude of a combined vibration signal segment was defined as
where argmax(•) returns the index of the maximum of the combined vibration signal segment .
The area under the waveform of a combined vibration signal segment was calculated by
which means the sum of the amplitude of the combined vibration signal segment .
2.6. Correlation Analysis
The correspondence between each of the extracted features and the location of the footsteps was plotted graphically to demonstrate how likely the feature was able to predict the footstep location. Then, Pearson’s correlation coefficients were calculated to quantitatively assess the correlation between the extracted features and the distance from the footstep location to the seismographs.
In addition, the Pearson correlation coefficients were calculated between the extracted features. The correlation helped select a compact feature set to localize footstep localization accurately.
2.7. Footstep Localization with Machine Learning Methods
A multi-layer perceptron (MLP) and a support vector machine (SVM) were trained to predict the footstep location. This was a multi-class classification problem since the classifier needed to classify the footstep to 1 of the 18 zones through 12 features (the 3 extracted features of the 4 seismographs at the corners).
For the MLP, the number of nodes in the hidden layer was set to 100 to ensure the flexibility of the model. The maximum number of the training iteration was set to 1000 to allow convergence of the model training. The activation function was the rectified linear unit. The regularization parameter was set to 0.0001 and the learning rate was set to a constant of 0.001. Mean squared error was used as the loss function. Additionally, the Adam algorithm was used to optimize the MLP, with a momentum of 0.9. The training batch size was 108 and the error tolerance was set to 0.0001.
For the SVM, a linear kernel was used for simplicity. The regularization parameter was set to 1 and the one-vs-rest strategy was used to class data into 18 different zones. A tolerance of 0.001 was used to end the optimization of the classifier.
For both classifiers, the 12 features were demeaned and the variance was normalized to unit. After all three features were used to train the classifiers, a more compact feature set was then used, including and from the 4 seismographs, to repeat the above experiment for comparison.
2.8. Assessment of the Locazation Method
To estimate the performance of the classification, cross-validation methods were employed. In each iteration of the 6-fold cross-validation method, each of the 6 repeated footsteps at the 18 zones was partitioned randomly into the validation dataset while other signal segments were used to train the classifiers. The classification results of the validation dataset were collected and aggregated over the 6 iterations as a whole to estimate the accuracy of the classifiers. In the leave-one-out (LOO) cross-validation method, only 1 of the 108 signal segments was used as the validation segment and the rest segments were used as the training dataset. After each of the signal segments was used as the validation segment, all validation results were used together to estimate the accuracy of the classifiers.
2.9. Statistical Analysis
The accuracy of the footstep localization was estimated as the percentage of correctness,
To compare two different accuracy values calculated on the same set of data, the McNemar’s test was used to estimate statistical significance [24]. Since the difference between the two accuracy values can be relatively small, the exact binomial test was utilized to estimate the p-value.
3. Results
3.1. Original and Preprocessed Vibration Signals
One channel of the original vibration signals of the seismograph #2 is shown in Figure 2, along with the demeaned version. It is clear that after the demeaning, the preprocessed signal demonstrates the nature of the vibration better. From the plot, it is also clear that the vibration of a footstep lasts less than 0.5 s.
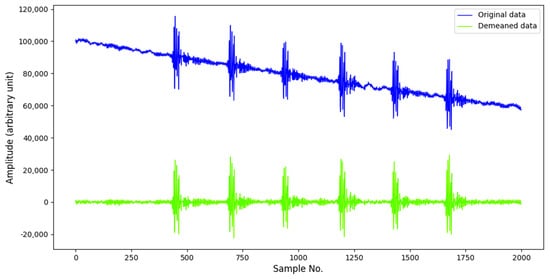
Figure 2.
The vibration signal waveform of the second seismograph in the first (X) of the three orthogonal directions. After removing the drifting baseline in the original data (blue), the amplitude of the demeaned waveform (green) reflects the nature of the vibration better. In the plot, one can identify six repeated footsteps, roughly 1.25 s apart.
Figure 3 depicts vibration signals for a single footstep. Shown in the figure are vibration signals in three orthogonal directions of a seismograph and the combined signal following the square root of sum of squares rule. In general, the vibration in the third direction, or z direction, tends to be stronger than that in the other directions. The signal spectra in the three directions tend not to be substantially different.
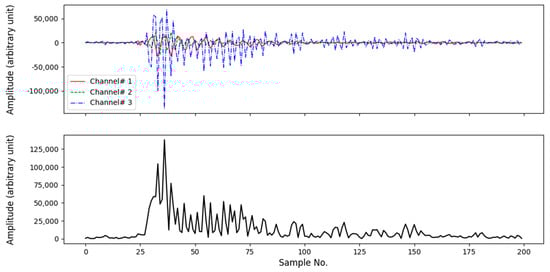
Figure 3.
The demeaned vibration signals in three orthogonal directions (upper panel) and the combined signal (lower panel) following the square root of sum of squares rule.
In Figure 4, the combined vibration signals generated from zone R8 are plotted for the four seismographs. It can be identified that the times of arrival are different for different seismographs, because the distances between the location of the footstep and seismographs are different. The vibration wave reached seismograph #1 earliest and #3 latest. Meanwhile, the amplitudes of the signals are also quite different, as demonstrated clearly in the figure. These observations were the bases for identifying features for accurate footstep localization from the vibration signals.
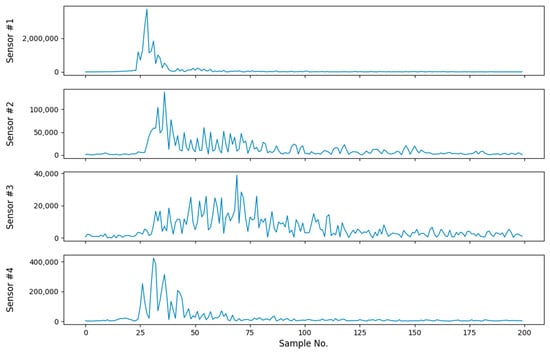
Figure 4.
Combined signals from the 4 seismographs (sensors #1–4) for the same footstep. Since the footstep is in zone R8, the distances from the footstep to the seismographs are not the same. Therefore, the waveforms exhibit different characteristics.
3.2. Extracted Features
The extracted features reflected information about the location of the corresponding footsteps. Shown in Figure 5 are the distributions of the three features against different footstep locations. Only two seismographs and six locations in the same south–north offset are included in the plots for clarity. The relation of the feature distribution against locations is similar for other seismographs.
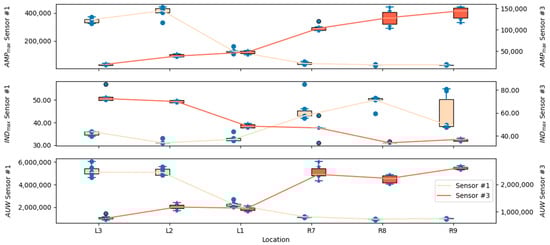
Figure 5.
The distributions (boxplots) of the three extracted features, AMPmax (top), INDmax (middle), and AUW (bottom), change with different footstep locations for seismographs #1 (peach puff) and #3 (tomato red). The tendencies of the features extracted from other seismographs are similar.
The changing tendency of the maximum amplitude, , against the footstep location reflects the nature that the energy of the vibration diminishes with the distance.
The index of the maximum amplitude, , reflected the time of arrival for the vibration wave propagating from the footstep location to the seismograph. Therefore, a similar tendency can be observed in Figure 5, with a reversed polarity.
The curves of the last feature, the area under the curve, , are similar to those of . This is probably due to the reason that both features are monotonically related to the energy of the vibration signal.
All three features exhibit graphically the correlation with the zonal information, as exemplified in Figure 5. Additionally, correlation analyses confirmed the observation. Table 1 lists the Pearson’s correlation coefficients between the extracted features and the distances between zones and the seismographs.

Table 1.
The Pearson correlation coefficients (p-value) between the extracted features and the distance from the corresponding zone of the footstep to the seismographs.
Table 2 lists the Pearson correlation coefficients between the extracted features. It is clear that the maximum amplitude, , and the area under the waveform, , are highly correlated. In other words, these two features probably carry similar information. Due to this reason, the area under the waveform was used to combine with the index of the maximum amplitude, , for the next localization task.
Table 2.
The Pearson correlation coefficients (p-value) between the extracted features.
3.3. Localization Accuracy
For each of the two classifiers, the SVM and the MLP, the accuracy estimated from the six-fold and LOO cross-validation were almost identical.
For the six-fold cross-validation, the accuracy of the MLP and the SVM were estimated as 99% (107/108) and 98% (106/108), respectively. As shown in Table 3, the MLP makes only one mistake, a vibration segment of a footstep in zone L1 being classified mistakenly into zone L4. The same segment was misclassified by the SVM as well, but mistakenly classified into zone L5, instead. The other mistake of the SVM came from a vibration segment of a footstep in zone R5 but classified incorrectly into zone R1 (Table 4).
Table 3.
The confusion matrix of the multi-layer perceptron, estimated from six-fold cross-validation.
Table 4.
The confusion matrix of the support vector machine, estimated from six-fold or leave-one-out cross-validation.
The difference between the two accuracy values was not statistically significant, with a p-value of 1.00, indicating that the performance difference between the two classifiers was not statistically significant.
For the LOO cross-validation, both the classifiers yielded an accuracy of 98% (106/108). Both classifiers made mistakes on the same two segments. Both classifiers misclassified a footstep in zone R5 into zone R1. The MLP misclassified an L1 footstep into L4, while the SVM misclassified the L1 footstep into L5 (Table 4).
For reference, if all three features were used to train the classifiers, the MLP and the SVM yielded an accuracy of 99% (107/108) and 98% (106/108), respectively, no matter which of the two cross-validation methods was used. The mistakes were identical to those in the above six-fold cross-validation case when two features were merged to predict the footstep location.
4. Discussion
Although the footwork of a badminton player is critical, up to now, the most reliable approach to evaluate a player’s footwork is still based on manual notation on badminton footages [3,4,5,6]. To overcome the drawbacks of the manual process, the ultimate goal of the research is to develop an automated approach to assess the footwork quality of badminton players. For the current pilot study, the objective is to explore how likely seismographs may be helpful in localizing accurately the footsteps of badminton players on the court [22,23].
The proposed approach is based on the hypothesis that the locations of a player’s footsteps on the badminton court can be accurately recovered by measuring the vibration signals at multiple places outside the court with seismographs [25], and this pilot study presents promising results that support the hypothesis. In previous studies, similar conclusions were obtained for occupancy detection [26] or pedestrian identification [25]; also, the experiments were confined in a narrow indoor space.
The excellent localization performance comes from the fact that the vibration wave generated by the footstep on the court propagated uniformly to all directions unless the floor vibration transmission property was anisotropic. This is the base of the time difference of arrival [27,28]. However, the actual relation could be impaired due to a variety of reasons, including the anisometric construction of the flooring, the different sensitivities of the seismographs, the boundary conditions of the building, among others [23]. Fortunately, the actual relation can be implicitly captured with the use of machine learning methods [23,25,28,29].
In the current study, both the SVM and MLP classifiers have been shown to be able to predict the localizations of the footsteps using the collected vibration signals, with an estimated accuracy greater than 98%. Two different cross-validation methods are used to ensure the reliability of the estimated accuracy. The classifiers correctly classified 106–107 footsteps out of 108 well-balanced footsteps collected from 18 different zones. Apparently, more sophisticated but computationally demanding models can be used to fulfil the same purpose, as shown in some previous studies [23,29]. In this specific pilot study, however, since the accuracy is approaching to perfection, the benefits of using a more sophisticated one may not justify the extra efforts [28]. Therefore, the investigation of more sophisticated classifiers is postponed to future studies.
Different from some previous studies, where regression analysis was often performed [23,26], the current pilot study treats the footstep location problem as a multi-class classification task, in which footsteps are classified into 18 different zones, as used in a previous study [10]. Part of the reason is that the ultimate goal of the study is to evaluate the quality of badminton footwork. Players are more concerned about the speeding moving to the corners or sidelines and getting back to the base position [10,29].
In this pilot study, it is successfully demonstrated that the proposed method can be used to localize a player’s footsteps on the badminton court. Apparently, if more than one player is present, more complicated signal-processing techniques are required to separate them [28]. Although the proposed method in the current shape can be used to assess a single player’s footwork, say, in a training section, the ultimate goal of the study is to evaluate the quality of footwork in a competitive game, usually with 2–4 players on the court.
One of the advantages of the proposed method is that it does not need player compliance, which means the players of the game do not wear anything to trace their actions. This is important since wearable devices or gadgets may interfere with the performance of the players. Therefore, more authentic data about the footwork can be collected and analyzed, which in turn would be more informative for players or their coaching teams.
Another advantage is that the proposed approach does not require modification of any aspects of the game, the court, and the referees. Potentially, the seismographs can be placed far enough from the court to leave sufficient space for the players to compete. This plug-and-play property helps reduce the potential expenditure, complexity, and time when using the proposed technique.
The study has some limitations. First of all, only single footstep signals were investigated and analyzed. In a real game, however, multiple players may move around the badminton court, and two or more footsteps may generate vibration signals at the same time. How to separate multiple footsteps from the seismic signals can be challenging. Second, the vibration segments were manually cropped. Finding an automated real-time way to identify the triggering features would help improve the efficiency and promptness. Third, the vibration signals acquired by the digital seismographs in orthogonal channels were combined, and channel-dependent information helpful for localization might be lost. Fourth, influences of other factors, such as badminton courts other than a wooden floor, participants, competitive levels, among others, also need to be further investigated.
5. Conclusions
In this feasibility study, a footstep localization technique is proposed based on seismic signals acquired with four seismographs. The principles of the proposed technique are sound and the data processing methods are straightforward. Although this is only a pilot study to verify the feasibility and the conclusion needs to be further verified, the potential of the technique should be clearly recognized. Based on the current study, future experiments are being designed to track multiple players’ footsteps on the same court. With proper development, the proposed approach may eventually provide badminton players and coaches a useful tool to evaluate players’ footsteps quantitatively and automatically in a game or during training. Further investigations are guaranteed to exploit the technique for accurate and quantitative assessment of badminton players’ footwork.
Author Contributions
Conceptualization, Y.Y., W.Y. and Y.P.; methodology, Y.Y., W.Y. and Y.P.; software, W.W. and Y.P.; formal analysis, W.W. and Y.P.; investigation, W.Y. and Y.P.; resources, Y.Y. and W.Y.; data curation, W.Y. and Y.P.; writing—original draft preparation, Y.Y. and Y.P.; writing—review and editing, Y.Y., W.W., W.Y. and Y.P.; visualization, W.W. and Y.P.; supervision, Y.Y. and Y.P.; project administration, Y.Y. and W.Y.; funding acquisition, Y.Y. All authors have read and agreed to the published version of the manuscript.
Funding
This research was funded by “the Fundamental Research Funds for the Central Universities”, grant number G22JBZX00010.
Data Availability Statement
The raw data supporting the conclusions of this article will be made available by the authors on request.
Acknowledgments
The authors want to thank Huiyong Liu and Yuting Sun for their technical support.
Conflicts of Interest
The authors declare no conflicts of interest.
References
- Phomsoupha, M.; Laffaye, G. The Science of Badminton: Game Characteristics, Anthropometry, Physiology, Visual Fitness and Biomechanics. Sports Med. 2015, 45, 473–495. [Google Scholar] [CrossRef]
- Phomsoupha, M.; Laffaye, G. Shuttlecock velocity during a smash stroke in badminton evolves linearly with skill level. Comput. Methods Biomech. Biomed. Eng. 2014, 17, 140–141. [Google Scholar] [CrossRef]
- Valldecabres, R.; Casal, C.A.; Chiminazzo, J.G.C.; de Benito, A.M. Players’ On-Court Movements and Contextual Variables in Badminton World Championship. Front. Psychol. 2020, 11, 1567. [Google Scholar] [CrossRef] [PubMed]
- Valldecabres, R.; de Benito, A.M.; Losada, J.L.; Casal, C.A. Badminton World Championship stress zones and performance factors: The key to success through log-linear analysis. J. Hum. Sport Exerc. 2022, 17, 10–21. [Google Scholar] [CrossRef]
- Valldecabres, R.; de Benito, A.-M.; Casal, C.A.; Pablos, C. 2015 Badminton World Championship: Singles final men’s vs women’s behaviours. In Proceedings of the 11th World Congress of Performance Analysis of Sport, Alicante, Spain, 16–18 November 2016; pp. S775–S788. [Google Scholar] [CrossRef]
- Abdullahi, Y.; Coetzee, B. Notational singles match analysis of male badminton players who participated in the African Badminton Championships. Int. J. Perform. Anal. Sport 2017, 17, 1–16. [Google Scholar] [CrossRef]
- Kuntze, G.; Mansfield, N.; Sellers, W. A biomechanical analysis of common lunge tasks in badminton. J. Sports Sci. 2010, 28, 183–191. [Google Scholar] [CrossRef] [PubMed]
- Mei, Q.; Gu, Y.; Fu, F.; Fernandez, J. A Biomechanical Investigation of Right-Forward Lunging Step Among Badminton Players. J. Sports Sci. 2017, 35, 457–462. [Google Scholar] [CrossRef] [PubMed]
- Tanaka, N.; Shishido, H.; Suita, M.; Nishijima, T.; Kameda, Y.; Kitahara, I. Detection of Hitting Point Area Using Footwork Trajectory in Badminton Video. In Proceedings of the 2022 IEEE 11th Global Conference on Consumer Electronics (GCCE), Osaka, Japan, 18–21 October 2022; pp. 74–78. [Google Scholar] [CrossRef]
- Yoshikawa, Y.; Shishido, H.; Suita, M.; Kameda, Y.; Kitahara, I. Shot detection using skeleton position in badminton videos. In International Workshop on Advanced Imaging Technology (IWAIT) 2021; Lie, W.-N., Kemao, Q., Kim, J.-G., Nakajima, M., Eds.; Online Only; SPIE: Yokohama, Japan, 2021; p. 17. [Google Scholar] [CrossRef]
- Cao, Z.; Hidalgo, G.; Simon, T.; Wei, S.E.; Sheikh, Y. OpenPose: Realtime Multi-Person 2D Pose Estimation Using Part Affinity Fields. IEEE Trans. Pattern Anal. Mach. Intell. 2021, 43, 172–186. [Google Scholar] [CrossRef]
- Luptáková, I.D.; Kubovčík, M.; Pospíchal, J. Wearable Sensor-Based Human Activity Recognition with Transformer Model. Sensors 2022, 22, 1911. [Google Scholar] [CrossRef] [PubMed]
- Sahoo, K.K.; Ghosh, R.; Mallik, S.; Roy, A.; Singh, P.K.; Zhao, Z. Wrapper-based deep feature optimization for activity recognition in the wearable sensor networks of healthcare systems. Sci. Rep. 2023, 13, 1–18. [Google Scholar] [CrossRef] [PubMed]
- Luwe, Y.J.; Lee, C.P.; Lim, K.M. Wearable sensor-based human activity recognition with ensemble learning: A comparison study. Int. J. Electr. Comput. Eng. (IJECE) 2023, 13, 4029–4040. [Google Scholar] [CrossRef]
- Duan, Y.; Fujinami, K. Effect of Combinations of Sensor Positions on Wearable-Sensor-Based Human Activity Recognition. Sens. Mater. 2023, 35, 2175–2193. [Google Scholar] [CrossRef]
- Luwe, Y.J.; Lee, C.P.; Lim, K.M. Wearable Sensor-Based Human Activity Recognition with Hybrid Deep Learning Model. Informatics 2022, 9, 56. [Google Scholar] [CrossRef]
- Zhao, X.; Li, S. A Biomechanical Analysis of Lower Limb Movement on the Backcourt Forehand Clear Stroke among Badminton Players of Different Levels. Appl. Bionics Biomech. 2019, 2019, 1–8. [Google Scholar] [CrossRef] [PubMed]
- Lin, K.-C.; Wei, C.-W.; Lai, C.-L.; Cheng, I.-L.; Chen, N.-S. Development of a badminton teaching system with wearable technology for improving students’ badminton doubles skills. Educ. Technol. Res. Dev. 2021, 69, 945–969. [Google Scholar] [CrossRef]
- Peralta, D.; Van Herbruggen, B.; Fontaine, J.; Debyser, W.; Wieme, J.; De Poorter, E. Badminton stroke classification based on accelerometer data: From individual to generalized models. In Proceedings of the 2022 IEEE International Conference on Big Data (Big Data), Osaka, Japan, 17–20 December 2022; pp. 5542–5548. [Google Scholar] [CrossRef]
- Mekruksavanich, S.; Jantawong, P.; Hnoohom, N.; Jitpattanakul, A. Badminton Activity Recognition and Player Assessment based on Motion Signals using Deep Residual Network. In Proceedings of the 2022 IEEE 13th International Conference on Software Engineering and Service Science (ICSESS), Beijing, China, 21–23 October 2022; pp. 80–83. [Google Scholar] [CrossRef]
- Deng, J.; Zhang, S.; Ma, J. Self-Attention-Based Deep Convolution LSTM Framework for Sensor-Based Badminton Activity Recognition. Sensors 2023, 23, 8373. [Google Scholar] [CrossRef] [PubMed]
- Yang, Y.; Cui, Y.; Yan, W. An Experimental Research on Microseismic Monitoring Technology in Detecting the Contact Time of Badminton Amateurs Lunge. In Proceedings of the 2021 International Conference on Information Technology and Contemporary Sports (TCS), Guangzhou, China, 15–17 January 2021; pp. 524–548. [Google Scholar] [CrossRef]
- Chen, R.; Zhu, Y.; Chen, Q.; Zhu, C. Motion Target Localization Method for Step Vibration Signals Based on Deep Learning. Appl. Sci. 2024, 14, 9361. [Google Scholar] [CrossRef]
- McNemar, Q. Note on the sampling error of the difference between correlated proportions or percentages. Psychometrika 1947, 12, 153–157. [Google Scholar] [CrossRef]
- Pan, S.; Yu, T.; Mirshekari, M.; Fagert, J.; Bonde, A.; Mengshoel, O.J.; Noh, H.Y.; Zhang, P. FootprintID: Indoor Pedestrian Identification through Ambient Structural Vibration Sensing. Proc. ACM Interact. Mob. Wearable Ubiquitous Technol. 2017, 1, 1–31. [Google Scholar] [CrossRef]
- Li, F.; Clemente, J.; Valero, M.; Tse, Z.; Li, S.; Song, W. Smart Home Monitoring System via Footstep-Induced Vibrations. IEEE Syst. J. 2020, 14, 3383–3389. [Google Scholar] [CrossRef]
- Dong, Y.; Liu, J.; Noh, H.Y. GaitVibe+: Enhancing Structural Vibration-Based Footstep Localization Using Temporary Cameras for in-Home Gait Analysis. In Proceedings of the 20th ACM Conference on Embedded Networked Sensor Systems, Boston, MA, USA, 6–9 November 2022; Association for Computing Machinery: New York, NY, USA, 2023; pp. 1168–1174. [Google Scholar] [CrossRef]
- Drira, S.; Pai, S.G.; Reuland, Y.; Olsen, N.F.; Smith, I.F. Using footstep-induced vibrations for occupant detection and recognition in buildings. Adv. Eng. Inform. 2021, 49, 101289. [Google Scholar] [CrossRef]
- Jannet, K.; Sunar, M.S.; Molla, M.I.; Bin As’Ari, M.A. A Deep Learning Approach to Badminton Player Footwork Detection Based on YOLO Models: A Comparative Study. In Proceedings of the 2024 IEEE 8th International Conference on Signal and Image Processing Applications (ICSIPA), Kuala Lumpur, Malaysia, 3–5 September 2024; pp. 1–6. [Google Scholar] [CrossRef]
Disclaimer/Publisher’s Note: The statements, opinions and data contained in all publications are solely those of the individual author(s) and contributor(s) and not of MDPI and/or the editor(s). MDPI and/or the editor(s) disclaim responsibility for any injury to people or property resulting from any ideas, methods, instructions or products referred to in the content. |
© 2025 by the authors. Licensee MDPI, Basel, Switzerland. This article is an open access article distributed under the terms and conditions of the Creative Commons Attribution (CC BY) license (https://creativecommons.org/licenses/by/4.0/).