Abstract
Recent developments in next-generation sequencing technology have led to the creation of extensive, open-source protein databases consisting of hundreds of millions of sequences. To render these sequences applicable in biomedical applications, they must be meticulously annotated by wet lab testing or extracting them from existing literature. Over the last few years, researchers have developed numerous automatic annotation systems, particularly deep learning models based on machine learning and artificial intelligence, to address this issue. In this work, we propose a transformer-based fusion model capable of predicting Gene Ontology (GO) terms from full-scale protein sequences, achieving state-of-the-art accuracy compared to other contemporary machine learning annotation systems. The approach performs particularly well on clustered split datasets, which comprise training and testing samples originating from distinct distributions that are structurally diverse. This demonstrates that the model is able to understand both short and long term dependencies within the protein’s structure and can capture sequence features that are predictive of the various GO terms. Furthermore, the technique is lightweight and less computationally expensive compared to the benchmark methods, while at the same time unaffected by sequence length, rendering it appropriate for diverse applications with varying sequence lengths.
1. Introduction
The swift advancement of sequencing technologies has accelerated the growth of extensive protein sequence databases and made it both economically viable and practical to build large protein repositories both in the private domain and under open source licenses. The substantial augmentation in the accessibility of protein sequences led to the establishment of protein databases such as Uniprot, with hundreds of millions of data points. Each day, about ten thousand new proteins are added to the ever-expanding global public protein databases [1]. To maximize the utility of these protein databases, they must be accurately annotated by the scientific community. Domain experts and curators exert considerable effort to manually annotate these protein sequences to address this issue; nonetheless, this procedure is exceedingly slow and resource-intensive, resulting in the successful annotation of approximately only 0.03% of proteins available in public databases [1].
The demand for expedited annotation of extensive protein datasets has led to the emergence of many automated and semi-automatic approaches. Various annotation systems have been developed over the years, employing distinct approaches to label proteins. Moreover, accurate annotation of protein sequences plays a pivotal role in drug discovery, precision medicine, and biotechnology, where functional insights into novel proteins accelerate therapeutic and industrial applications. Methodological innovation across AI/ML domains like interpretable multi-objective models in healthcare [2] highlights the broader research trajectory. The proposed model, ProtGO, aligns with this trend by balancing accuracy, computational efficiency, and potential interpretability.
All codes and data used in the study are publicly available in the GitHub repository through the following link: https://github.com/azwad-tamir/ProtGO (accessed on 13 August 2025).
2. Background
2.1. Related Research
Over the years, several approaches have been developed for the computational annotation of protein sequences. One approach involved comparing the sequence of the target protein to other previously identified proteins to identify commonalities. The target received identical annotation to the known protein if substantial sequence segments between them exhibited alignment. BLAST [3] was among the most effective tools employing this methodology for annotating protein sequences.
A subsequent prevalent approach for protein annotation employed functional features to characterize target proteins. A protein is ascribed a certain function if it possesses the pattern linked to that function. Subsequent iterations of these models began employing profile Hidden Markov Models (HMMs), enhancing their robustness and capacity to identify soft matches [4,5]. These models calculated the likelihood of a new sequence possessing a specific function if the likelihood exceeded a set threshold. They are rapid and effective, resulting in numerous notable protein databases, such as Pfam and InterPro, utilizing them to annotate their extensive protein collections [6]. However, these models, while rapid and precise, possess certain limits.
Conventionally, they calculated the likelihood of each functional motif separately, resulting in reduced efficiency and accuracy when different functional groups shared a common characteristic. Furthermore, the signatures employed to identify a certain function in a protein sequence frequently necessitate human curator involvement and are not entirely automated, rendering the entire process quite tedious and laborious. These constraints highlight the need for additional research in the area to develop more efficient annotation systems to manage the increasing volume of proteins that are continuously added to databases everyday.
Machine learning algorithms, particularly a variant known as deep learning characterized by models with multiple hidden layers, have garnered significant interest recently due to their success across various applications. Initial deep learning models focused on computer vision and machine translation applications, but they rapidly diversified into additional domains such as medical imaging and bioinformatics.
The functioning of a deep learning model typically comprises of two phases. The initial phase involves training, during which labeled and semi-labeled data are used to ascertain the model’s weights, succeeded by the inference phase, where the acquired weights are employed to classify an unknown sample. The latter layers of models, which engage in more generalized functions, may be utilized across analogous tasks. This approach is referred to as transfer learning, wherein, rather than training a model from scratch for a new task, the model’s weights can be initialized from a comparable pretrained application. Subsequent to the transferring process, the model weights undergo training on the fresh data in a process referred to as fine-tuning. This method yields improved accuracy with reduced training data, requiring less training time and lower computational resources [7].
In light of the success of deep learning models across diverse domains and applications, numerous studies have been conducted to implement them in protein functional prediction and classification tasks [8,9,10,11,12,13,14,15,16,17,18,19]. Additionally, deep learning models have been applied to protein structure prediction [20,21,22,23,24] and protein design [25,26,27,28,29].
Patterns present in the protein sequences or motifs often correspond to conserved structural regions that underlie specific molecular functions [6]. For example, kinase domains are motifs linked to phosphorylation activity [1]. As a result, it is important for a computational model to be able to distinguish between different motifs in order to predict GO term annotations from protein sequences.
A notable breakthrough in protein structure prediction was made by AlphaFold 3 [30], which extended the capabilities of AlphaFold 2 [31] by integrating multiple molecular modalities (proteins, ligands, nucleic acids, small molecules, etc.) into a unified deep learning framework. While AlphaFold 3 focuses primarily on structure prediction, its ability to accurately model protein–protein and protein–ligand interactions has significant implications for downstream functional annotation tasks, as structural context often informs GO term assignment.
A significant advancement in protein annotation commenced when researchers began inputting substantial volumes of unstructured raw data into extensive deep learning models. This exempted the models from human biases, facilitated the identification of previously unrecognized patterns, and mitigated bottlenecks resulting from the time-consuming curation process. Recent advancements in this domain encompass DeepEC [32], an ensemble Convolutional Neural Network (CNN) model that annotates protein sequences with Enzyme Commision (EC) numbers.
However, it can only annotate sequences shorter than one thousand units and necessitates a minimum of ten data points from a single class for optimal functionality. Other notable advancements in the area include CNN-based ensemble models for annotating unaligned protein domain sequences [33], the application of a transformer-based model to enhance both accuracy and computational efficiency [34], the training of various models to comprehend protein sequence structures [35], and the development of a transformer-based model for predicting protein functionality [36].
Recent works also include ESM-2 [37], a large-scale protein language model that significantly improves annotation accuracy; ProstT5 [38], which demonstrates zero-shot capabilities; PFresGO [39], which integrates the GO structure into embeddings; and DPFunc [40], which outperforms prior methods across multiple GO benchmarks. While these models achieve strong performance, they often suffer from high computational cost, limited interpretability, and challenges in generalization across diverse datasets.
2.2. Contribution and Novelty
A large number of studies have been conducted in recent times concerning the annotation of protein sequences. However, these studies do not address whole protein sequences, which are often significant for bioinformatics applications. This issue has been addressed in Proteinfer [41], which uses both single and ensemble CNN architectures to annotate whole protein sequences with GO terms and Enzyme Commission (EC) numbers.
We have previously developed a ProtBert [35]-based model named ProtEC [42] to accurately annotate EC numbers with high accuracy. This work further builds upon that to propose a classification-based fusion model to predict Gene Ontology (GO) terms from full-scale protein sequences that achieves state-of-the-art performance while at the same time addressing some of the major shortcomings of the previous models.
This study introduces ProtGO, a parallel transformer encoder fusion model, with its contributions summarized as follows:
- Achieves state-of-the-art accuracy in the GO annotation of full-length sequences.
- Uses a single, lightweight model rather than ensembles, reducing computational demands.
- The training time, GPU memory, and other computational resources needed to utilize the model are considerably lower compared to other similar methods.
- Employs automated hyperparameter optimization without a development set.
- A superior comprehension of the protein sequence structure, which is demonstrated by the minimal accuracy disparity between the random and clustered dataset splits.
- Negligible dependency on the input sequence length, exhibiting robustness and the ability to be deployed in applications with significant input sequence length variability.
From these contributions, we pose the following research questions:
- Can a lightweight, single-model transformer outperform ensemble-based approaches in GO annotation?
- How robust is ProtGO to distributional shifts, such as clustered vs. random splits?
- Does ProtGO sustain accuracy across varying protein sequence lengths?
The paper is structured into five sections. The first section presents an overview of the study. The second section provides an appropriate literature review and outlines the novelty and contribution of the work along with the relevant research questions. The third section delineates the model architecture comprehensively and explains the training and evaluation techniques. The fourth section presents the experimental results of the proposed model and the performance comparison with other benchmark methods. Finally, the last section concludes the work and offers additional discussions on potential future research directions.
3. Methodology
This section first describes the input and output of the model, the dataset being used in this study, and the steps taken to preprocess the dataset. Next, the architecture of the proposed model is described in detail, along with the training and evaluation steps and the experimental setup.
3.1. GO Terms
GO terms are keywords used to annotate protein sequences which contain a lot of information like the gene that was used to transcribe the protein molecule, the type of organism which primarily uses the protein, the functionality of the protein, the biological processes and pathways connected to it, etc. The annotation of the protein sequence with GO terms is of utmost importance to the biological community as it helps identify the characteristics and properties of the protein along with its usage and functions within an organism. The GO terms could be divided into three categories based on the type of information they contain as follows:
- Molecular Function: Activities at the molecular level executed by gene products. The molecular function delineates processes that transpire at the molecular level, such as “catalysis” or “transportation”. It denotes activities rather than the entities (molecules or complexes) executing the actions, and it does not delineate the location, timing, or context of the action. Molecular functions typically relate to activities executed by individual gene products (such as proteins or RNA), while certain activities are carried out by molecular complexes consisting of numerous gene products. Broad functional terms include catalytic activity and transporter activity, whereas narrower functional words encompass adenylate cyclase activity and Toll-like receptor binding.
- Cellular Component: This type of GO term describes the location occupied by a macromolecular apparatus relative to cellular compartments and structures. The gene ontology delineates the locations of gene products in two manners as follows: The first method is by cellular anatomical entities, where a gene product performs a molecular function. Cellular anatomical entities encompass cellular components like the plasma membrane and cytoskeleton, along with membrane-bound compartments such as the mitochondrion. The other method is with the help of the stable macromolecular complexes to which they belong, for instance, the clathrin complex.
- Biological Process: The extensive procedures, or ’biological programming’, executed through various molecular activities. Instances of general biological process terminology include DNA repair and signal transduction. Examples of narrower terminology include the pyrimidine nucleobase biosynthesis process and glucose transmembrane transport.
3.2. Dataset
The protein sequences and their corresponding GO terms used in this study were extracted from UniProt (version 2019-02) [1], which is a large public repository of protein sequences. The UniProt archive consists of two different databases; the first is called Swiss-Prot, which consists of about half a million protein sequences annotated manually by domain experts. The other database is known as TrEMBL and consists of around 250 million unreviewed sequences. The dataset used in this study has been prepared from the sequences taken from the SwissProt database as it contains reliable labels and can be used to train and test our model. The GO term labels in the larger TrEMBL dataset have not been curated by domain experts. Instead, they have been generated by computational models and have not been verified by domain experts. As a result, the manually annotated SwissProt dataset has been used for evaluation and training in this study.
Two different dataset splits are used to train and evaluate our model. The first is the random split, where the training, development, and testing sets are created by randomly splitting the whole dataset in a 8:1:1 ratio. The second dataset split is called the clustered split, where a tool called Uniref [43] is used to divide the dataset into sections where the sequences in each split are structurally different and have the least possible common segments between them. This makes the clustered split dataset much more challenging compared to the former. The number of data points in the random and clustered split datasets are given in Table 1 and Table 2, respectively.

Table 1.
Number of sequences of each aspect in the random dataset splits.
Table 2.
Number of sequences of each aspect in the clustered dataset splits.
Table 1 and Table 2 summarize the dataset statistics for the random and clustered splits, respectively. Molecular Function (MF) consistently has the largest counts, supporting robust model training, while Cellular Component (CC) has fewer samples, which makes it inherently more challenging. The clustered split provides more balanced sets, with training, development, and test sets of comparable size, reflecting a harder evaluation scenario than the random split.
Next, during the preprocessing steps, the sequences in the dataset that do not have any GO term annotations associated with them are filtered out. After that, the list of GO terms present in the dataset are collected and divided based on their aspects, which are biological processes, cellular components, and molecular functions. Each dataset is then split into three parts, where each contains only GO terms relating to only one aspect. Only the top 100 most populous GO terms from each aspect are used for training and evaluation, as many of them only appear in the dataset very rarely. The number of protein sequences in each aspect for the training, development, and testing sets are also given in Table 1 and Table 2 for the random and clustered datasets, respectively.
After separating the datasets based on the three aspects, the GO terms are one-hot encoded, where a value of 1 is assigned to the terms that are present for a particular protein sequence and 0 if they are absent. Next, the protein sequences are tokenized and inputted into the algorithm while the one-hot encoded GO terms serve as the truth labels or targets.
3.3. Model Architecture
This section presents the overall layout of the proposed model. A block diagram illustrating the detailed architecture of ProtGO is given in Figure 1.
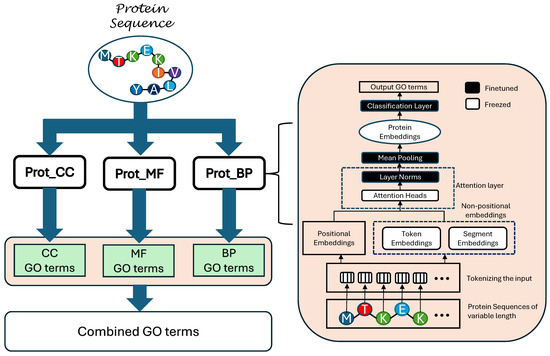
Figure 1.
Block diagram illustrating the detailed architecture of the proposed model of ProtGO.
Three transformer-based modules are used in the model, where each specializes on one aspect of the GO terms. The protein sequence is first tokenized, where each amino acid in the sequence is represented by a unique alphabet. The tokenizer takes the input sequence and converts it into a string of vectors which could be now inserted into the transformer architecture.
The protein sequence is copied and parallelly inserted into all three of the transformer blocks, Prot_CC, Prot_MF, and Prot_BP. Each of these modules predicts the GO terms related to one of the aspects. Next, the predictions from all three blocks are combined together to create the total output of the model.
The internal architecture of each prot_X block is also given in Figure 1. After the input protein sequences are tokenized, they are fed into three encoders, namely, the positional encoder, the token encoder, and the segment encoder. Each of the encoders is responsible for generating one aspect of the input tokens. The token encoder and the segment encoder are together referred to as non-positional encoders.
Internally, each of the encoders contain learnable weights which could be factored with the inputs to generate the output embeddings. The positional embeddings contain information about the position of each token in the sequence, while the token embeddings describes the type of token in each position. Lastly, the segment embeddings remain dormant in this case as the protein sequences are not divided into multiple segments. After all the three types of embeddings are generated, they are summed together and fed into the transformer encoder.
The encoder module of the transformer is made up of multiple encoder layers stacked on top of each other. The proposed model consists of 30 encoder layers, where each consists of a multihead attention module followed by layer normalization and mean pooling. Each encoder layer also consists of a skip connection or residual network that facilitates the propagation of early layer information to the later layers of the model. A model dimensionality of 1024 is used along with 12 heads for the attention layers. After the transformer encoder extracts the embeddings from the input sequence, they are fed into a classification layer which predicts the GO terms that the input sequences are associated with. Lastly, the labels from all three submodules are collected and pooled together to form the final model output.
3.4. Training and Evaluation
The first step in the training process involves pretraining the Prot_X blocks on the BFD100 dataset, which consists of 2122 million protein sequences of variable lengths [35]. The pretrained variant of ProtBert was obtained from the HuggingFace website [44]. During pretraining, segments of the sequence, determined by the masking probability, were concealed, and the model was instructed to predict the masked tokens. This enables the model to comprehend and assimilate intricate patterns within the data, as well as the interrelations among various amino acids in the protein sequence. The ProtBert module comprised 30 hidden layers, each containing 1024 nodes, with an intermediate hidden layer size of 4096. The model included 16 attention heads and contained a total of 420 million parameters. It was pretrained in [35], utilizing 128 nodes and 1024 TPUs for 800,000 steps on sequences limited to a maximum length of 512, followed by an additional 200,000 steps on sequences with a maximum length of 2000. A masking probability of 15% was implemented in conjunction with a Lamb optimizer. A learning rate of 0.002 and a weight decay rate of 0.01 were chosen.
To adapt the ProtBert module for our purposes, we acquired the pretrained weights and fine-tuned them on protein sequences. Nonetheless, fine-tuning substantial transformer models such as ProtBert demands significant data and computational resources. To address this, we have executed selective fine-tuning, wherein certain layers of the model are adjusted while others retain their pretrained values. This strategy enhances accuracy in large models with limited data availability [45,46]. The fundamental architecture of the ProtBert model, along with the selectively fine-tuned layers, is illustrated in Figure 1. A Negative Log Likelihood (NLL) loss function is used to pretrain the modules in an unsupervised manner. The layers which were frozen to achieve the most efficiency for the ProtBert modules were referenced from [42].
Next, the pretrained Prot_Bert modules are selectively fine-tuned on the processed random and clustered datasets. The training set from each type of split is used to train the model, while the testing set has been reserved for the evaluation and comparison with benchmark methods. The cross-entropy loss function has been used during the fine-tuning process and is given in Equation (1).
Here, N is the total number of samples in the dataset while M is the total number of classes, y represents the true label, and stands for the predicted labels. An Adam optimizer has been used to train the model on a total of 10 epochs with an initial learning rate of 5 × 10⁴. The HuggingFace [44] trainer (version: 4.18.0) has been used to train the model, and it automatically adjusts and optimizes most of the hyperparameters along with a gradient accumulation step of 32. The model was trained on a single Nvidia RTX2080Ti GPU which required around 3.5 GB of memory and took approximately 80 h to be completely trained up to the 10 epochs. The model required significantly less computational resources compared to the benchmark model Proteinfer, which was trained for 60 h on 8 Nvidia P100 GPUs with data parallelism, where each GPU consisted of 16 GB of memory [41]. A major reduction in the required computational resources of the proposed ProtGO model comes from its ability to be fine-tuned directly on the ProtBert [35] model, eliminating the need for further pretraining.
3.5. Performance Metrics
Several evaluation metrics were used to assess the performance of the proposed ProtGO model and compare it with previous state-of-the-art methods. These metrics are as follows:
- Accuracy = Correct predictions/Total samples.
- Precision = TP/(TP + FP)
- Recall = TP/(TP + FN)
- F1 score = 2 × (Precision × Recall)/(Precision + Recall)
- AUC (Area Under the Curve): Measures overall classification separability from ROC curves.
Here, TP refers to the number of True Positive results, TN refers to the number of True Negative samples, FP points to the number of False Positives, and FN refers to False Negatives.
After the training step, the model was evaluated on the held out testing set for both the random and clustered split datasets. The results obtained in the experiment were compared with the benchmark models and are presented in detail in the next section.
4. Results
This section presents the evaluation statistics and performance comparison of the proposed ProtGO model with previous state-of-the-art benchmark models. Other analysis results, including the Receiver Operating Characteristic (ROC) curve and sequence length analysis of the proposed model, have also been outlined and discussed in this section.
Several evaluation metrics have been used to comprehensively compare the results of the models on both the random and clustered dataset splits. Table 3 shows the performance of the proposed model on all three GO aspects, namely, Biological Processes, Molecular Function, and Cellular Component, on the random split dataset using the overall Accuracy, F1 score, Precision, and Recall evaluation metrics. The results show that the proposed model, ProtGO, has been able to perform significantly better compared to the main benchmark methods Proteinfer and ProteinferEN [41]. Here, ProteinferEN refers to the ensemble version of the Proteinfer model, where several base models have been trained and later put together to generate the final output.
Table 3.
Evaluation results of the proposed model on the random split dataset on various performance metrics compared to the benchmark methods.
For the random split (Table 3), ProtGO achieves the best results across all GO aspects, with MF showing the highest Accuracy (94.60%) and CC the lowest (78.30%). ProtGO outperformed ProteinferEN by around 3% in terms of Accuracy in all three GO terms aspects while showing better F1 scores as well. The Precision scores of ProtGO are also significantly better than those of the other methods. However, in terms of the Recall scores, ProteinferEN shows better results out of the three compared models. This delineates that the ProteinferEN model is better at avoiding false negative samples compared to ProtGO and vice versa. But the trade-off between the false positive and false negative samples could be controlled using a minimum decision threshold hyperparameter, which has been set to the default value for all the algorithms. Hence, a better indicator of performance is the F1 score, which combines the values of Precision and Recall to produce a single metric. In terms of the F1 score, the ProtGO module has been able to consistently outperform the benchmark methods in both the datasets.
Table 4 shows the performance comparison of the proposed model along with the benchmark methods on the clustered split dataset. The results are similar to the random split, with ProtGO performing better in terms of Accuracy and F1 score in all three GO aspects. For the clustered split (Table 4), performance decreases slightly, but ProtGO still outperforms baselines by 6–8% in Accuracy for BP and MF. CC remains the most difficult, with ProtGO at 73.28% compared to 63.06% for Proteinfer. These observations confirm that MF annotations are generally easier to capture, while CC terms present greater challenges. This is probably due to the availability of a large number of MF GO terms compared to that of CC.
Table 4.
Evaluation results of the proposed model on the Clustered Split dataset on various performance metrics compared to the benchmark methods.
However, the gap between the performance of ProtGO and the benchmark method is more evident in the case of the clustered split than the random split dataset. This shows that ProtGO is a more robust model and has a strong understanding of the structure and deep sequence-level patterns of the protein. Hence, it performs similarly for the random and clustered test datasets while the benchmark models show significant difference in Accuracy for the two datasets. There is a gap of around 7% in Accuracy between the proposed model and the benchmark methods for the clustered split dataset, which is significantly greater than that seen for the random dataset split. A similar trend could also be seen in the F1 score, Precision, and Recall scores for the two splits.
The Precision and Recall results for both the datasets show that the proposed ProtGO model is able to provide significant improvement compared to the previous SOTA methods in terms of Precision, while providing comparable or slightly lower performance in terms of the Recall values. This could be explained by the internal threshold parameter which is present in the header module of the ProtGO model and controls the trade-off between the Recall and Precision values. A default value of 0.5 has been chosen to generate the experimental results. This parameter provides more flexibility to the model as it could be increased or decreased to the preferred Precision or Recall based on the application needs.
4.1. ROC Curves
Next, the Receiver Operating Characteristic (ROC) curve is shown in Figure 2 for the ProtGO model on the random and clustered split datasets. These plots show the ability of a binary classifier model to differentiate between the positive and negative samples. In order to transform the ROC curve for multi-class classifications as in this study, the class-wise ROC curves have been generated by considering all other classes as negative samples, followed by micro-averaging all classes to obtain the overall ROC curve. For each protein sequence, the proposed model outputs a one-dimensional vector of length n, where n represents the total number of GO terms present in each aspect (MF, CC, or BP). In case of sequences consisting of multiple GO terms, each positive GO term is taken at a time, and its value is compared against all the negative GO terms. Later, these comparison values for all the positive GO term is averaged out to generate the final ROC curve for that aspect. A straight line along the origin with a gradient of 1 represents a random classification and is shown by a black line in the figure, which could be used as a reference. while an inverted L-shaped curve touching the origin and the top two corners would represent a perfect separation between the positive and negative samples.
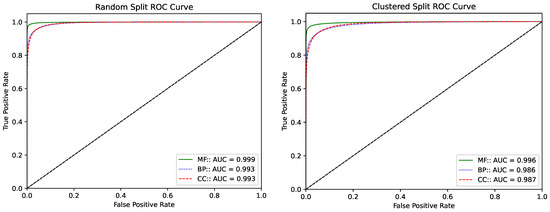
Figure 2.
(Left) Averaged ROC curve of the ProtGO model for the random split dataset. (Right) Averaged ROC curve of the ProtGO model for the Clustered split dataset. The green solid line corresponds to MF while the dotted blue and dashed red lines represent BP and CC, respectively.
The ROC plots for the ProtGO model on both the random and clustered dataset splits show nearly perfect separation of the negative and positive samples with a large area under the curves. The model for the Molecular Function (MF) GO aspect performs the best in both datasets, with the other two closely following it. The AUC value, which stands for “Area Under the Curve”, is also above 99% for the random split dataset while that for the clustered split is above 98%. MF exhibits the steepest curve with an AUC > 0.99 (for both random and clustered). BP and CC also achieve high AUC values (>0.98), though these are slightly lower than MF. These results demonstrate that the proposed model is excellent at differentiating between the various classes with great ease. This, in turn, indicates that the model can distinguish and identify the patterns in the sequences responsible for each of the GO terms, though it does not directly extract biological motifs.
4.2. Sequence Length Analysis
In the Sequence Length Analysis (SLA) experiment, the variability of the test Accuracy on the length of the input sequence is studied along with the distribution of input sequences in the dataset. Figure 3 shows a histogram to represent the abundance of input sequences of different lengths in the dataset, while Figure 4 shows the test Accuracy of the proposed ProtGO and the Proteinfer_EN [41] baseline model for the various input sequence lengths in the random split dataset for all three GO aspects. The frequency distribution plot peaks at around 750 tokens while most of the sequences are confined between a range from 300 to 1200 amino acids. It could be seen in Figure 4 that the Accuracy of the proposed model remains approximately steady until 1000 tokens, while experiencing a gradual downward shift after that. This happens as the input tokens are truncated at 1000 tokens in this study for ease of computation, whereas the input sequence length could be easily increased without having to make any algorithmic changes to increase Accuracy for longer sequences. The Accuracy of the Molecular Function GO aspect does not dip even for very long sequences, which shows that these GO terms are relatively easier to predict compared to the others. Meanwhile, the Accuracy values of the other two GO aspects fall to around 70% at very long sequence lengths.
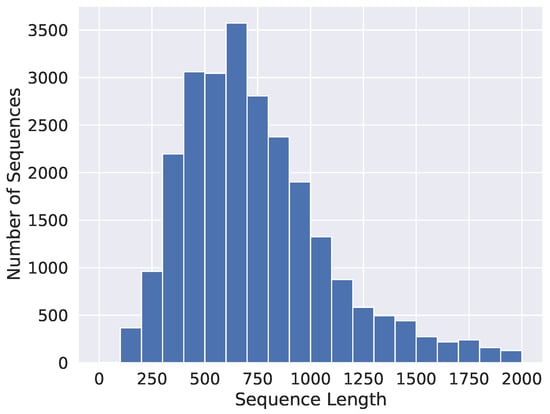
Figure 3.
Frequency distribution of the input protein sequence lengths in the dataset.
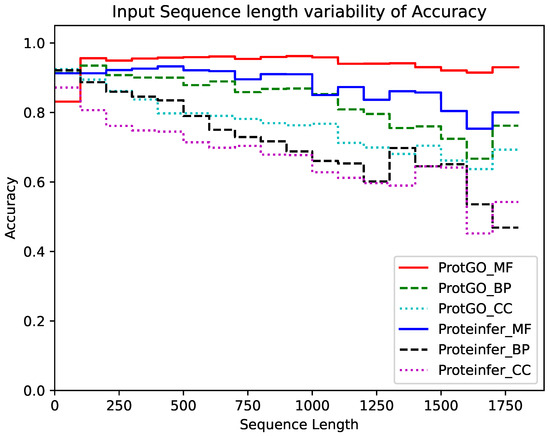
Figure 4.
Variability in ProtGO and Proteinfer model Accuracy for different GO aspects based on the input sequence length.
A comparison of the proposed ProtGO method with the benchmark Proteinfer model shows that the former is able to hold up test Accuracy much more steadily with varying sequence length. For the MF aspect, ProtGO forms a nearly steady output while Proteinfer shows dips in Accuracy after a sequence length of 1000. In terms of the BP aspect, both models show dips in Accuracy at longer sequences, but the descent is more significant for the Proteinfer model compared to ProtGO. Meanwhile, for the CC aspect, ProtGO consistently outperforms the baseline model and the difference increases even more after a sequence length of 1500. Overall, the ProtGO model shows more resilience to sequence length changes compared to Proteinfer in terms of Accuracy.
5. Conclusions
In this study, a lightweight, easy-to-use, transformer-based fusion machine learning model has been proposed, and it can predict GO terms with high Accuracy from full-scale protein sequences. The performance of the model has been tested on two datasets, named random and clustered split, for all three GO aspects. The results show state-of-the-art performance on several different evaluation metrics compared to other recent related methods [41]. The ProtGO model has been able to outperform the benchmark methods used in this study in terms of Accuracy and F1 scores by significant margins in both the random and clustered split datasets. Moreover, the results show that the margin of improvement for the ProtGO model from the benchmark methods in terms of both Accuracy and F1 scores were significantly greater for the more challenging clustered dataset compared to the random split dataset. This indicates that the proposed architecture is better at deciphering and interpreting deep patterns and structures within the protein sequences, which leads to the performance gap being greater for the more challenging dataset.
The ROC curve for the ProtGO model has also been generated for both datasets and it shows the models ability to successfully differentiate between the positive and negative samples very effectively. This is also demonstrated by the AUC score which is above 99% and 98% for the random and clustered split datasets, respectively. Lastly, the sequence length analysis study for the ProtGO model was also conducted, where the model demonstrated limited variability in test Accuracy as the sequence length of the input data was varied. The Accuracy is more stable up to a sequence length of a 1000 amino acids, as the input sequences are truncated at that value. This indicates that the Accuracy of the model could be further increased at longer sequence lengths by raising the input sequence truncation threshold hyperparameter.
5.1. Implications
ProtGO provides state-of-the-art GO annotation using a lightweight architecture, enabling it efficient application at scale. Its robustness across clustered and random splits demonstrates strong generalizability.
5.2. Limitations
Current evaluation is restricted to the top 100 GO terms per aspect, limiting the coverage of rarer terms. Input sequences longer than 1000 amino acids were truncated, which may affect the prediction of very long proteins. Cellular Component remains a harder category, with lower absolute performance.
5.3. Future Directions
Despite several recent scientific studies on protein annotation utilizing deep learning models, there is a dearth of research focused on models specifically built for GO term annotation, particularly in scenarios characterized by limited data availability. Additional efforts are necessary to gather supplementary datasets pertaining to GO term annotations to enhance the efficacy of deep learning models and improve the overall Precision of GO term predictions. Extending ProtGO to rarer GO terms, incorporating structural or interaction data [40], exploring methods to include cost-effective 3D structures [30,31,37], and developing multi-task frameworks that integrate EC and GO predictions represent promising next steps. Improving model interpretability could further enhance biological insights and adoption. Specifically, methods could be developed that could generate the patterns and motifs responsible for identifying each GO term from the protein sequence. This could, in turn, lead to the discovery of additional motifs and GO terms that were previously unknown to the scientific community. Furthermore, several protein annotation models that predict distinct functionalities could be integrated into a unified framework, thereby optimizing shared computations in the analysis of protein structure. These are reserved for future endeavors.
Author Contributions
Conceptualization, A.T. and J.-S.Y.; methodology, A.T. and J.-S.Y.; software, A.T.; validation, A.T.; formal analysis, A.T.; investigation, A.T.; resources, J.-S.Y.; data curation, A.T.; writing—original draft preparation, A.T.; writing—review and editing, J.-S.Y.; visualization, A.T.; supervision, J.-S.Y.; project administration, J.-S.Y.; funding acquisition, J.-S.Y. All authors have read and agreed to the published version of the manuscript.
Funding
This research received no external funding.
Data Availability Statement
All data used in this study are publicly available at https://drive.google.com/file/d/19SXO7Asy2vsAab6cl36-IkUqq9DYMgDb/view?usp=sharing (accessed on 13 August 2025).
Conflicts of Interest
The authors declare no conflicts of interest.
References
- Consortium, T.U. UniProt: The Universal Protein Knowledgebase in 2023. Nucleic Acids Res. 2022, 51, D523–D531. [Google Scholar] [CrossRef] [PubMed]
- Iacoviello, M.; Santamato, V.; Pagano, A.; Marengo, A. Interpretable AI-driven multi-objective risk prediction in heart failure patients with thyroid dysfunction. Front. Digit. Health 2025, 7, 1583399. [Google Scholar] [CrossRef]
- Altschul, S.F.; Gish, W.; Miller, W.; Myers, E.W.; Lipman, D.J. Basic local alignment search tool. J. Mol. Biol. 1990, 215, 403–410. [Google Scholar] [CrossRef]
- Krogh, A.; Brown, M.; Mian, I.S.; Sjölander, K.; Haussler, D. Hidden Markov models in computational biology. Applications to protein modeling. J. Mol. Biol. 1994, 235, 1501–1531. [Google Scholar] [CrossRef]
- Eddy, S.R. Profile hidden Markov models. Bioinformatics 1998, 14, 755–763. [Google Scholar] [CrossRef]
- Blum, M.; Andreeva, A.; Florentino, L.; Chuguransky, S.; Grego, T.; Hobbs, E.; Pinto, B.; Orr, A.; Paysan-Lafosse, T.; Ponamareva, I.; et al. InterPro: The protein sequence classification resource in 2025. Nucleic Acids Res. 2024, 53, D444–D456. [Google Scholar] [CrossRef]
- Weiss, K.; Khoshgoftaar, T.M.; Wang, D. A survey of transfer learning. J. Big Data 2016, 3, 9. [Google Scholar] [CrossRef]
- Kulmanov, M.; Khan, M.A.; Hoehndorf, R. DeepGO: Predicting protein functions from sequence and interactions using a deep ontology-aware classifier. Bioinformatics 2017, 34, 660–668. [Google Scholar] [CrossRef]
- Dalkiran, A.; Rifaioglu, A.S.; Martin, M.J.; Cetin-Atalay, R.; Atalay, V.; Doğan, T. ECPred: A tool for the prediction of the enzymatic functions of protein sequences based on the EC nomenclature. BMC Bioinform. 2018, 19, 334. [Google Scholar] [CrossRef] [PubMed]
- Cao, R.; Freitas, C.; Chan, L.; Sun, M.; Jiang, H.; Chen, Z. ProLanGO: Protein function prediction using neural machine translation based on a recurrent neural network. Molecules 2017, 22, 1732. [Google Scholar] [CrossRef] [PubMed]
- Almagro Armenteros, J.J.; Sønderby, C.K.; Sønderby, S.K.; Nielsen, H.; Winther, O. DeepLoc: Prediction of protein subcellular localization using deep learning. Bioinformatics 2017, 33, 3387–3395. [Google Scholar] [CrossRef]
- Schwartz, A.S.; Hannum, G.J.; Dwiel, Z.R.; Smoot, M.E.; Grant, A.R.; Knight, J.M.; Becker, S.A.; Eads, J.R.; LaFave, M.C.; Eavani, H.; et al. Deep Semantic Protein Representation for Annotation, Discovery, and Engineering. bioRxiv 2018. [Google Scholar] [CrossRef]
- Sureyya Rifaioglu, A.; Doğan, T.; Jesus Martin, M.; Cetin-Atalay, R.; Atalay, V. DEEPred: Automated Protein Function Prediction with Multi-task Feed-forward Deep Neural Networks. Sci. Rep. 2019, 9, 7344. [Google Scholar] [CrossRef]
- Li, Y.; Wang, S.; Umarov, R.; Xie, B.; Fan, M.; Li, L.; Gao, X. DEEPre: Sequence-based enzyme EC number prediction by deep learning. Bioinformatics 2017, 34, 760–769. [Google Scholar] [CrossRef]
- Hou, J.; Adhikari, B.; Cheng, J. DeepSF: Deep convolutional neural network for mapping protein sequences to folds. Bioinformatics 2017, 34, 1295–1303. [Google Scholar] [CrossRef] [PubMed]
- Memon, S.A.; Khan, K.A.; Naveed, H. HECNet: A hierarchical approach to enzyme function classification using a Siamese Triplet Network. Bioinformatics 2020, 36, 4583–4589. [Google Scholar] [CrossRef]
- Khan, K.A.; Memon, S.A.; Naveed, H. A hierarchical deep learning based approach for multi-functional enzyme classification. Protein Sci. 2021, 30, 1935–1945. [Google Scholar] [CrossRef]
- Concu, R.; Cordeiro, M.N.D.S. Alignment-Free Method to Predict Enzyme Classes and Subclasses. Int. J. Mol. Sci. 2019, 20, 5389. [Google Scholar] [CrossRef]
- Zou, Z.; Tian, S.; Gao, X.; Li, Y. mlDEEPre: Multi-Functional Enzyme Function Prediction with Hierarchical Multi-Label Deep Learning. Front. Genet. 2019, 9, 714. [Google Scholar] [CrossRef] [PubMed]
- AlQuraishi, M. End-to-End Differentiable Learning of Protein Structure. Cell Syst. 2019, 8, 292–301.e3. [Google Scholar] [CrossRef] [PubMed]
- Senior, A.W.; Evans, R.; Jumper, J.; Kirkpatrick, J.; Sifre, L.; Green, T.; Qin, C.; Žídek, A.; Nelson, A.W.R.; Bridgland, A.; et al. Improved protein structure prediction using potentials from deep learning. Nature 2020, 577, 706–710. [Google Scholar] [CrossRef]
- Rao, R.M.; Liu, J.; Verkuil, R.; Meier, J.; Canny, J.; Abbeel, P.; Sercu, T.; Rives, A. MSA Transformer. In Proceedings of Machine Learning Research, Proceedings of the 38th International Conference on Machine Learning, Virtual, 18–24 July 2021; Meila, M., Zhang, T., Eds.; PMLR: Cambridge MA, USA, 2021; Volume 139, pp. 8844–8856. [Google Scholar]
- Du, Y.; Meier, J.; Ma, J.; Fergus, R.; Rives, A. Energy-based models for atomic-resolution protein conformations. arXiv 2020. [Google Scholar] [CrossRef]
- Yang, J.; Anishchenko, I.; Park, H.; Peng, Z.; Ovchinnikov, S.; Baker, D. Improved protein structure prediction using predicted interresidue orientations. Proc. Natl. Acad. Sci. USA 2020, 117, 1496–1503. [Google Scholar] [CrossRef] [PubMed]
- Biswas, S.; Khimulya, G.; Alley, E.C.; Esvelt, K.M.; Church, G.M. Low-N protein engineering with data-efficient deep learning. Nat. Methods 2021, 18, 389–396. [Google Scholar] [CrossRef] [PubMed]
- Madani, A.; McCann, B.; Naik, N.; Keskar, N.S.; Anand, N.; Eguchi, R.R.; Huang, P.S.; Socher, R. ProGen: Language Modeling for Protein Generation. bioRxiv 2020. [Google Scholar] [CrossRef]
- Anishchenko, I.; Pellock, S.J.; Chidyausiku, T.M.; Ramelot, T.A.; Ovchinnikov, S.; Hao, J.; Bafna, K.; Norn, C.; Kang, A.; Bera, A.K.; et al. De novo protein design by deep network hallucination. Nature 2021, 600, 547–552. [Google Scholar] [CrossRef] [PubMed]
- Yang, K.K.; Wu, Z.; Arnold, F.H. Machine-learning-guided directed evolution for protein engineering. Nat. Methods 2019, 16, 687–694. [Google Scholar] [CrossRef]
- Mazurenko, S.; Prokop, Z.; Damborsky, J. Machine Learning in Enzyme Engineering. ACS Catal. 2020, 10, 1210–1223. [Google Scholar] [CrossRef]
- Abramson, J.; Adler, J.; Dunger, J.; Evans, R.; Green, T.; Pritzel, A.; Ronneberger, O.; Willmore, L.; Ballard, A.J.; Bambrick, J.; et al. Accurate structure prediction of biomolecular interactions with AlphaFold 3. Nature 2024, 630, 493–500. [Google Scholar] [CrossRef]
- Jumper, J.; Evans, R.; Pritzel, A.; Green, T.; Figurnov, M.; Ronneberger, O.; Tunyasuvunakool, K.; Bates, R.; Žídek, A.; Potapenko, A.; et al. Highly accurate protein structure prediction with AlphaFold. Nature 2021, 596, 583–589. [Google Scholar] [CrossRef]
- Ryu, J.Y.; Kim, H.U.; Lee, S.Y. Deep learning enables high-quality and high-throughput prediction of enzyme commission numbers. Proc. Natl. Acad. Sci. USA 2019, 116, 13996–14001. [Google Scholar] [CrossRef] [PubMed]
- Bileschi, M.L.; Belanger, D.; Bryant, D.H.; Sanderson, T.; Carter, B.; Sculley, D.; Bateman, A.; DePristo, M.A.; Colwell, L.J. Using deep learning to annotate the protein universe. Nat. Biotechnol. 2022, 40, 932–937. [Google Scholar] [CrossRef] [PubMed]
- Dohan, D.; Gane, A.; Bileschi, M.L.; Belanger, D.; Colwell, L. Improving Protein Function Annotation via Unsupervised Pre-Training: Robustness, Efficiency, and Insights. In Proceedings of the 27th ACM SIGKDD Conference on Knowledge Discovery & Data Mining, New York, NY, USA, 14–18 August 2021; KDD ’21. pp. 2782–2791. [Google Scholar] [CrossRef]
- Elnaggar, A.; Heinzinger, M.; Dallago, C.; Rehawi, G.; Wang, Y.; Jones, L.; Gibbs, T.; Feher, T.; Angerer, C.; Steinegger, M.; et al. ProtTrans: Toward understanding the language of life through self-supervised learning. IEEE Trans. Pattern Anal. Mach. Intell. 2022, 44, 7112–7127. [Google Scholar] [CrossRef]
- Brandes, N.; Ofer, D.; Peleg, Y.; Rappoport, N.; Linial, M. ProteinBERT: A universal deep-learning model of protein sequence and function. Bioinformatics 2022, 38, 2102–2110. [Google Scholar] [CrossRef]
- Lin, Z.; Akin, H.; Rao, R.; Hie, B.; Zhu, Z.; Lu, W.; Smetanin, N.; Verkuil, R.; Kabeli, O.; Shmueli, Y.; et al. Evolutionary-scale prediction of atomic-level protein structure with a language model. Science 2023, 379, 1123–1130. [Google Scholar] [CrossRef] [PubMed]
- Heinzinger, M.; Weissenow, K.; Sanchez, J.G.; Henkel, A.; Steinegger, M.; Rost, B. ProstT5: Bilingual Language Model for Protein Sequence and Structure. bioRxiv 2023. [Google Scholar] [CrossRef]
- Pan, T.; Li, C.; Bi, Y.; Wang, Z.; Gasser, R.B.; Purcell, A.W.; Akutsu, T.; Webb, G.I.; Imoto, S.; Song, J. PFresGO: An attention mechanism-based deep-learning approach for protein annotation by integrating gene ontology inter-relationships. Bioinformatics 2023, 39, btad094. [Google Scholar] [CrossRef]
- Wang, W.; Shuai, Y.; Zeng, M.; Fan, W.; Li, M. DPFunc: Accurately predicting protein function via deep learning with domain-guided structure information. Nat. Commun. 2025, 16, 70. [Google Scholar] [CrossRef]
- Sanderson, T.; Bileschi, M.L.; Belanger, D.; Colwell, L.J. ProteInfer, deep neural networks for protein functional inference. eLife 2023, 12, e80942. [Google Scholar] [CrossRef]
- Tamir, A.; Salem, M.; Yuan, J.S. ProtEC: A Transformer Based Deep Learning System for Accurate Annotation of Enzyme Commission Numbers. IEEE/ACM Trans. Comput. Biol. Bioinform. 2023, 20, 3691–3702. [Google Scholar] [CrossRef]
- Suzek, B.E.; Wang, Y.; Huang, H.; McGarvey, P.B.; Wu, C.H.; UniProt Consortium. UniRef clusters: A comprehensive and scalable alternative for improving sequence similarity searches. Bioinformatics 2015, 31, 926–932. [Google Scholar] [CrossRef] [PubMed]
- Wolf, T.; Debut, L.; Sanh, V.; Chaumond, J.; Delangue, C.; Moi, A.; Cistac, P.; Rault, T.; Louf, R.; Funtowicz, M.; et al. Transformers: State-of-the-Art Natural Language Processing. In Proceedings of the 2020 Conference on Empirical Methods in Natural Language Processing: System Demonstrations, Online, 16–20 November 2020; pp. 38–45. [Google Scholar]
- Lu, K.; Grover, A.; Abbeel, P.; Mordatch, I. Pretrained transformers as universal computation engines. arXiv 2021, arXiv:2103.05247. [Google Scholar] [CrossRef]
- Salem, M.; Keshavarzi Arshadi, A.; Yuan, J.S. AMPDeep: Hemolytic activity prediction of antimicrobial peptides using transfer learning. BMC Bioinform. 2022, 23, 389. [Google Scholar] [CrossRef] [PubMed]
Disclaimer/Publisher’s Note: The statements, opinions and data contained in all publications are solely those of the individual author(s) and contributor(s) and not of MDPI and/or the editor(s). MDPI and/or the editor(s) disclaim responsibility for any injury to people or property resulting from any ideas, methods, instructions or products referred to in the content. |
© 2025 by the authors. Licensee MDPI, Basel, Switzerland. This article is an open access article distributed under the terms and conditions of the Creative Commons Attribution (CC BY) license (https://creativecommons.org/licenses/by/4.0/).