Article

An Explainable Deep Learning Framework with Adaptive Feature Selection for Smart Lemon Disease Classification in Agriculture

by
Naeem Ullah
1,
Michelina Ruocco
2,
Antonio Della Cioppa
3,
Ivanoe De Falco
4 and
Giovanna Sannino
4,*
1
Department of Electrical Engineering and Information Technology, University of Naples Federico II, 80125 Naples, Italy
2
Institute for Sustainable Plant Protection (IPSP), National Research Council (CNR), 80055 Naples, Italy
3
Natural Computation Lab (NCLab), Department of Information Engineering, Electrical Engineering, and Applied Mathematics (DIEM), University of Salerno, 84084 Salerno, Italy
4
Institute of High Performance and Networking (ICAR), National Research Council (CNR), 80131 Naples, Italy
*
Author to whom correspondence should be addressed.
Electronics 2025, 14(19), 3928; https://doi.org/10.3390/electronics14193928
Submission received: 27 August 2025 / Revised: 30 September 2025 / Accepted: 1 October 2025 / Published: 2 October 2025
(This article belongs to the Special Issue Image Processing and Pattern Recognition)

Abstract

Early and accurate detection of lemon disease is necessary for effective citrus crop management. Traditional approaches often lack refined diagnosis, necessitating more powerful solutions. The article introduces adaptive PSO-LemonNetX, a novel framework integrating a novel deep learning model, adaptive Particle Swarm Optimization (PSO)-based feature selection, and explainable AI (XAI) using LIME. The approach improves the accuracy of classification while also enhancing the explainability of the model. Our end-to-end model obtained 97.01% testing and 98.55% validation accuracy. Performance was enhanced further with adaptive PSO and conventional classifiers—100% validation accuracy using Naive Bayes and 98.8% testing accuracy using Naive Bayes and an SVM. The suggested PSO-based feature selection performed better than ReliefF, Kruskal–Wallis, and Chi-squared approaches. Due to its lightweight design and good performance, this approach can be adapted for edge devices in IoT-enabled smart farms, contributing to sustainable and automated disease detection systems. These results show the potential of integrating deep learning, PSO, grid search, and XAI into smart agriculture workflows for enhancing agricultural disease detection and decision-making.

1. Introduction

Lemons are a key export, and their quality categorization is crucial for markets with strict standards. Lemons are classified in factories based on color, with bright yellow ones considered to be of higher quality [1]. Manual color-based sorting is a labor-intensive, time-consuming, and unreliable process that is influenced by environmental conditions and human fatigue [2]. To address these challenges, smart agriculture is increasingly adopting automated and AI-driven classification systems that are capable of operating under real-world field conditions. Such systems play a key role in optimizing productivity, ensuring quality, and laying the groundwork for future integration with IoT and edge-based agricultural infrastructures.
Recently, image processing and machine learning (ML) techniques have been used for automatic classification of various agricultural products such as tomatoes [3], apples [4], dates [5], and flowers [6]. Specifically, deep learning (DL)-based algorithms, have achieved improved performance across such domains [7]. However, the application of DL models in agriculture still faces challenges such as a lack of explainability and high model complexity.

1.1. Research Motivation

This study is motivated by the need for an automatic, accurate, efficient, and explainable method of lemon disease classification. Manual classification remains error-prone and inefficient, motivating the need for a robust automated method. We propose a DL model enhanced with feature selection and explainability. Specifically, we employ adaptive Particle Swarm Optimization (PSO) [8] for the most informative feature selection and integrate Local Interpretable Model-Agnostic Explanations (LIMEs) [9] to provide explanations for model decisions. The interdisciplinary approach aims to support sustainable citrus production and the advancement of precision agriculture.

1.2. Feature Selection Using Nature-Inspired Algorithms

Nature-inspired algorithms, such as PSO, can efficiently solve feature selection problems because they can mimic evolutionary and swarm behavior [10]. Selecting the right features is critical for machine learning (ML) models, especially in the agricultural domain where datasets are complex and large. Such algorithms effectively extract relevant features from large, complex agricultural datasets. We apply adaptive PSO to enhance model performance and interpretability.

1.3. Importance and Contributions

Recently, much research has been carried out on automatic lemon disease classification using computer vision techniques. However, these methods face challenges such as high complexity, low accuracy, a lack of transparency and explainability (making it difficult for users to trust the model’s decisions), and difficulty in practical implementations [11,12]. To address these limitations, this study introduces the adaptive PSO-LemonNetX method, which integrates DL, feature selection, and advanced explainable AI (XAI) techniques. This unique combination not only achieves satisfactory performance but also reduces complexity using feature selection and ensures transparency in the decision-making process. The proposed adaptive PSO-LemonNetX architecture employs Fire modules and ShuffleNet units for effective feature extraction. A self-attention mechanism is introduced after the feature extraction stage for boosting representation learning, and overfitting is prevented through the use of batch normalization, dropout, and LReLU activations. The study’s primary contributions are as follows:
  • Development of the adaptive PSO-LemonNetX model, which integrates DL with adaptive PSO-based feature selection, grid search hyperparameter tuning, and lightweight architectural components for effective and efficient classification of lemon diseases.
  • Integration of XAI LIME to enhance the transparency of the model’s predictions, providing actionable insights for agricultural stakeholders and researchers.
  • Rigorous testing on unseen data and comparison with advanced classifiers, including k-nearest neighbors (KNNs) [13], a support vector machine (SVM) [14], decision trees (DTs) [15], and naive Bayes (NB) [15] after feature selection, achieving superior performance and confirming robustness.
  • Demonstration that adaptive PSO outperforms conventional feature selection techniques (such as Kruskal–Wallis [16], Chi-squared [17], and ReliefF [18]) in improving both accuracy and efficiency, making the framework suitable for IoT-enabled smart farming and edge deployment.

1.4. Paper Organization

Section 1 is about the topic’s introduction and our work’s contribution. Section 2 is about the related works. Section 3 describes the proposed methodology. Section 4 and Section 5 are about the classification experiments setup and their results, respectively. The paper is concluded in Section 6.

2. Related Work

This section covers the comparative examination of several published works on lemon and citrus fruit disease categorization. A summary of these existing studies, their methodologies, datasets, advantages, and limitations is presented in Table 1.
Both ML, transfer learning (TL), and DL approaches are used in the literature to identify lemon diseases.

2.1. ML Appraoches

A ML approach is used for lemon leaf disease detection in [19] by segmenting the affected area. The methodology includes segmentation, feature extraction, and classification phases. First, the K-mean clustering algorithm is used for segmentation. The Gray Level Co-occurrence Matrices (GLCM) approach is used to extract the texture features from the images. Finally, the support vector machine (SVM) is used for classification. The authors of [2] proposed an efficient approach for categorizing lemons using a combination of ML, conventional image processing, and conveyor belt techniques. The ML technique used the Yolov4 network and conventional image processing to evaluate the whole surface of the lemon as it moved and rotated continually on the conveyor belt to categorize the lemon’s present state. The benefit of this technology was that the whole lemon surface could be examined, and the number of lemons that needed to be identified at once was not significantly impacted by the length of time it took to analyze the images. Also, YoloV4’s image-gathering numbers were drastically lowered.

2.2. DL and TL Approaches

In [12], the authors trained and compared the performance of eight DL models to categorize 913 Mexican lemons into unhealthy and healthy groups based on their outward appearance. Four models were trained using color images, whereas the remaining four models were trained using grayscale images.
In [11], the authors designed a system for identifying and classifying a 3000-image dataset of lemon citrus canker illness based on four different disease levels built using a DL-based convolutional long-term network (CLTN) amalgamated model comprising a CNN and long Short-Term Memory (LSTM). Using a local spectral-spatial hyperspectral imaging technique, the authors of [20] presented a method for early identification of bruised lemon fruits using a 3D-CNN. This technique takes into account adjacent image pixel information in both the frequency (wavelength) and spatial domains of a 3D-tensor hyperspectral image of input lemon fruits. To categorize lemons in Python, four popular 3D-CNN models—ResNet, ShuffleNet, DenseNet, and MobileNet—were employed.
The authors of [21] used DenseNet121 to detect lemon quality in an automated system. Preprocessing of the dataset of 2076 images was done using resizing, normalization, CLAHE, and data augmentation to enhance robustness. The fine-tuned DenseNet121 model achieved consistently improved performance for both good and bad quality classes. Their findings highlight the reliability of DL-based methods for minimizing misclassification and enabling automation in agriculture and supply chains.
Table 1. Summary of existing studies on lemon and citrus disease/quality classification.
StudyMethod/ModelDatasetClassesAdvantagesLimitations
Sahu et al. (2022) [19]K-means segmentation + GLCM features + SVMLemon leaf datasetDiseased vs. healthySimple ML pipeline, low computational costRequires manual segmentation, less scalable to large datasets
Hanh et al. (2023) [2]Yolov4 + image processing with conveyor beltRotating lemon datasetQuality categoriesEnables real-time inspection, covers entire fruit surfaceLimited generalization to unseen environments, high setup cost
Hernandez et al. (2021) [12]8 CNN models (color vs. grayscale)913 Mexican lemonsHealthy vs. unhealthyCompared multiple CNNs, achieved high separation accuracySmall dataset, limited class diversity
Sharma et al. (2022) [11]CNN + LSTM (CLTN hybrid)3000 lemon citrus canker imagesFour disease levelsCaptures spatial and temporal features, effective for severity levelsComputationally intensive, requires large annotated dataset
Pourdarbani et al. (2023) [20]Hyperspectral imaging + 3D-CNN (ResNet, DenseNet, etc.)Bruised lemon fruitsBruised vs. normalEarly detection of bruising, considers spatial-frequency info.Needs hyperspectral imaging, expensive and less practical in field
Kaushik et al. (2025) [21]DenseNet121 with preprocessing and augmentation2076 lemon imagesGood vs. bad qualityRobust preprocessing pipeline, high classification reliabilityHigh model complexity, limited interpretability
Pramanik et al. (2021) [22]TL models (ResNet50, DenseNet201, Xception, ResNet152V2)Field-level lemon leavesMultiple diseasesLow-cost TL-based training, strong generalizationLimited explainability, performance depends on pretrained model
He et al. (2021) [23]TL (VGG16) + visual feature extractionLemon fruit datasetGreen vs. mold defectCombined TL with handcrafted features, improved accuracy over MLDataset-specific preprocessing, limited scalability
Furthermore, the authors of [22] employed transfer learning-based deep learning models (ResNet-50, DenseNet-201, Xception, and ResNet-152V2) to classify lemon leaf illnesses at a low cost. They took advantage of picture collection gathered at the field level. Among the models, the Xception beat the other earlier efforts in terms of overall accuracy. The authors of [23] proposed a technique using TL and visual feature extraction to classify the lemons (i.e., green and mold defects). For data preprocessing, the data enhancement and brightness adjustment techniques were applied first. As the basic foundation for classification, visual feature extraction is utilized to assess flaws and determine feature variables. The researchers then used TL to build a CNN with an integrated Visual Geometry Group 16 (VGG16) network. The proposed model achieved better testing accuracy than K-nearest neighbor (KNN) and a support vector machine (SVM).

2.3. Addressing Gaps in Existing Lemon Disease Classification Methods

Despite the success of DL approaches in lemon disease classification, existing approaches have some key limitations. Most approaches do not use feature selection approaches, such as PSO, which can significantly enhance the discriminative power of a model by selecting the most informative features. Also, DL models are typically opaque and non-interpretable, i.e., decisions are difficult to interpret. The absence of explainable AI methods such as LIME reduces user trust and discourages real-world adoption.
To overcome these challenges, our study integrates PSO for feature optimization and LIME for model interpretability, improving classification accuracy and interpretability. The twofold approach not only improves classification performance but also reduces computational costs and increases user trust in the system’s predictions. Furthermore, our proposed methodology holds promise for applications beyond the classification of lemon disease, offering an expandable and explainable framework for broader use in the monitoring and management of agricultural diseases. A summary of these existing studies, their methodologies, datasets, advantages, and limitations is presented in Table 1. This table highlights the key trends and gaps in the current literature, which motivate the development of our proposed PSO-LemonNetX framework.

3. Methodology

In this study, we proposed the adaptive PSO-LemonNetX DL model for the automated identification of lemon diseases. Figure 1 depicts the proposed approach’s abstract view.

3.1. Image Resizing

The dataset’s input lemon images come in a range of sizes, therefore, all input images are resized into 227 × 227 pixels in compliance with the requirements (input image) of our model.

3.2. Dataset Partitioning

To train our model, we used 5-fold cross-validation (CV) with a hold-out test set. We used 80% of the data in a 5-fold cross-validation setting to train and validate our model, whereas the remaining 20% of the data is used as a hold-out test set to test our model. This approach ensures robust evaluation and mitigates overfitting.

3.3. Adaptive PSO-LemonNetX Architecture Details

The adaptive PSO-LemonNetX model consists of a total of 33 layers, including 9 learnable layers, i.e., 7 convolution layers and 2 fully connected layers, as shown in Table 2. To create the feature maps, the first convolutional layer extracts features from the input lemon image (of size 227 × 227) by employing 96 filters of size 11 × 11 with a stride of 4 × 4.
X m , n = L K m , n
The X ( m , n ) represents the two-dimensional output, K denotes the kernel, L denotes the input lemon images, and the sign * represents Conv between R and K. The framework is also built on Fire and channel shuffling (shufflenet) modules, two approaches that optimize for systems with limited processing capacity and cheap computation costs while maintaining prediction performance. The Fire module consists of three convolution layers: a squeezing convolution layer with several 1 × 1-filter layers, followed by 1 × 1 and 3 × 3 convolution layers (expand layer). We selected a 1 × 1 layer to lower the number of parameters. To decrease the number of inputs (input channels) to 3 × 3 kernels, we used fewer filters in the squeeze layer than in the expanding layer. The shufflenet unit has two 1 × 1 pointwise group convolutions and three 3 × 3 depthwise convolutions, for a total of three Conv operations. Following the initial pointwise group convolution, the batch normalization (BN), channel shuffle operation, and LReLU activation functions are employed. BN is applied to improve generalization and stabilize training. The feature extraction module, which comprises a convolutional layer, Fire module, and shufflenet unit, is followed by a flattened layer and a self-attention layer. Regularization techniques (LReLU, BN, Dropout) are applied after the first fully connected (FC) layer to prevent overfitting, followed by softmax and classification layers. The FC layer operates as follows.
a i = j = 0 m   ×   n 1 w i j × x i + b i
where a i , x i , w i j , b i , n, and m denote the activation of the ith neuron in the FC layer, input, weight, bias, width, and height, respectively. If lemon illness needs to be detected, the output of the last FC layer is used as an input to a 2-way softmax (Figure 2).

Motivation Behind Adaptive PSO-LemonNetX Architecture

Adaptive PSO-LemonNetX addresses challenges in agricultural image classification through efficient feature extraction, parameter optimization, and scalability. The two important units of this model are shufflenet units and Fire modules. Squeeze-and-expand convolutional procedures, which make up Fire modules, are excellent in capturing both local and global image characteristics. While the expand operation improves feature representations by merging spatial and channel-wise information, the squeeze operation condenses feature maps to extract crucial information. Moreover, channel shuffling is introduced via shufflenet units, which promote information exchange between different groups of feature maps. Shufflenet units successfully mitigate overfitting and improve model generalization by promoting richer representations and encouraging feature reuse by reordering feature mappings within groups. This adaptive method improves the model’s resilience and classification performance by enabling it to better capture the complex patterns and fluctuations found in agricultural imagery. Fire modules and shufflenet units are selected for their strong performance in related classification tasks.

3.4. Particle Swarm Optimization

The PSO algorithm is employed to enhance feature selection and reduce training time [8]. PSO selects the optimal feature sets for the last step of lemon disease identification based on a global strategy. The global optimization algorithm creates an objective function based on classifier performance. Every particle is a possible solution, and in a local (ring) topology, its location is changed depending on both its previous best position and the particle velocity. This process identifies the best-performing feature subset i.e., the most important features for lemon disease classification. In our implementation, a fitness function (jFitnessFunction) is used to apply PSO on a feature vector (feat) and associated labels (label). This function numerically expresses the goodness of a solution in solving a given task. The following formula is used for updating each particle location:
x n = x + v
where x n represents the new particle position, x represents the current particle position, and v represents velocity, the particle velocity calculated as follows:
v = w × v + c 1 × r 1 × ( P b e s t x ) + c 2 × r 2 × ( L b e s t x )
where w is inertia weight which controls the momentum of particles, dynamically decreasing from a higher value to encourage initial exploration towards a lower value to facilitate finer exploitation around promising areas. A dynamic inertia weight balances exploration and exploitation during the search. c 1 is the adaptive cognitive coefficient, and c 2 is the adaptive social acceleration coefficient. Both c 1 and c 2 are adaptively tuned; c 1 decreases to gradually reduce reliance on personal best positions, while c 2 increases, encouraging alignment with globally recognized optimal positions. P b e s t is the personal best position of the particle, L b e s t is the best position found by neighboring particles, and r 1 and r 2 represent random numbers between 0 and 1. The fitness function works as follows:
F i t n e s s ( P o s i t i o n ) = C e + λ × R p
The C e represents classification error, λ represents the regularization parameter, and R p represents the regularization penalty to avoid overfitting. A k-nearest neighbor (KNN) classifier is used in the wrapper technique (jwrapperKNN) to assess each particle’s fitness. The basic working flow of PSO is provided in Figure 3.

Advantages of Using PSO for Feature Selection

  • PSO efficiently explores the search space while convergently approaching potential solutions by combining global exploration and local exploitation through particle interaction.
  • It supports parallel computation, enabling scalability to high-dimensional data.
  • It does not require gradient information, making it suitable for noisy or complex fitness landscapes.

3.5. Classification Methods

We have used several approaches for classification purposes in this study. Firstly, we have used the adaptive PSO-LemonNetX model in an end-to-end manner for the classification. This method uses the softmax layer to convert the CNN’s raw output into probabilities, indicating model confidence.
Additionally, four traditional ML classifiers are used for classification purposes. We extracted features using adaptive PSO-LemonNEtX, and after applying Adaptive PSO for feature selection, we applied DT [15], NB [15], SVM [14], and KNN [13] classifiers to evaluate their performance. This experiment aims to identify the limitations and strengths of each classifier when applied to the optimized feature set generated by our approach.

3.6. Hyperparameters Optimization

In order to assess the performance of the adaptive PSO-LemonNetX framework, we tried various values for each hyperparameter and determined their best combination by using grid search. Learning rate and training epochs are our focus, since these are the factors that directly affect convergence speed, stability, and final accuracy. More precisely, learning rates of 0.01, 0.1, 0.001 and training epochs of 5, 10, 15, 20 are used. The learning rate range is selected to balance fast convergence (higher rates) with stability and divergent prevention (lower rates). The epochs are kept to small numbers, as initial tests revealed that the model achieved stable performance without the need for very extended training. Other settings like dropout and activations were frozen based on established deep learning stability conventions.
Dropout was set to 0.5 to prevent overfitting, and the Leaky ReLU (LReLU) activation was utilized to prevent the “dying ReLU” and speed up training. We used the stochastic gradient descent with momentum (SGDM) optimizer because it is efficient and best suited for relatively large datasets. Five-fold cross-validation is employed to ensure that the chosen configuration generalizes well for different subsets of the data. The last set of hyperparameter values applied in our experiments is shown in Table 3.

3.7. Explainability Using LIME

To enhance the transparency of the proposed adaptive PSO-LemonNetX framework, we incorporated LIME into our research. DL models, especially CNNs, have a tendency to behave as "black boxes" in a way that it becomes difficult to understand how they make decisions. This lack of transparency can hinder their actual deployment in critical applications such as agriculture, where practitioners need to interpret and trust the predictions made by automation.
LIME is selected over other methods like Gradient-weighted Class Activation Mapping (Grad-CAM) [24] and occlusion sensitivity [25] due to its higher localization accuracy and model-agnostic nature. LIME works by generating perturbed samples around the input and locally fitting an interpretable model to approximate the behavior of the black-box model. LIME provides intuitive, localized explanations by highlighting the parts of the input image that had the greatest effect on the model’s prediction.
In this work, LIME is applied to interpret predictions made by adaptive PSO-LemonNetX on lemon disease classification tasks. The aim is to present agriculture experts with interpretable explanations of what regions of the lemon images contribute most to the decisions made by the model, and hence promote confidence in the automatic system as well as real-world uptake.

4. Experimental Setup

This section describes the experimental design and measurement criteria that we utilized to assess the effectiveness of our model. This section also contains more details on the dataset.

4.1. Dataset

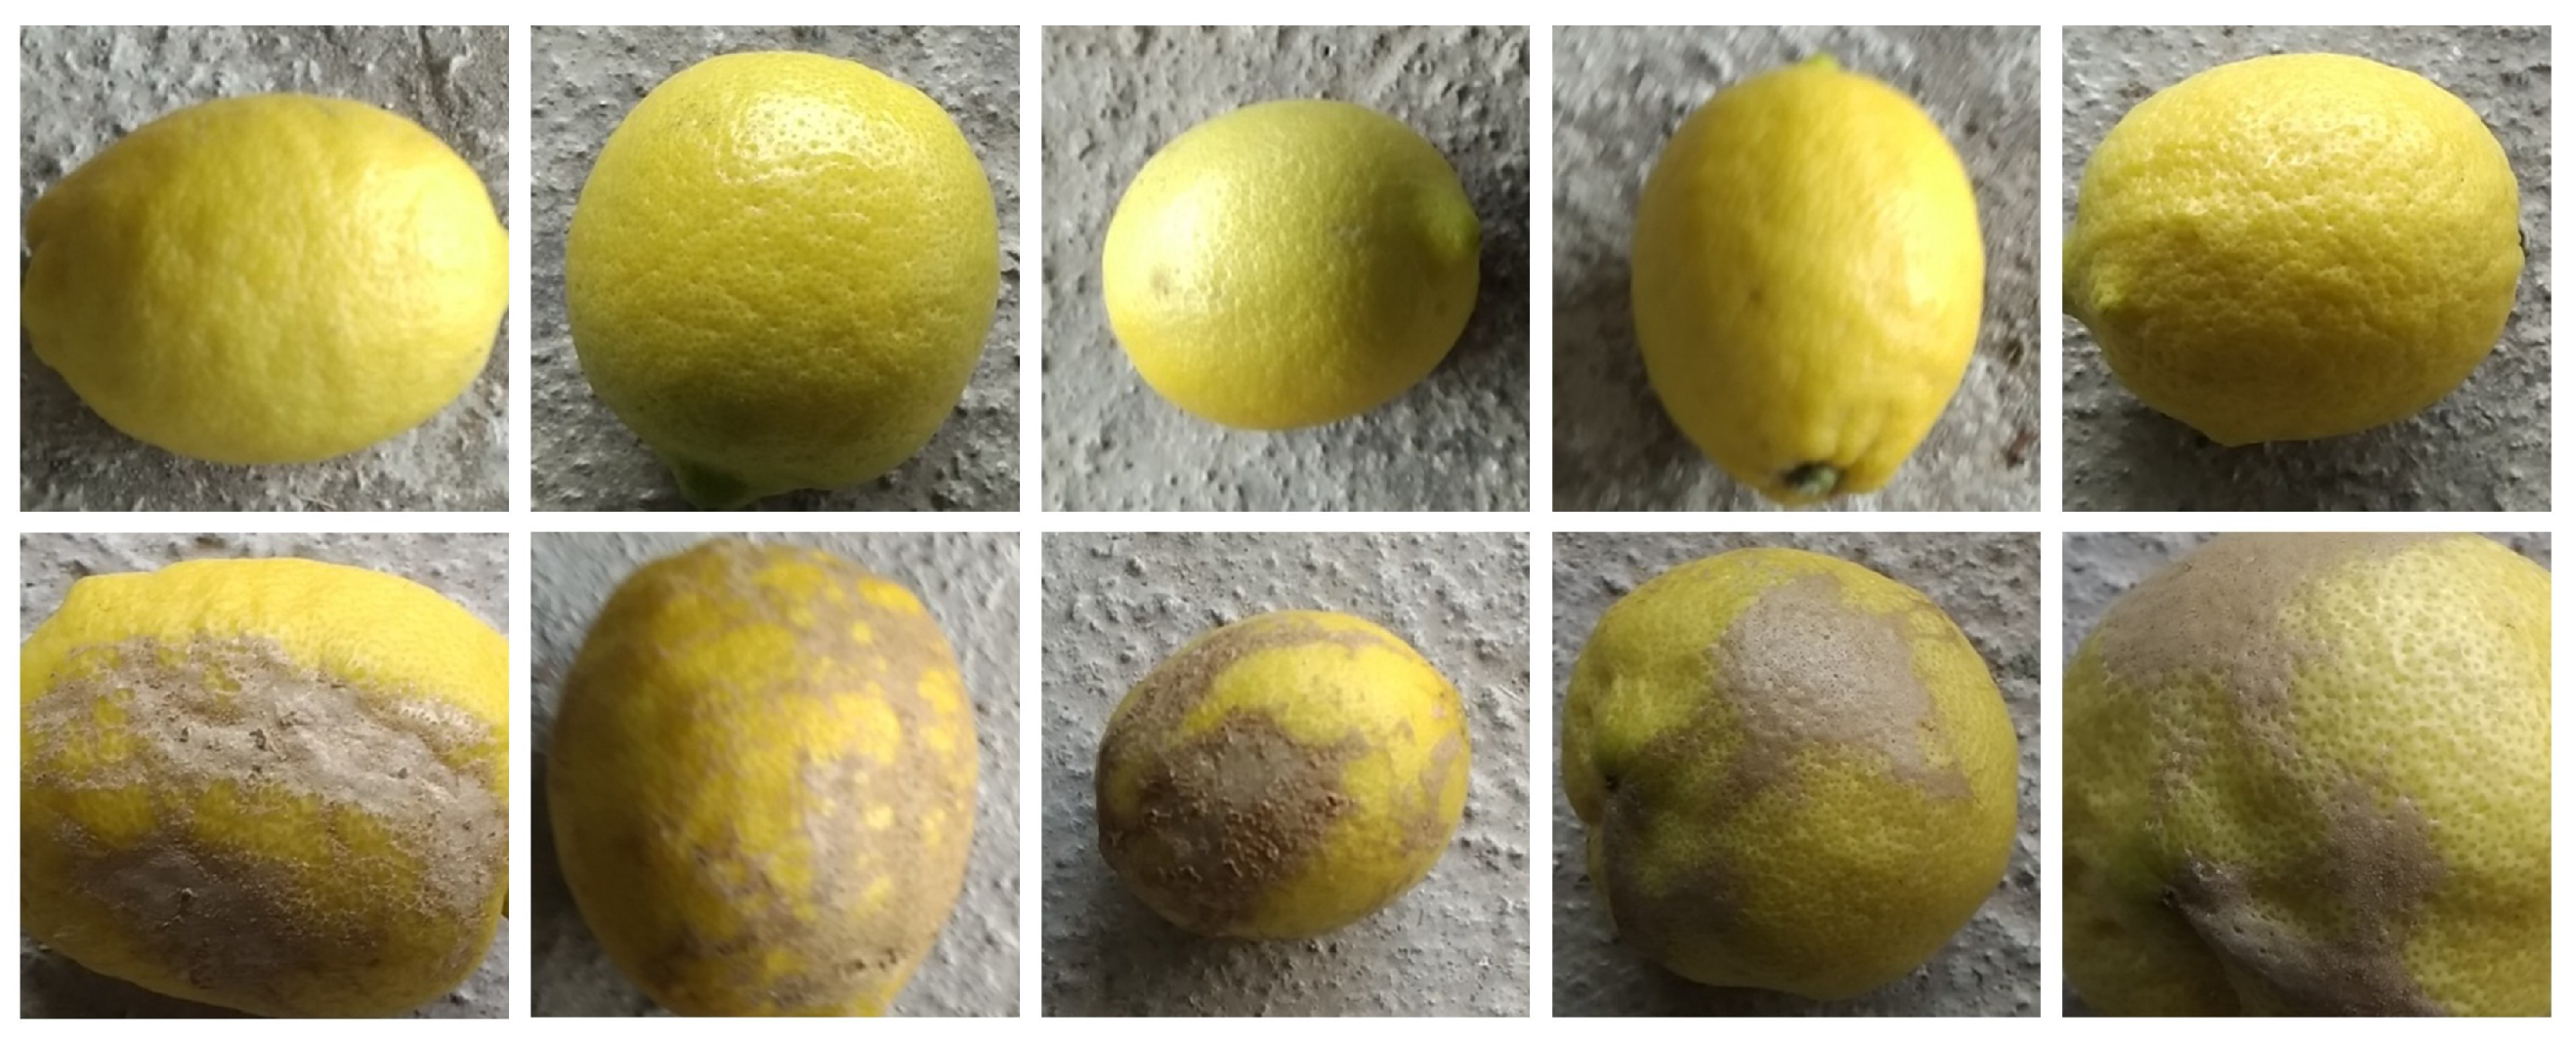
We have used a publicly available dataset in this study to classify lemon images into good-quality and bad-quality groups. We used the easily accessible “lemon quality dataset” [26]. It has 2228 images (300 × 300 pixels). On a concrete surface, photographs of lemons are taken. The dataset includes pictures of lemons of various qualities in various sizes and lighting settings (all in the daytime). The dataset contains 452 empty backgrounds, 951 bad and 1125 good-quality lemon images. Representative examples from the lemon quality dataset are given in Figure 4.
However, in our experiments, we focused exclusively on the lemon quality classification task. Therefore, the 452 background images were excluded from both training and testing, and only the 1125 good lemons and 951 bad lemons were used. This yields a relatively balanced dataset with a near 1:1 ratio between the two classes, thereby mitigating potential imbalance concerns. As a result, no additional rebalancing strategies (e.g., oversampling, undersampling, or class weighting) were necessary.

4.2. Experimental Design

We conducted numerous experiments to measure the effectiveness of our proposed approach. To ensure stability and prevent overfitting, a five-fold cross-validation strategy is used. In each fold, 80% of the data is used for training and 20% is used for validation, with results averaged across folds to provide stable estimates of model performance. The final evaluation is performed on an independent hold-out test set comprising 20% of the original dataset.
All experiments were executed on a Windows 10 (64-bit) system equipped with an Intel Core i5-5200U processor, 8 GB of RAM, and a 500 GB of HDD, using MATLAB R2020a as the development environment.

4.3. Baseline Classifiers and Parameters

In addition, to guarantee clarity and reproducibility, we include the specific parameter settings of the baseline classifiers (KNN, SVM, DT, and NB). Implementations are performed within MATLAB R2020a through its built-in machine learning functions (fitcknn, fitcsvm, fitctree, and fitcnb). All models are trained from the PSO-selected features employing an 80–20 hold-out validation strategy. The parameter values are listed in Table 4.

4.4. Evaluation Metrics

Performance was evaluated using both class-level and overall measures. The primary metrics included accuracy, precision, recall, and F1-score, reported separately for each class as well as overall. To gain a deeper understanding of model stability across folds, statistical measures such as the median, maximum, minimum, standard deviation, and variance were also calculated for each of the five-fold cross-validation tests. This provides a more comprehensive view of variability in model performance across different data partitions. Additionally, Receiver Operating Characteristic (ROC) curves and the area under the curve (AUC) are used to measure overall discriminative power. In addition, confusion matrices are presented to reflect class-specific classification results. The multiple measurements ensured that the assessment of whether the model is biased towards one class or another is made transparently and emphasized its ability to generalize to unseen data.

5. Results and Discussion

This section contains a thorough analysis of the results of several tests conducted to gauge the effectiveness of our PSO-LemonNetX model. The experiments section in this article is divided into three phases. In the first phase, the adaptive PSO-LemonNetX model is used in an end-to-end manner. In the second phase, we extracted features from the first fully connected layer of adaptive PSO-LemonNetX and used PSO for feature selection. Then, we used a DT, SVM, NB, and KNN for classification and also used the DT for feature interpretation. In the third phase, we applied LIME to the trained adaptive PSO-LemonNetX model to explain the prediction of the model.

5.1. First Phase: Lemon Quality Classification Using Adaptive PSO-LemonNetX Without PSO Feature Selection

This experiment evaluates the effectiveness of adaptive PSO-LemonNetX for binary classification of lemon images. We used the adaptive PSO-LemonNetX model in an end-to-end manner in this experiment with softmax and classification layers. We trained our model using hyperparameters in Table 3. We used all 2076 lemon images of the “Lemon Quality dataset” including 951 bad-quality images and 1125 good-quality images, and we did not use the background images. We trained and validated our model in a five-fold cross-validation setup with 80% of the data, i.e., 1661 images (including 761 bad-quality and 900 good-quality lemon images) were used for the training of our model, and the remaining 415 unseen images (including 190 bad-quality and 225 good-quality lemon images) were used for the testing of our model. The proposed system took 169 min and 56 s to train for lemon classification using the lemon quality dataset. The model underwent 1000 iterations across 20 epochs and 5 repetitions. The model validation accuracy, precision, recall, and F-measure were on average 98. 5%, 98. 3%, 98. 4%, and 98. 3%, respectively. As indicated in the results (Table 5), the adaptive PSO-LemonNetX model effectively classifies most of the images during validation, employing softmax and classification layers.

Testing on Unseen Samples

The present experiment aimed to examine the generalization capabilities of the lemon illness detection model beyond the training dataset by assessing its performance on unseen data. This experiment tests generalization on unseen lemon samples. Of the dataset, 20% was set aside specifically for testing to conduct the assessment, making sure that these samples were not utilized for model training. This experiment is carried out on the same experimental setup and the same hyperparameter values shown in Table 3. The model achieved a testing accuracy of 97.0%, with corresponding precision, recall, and F1-score values of 97.0%, 96.8%, and 96.9%, respectively, on unseen data (Table 6). However, the model performance is decreased slightly as compared to validation results (Table 5) in the case of testing using completely unseen samples. The results of this experiment demonstrate the potential of our model for real-world deployment in agricultural settings.
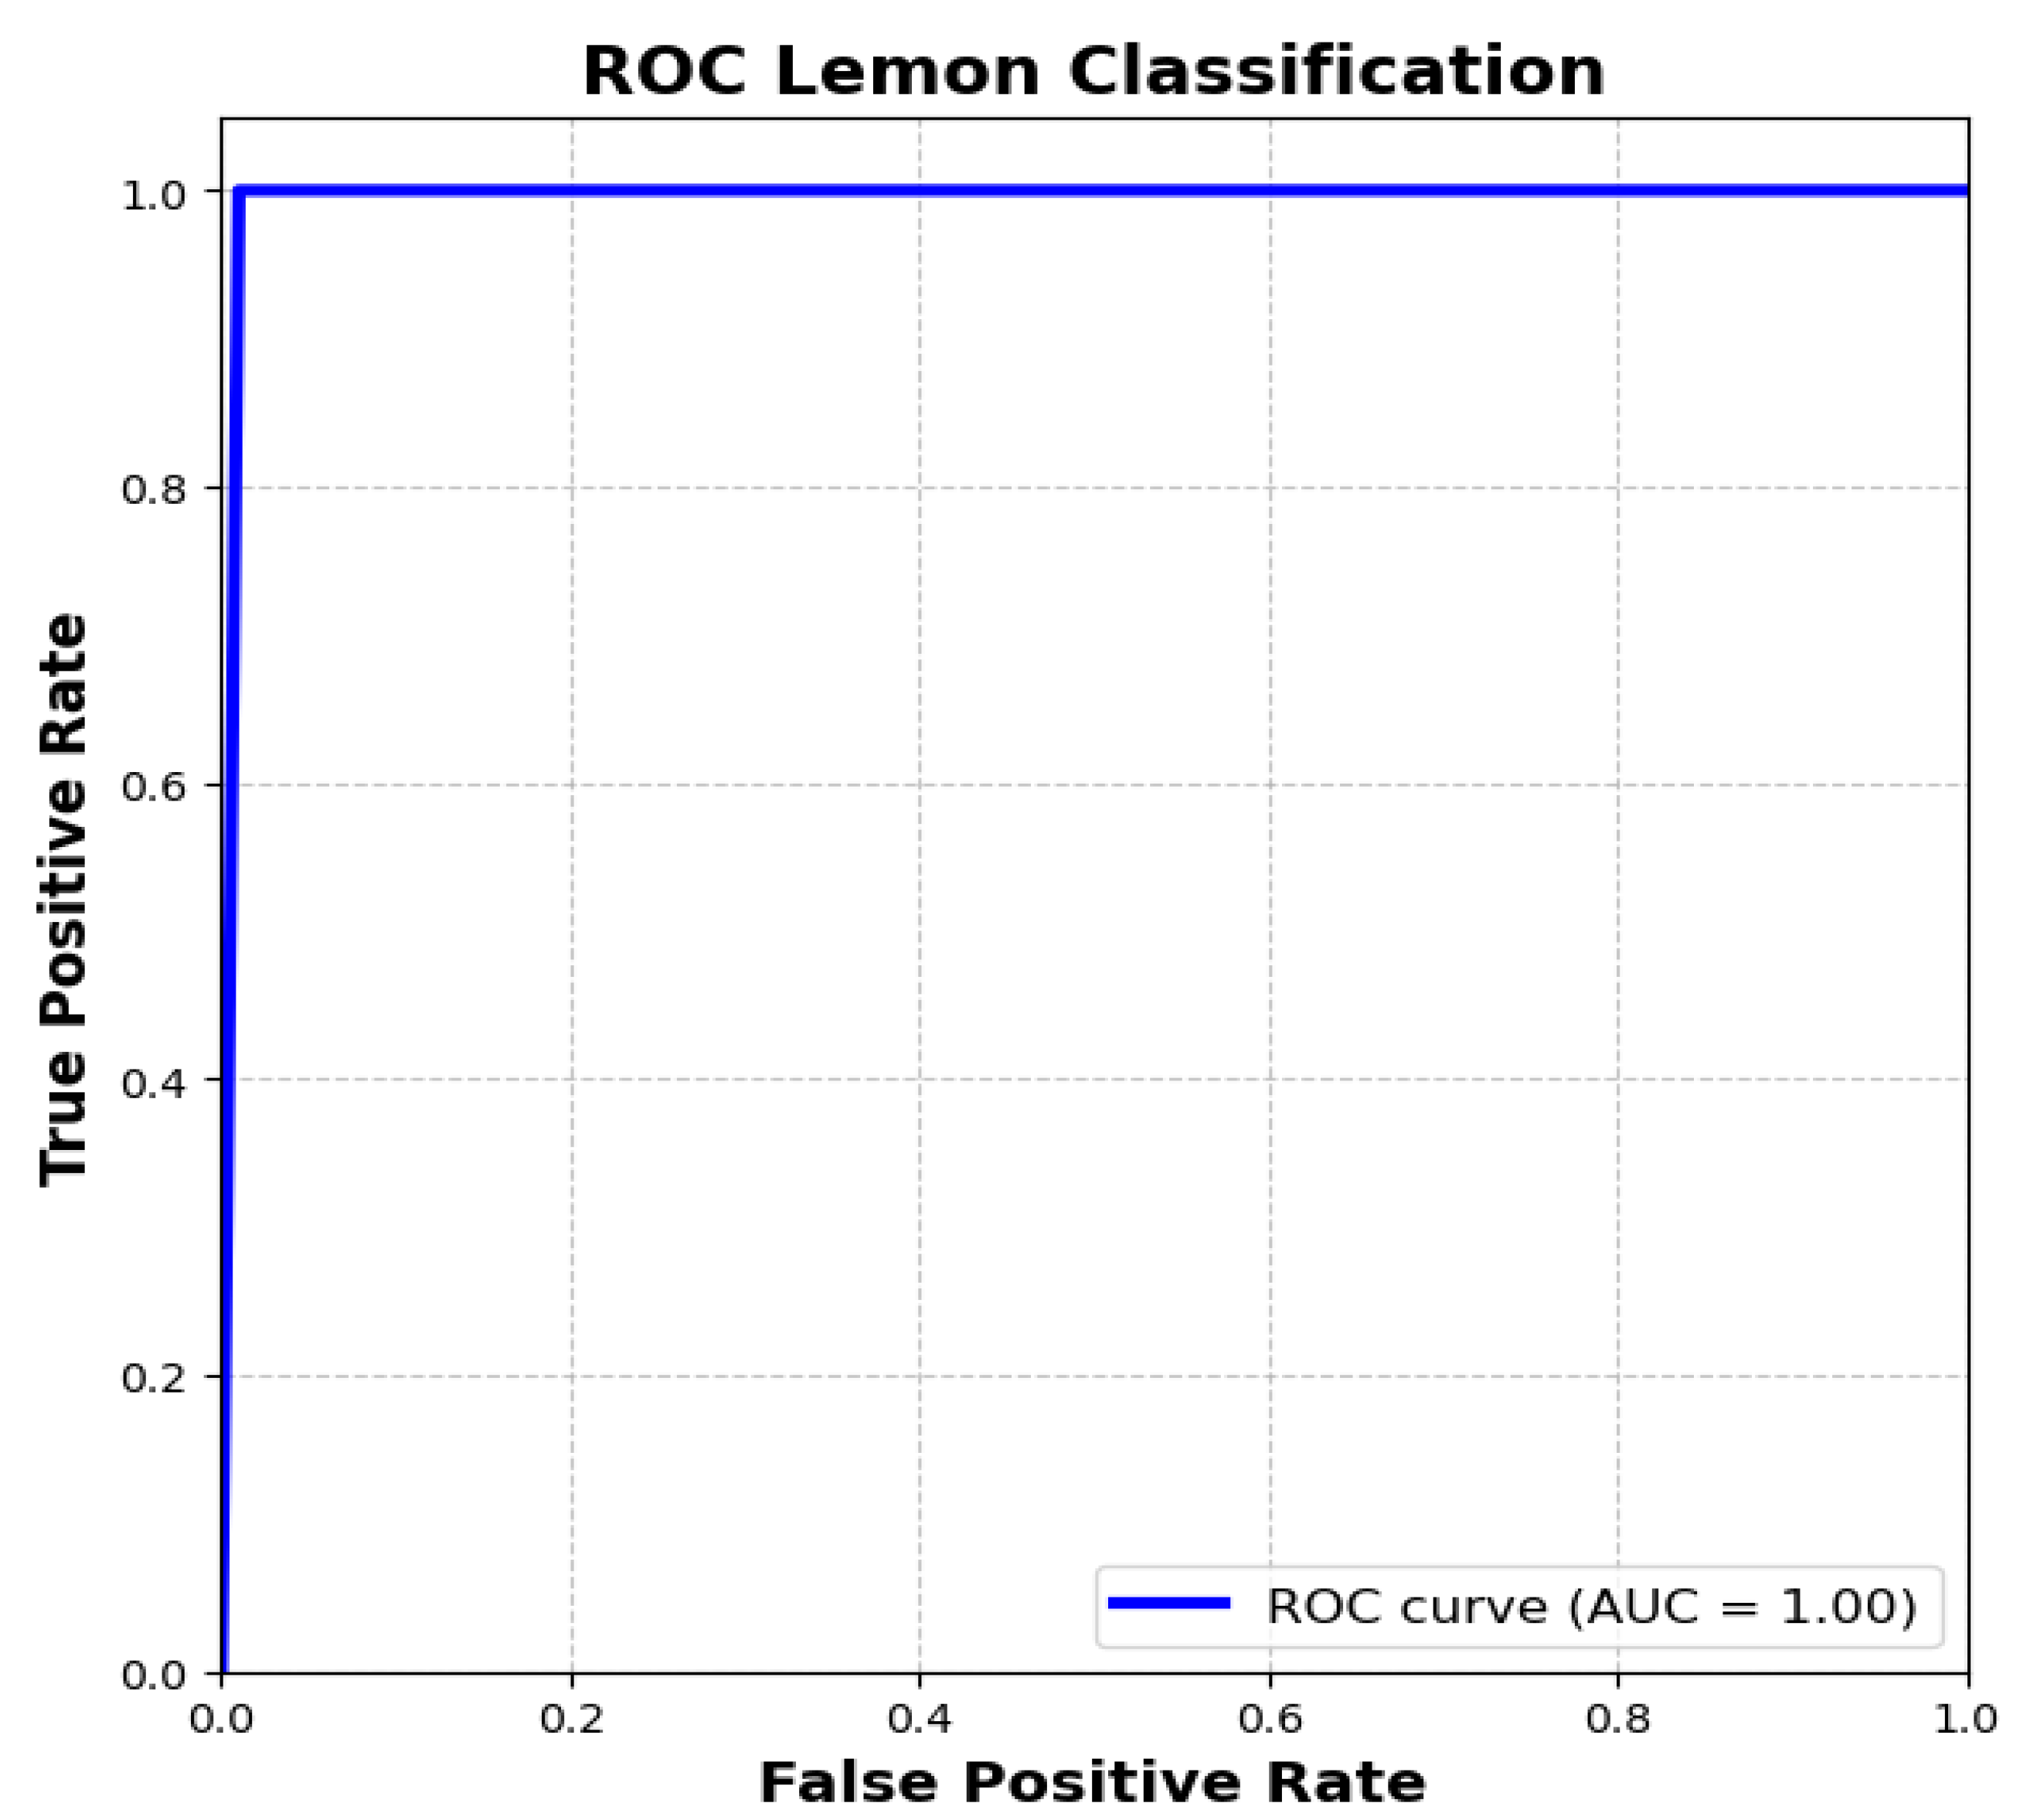
The Receiver Operating Characteristic (ROC) curve of the proposed Adaptive PSO-LemonNetX model, shown in Figure 5, indicates the effectiveness of the proposed framework to identify lemon quality. The ROC is calculated by MATLAB’s perfcurve function, which assigns threshold values from the [0, 1] interval to model outputs. For every threshold, the True Positive Rate (TPR) and False Positive Rate (FPR) are determined, and their relationship is plotted on the ROC curve, reflecting the sensitivity of the classification model. The area under the curve (AUC) is one of the important performance measures, as it measures the ability of the model to discriminate between classes. It achieved an AUC score of 1.0, reflecting perfect separability of good- and bad-quality lemons in the unseen test set. Although this demonstrates a very good discriminative ability, we acknowledge that such results may be influenced by dataset size and distribution, and therefore recommend further validation on larger and more diverse datasets to confirm robustness.
Although five-fold cross-validation was used for robust evaluation (results in Table 6), for clarity, we also present a single aggregate confusion matrix on the unseen test set (20% hold-out) in Table 7. Out of 225 good-quality lemons, 219 are correctly identified, and 6 are misclassified as bad. Similarly, for 190 bad-quality lemons, 184 are correctly identified, and only 6 are misclassified as good. This confusion matrix clearly demonstrates class-level performance and complements the overall cross-validation results. These figures confirm that the model achieves balanced performance across both classes, avoiding bias towards the majority class. By reporting class-specific results alongside overall metrics, such as ROC and the AUC, we highlight the model’s strong discriminative capability and its ability to generalize well to both categories.

5.2. Second Phase: PSO Feature Selection and Classification Using ML Classifiers

To classify lemon images, we used adaptive PSO-LemonNetX in conjunction with PSO to select discriminative features from the high-dimensional space. We applied PSO on features from the final fully connected layer, which captures high-level abstractions. The PSO algorithm was initialized with parameters as shown in Table 8. Since the final layer outputs two features for the binary classes, PSO selects the more discriminative one.
To determine which feature is most useful for differentiating between healthy and unhealthy lemons, PSO determined the feature that adds the greatest value to the classification task. Following feature selection, four popular algorithms were used to classify features: DT, NB, SVM, and KNN. We maintained consistent train/val/test splits across all experiments. The training features and associated labels were used to train the models. We then predicted labels for the testing features using the trained model. A confusion matrix was used to evaluate the KNN classifier’s performance.
Comparing the performance of different classifiers (KNN, SVM, DT, and NB) on PSO-selected features on the full training feature set and testing feature set (features of unseen samples), our findings showed that Naive Bayes classifies the PSO-selected training features with the optimum accuracy of 100%. Whereas, on the testing set (unseen samples) both the SVM and Naive Bayes achieved an accuracy of 98.8%. From the results of Table 9 and Table 10, it is clear that Naive Bayes well classifies the PSO-selected features of both training and testing sets. Whereas, PSO-selected features and the SVM achieved the best performance results on the testing features set and the second-highest performance on the training features set. By using PSO to select informative features from high-dimensional data obtained from adaptive PSO-LemonNetX, we achieve enhanced classification performance in both the training set (validation performance) and the testing set. This highlights the potential of PSO to select relevant features and improve the classification performance for the detection of lemon disease using traditional ML classifiers.

5.2.1. Comparison of Different ML Classifiers with and Without Adaptive PSO Feature Selection

We compared the performance of the DT, SVM, KNN, and NB ML classifiers with all features extracted from adaptive PSO-LemonNetX (i.e., without PSO feature selection) and with PSO feature selection to assess the efficacy of the PSO-based approach on the testing features. The results indicated that all classifiers exhibited improved performance when using the PSO-selected features, with the decision tree outperforming other ML classifiers in terms of accuracy on all feature sets. The results shown in Table 11 demonstrate the effectiveness of adaptive PSO-based feature selection in identifying relevant features, leading to improved classification performance across all evaluated ML classifiers.

5.2.2. Comparison with Other Feature Selection Approaches

To assess the effectiveness of the adaptive PSO feature selection approach for lemon disease classification, we compared the results of adaptive PSO feature selection with several well-known feature selection approaches, including Kruskal–Wallis [27], Chi-squared ( χ 2 ) [28], ReliefF [29], Analysis of Variance (ANOVA) [30], and Minimum Redundancy Maximum Relevance (MRMR) [31]. Kruskal–Wallis ranks features based on differences in group distributions. ( χ 2 ) selects features that are correlated with class labels. ReliefF ranks features based on local discrimination ability. ANOVA ranks features using F-statistics. To perform this comparison, we executed each feature selection method on the testing features extracted using our adaptive PSO-LemonNetX model from the testing dataset. We used the Naive Bayes classifier for the classification after feature selection. Furthermore, we compared the performance based on the same evaluation metrics, i.e., accuracy, precision, recall, and F1-score. All methods used the same testing dataset and evaluation protocol for fairness. This comparative study’s findings (Table 12) provided significant information about the relative benefits of heuristic optimization techniques compared to traditional statistical methods in the field of agricultural informatics. Our findings highlight the effectiveness of adaptive PSO in building accurate and interpretable models for precision agriculture.

5.2.3. Comparative Analysis with Established CNN Feature Extractors

This experiment aims to determine whether the performance improvement of the new LemonNetX model is a result of its novel feature extraction power or whether it could be achieved equally well by combining adaptive PSO and XAI with previously established good CNN architectures. To do this, we conducted an empirical comparison using VGG-16, ResNet-50, DenseNet-121, and EfficientNet-B0 as feature extractors.
For balanced comparison purposes, all models were combined with adaptive PSO for feature optimization, and the two classifiers (Naive Bayes and the SVM) that previously demonstrated superior performance on unseen data in our framework were used for classification. The results in terms of accuracy, precision, recall, and F1-score in the independent test set are presented in Table 13.
The comparative results demonstrate that while all CNN-based feature extractors, in combination with adaptive PSO and NB/SVM, present competitive performance, the new PSO-LemonNetX surpasses them in all metrics. This confirms that the performance gains are not solely due to the integration of adaptive PSO, but they are also due to the innovation of the PSO-LemonNetX feature extractor itself. Therefore, PSO-LemonNetX provides enhanced feature representations that, upon optimization with PSO, yield more accurate and interpretable classifications compared to conventional CNN models.

5.3. Third Phase: Explainability of Adaptive PSO-LemonNetX Decisions: The Significance of LIME

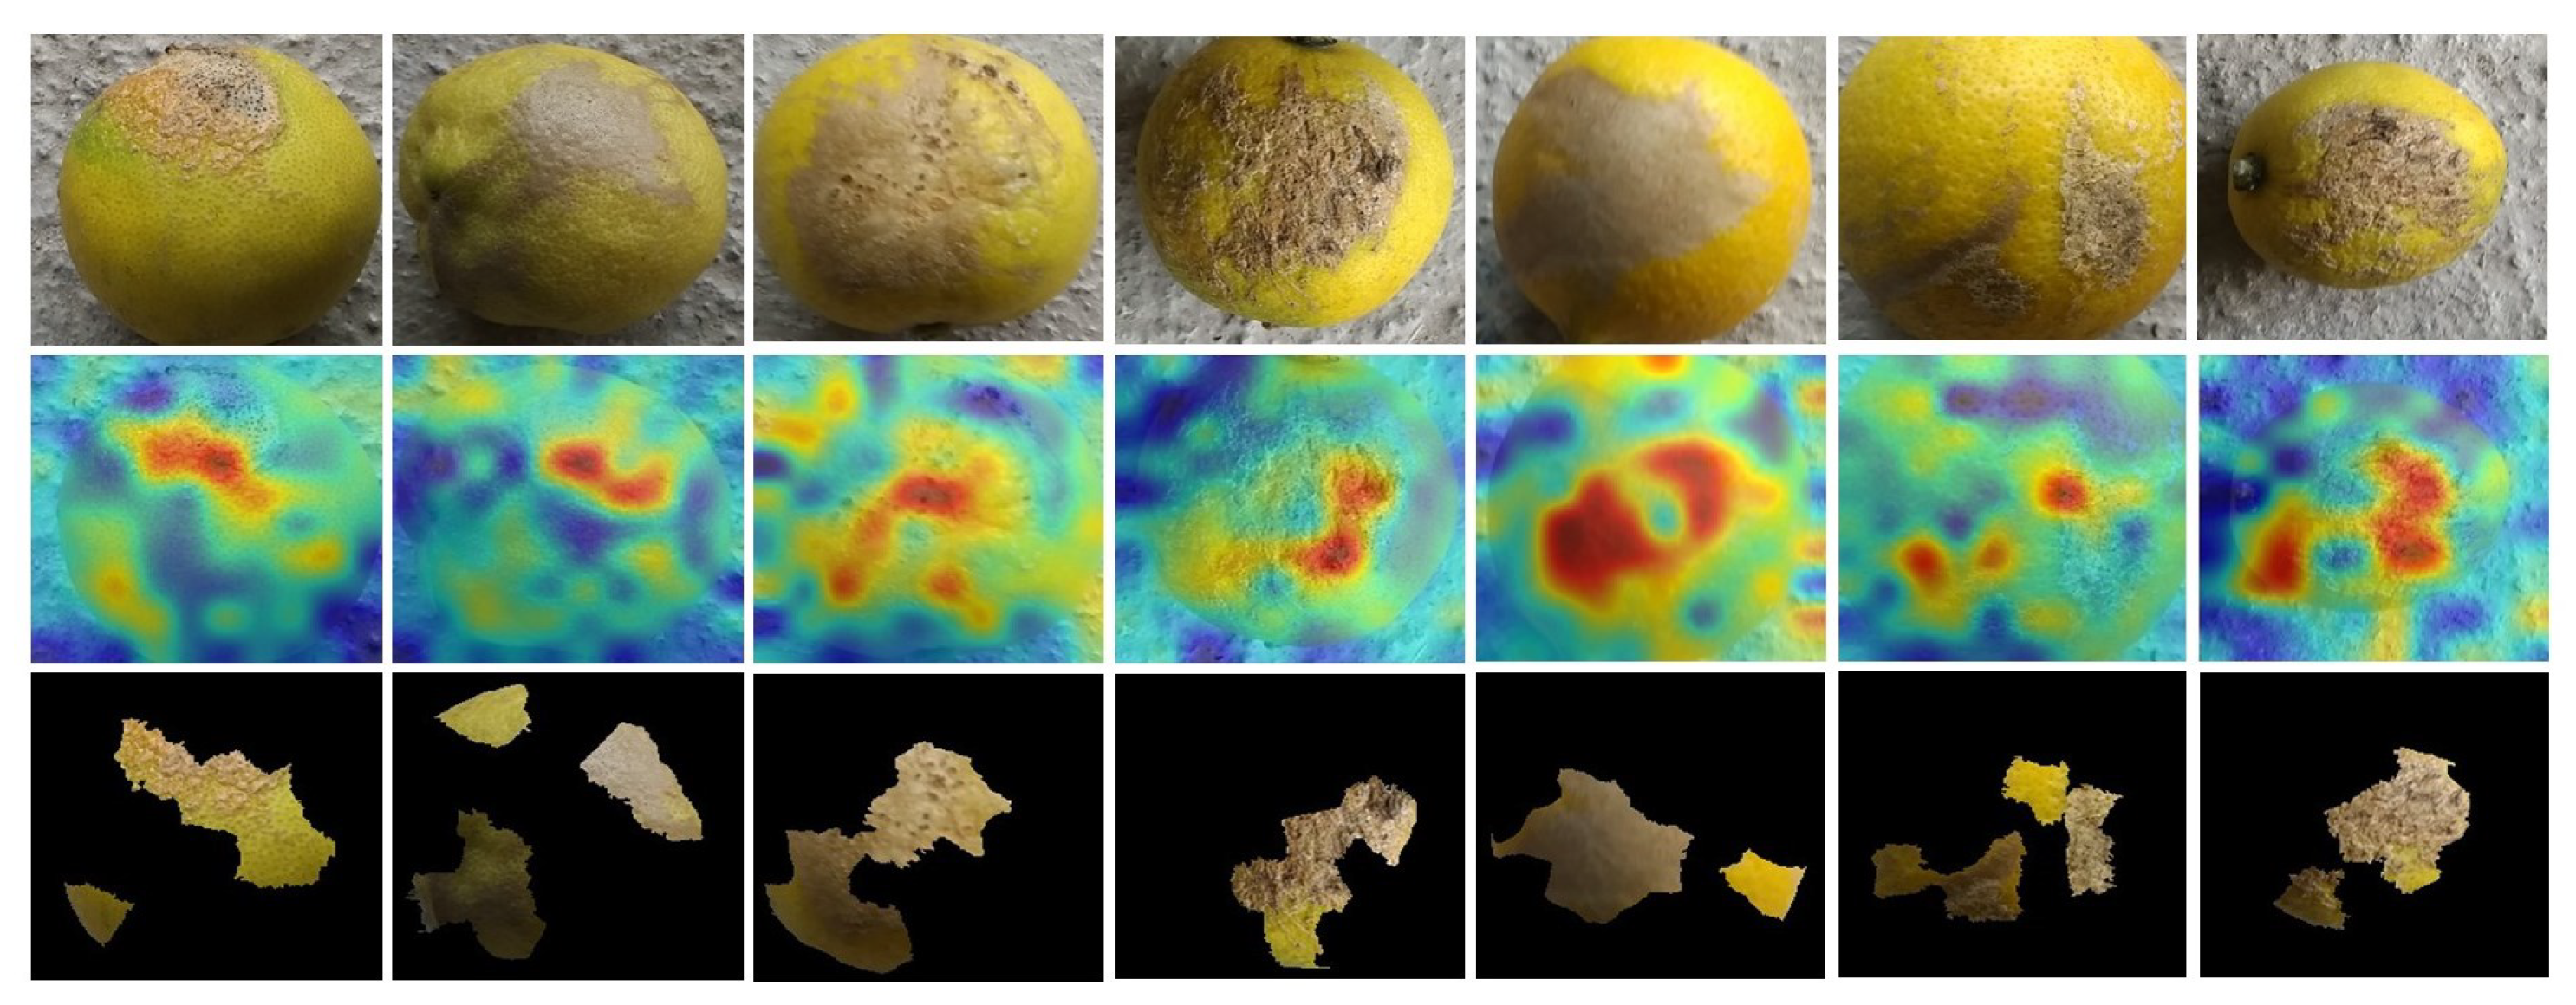
To explain and justify adaptive PSO-LemonNetX predictions, LIME is used on test lemon images. Figure 6 illustrates LIME explanations: the original lemon images are in the first row, the LIME output where significant areas are marked is given in the second row, and the top six contributing features are depicted in the third row.
The gradient maps generated by LIME, using the jet color scheme, indicate the spatial importance assigned by the model. Warm colors (e.g., red and orange) represent high-importance regions that are crucial for classification, and cool colors (e.g., blue) represent less important regions. These images allow agriculture experts to understand the reason behind the model’s predictions.
The integration of LIME explanations reduces the gap between model outputs and domain expertise, making adaptive PSO-LemonNetX more interpretable and trustworthy for real-world agricultural deployment. The findings confirm the utility of XAI for increasing model trustworthiness and acceptability in precision agriculture.

5.4. Comparison with State-of-the-Art Methods

Deep learning models for the classification of lemon quality have been studied in a few recent research articles. Yilmaz et al. [32] introduced a hybrid model consisting of a Stacked AutoEncoder (SAE) and a CNN, along with handcrafted features that obtained a high accuracy of 98.96%. Kaur et al. [33] utilized the VGG16 model for three-class classification of lemon images with an accuracy of 97%. Bird et al. [34] paired VGG16 with Conditional GAN-based augmentation and model pruning and attained 88.75% accuracy while also offering explainability through Grad-CAM. Kaushik et al. [21] used fine-tuned DenseNet121 with sophisticated preprocessing and augmentation methods and achieved 96% accuracy for a binary classification problem.
In contrast to these studies, the proposed Adaptive PSO-LemonNetX combines PSO-based adaptive feature selection with a lightweight CNN, optimized for edge-friendly deployment. Most notably, unlike previous research that either failed to include explainability or used Grad-CAM, our system is the first to integrate LIME-based interpretability, guaranteeing clear decision-making for smart agriculture. This methodological advancement provides better performance, with a validation accuracy of 100%, clearly demonstrating the effectiveness and reliability of the proposed framework. A detailed comparison of the proposed Adaptive PSO-LemonNetX framework with existing state-of-the-art methods, including dataset, accuracy, and explainability features, is presented in Table 14. This table highlights that our approach not only achieves superior predictive performance but also integrates adaptive PSO for feature selection and LIME for explainability, setting it apart from prior work.

5.5. Edge-Optimized Model Efficiency and Suitability for IoT-Driven Smart Agriculture Applications

Apart from the high predictive performance, the adaptive PSO-LemonNetX model also exhibits desirable features for integration into practical smart agriculture systems. The model is not computationally heavy, needing just 18.93 MB of memory and having 5.32 million trainable parameters. Compared to widely used deep CNN architectures such as AlexNet (60 million parameters), ResNet-50 (25.6 million parameters), and GoogLeNet (6.8 million parameters), adaptive PSO-LemonNetX is significantly more lightweight.
To assess the practical feasibility of deploying the adaptive PSO-LemonNetX model in IoT-enabled agricultural environments, an edge-simulation experiment is conducted using MATLAB on a CPU-only system. A total of 415 images of lemon diseases are passed through the trained network without using GPU acceleration, simulating an actual edge-device environment with limited computational resources. The total inference time of the model for 415 images is 7.6380 s, whereas the average inference time per image is 0.0184 s, facilitating fast, near-real-time classification. These computational efficiencies enable seamless integration with edge devices commonly used in IoT-based agricultural environments, where connectivity and processing capabilities may be limited.
Despite being executed on CPU hardware, the model showed good responsiveness and high accuracy. This aligns with growing demand for decentralized, serverless approaches that can execute advanced ML tasks directly in the field. By minimizing latency and power consumption while ensuring high performance, adaptive PSO-LemonNetX offers a practical and scalable solution for sustainable and automated plant disease monitoring in modern precision agriculture and resource-constrained setups that are typical of IoT-based agricultural systems. The results of the edge-simulation experiment also validate the model’s readiness to be implemented in real-world smart agriculture systems, where energy efficiency and processing resources are typically limited.

5.6. Limitations

Although there have been significant improvements in the classification of lemon diseases with the adaptive PSO-LemonNetX model, there are some limitations. The model is optimized for performance and computational expense but can be questioned when applied in agricultural settings where computing or hardware resources are limited. The robustness of PSO feature selection can lead to inconsistent performance with new datasets, indicating more refined generalization strategies and parameter tuning.
Further studies are needed to explore the model’s applicability in different agricultural settings and types of diseases. The comparison analysis was elaborative but could have been further expanded through the use of a wider variety of feature selection methodologies and datasets.
Using grid search in implementing hyperparameter tuning, though strict, is inefficient in terms of computational cost. Integrating Adaptive PSO for both feature selection and hyperparameter tuning can make the process more efficient.
The LIME-based explanation technique, although useful, has limitations when it is utilized on some lemon images. It sometimes labels non-relevant parts (e.g., the background or healthy parts) instead of diseased areas (Figure 7), which harms the reliability of the explanations. This is mainly observed while utilizing lower-quality images or those containing less pronounced disease patterns. The XAI techniques must be refined to enhance the precision and dependability of LIME-based explanations.

6. Conclusions

In this study, the novel adaptive PSO-LemonNetX model enhances agricultural quality control through the application of a lemon image dataset processed with state-of-the-art methods. Through the combination of XAI via LIME and adaptive PSO for feature selection, we achieved a notable improvement over conventional classification techniques with 100% validation accuracy and 98.8% accuracy on unseen data using NB and SVM classifiers. This phenomenal improvement highlights the power of PSO to optimize feature selection, establishing a new benchmark in disease classification within agriculture. In addition, the light structure of adaptive PSO-LemonNetX, minimal memory consumption, and fast CPU-based inference make it ready for deployment in edge devices of IoT-powered smart farming systems with limited connectivity and resources. Our hybrid technique has the potential to transform lemon disease classification, improve product sorting, identify diseases in the early stages, and increase overall agricultural production. Future research will focus on real-time deployment with built-in edge platforms, wireless sensor integration in agriculture, and scalability to large-scale precision agriculture operations, facilitating the development of distributed, energy-efficient, and sustainable AI systems for future smart agriculture. While 5-fold cross-validation was adopted to balance robustness with limited computational resources, future work will explore 10-fold cross-validation for more stable estimates. In addition, to improve reproducibility and accessibility, we plan to re-implement the framework in Python using TensorFlow or PyTorch.

Author Contributions

Conceptualization, N.U., I.D.F., and G.S.; methodology, N.U., I.D.F., and G.S.; software, N.U.; validation, N.U., M.R., A.D.C., I.D.F., and G.S.; formal analysis, N.U., I.D.F., and G.S.; investigation, N.U., I.D.F., and G.S.; resources, I.D.F. and G.S.; data curation, N.U.; writing–original draft preparation, N.U.; writing–review and editing, N.U., M.R., A.D.C., I.D.F., and G.S.; supervision, G.S. All authors have read and agreed to the published version of the manuscript.

Funding

This research received no external funding.

Data Availability Statement

The original data used in this study are publicly available at https://www.kaggle.com/datasets/yusufemir/lemon-quality-dataset (accessed on 30 September 2025). The source code developed during the study is available from the corresponding author upon reasonable request.

Conflicts of Interest

The authors declare no conflicts of interest.

References

  1. Jahanbakhshi, A.; Momeny, M.; Mahmoudi, M.; Zhang, Y.D. Classification of sour lemons based on apparent defects using stochastic pooling mechanism in deep convolutional neural networks. Sci. Hortic. 2020, 263, 109133. [Google Scholar] [CrossRef]
  2. Hanh, L.D.; Bao, D.N.T. Autonomous lemon grading system by using machine learning and traditional image processing. Int. J. Interact. Des. Manuf. (IJIDeM) 2023, 17, 445–452. [Google Scholar] [CrossRef]
  3. Ullah, N.; Khan, J.A.; Almakdi, S.; Alshehri, M.S.; Al Qathrady, M.; Aldakheel, E.A.; Khafaga, D.S. A lightweight deep learning-based model for tomato leaf disease classification. Comput. Mater. Contin. 2023, 77, 3969–3992. [Google Scholar] [CrossRef]
  4. Xu, L.; Lv, J. Recognition method for apple fruit based on SUSAN and PCNN. Multimed. Tools Appl. 2018, 77, 7205–7219. [Google Scholar] [CrossRef]
  5. Nasiri, A.; Taheri-Garavand, A.; Zhang, Y.D. Image-based deep learning automated sorting of date fruit. Postharvest Biol. Technol. 2019, 153, 133–141. [Google Scholar] [CrossRef]
  6. Sunoj, S.; Subhashree, S.N.; Dharani, S.; Igathinathane, C.; Franco, J.; Mallinger, R.; Prasifka, J.; Archer, D. Sunflower floral dimension measurements using digital image processing. Comput. Electron. Agric. 2018, 151, 403–415. [Google Scholar] [CrossRef]
  7. Ullah, N.; Khan, J.A.; Al Qathrady, M.; El-Sappagh, S.; Ali, F. An effective approach for plant leaf diseases classification based on a novel DeepPlantNet deep learning model. Front. Plant Sci. 2023, 14, 1212747. [Google Scholar] [CrossRef] [PubMed]
  8. Mousavi, S.M.H.; MiriNezhad, S.Y.; Mosleh, M.S.; Dezfoulian, M.H. A PSO fuzzy-expert system: As an assistant for specifying the acceptance by NOET measures, at PH.D level. In In Proceedings of the 2017 Artificial Intelligence and Signal Processing Conference (AISP), Shiraz, Iran, 25–27 October 2017; IEEE: Piscataway, NJ, USA, 2017; pp. 11–18. [Google Scholar]
  9. Ribeiro, M.T.; Singh, S.; Guestrin, C. “Why should i trust you?” Explaining the predictions of any classifier. In Proceedings of the 22nd ACM SIGKDD International Conference on Knowledge Discovery and Data Mining, San Francisco, CA, USA, 13–17 August 2016; pp. 1135–1144. [Google Scholar]
  10. Maraveas, C.; Asteris, P.G.; Arvanitis, K.G.; Bartzanas, T.; Loukatos, D. Application of bio and nature-inspired algorithms in agricultural engineering. Arch. Comput. Methods Eng. 2023, 30, 1979–2012. [Google Scholar] [CrossRef]
  11. Sharma, R.; Kukreja, V. Amalgamated convolutional long term network (CLTN) model for Lemon Citrus Canker Disease Multi-classification. In Proceedings of the 2022 International Conference on Decision Aid Sciences and Applications (DASA), Chiangrai, Thailand, 23–25 March 2022; IEEE: Piscataway, NJ, USA, 2022; pp. 326–329. [Google Scholar]
  12. Hernández, A.; Ornelas-Rodríguez, F.J.; Hurtado-Ramos, J.B.; González-Barbosa, J.J. Accuracy Comparison Between Deep Learning Models for Mexican Lemon Classification. In Proceedings of the Telematics and Computing: 10th International Congress, WITCOM 2021, Virtual Event, 8–12 November 2021; Proceedings 10. Springer: Berlin/Heidelberg, Germany, 2021; pp. 62–73. [Google Scholar]
  13. Singh, H.; Rani, R.; Mahajan, S. Detection and classification of citrus leaf disease using hybrid features. In Soft Computing: Theories and Applications: Proceedings of SoCTA 2018; Springer: Singapore, 2020; pp. 737–745. [Google Scholar]
  14. Ullah, N.; Javed, A. Deep Features Comparative Analysis for COVID-19 Detection from the Chest Radiograph Images. In Proceedings of the 2021 International Conference on Frontiers of Information Technology (FIT), Islamabad, Pakistan, 13–14 December 2021; IEEE: Piscataway, NJ, USA, 2021; pp. 258–263. [Google Scholar]
  15. Maheshwar; Kumar, G. Breast cancer detection using decision tree, naïve bayes, KNN and SVM classifiers: A comparative study. In Proceedings of the 2019 International Conference on Smart Systems and Inventive Technology (ICSSIT); Tirunelveli, India, 27–29 November 2019, IEEE: Piscataway, NJ, USA, 2019; pp. 683–686. [Google Scholar]
  16. Ali Khan, S.; Hussain, A.; Basit, A.; Akram, S. Kruskal-Wallis-Based Computationally Efficient Feature Selection for Face Recognition. Sci. World J. 2014, 2014, 672630. [Google Scholar] [CrossRef] [PubMed]
  17. Ray, S.; Alshouiliy, K.; Roy, A.; AlGhamdi, A.; Agrawal, D.P. Chi-squared based feature selection for stroke prediction using AzureML. In Proceedings of the 2020 Intermountain Engineering, Technology and Computing (IETC), Orem, UT, USA, 2–3 October 2020; IEEE: Piscataway, NJ, USA, 2020; pp. 1–6. [Google Scholar]
  18. Spolaôr, N.; Cherman, E.A.; Monard, M.C.; Lee, H.D. ReliefF for multi-label feature selection. In Proceedings of the 2013 Brazilian Conference on Intelligent Systems; IEEE: Piscataway, NJ, USA, 2013; pp. 6–11. [Google Scholar]
  19. Sahu, S.R.; Jena, S.; Panda, S. A Machine Learning Approach for Classification of Lemon Leaf Diseases. In Proceedings of the International Conference on Computing, Communication and Learning, Warangal, India, 29–31 August 2022; Springer: Berlin/Heidelberg, Germany, 2022; pp. 254–265. [Google Scholar]
  20. Pourdarbani, R.; Sabzi, S.; Dehghankar, M.; Rohban, M.H.; Arribas, J.I. Examination of lemon bruising using different CNN-based classifiers and local spectral-spatial hyperspectral imaging. Algorithms 2023, 16, 113. [Google Scholar] [CrossRef]
  21. Kaushik, P.; Khurana, S. Automated Lemon Quality Detection using DenseNet121: A Deep Learning Approach. In Proceedings of the 2025 International Conference on Electronics and Renewable Systems (ICEARS), Tuticorin, India, 11–13 February 2025; IEEE: Piscataway, NJ, USA, 2025; pp. 1907–1911. [Google Scholar]
  22. Pramanik, A.; Khan, A.Z.; Biswas, A.A.; Rahman, M. Lemon leaf disease classification using cnn-based architectures with transfer learning. In Proceedings of the 2021 12th International Conference on Computing Communication and Networking Technologies (ICCCNT), Kharagpur, India, 6–8 July 2021; IEEE: Piscataway, NJ, USA, 2021; pp. 1–6. [Google Scholar]
  23. He, Y.; Zhu, T.; Wang, M.; Lu, H. On lemon defect recognition with visual feature extraction and transfers learning. J. Data Anal. Inf. Process. 2021, 9, 233–248. [Google Scholar] [CrossRef]
  24. Selvaraju, R.R.; Cogswell, M.; Das, A.; Vedantam, R.; Parikh, D.; Batra, D. Grad-cam: Visual explanations from deep networks via gradient-based localization. In Proceedings of the IEEE International Conference on Computer Vision, Venice, Italy, 22–29 October 2017; pp. 618–626. [Google Scholar]
  25. Ullah, N.; Khan, J.A.; De Falco, I.; Sannino, G. Bridging clinical gaps: Multi-dataset integration for reliable multi-class lung disease classification with DeepCRINet and occlusion sensitivity. In Proceedings of the 2024 IEEE Symposium on Computers and Communications (ISCC), Paris, France, 26–29 June 2024; IEEE: Piscataway, NJ, USA, 2024; pp. 1–6. [Google Scholar]
  26. Lemon Quality Dataset. 2023. Available online: https://www.kaggle.com/datasets/yusufemir/lemon-quality-dataset (accessed on 6 January 2024).
  27. Corder, G.W.; Foreman, D.I. Nonparametric Statistics for Non-Statisticians; John Wiley & Sons, Inc.: Hoboken, NJ, USA, 2011. [Google Scholar]
  28. Liu, H.; Setiono, R. Chi2: Feature selection and discretization of numeric attributes. In Proceedings of the 7th IEEE International Conference on Tools with Artificial Intelligence, Herndon, VA, USA, 5–8 November 1995; IEEE: Piscataway, NJ, USA, 1995; pp. 388–391. [Google Scholar]
  29. Robnik-Šikonja, M.; Kononenko, I. Theoretical and empirical analysis of ReliefF and RReliefF. Mach. Learn. 2003, 53, 23–69. [Google Scholar] [CrossRef]
  30. Sawyer, S.F. Analysis of variance: The fundamental concepts. J. Man. Manip. Ther. 2009, 17, 27E–38E. [Google Scholar] [CrossRef]
  31. Ding, C.; Peng, H. Minimum redundancy feature selection from microarray gene expression data. J. Bioinform. Comput. Biol. 2005, 3, 185–205. [Google Scholar] [CrossRef] [PubMed]
  32. Yılmaz, E.K.; Adem, K.; Kılıçarslan, S.; Aydın, H.A. Classification of lemon quality using hybrid model based on Stacked AutoEncoder and convolutional neural network. Eur. Food Res. Technol. 2023, 249, 1655–1667. [Google Scholar] [CrossRef]
  33. Kaur, A.; Govindrao, P.S.; Mahajan, S. Lemon Perfection: Leveraging VGG16 Deep Learning for Superior Quality Assessment. In Proceedings of the 2024 Second International Conference Computational and Characterization Techniques in Engineering & Sciences (IC3TES), Lucknow, India, 15–16 November 2024; IEEE: Piscataway, NJ, USA, 2024; pp. 1–5. [Google Scholar]
  34. Bird, J.J.; Barnes, C.M.; Manso, L.J.; Ekárt, A.; Faria, D.R. Fruit quality and defect image classification with conditional GAN data augmentation. Sci. Hortic. 2022, 293, 110684. [Google Scholar] [CrossRef]
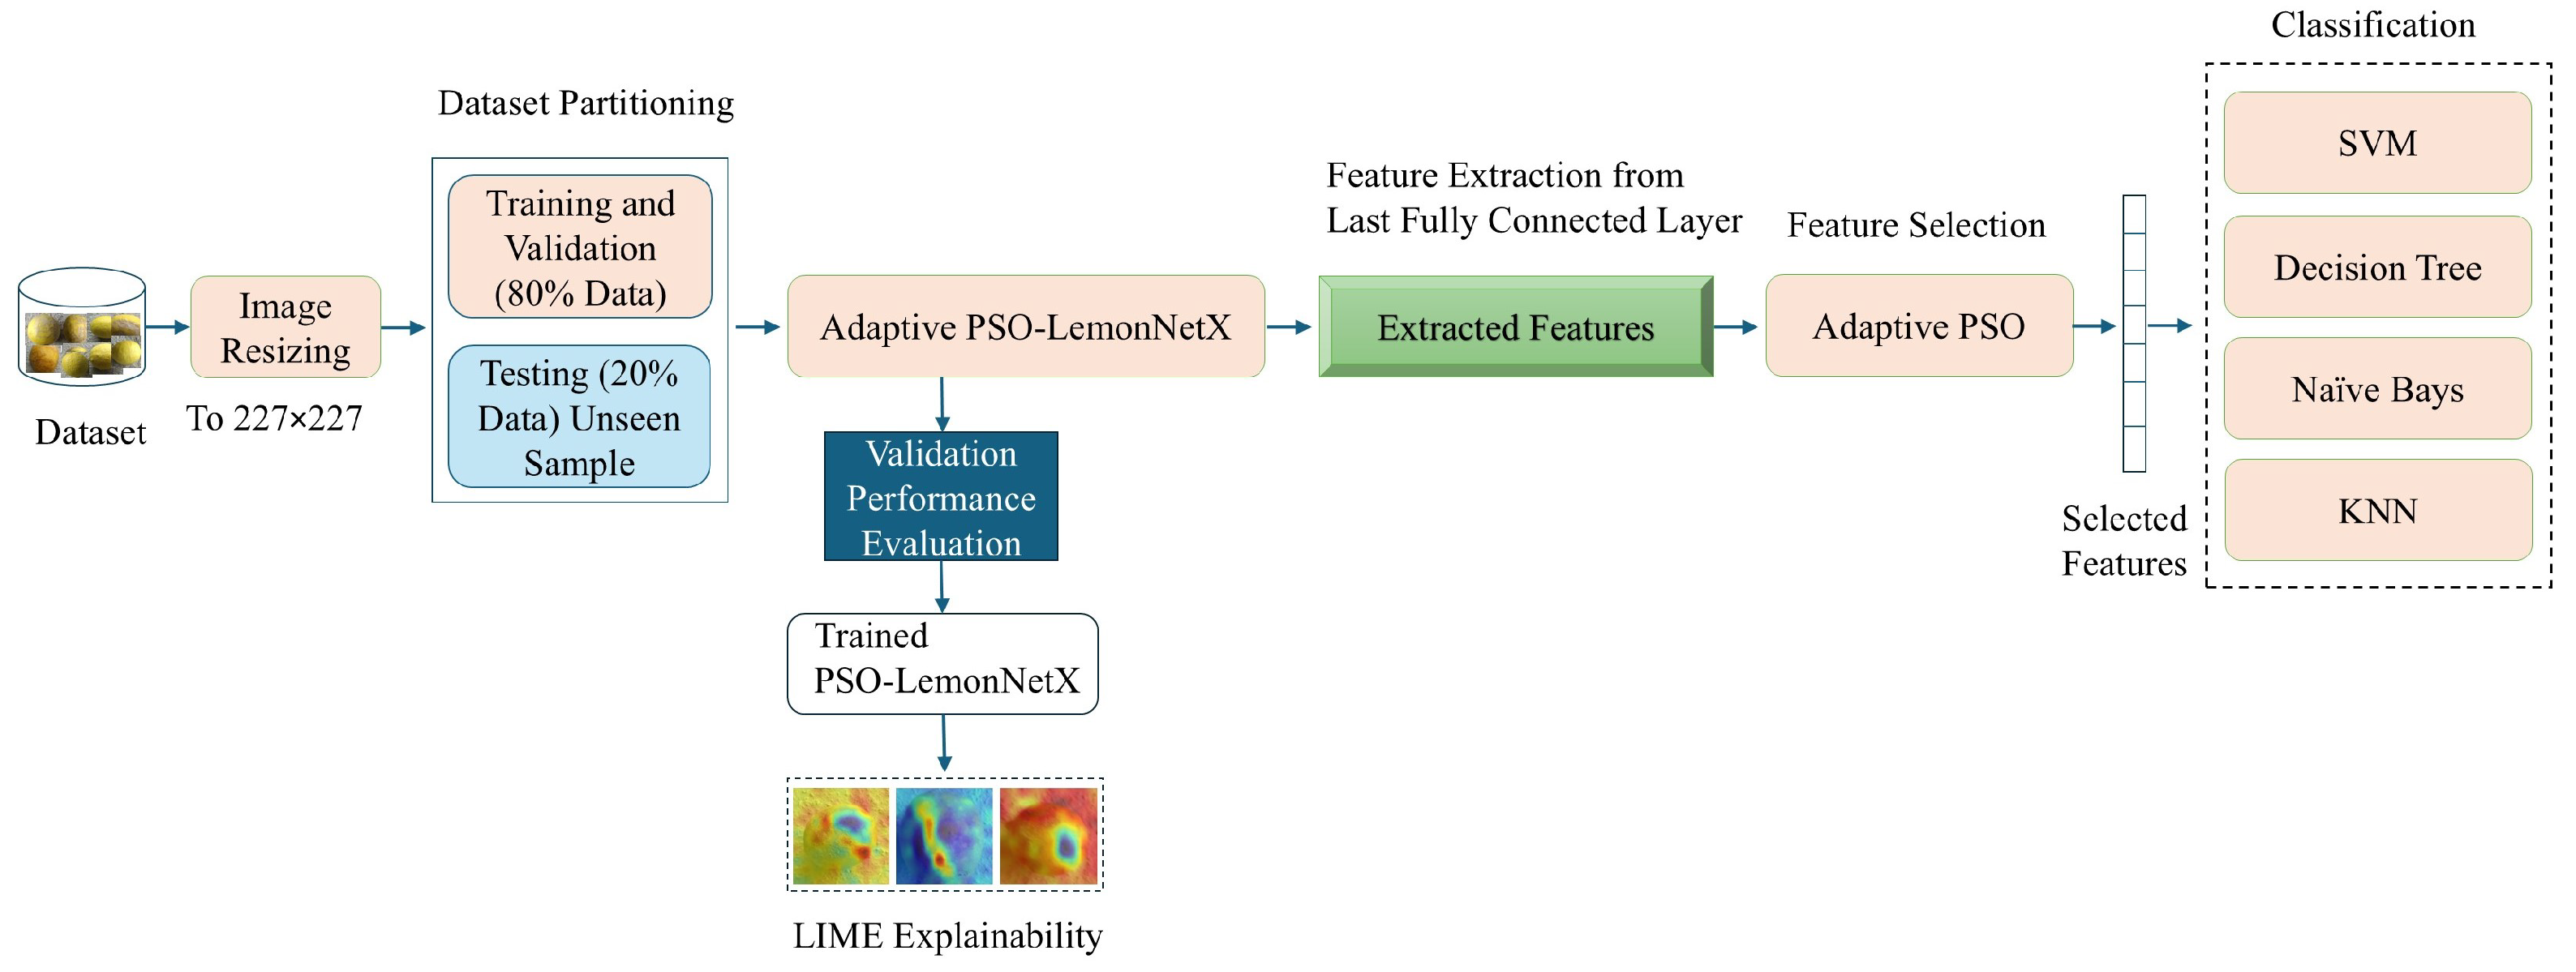
Figure 1. Abstract view of the proposed methodology for lemon disease classification.
Electronics 14 03928 g001
Figure 2. Architecture of the proposed adaptive PSO-LemonNetX deep learning model.
Electronics 14 03928 g002
Figure 3. Flowchart of adaptive Particle Swarm Optimization algorithm.
Electronics 14 03928 g003
Figure 4. Sample images of the lemon quality dataset; the first row shows normal images, whereas the second row shows diseased images.
Electronics 14 03928 g004
Figure 5. ROC curve of Adaptive PSO-LemonNetX on the unseen test set.
Electronics 14 03928 g005
Figure 6. LIME results. the first row has the original images of our dataset, the second row has LIME results, and the third row has the visualization results of the top six features.
Electronics 14 03928 g006
Figure 7. LIME incorrect results. The first row has the original images of our dataset, the second row has LIME results, and the third row has the visualization results of the top six features.
Electronics 14 03928 g007
Table 2. Adaptive PSO-LemonNetX architecture details.
S. NoOperationLayersNo of FiltersFilter SizePaddingStride
1 InputInput Layer
2ConvolutionConvolution (LReLU, CCN)9611 × 11 4 × 4
3PoolingMax pooling 3 × 3 2 × 2
4Shufflenet unitGroup convolution (LReLU, BN)341 × 1
Channel shuffling layer
Group convolution (LReLU, BN)13 × 3 1 × 1
Group convolution (LReLU, BN)343 × 3
5PoolingMax pooling 3 × 3 2 × 2
6Fire-moduleConvolution (BN, LReLU)481 × 1
Convolution (BN, LReLU)1921 × 1
Convolution (BN, LReLU)1923 × 31 × 1
7PoolingMax-Pooling 3 × 3 2 × 2
8Flatten Layer
9SelfAttention Layer
10FC + LReLU + BN + Dropout
11FC + Softmax + Classification
Table 3. Hyperparameters of the proposed architecture.
ParametersValues
Training Epochs20
Optimization algorithmSGDM
K-fold5
Dropout0.5
Activation functionLReLU
Learning rate0.001
Iterations per epoch10
Validation frequency30
Table 4. Parameter settings of baseline classifiers used in the experiments.
ClassifierParameter Settings
KNNMATLAB fitcknn, default parameters (Euclidean distance, k = 1 )
SVMMATLAB fitcsvm, default parameters (linear kernel)
Decision TreeMATLAB fitctree, default parameters (binary splits, Gini index)
Naive BayesMATLAB fitcnb, default parameters (Gaussian distribution)
Table 5. Validation (five-fold cross-validation) results of adaptive PSO-LemonNetX without PSO feature selection using images from Lemon Quality Dataset.
MetricsAccuracyPrecisionRecallF1-Score
Average98.598.398.498.3
Median98.498.098.598.2
Maximum99.199.099.099.0
Minimum98.298.098.098.0
Standard deviation0.30.40.40.4
Variance0.10.20.10.1
Table 6. Testing on unseen sample results of adaptive PSO-LemonNetX without PSO feature selection using images from Lemon Quality Dataset.
MetricsAccuracyPrecisionRecallF1-Score
Average97.197.097.097.0
Median97.197.097.097.0
Maximum97.397.597.097.2
Minimum96.396.596.096.2
Standard deviation0.40.40.40.4
Variance0.10.20.20.1
Table 7. Confusion matrix of Adaptive PSO-LemonNetX on the unseen test set (binary classification of lemon quality).
Predicted GoodPredicted Bad
Actual Good (225)219 (TP)6 (FN)
Actual Bad (190)6 (FP)184 (TN)
Table 8. PSO Parameters for Feature Selection.
ParameterValue
Number of particles (N)10
Maximum iterations (max_Iter)100
Cognitive factor ( c 1 )2
Social factor ( c 2 )2
Inertia weight (w)1
Objective functionMaximize classifier performance
Generic solution structureBinary feature vector
Execution time37 s
Table 9. Classification performance comparison of PSO-selected features and different classifiers on the training set.
MetricsAccuracyPrecisionRecallF1-Score
PSO features and KNN99.199.099.099.0
PSO features and SVM99.799.599.599.5
PSO features and DT99.499.599.599.5
PSO features and Naive Bayes100.0100.0100.0100.0
Table 10. Classification performance comparison of PSO-selected features and different classifiers on the testing set.
MetricsAccuracyPrecisionRecallF1-Score
PSO features and KNN95.295.095.595.2
PSO features and SVM98.898.599.098.7
PSO features and DT97.697.598.097.7
PSO features and Naive Bayes98.898.599.098.7
Table 11. Performance comparison of classifiers with all features vs. PSO-selected features.
Features + ML ClassifierAccuracy (%)Precision (%)Recall (%)F1-Score (%)
All features + KNN95.1894.59695.25
PSO features + KNN96.3996.596.596.5
All features + SVM96.3996.09796.5
PSO features + SVM98.8098.59998.75
All features + DT96.5795.59696.75
PSO features + DT97.5997.59897.75
All features + Naive Bayes96.3996.09796.5
PSO features + Naive Bayes98.8098.59998.75
Table 12. Comparison of adaptive PSO feature selection performance with traditional feature selection methods on lemon disease detection (testing set).
MetricsAccuracyPrecisionRecallF1-Score
Kruskal–Wallis96.996.597.096.7
( χ 2 )96.196.096.596.2
ReliefF96.496.096.596.2
ANOVA96.496.096.596.2
MRMR96.796.596.596.5
Adaptive PSO98.898.599.098.75
Table 13. Performance comparison of PSO-LemonNetX with established CNN feature extractors using Adaptive PSO and NB/SVM classifiers on the test set.
Model + Adaptive PSO + ClassifierAccuracy (%)Precision (%)Recall (%)F1-Score (%)
VGG16 + PSO (NB)95.294.994.694.7
VGG16 + PSO (SVM)95.895.595.295.3
ResNet50 + PSO (NB)97.096.796.696.6
ResNet50 + PSO (SVM)97.497.197.097.0
DenseNet121 + PSO (NB)97.897.597.397.4
DenseNet121 + PSO (SVM)98.097.897.697.7
EfficientNet-B0 + PSO (NB)98.297.997.797.8
EfficientNet-B0 + PSO (SVM)98.498.197.998.0
PSO-LemonNetX + PSO (NB)98.898.599.098.7
PSO-LemonNetX + PSO (SVM)98.898.599.098.7
Table 14. Comparison of Adaptive PSO-LemonNetX with State-of-the-Art Methods.
Ref.MethodDatasetAccuracy (%)Explainability
 [32] (2023)SAE–CNN Hybrid: Combined GLCM, Color Space, Morphological features; SAE for dimensionality reduction; hybrid CNN with ML classifiers (SVC, Ridge, Subspace Discriminant)Lemon quality dataset98.96None
 [33] (2024)VGG16: Deep CNN architecture trained on lemon images; three-class classification (good, poor, background)Lemon quality dataset97.0None
 [34] (2022)GAN–VGG16: Transfer learning with VGG16; appended 4096-neuron FC layer; Conditional GAN for data augmentation; model pruning for efficiencyPublic Lemon Dataset (2690 images)88.75Grad-CAM
 [21] (2025)DenseNet121: Preprocessing with resizing, normalization, CLAHE, augmentation; binary classification (good vs bad lemons)Kaggle Lemon Dataset (2076 images)96.0None
This WorkAdaptive PSO-LemonNetX (Proposed): PSO-based adaptive feature selection, lightweight CNN, edge-friendly designLemon quality dataset100LIME
Disclaimer/Publisher’s Note: The statements, opinions and data contained in all publications are solely those of the individual author(s) and contributor(s) and not of MDPI and/or the editor(s). MDPI and/or the editor(s) disclaim responsibility for any injury to people or property resulting from any ideas, methods, instructions or products referred to in the content.