Article

Real-Time True Wireless Stereo Wearing Detection Using a PPG Sensor with Edge AI

Department of Electronic Engineering, Seoul National University of Science and Technology, Seoul 01811, Republic of Korea
*
Author to whom correspondence should be addressed.
Electronics 2025, 14(19), 3911; https://doi.org/10.3390/electronics14193911
Submission received: 30 August 2025 / Revised: 28 September 2025 / Accepted: 29 September 2025 / Published: 30 September 2025

Abstract

True wireless stereo (TWS) earbuds are evolving into multifunctional wearable devices, offering opportunities not only for audio streaming but also for health-related applications. A fundamental requirement for such devices is the ability to accurately detect whether they are being worn, yet conventional proximity sensors remain limited in both reliability and functionality. This work explores the use of photoplethysmography (PPG) sensors, which are widely applied in heart rate and blood oxygen monitoring, as an alternative solution for wearing detection. A PPG sensor was embedded into a TWS prototype to capture blood flow changes, and the wearing status was classified in real time using a lightweight k-nearest neighbor (k-NN) algorithm on an edge AI processor. Experimental evaluation showed that incorporating a validity check enhanced classification performance, achieving F1 scores above 0.95 across all wearing conditions. These results indicate that PPG-based sensing can serve as a robust alternative to proximity sensors and expand the capabilities of TWS devices.

1. Introduction

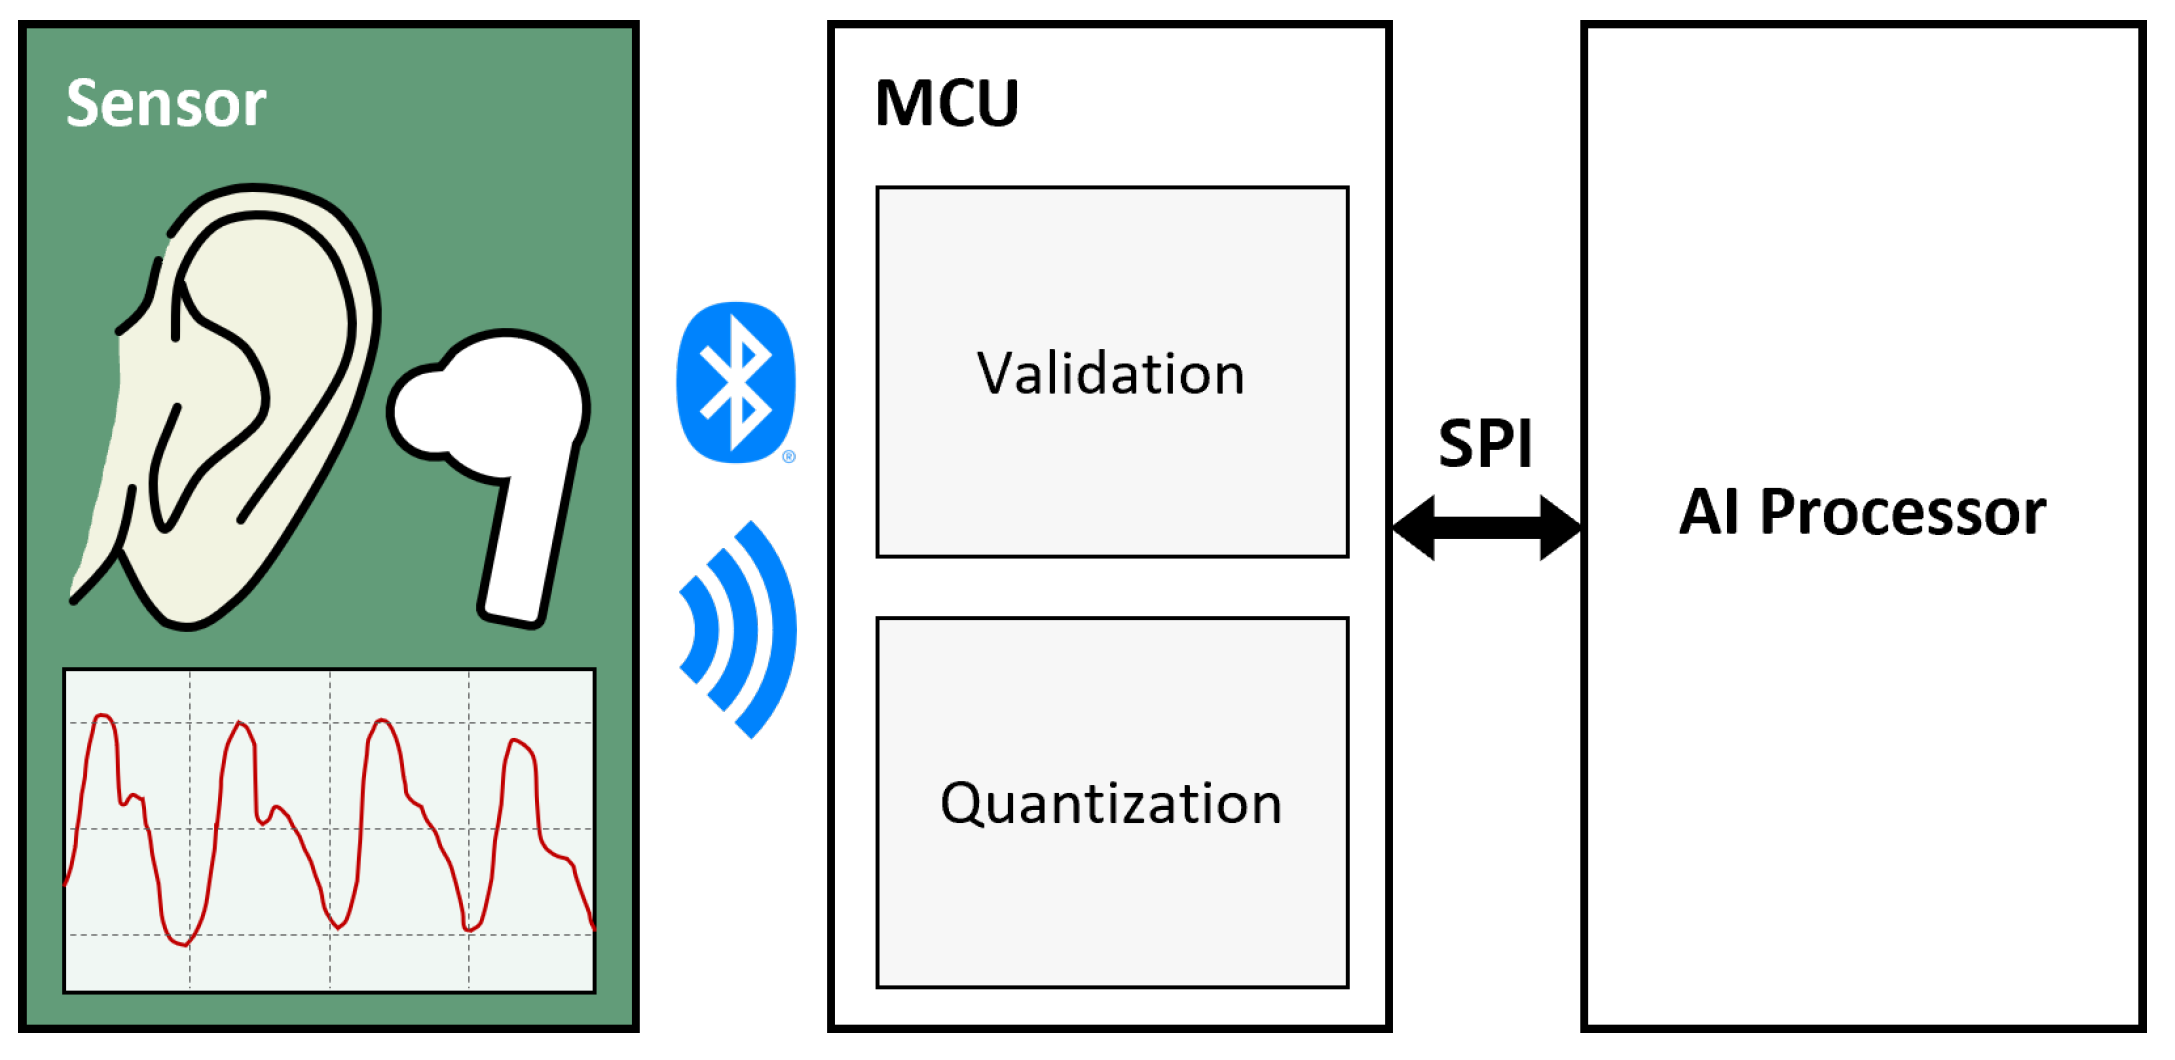
True wireless stereo (TWS) is one of the most widely used electronic devices in our daily lives. TWS devices, which provide audio playback during activities such as exercise, studying, and work, are becoming increasingly multifunctional [1]. Recent models of TWS devices feature additional capabilities such as noise cancellation, head motion recognition, and finger gesture recognition [2,3,4,5]. However, despite the expanding functionality and smart capabilities of TWS devices, they still rely on proximity sensors to determine whether they are being worn. Most commercial TWS devices integrate two proximity sensors for wear detection [6]. These sensors primarily serve to identify whether the device is being worn but do not play a significant role once the device is in use. Given the nature of TWS devices, which are worn in the ear, there are limitations on increasing their weight and size. Thus, it is essential to effectively integrate sensors, speakers, Bluetooth modules, and other components within the limited hardware specifications [7]. Considering this, it is not efficient to allocate significant hardware space to proximity sensors that do not play a crucial role once the device is worn. Figure 1 illustrates the proposed method’s perspective on how proximity sensors are replaced. Additionally, since proximity sensors are typically located closest to the skin, they have the potential for high sensing efficiency if replaced with other sensors designed to gather physiological information. As efforts to measure biometric information via TWS devices are on the rise, this study is a meaningful endeavor.
Wearable devices capable of collecting biometric information are becoming increasingly popular with the growing interest in health management [8,9]. Healthcare wearable devices offer convenience by enabling real-time monitoring of physiological information, free from location constraints and the need for specialized equipment or hospital visits. These health-oriented wearable devices incorporate various sensors to measure and analyze biometric signals. Among these, heart rate (HR) monitoring is frequently employed to assess individual health status [10]. Several approaches are utilized to measure HR, including photoplethysmography (PPG) and electrocardiogram (ECG) technologies [11]. Each sensor captures distinct signals that can be used to measure HR. PPG sensors detect changes in blood volume (BV) to measure biometric information like HR and blood oxygen (BO) saturation. The non-invasive characteristics of PPG sensors are considered a promising alternative to current proximity sensors. Therefore, this study aims to replace conventional proximity sensors with PPG sensors. Ensuring the smooth operation of TWS devices hinges on confirming correct wear, rather than solely measuring the exact distance between the ear and the sensor. However, due to the sensitivity of PPG sensors, it is essential to validate the sensor data before confirming the wearing status, especially considering the noise generated during wear or movement. This paper introduces a real-time wearing detection approach that employs the finite difference method for sequential data validation and utilizes the k-nearest neighbor (k-NN) algorithm, which is tailored for classification tasks. By substituting conventional proximity sensors with PPG sensors, this approach aims to incorporate additional healthcare functionalities enabled by PPG sensors. In addition, recent advances in energy-harvesting technologies for earbuds suggest the feasibility of self-powered operation, which could further complement PPG-based sensing by enabling long-term and autonomous healthcare applications [12].
The remainder of this paper is organized as follows. Section 2 reviews prior research on alternative sensor technologies for TWS wearing detection. Section 3 introduces the principles and applicability of PPG sensors. Section 4 describes the proposed system design, including validity checking and k-NN classification on an edge AI processor. Section 5 presents the experimental setup and results, and Section 6 concludes with implications and future directions.

2. Related Works

The sensors embedded in TWS devices are increasingly varied in functionality [2]. Despite the variety of sensors available, detecting the wearing status is primarily achieved through proximity sensors. Widely popular earphones incorporate multiple proximity sensors. However, these sensors can mistakenly indicate that the device is being worn when it is placed in a pocket or on a desk due to nearby obstructions. Recent approaches address these issues by determining wearing status without relying solely on proximity sensors. These methods utilize built-in speakers or microphones to detect sound patterns indicative of usage, or employ other sensors integrated into the device. Although research in this area is not extensive, a few notable examples demonstrate promising advancements.
Laput, G. et al. suggested a wearing detection technique utilizing the built-in speakers and microphones of earbuds [13]. This technique emits inaudible frequencies from the built-in speaker, which are monitored by the microphone, inferring the wearing status through artificial intelligence based on the captured data. This approach demonstrated an average accuracy of 94.8%. A significant advantage is that additional sensors are not necessary, as existing speakers and microphones of typical TWS devices are employed. However, constraints remain: devices capable of supporting the high sampling rates needed to generate inaudible frequencies are limited, and partial wearing of earbuds leads to acoustic leakage, which complicates accurate prediction.
Fan, X. et al. determine wearing status through frequency resonance [14]. Inspired by the resonance observed when a seashell is held close to the ear, this technique utilizes the resonance created in the ear canal when earphones are worn. Experiments conducted with 54 different wearable devices showed an accuracy of over 97.93%, and the deeper the TWS device is inserted into the ear canal, the less it is affected by ambient noise. Like the previous approach, additional sensors are not necessary, as built-in speakers and microphones are employed. However, additional pairing devices are necessary to measure the resonance signal accurately.
In addition to approaches utilizing built-in speakers and microphones, there is also research involving the incorporation of novel sensors for determining wearing status [15]. Matsumura, K. et al. proposed an earphone-wearing detection method utilizing a skin conductivity sensor. This approach measures electrical resistance through the body by means of a skin conductivity sensor to ascertain the wearing status. Additionally, it employs a proximity sensor to gauge the distance between the earphone and the pinna. The direct measurement of these resistive properties via the skin conductivity sensor ensures high accuracy. However, this method necessitates both earphones to accurately determine wearing status, and like the proximity sensor, the skin conductivity sensor has limited applicability.
The approach proposed in this study closely resembles the method introduced by Jeong, Y. et al., which utilizes PPG for distance measurement [16]. Their research investigated the optimal technique for estimating the distance between the ear and the device through PPG signals. They conducted preprocessing on the input PPG data with various filters, such as Kalman, Short-Time Fourier Transform, and Wavelet Analysis. Subsequently, the processed data was fed into AI algorithms, including k-NN and MobileNet, and their performance was evaluated through metrics such as F1 score and inference time. The findings demonstrated that employing the waveform adjustment (WA) filter and one-dimensional MobileNet for inference achieved an accuracy of 92.5%, exhibiting superior performance with an inference time of 1.561 milliseconds, thereby indicating the feasibility of real-time operation. However, algorithms requiring high computational resources like MobileNet are not deemed suitable for TWS devices, and it remains unclear whether such inference times are achievable in actual edge environments.
Inspired by the study conducted by Jeong Y. et al., our research proposes a real-time wearing detection approach utilizing the k-NN algorithm [16]. The k-NN algorithm was chosen for its low computational requirements and parameter-free nature, minimizing performance degradation. To address noise generated during movement when utilizing PPG signals, we simultaneously perform validity checks through the finite difference method, ensuring that only valid data are handled. Research on applying PPG sensors to TWS devices is still limited, and studies focusing on determining wearing status through PPG signals are even rarer, highlighting the significance of the findings from this study.
Table 1 below illustrates related works that have determined wearing status through methods other than proximity sensors.

3. Photoplethysmography

Among the sensors for health monitoring, ECG is considered the gold standard for measuring HR in medical devices. However, ECG requires electrode pads to be attached near the clavicle and chest, making it unsuitable for wearable devices that prioritize portability [17]. An alternative sensor to ECG is the PPG sensor. PPG sensors operate non-invasively with a light source and photodetector. The light emitted by the source passes through the skin, where it is absorbed or reflected by the blood. The photodetector then detects changes in the returned light to measure changes in BV [18]. Due to their small size, non-invasive nature, and ease of use, PPG sensors are frequently employed in wearable devices such as smartwatches.
Sergei Vostrikov et al. utilized a single PPG sensor to simultaneously measure HR and respiration rate, comparing the results with those obtained through ECG. They found that the PPG sensor showed less than 4% error compared to ECG, thereby validating the reliability of PPG sensors [19]. Additionally, D. T. Weiler et al. compared PPG and ECG sensors for resting and exercise states, noting minimal differences, especially at lower HRs [20]. Besides HR measurement, PPG sensors are useful for measuring various physiological signals depending on the signal processing techniques employed. PPG signals are utilized to assess the following physiological information [21,22,23]:
  • Heart rate monitoring;
  • SpO2 monitoring;
  • Blood pressure monitoring;
  • Respiratory rate monitoring.
Research on other biometric signals with PPG is ongoing, suggesting a high potential for PPG sensors in TWS for health monitoring [24,25]. Despite these advantages, PPG sensors are sensitive to external environmental factors. PPG signals are affected by changes in lighting, skin tone, and movement. Khalida Azudin et al. reviewed various studies and proposed the potential use of PPG sensors in hearable devices but identified challenges in addressing errors during intense physical activities [26]. Andrea Ferlini tested PPG sensors worn on the ear during exercise and found up to 30% error during intense movement, highlighting the importance of preprocessing when applying PPG sensors on the ear [27]. These studies emphasize the need to address noise when employing PPG sensors. To minimize noise, it is essential to identify optimal locations with minimal interference. Utilizing various signal processing and correction techniques is also crucial.
PPG sensors need to be worn on areas with abundant blood flow to measure BO saturation accurately. Suitable locations include the forehead, neck, wrist, and fingers. Serj Haddad et al. compared PPG signals collected from the fingers and ears, concluding that data from the ear provided higher HR detection accuracy and more precise inter-beat interval estimation than finger measurements [28].
Research on noise reduction in PPG signals has also been active recently. Sivanjaneyulu, Y. et al. proposed applying convolutional neural networks to detect and classify noise types in PPG signals and evaluate performance [29]. Shresth Gupta et al. employed the Savitzky–Golay filter to remove noise from PPG signals but noted limitations in removing noise during significant movements [30]. Rabia Ahmed et al. explored noise reduction in PPG with feed forward networks and wavelet transformations [31]. Yohei Tomita applied PPG sensors to both left and right earbuds and utilized the differences between the two sensors to mitigate noise caused by movement [32]. While various methods for PPG noise reduction exist, AI algorithms requiring numerous parameters and high computational resources are more suitable for professional medical equipment and high-performance computers, rather than small embedded devices like TWS. This study addresses these considerations by employing a finite difference method for validity checks to effectively handle noise, as explained in Section 4.

4. Methodology

Figure 2 illustrates the overall flow of the proposed method. The process is organized into the following steps:
1.
Signal acquisition: The PPG sensor embedded in the TWS prototype measures blood flow changes in the ear canal. The analog signal is digitized and transmitted to the microcontroller unit (MCU) via Bluetooth.
2.
Segment buffering: The MCU accumulates the incoming signal until a specified segment length is reached, ensuring consistent windowed processing.
3.
Validity check: For each buffered segment, the MCU applies the finite difference method to evaluate signal quality. This step filters out segments corrupted by noise or motion artifacts.
4.
Invalid segment handling: If the data is deemed invalid, the system does not forward it to the AI processor. Instead, the previously inferred result is retained to prevent erroneous changes in classification.
5.
Quantization: When the data is valid, the signal is quantized into 8-bit resolution to reduce computational load while preserving key features.
6.
Data transmission: The quantized segment is transferred from the MCU to the edge AI processor through a serial peripheral interface (SPI), enabling efficient communication.
7.
Classification: The edge AI processor applies the k-nearest neighbor (k-NN) algorithm. For each valid input, distances to the stored training data are computed, and the label with the highest majority vote is assigned. This real-time classification determines the wearing status of the TWS (fully worn, partially worn, or not worn).

4.1. Validation

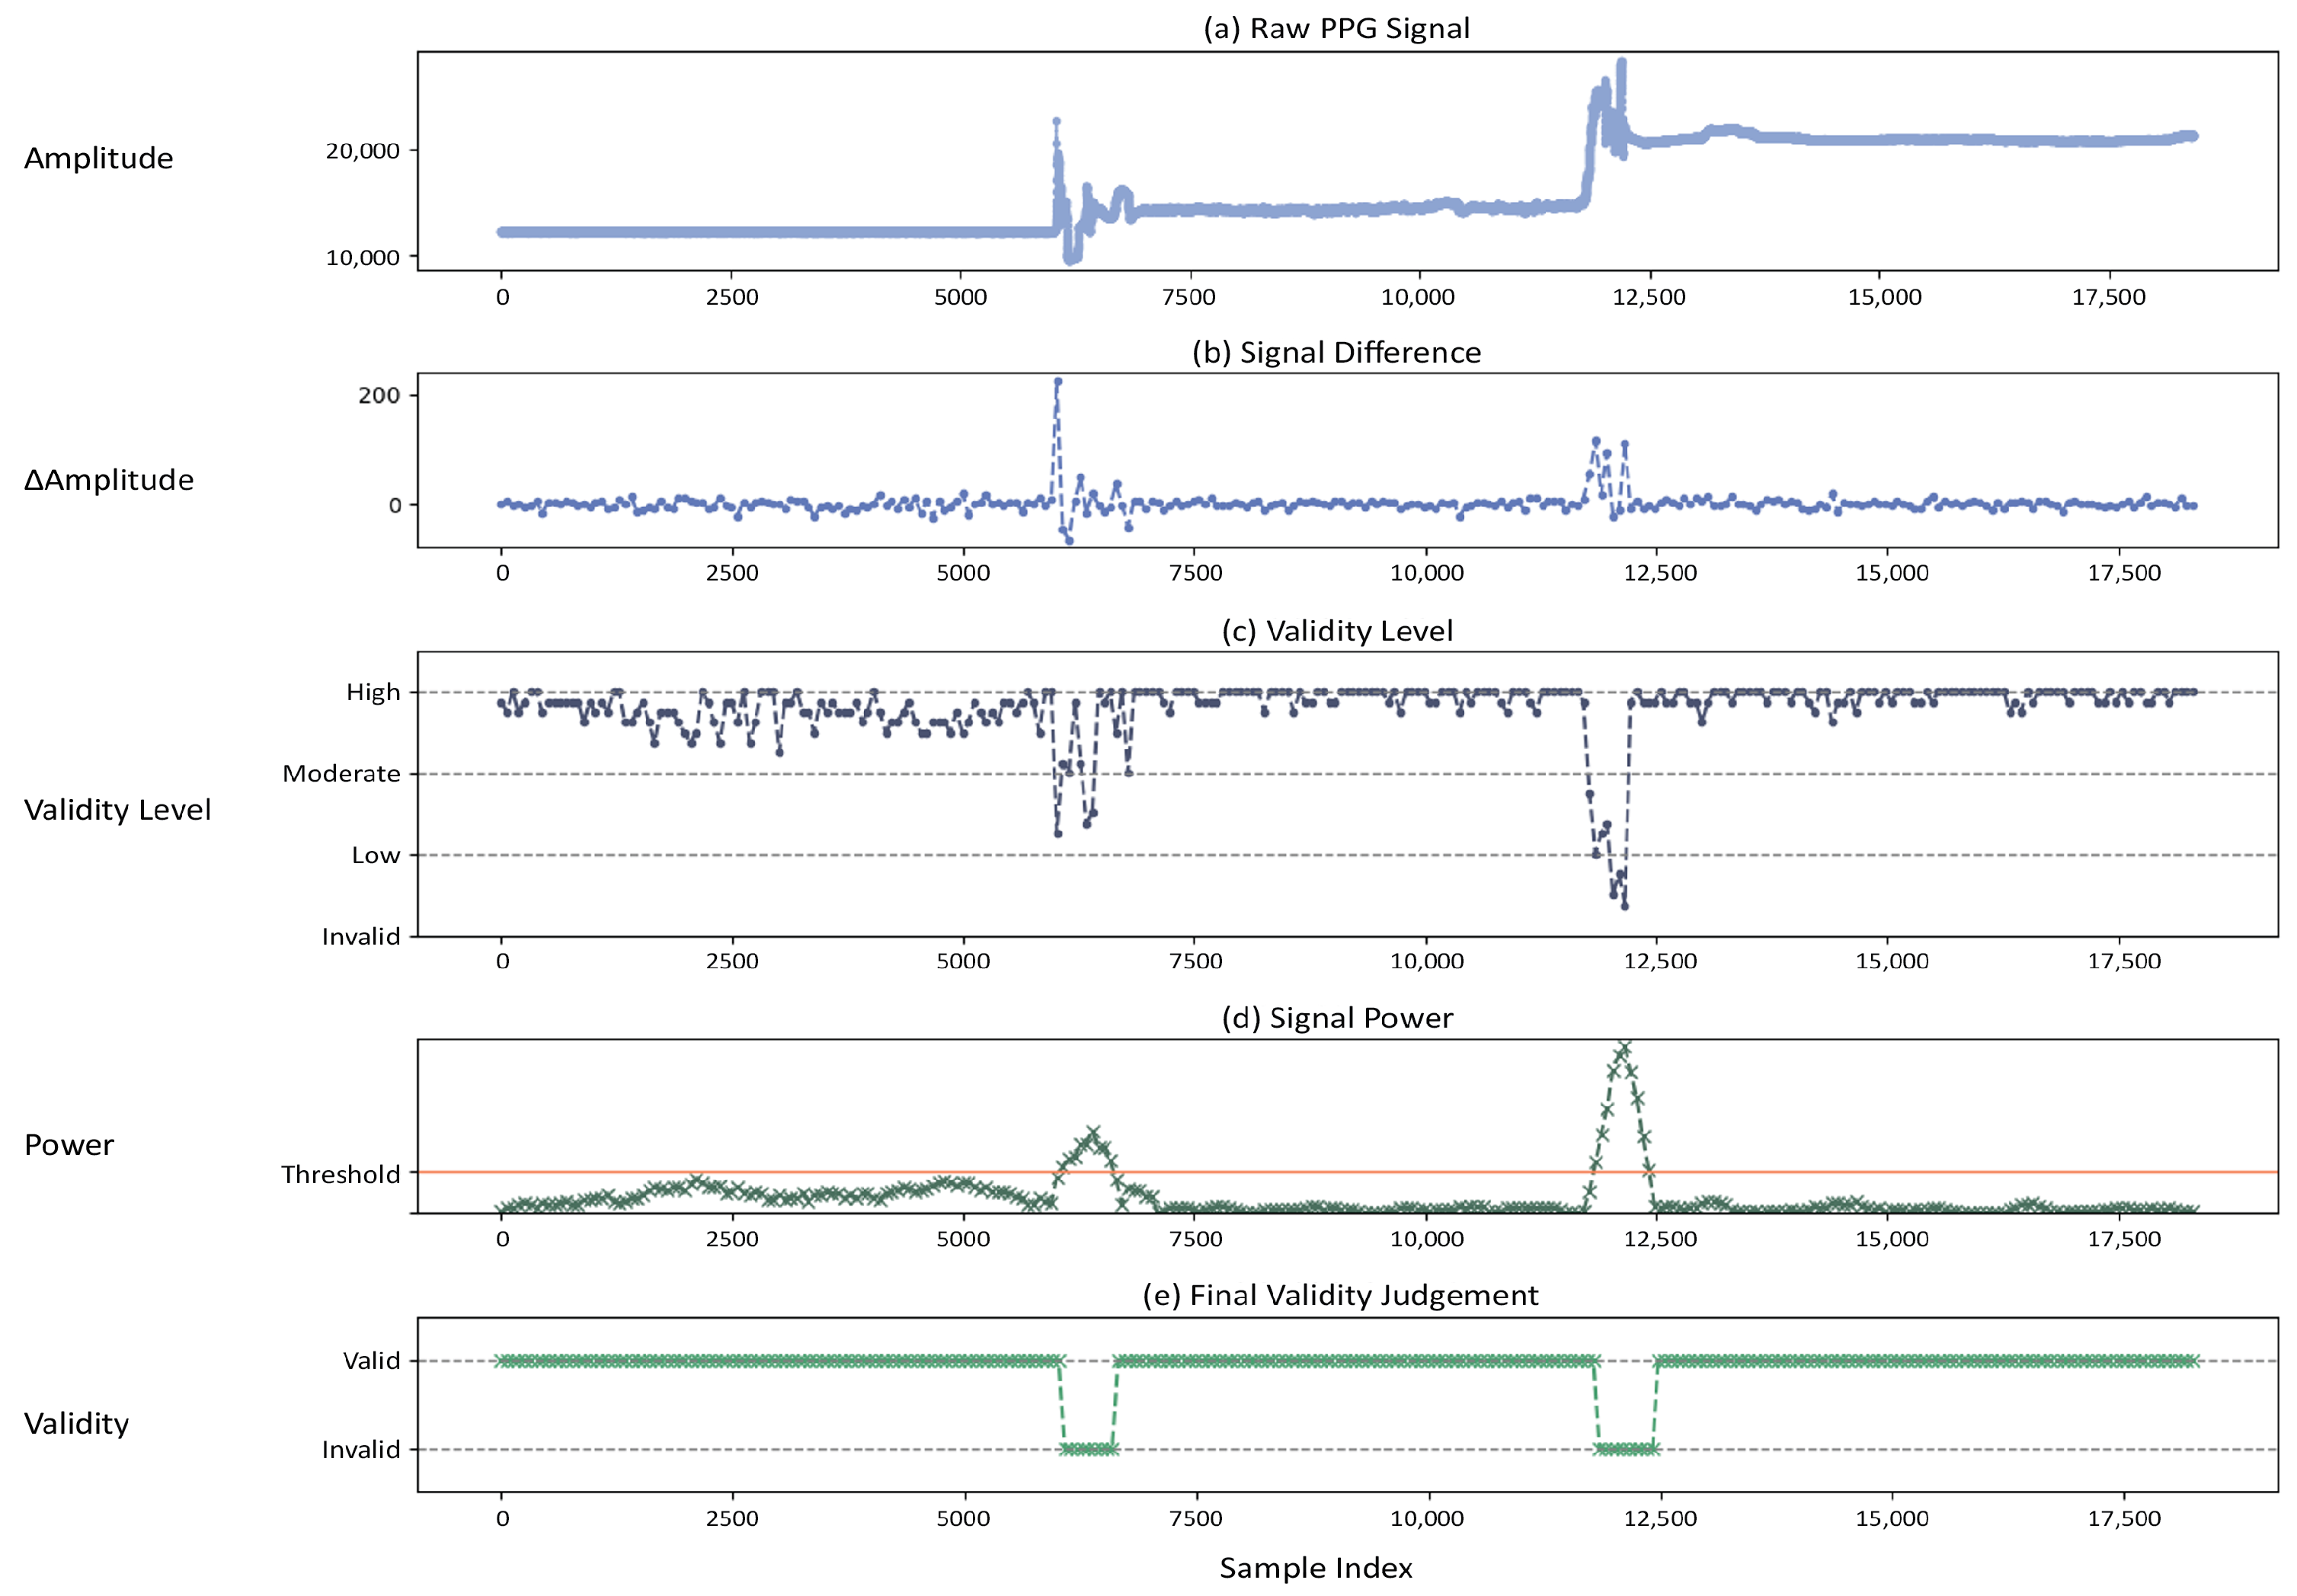
Before classifying the wearing status with PPG signals, a validity check was performed. As indicated by various studies introduced in Section 3, PPG sensors are susceptible to noise caused by the wearing position and vigorous movements such as exercise. Therefore, to prevent errors due to noise, it is necessary to either remove the noise or identify its occurrence to validate the data. In this paper, we utilized a finite difference method for the validity check to determine whether the data is valid. Figure 3 illustrates the entire validation process.
Figure 3 depicts the following steps:
  • Panel (a) shows the raw data from the PPG sensor, which includes two segments affected by noise.
  • Panel (b) shows the signal after applying a finite difference filter, which removes the direct current component and retains only the rate of change.
  • Panel (c) computes the absolute value of selected samples, averages them, and classifies the validity into four levels, High, Moderate, Low, and Invalid, based on a predefined threshold.
  • Panel (d) assigns different weights to each validity level, sums them, and calculates the signal power, which is then compared against the Validity Threshold.
  • Panel (e) presents the Final Validity Judgment as a binary output (Valid or Invalid). In this example, the noisy sections are successfully classified as Invalid. This method is computationally efficient since it avoids complex operations such as multiplication and division, making it well suited for resource-constrained hardware environments such as true wireless stereo (TWS) devices.

4.2. k-Nearest Neighbor (k-NN)

k-NN is a machine learning model suitable for classification [33]. It operates in two main phases: training and inference.
  • Training: Stores all available data points and their corresponding class labels. This phase involves no explicit training processes like parameter estimation in other models, such as neural networks or decision trees.
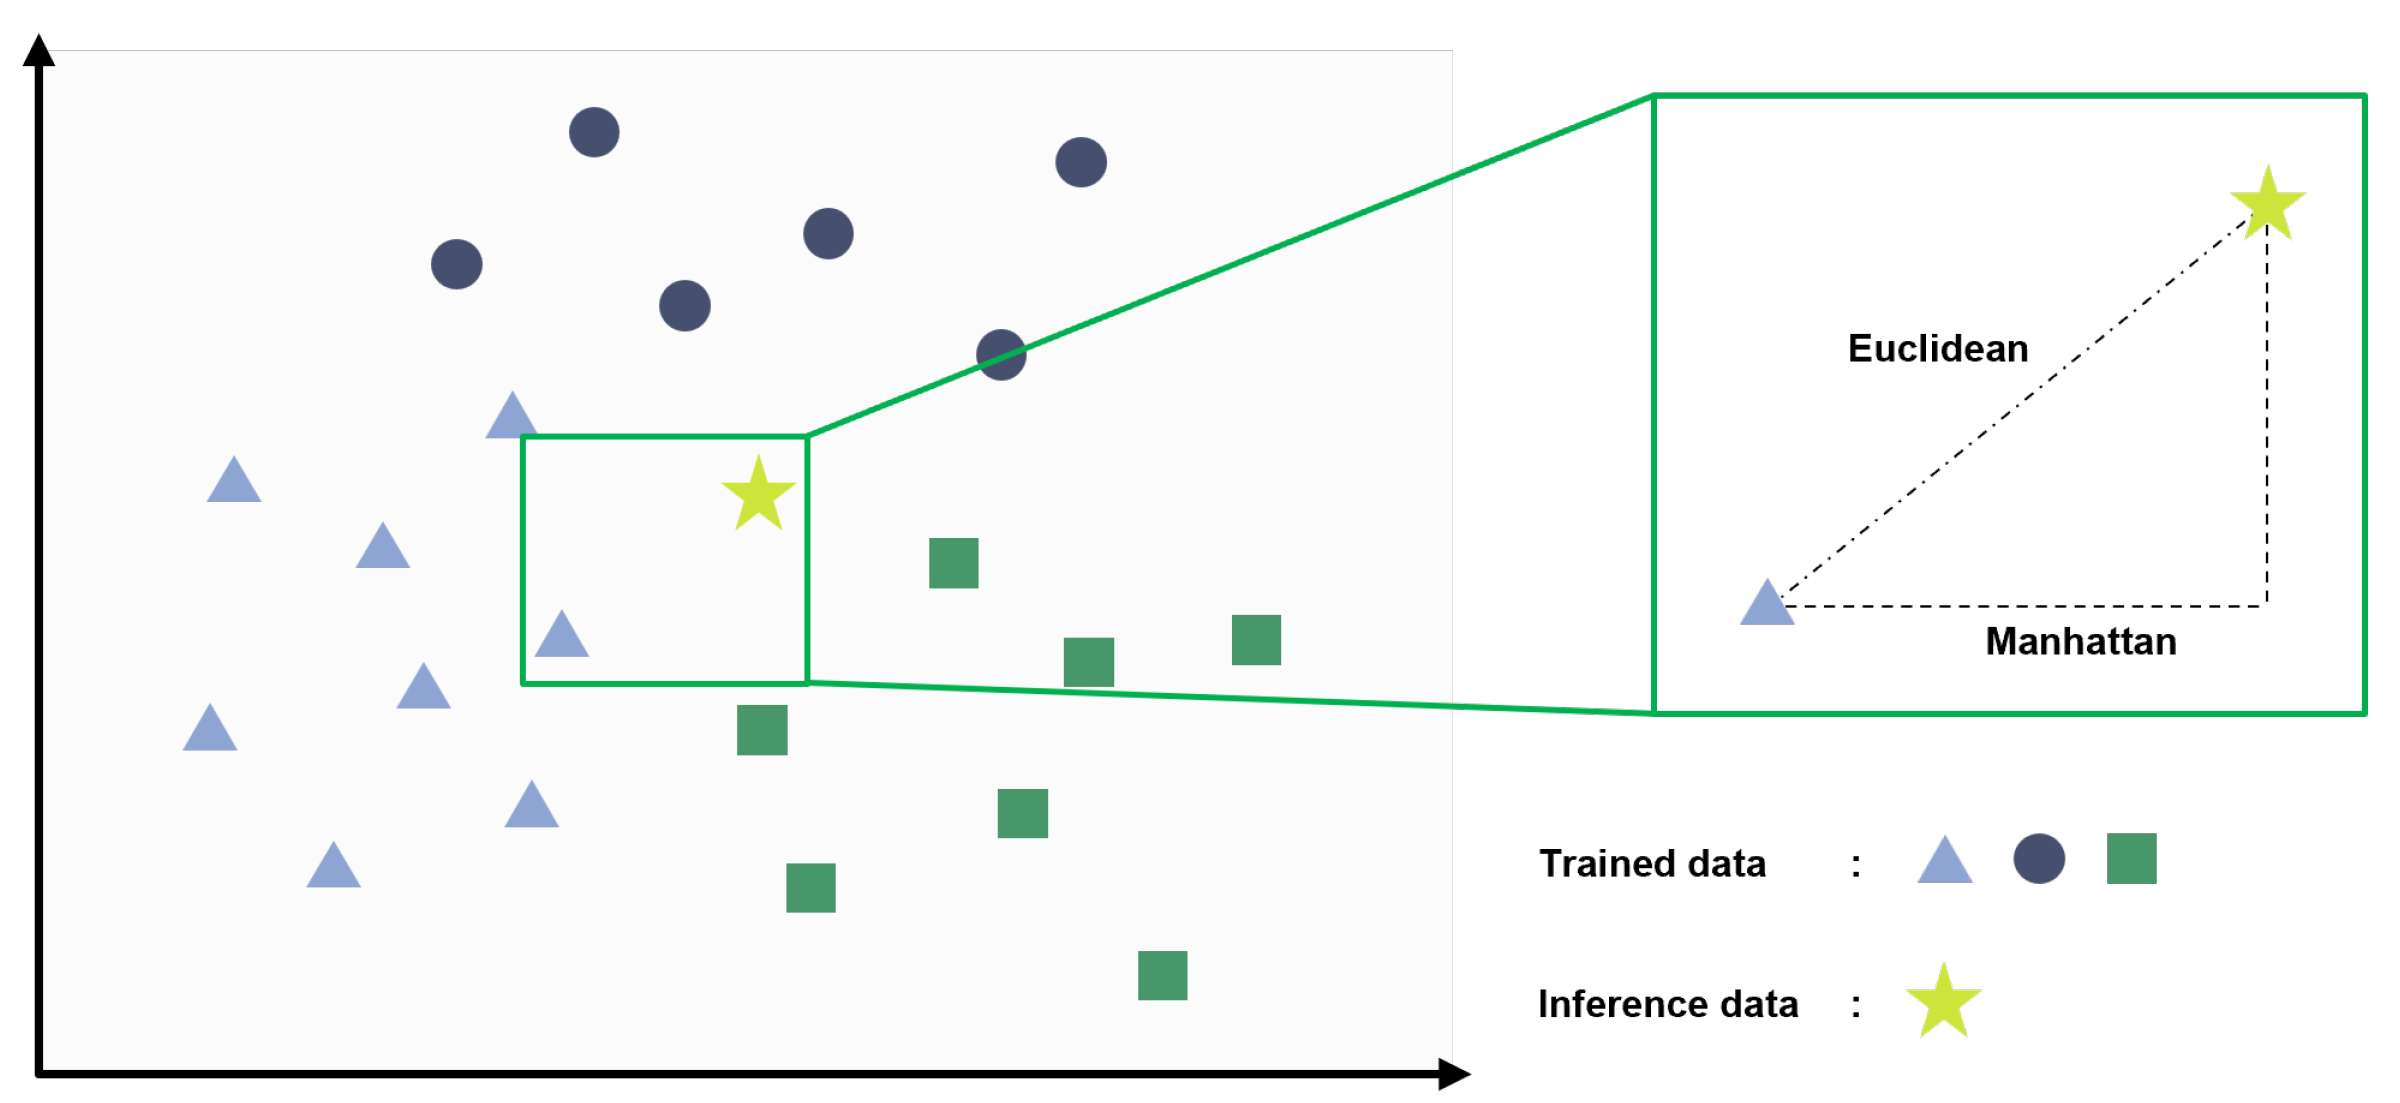
  • Inference: Measures the distance between the input feature vector and each stored training data point. It then identifies the labels of the k-NN and uses majority voting to determine the final classification result.
Figure 4 illustrates the k-NN inference process. Distances are typically measured by Euclidean or Manhattan distances. Unlike convolutional or transformer-based AI models, k-NN does not require parameters and involves simple distance calculations, making it ideal for embedded environments with limited computational resources.

4.3. Edge AI Processor

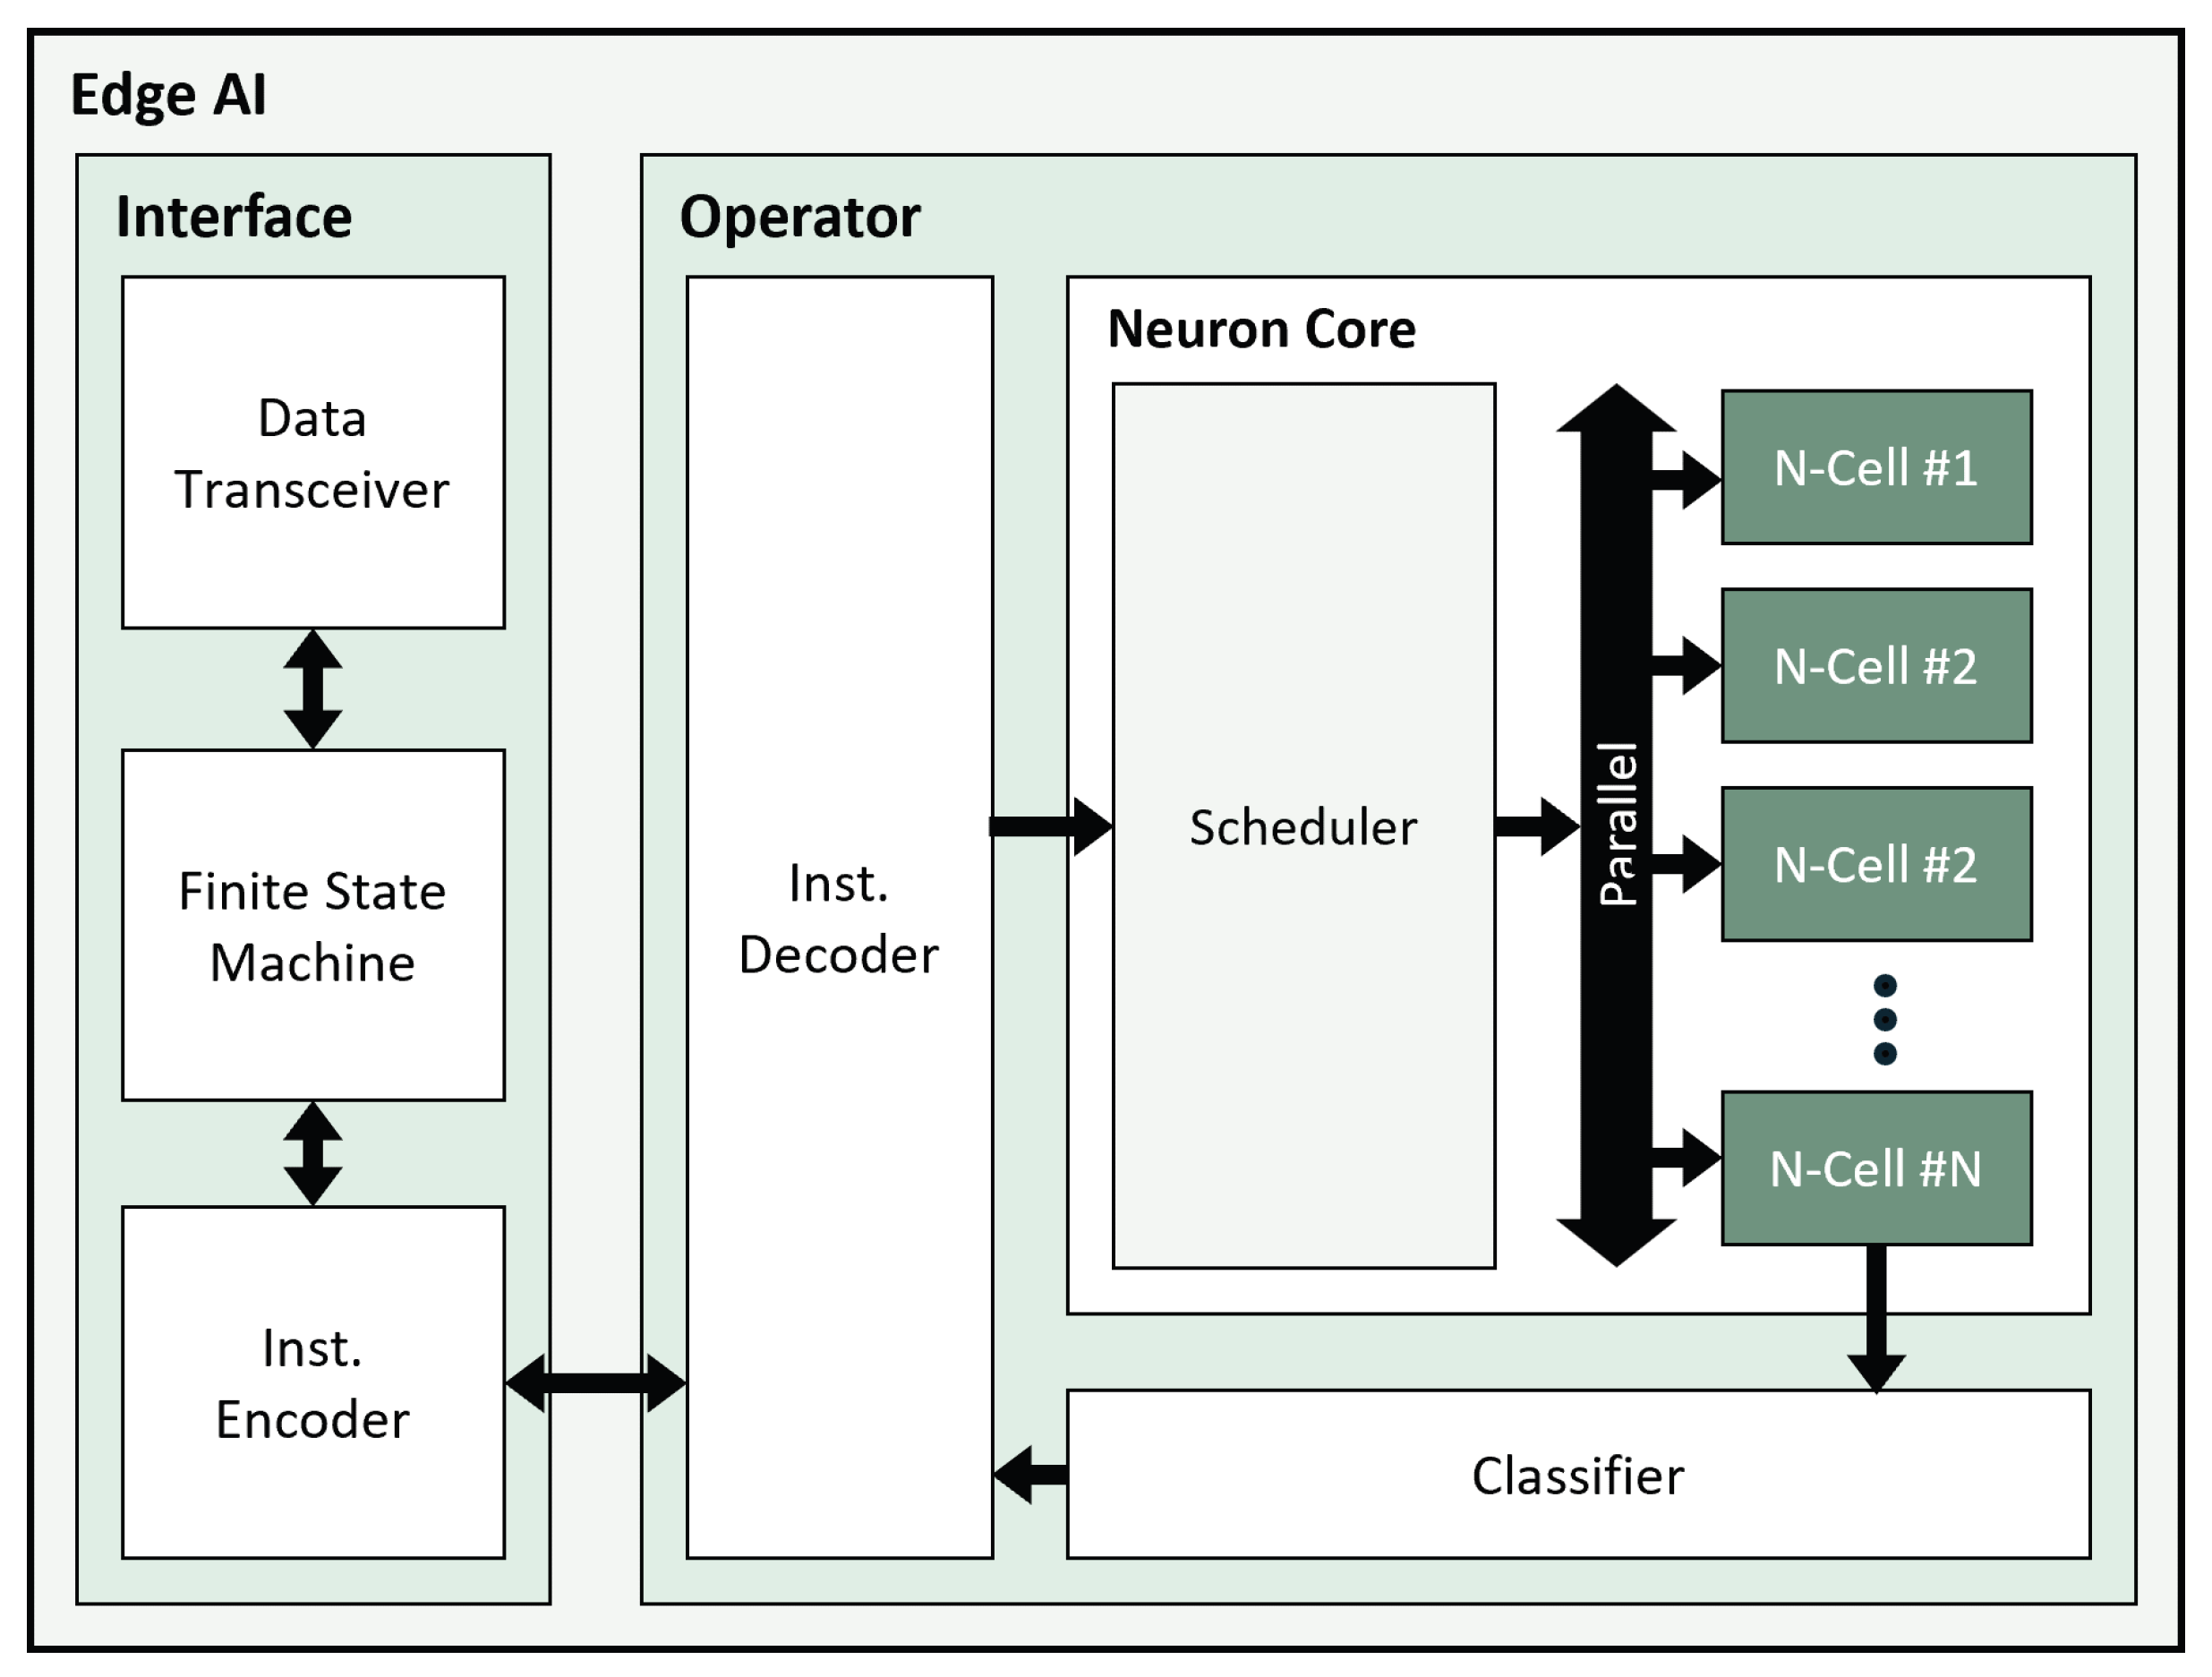
The edge AI processor in this study is specialized in classification tasks, implementing the k-NN algorithm described earlier [34]. It is primarily employed for image classification tasks, such as determining the ripeness of fruit and detecting dangerous situations by analyzing human movements to protect against hazards like accidents or falls [35,36]. Depending on the data preprocessing method, it also classifies sequential data; for example, it can evaluate the validity of ultrasound signals or identify the sound of breaking glass [37,38]. Figure 5 shows the architecture of the edge AI. The edge AI consists of Interface and Operator components:
  • Interface: Manages data exchange with external sources, comprising the Data Transceiver, Finite State Machine (FSM), and Instruction Encoder. The Data Transceiver receives datasets or instructions for learning and inference. The FSM interprets the received data per specific protocols, and the Instruction Encoder encodes the interpreted data for transmission to the Operator.
  • Operator: Includes the Instruction Decoder, Neuron Core (N-core), and Classifier, performing learning and inference based on input data. The Instruction Decoder processes encoded information about data, categories, distances, and algorithm details, directing the N-core’s operations. N-core, with a Scheduler and parallel-connected Neuron Cells (N-cells), stores training data and corresponding categories during training. In recognition tasks, N-core calculates distances between input data and stored data in each N-cell. Results are sent to the Classifier, which determines the category of the input data based on the smallest distance, utilizing either the k-NN algorithm employed in this paper or the radial basis function neural network algorithm.
Increasing the number of N-cells significantly raises memory requirements. Hence, choosing the appropriate vector size and N-cell count depends on the sizes of the model’s data and hardware specifications. However, edge AI faces limitations in the number of N-cells needed for extensive learning, restricting the amount of learnable data. Hence, setting the appropriate quantity and type of data being learned is crucial. Additionally, the AI processor lacks parameters to capture temporal correlations between past and present input data, limiting its ability to handle evolving data over time. Therefore, preprocessing plays a crucial role in classification performance, especially for sequential data tasks like voice analysis.

5. Experiment

5.1. Data Collection

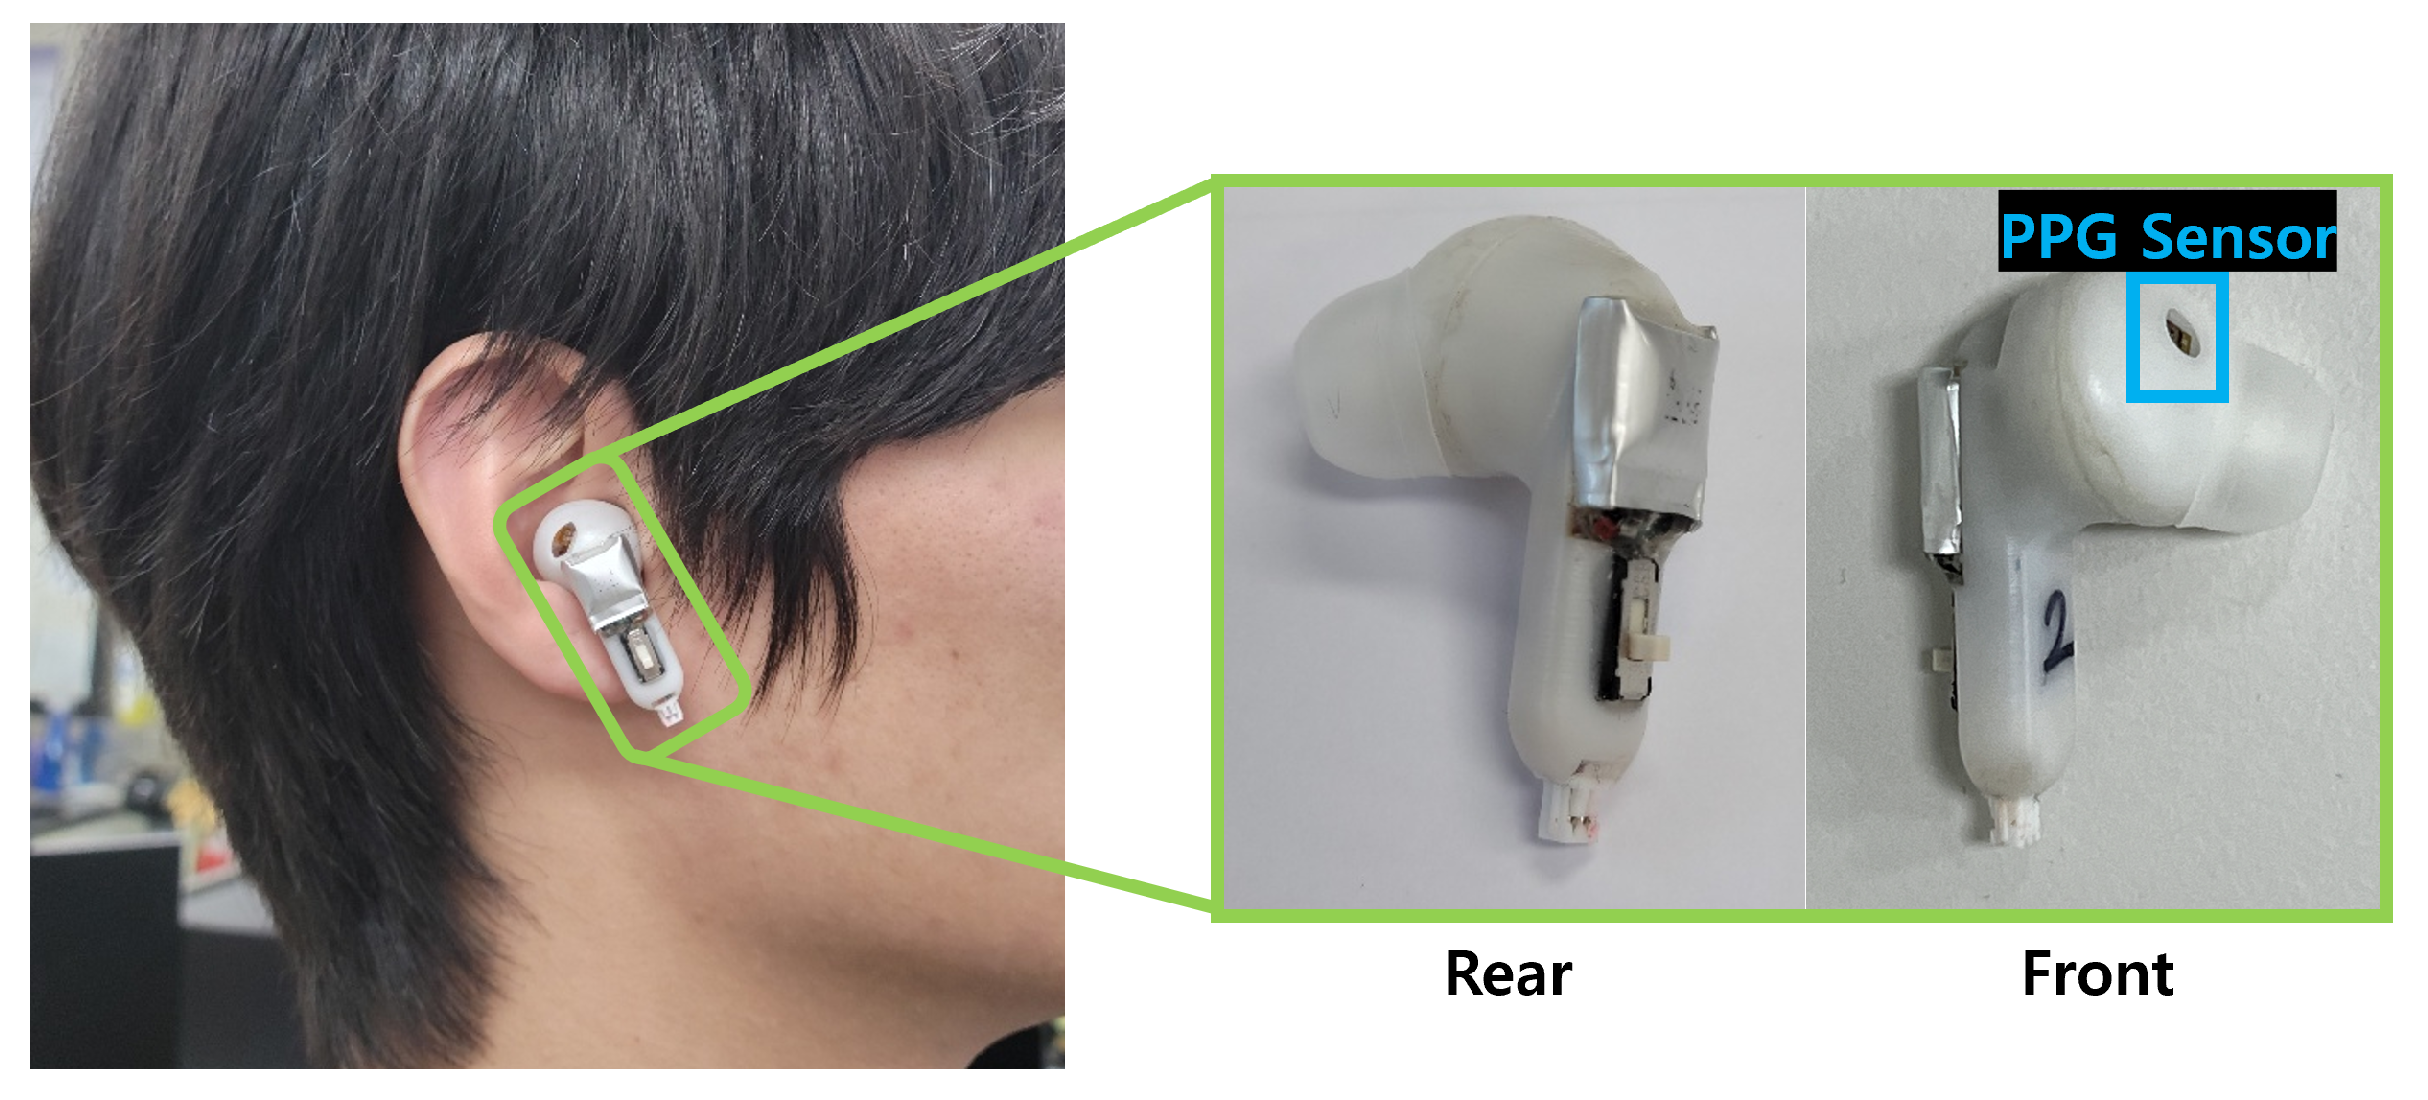
To capture PPG data from the ear, we utilized a TWS prototype equipped with a PPG sensor. Figure 6 illustrates the prototype as worn on the ear, showing both its front and rear views. The PPG sensor is integrated into the part of the device that makes contact with the ear, without any built-in speaker or microphone. The prototype records data at a sampling rate of 128 samples per second and transmits this data wirelessly via Bluetooth. Our study involved data collection from ten participants aged 22–27, each with varying resting HRs. Data measurements were conducted under three conditions for each individual: fully wearing the TWS prototype, wearing it with a 5 mm gap from the ear, and not wearing the TWS at all. Each condition was monitored for 2 min in a controlled laboratory environment. This setup ensured consistent and controlled conditions for data acquisition, allowing us to analyze the PPG signals under different wearing scenarios.

5.2. Implementation

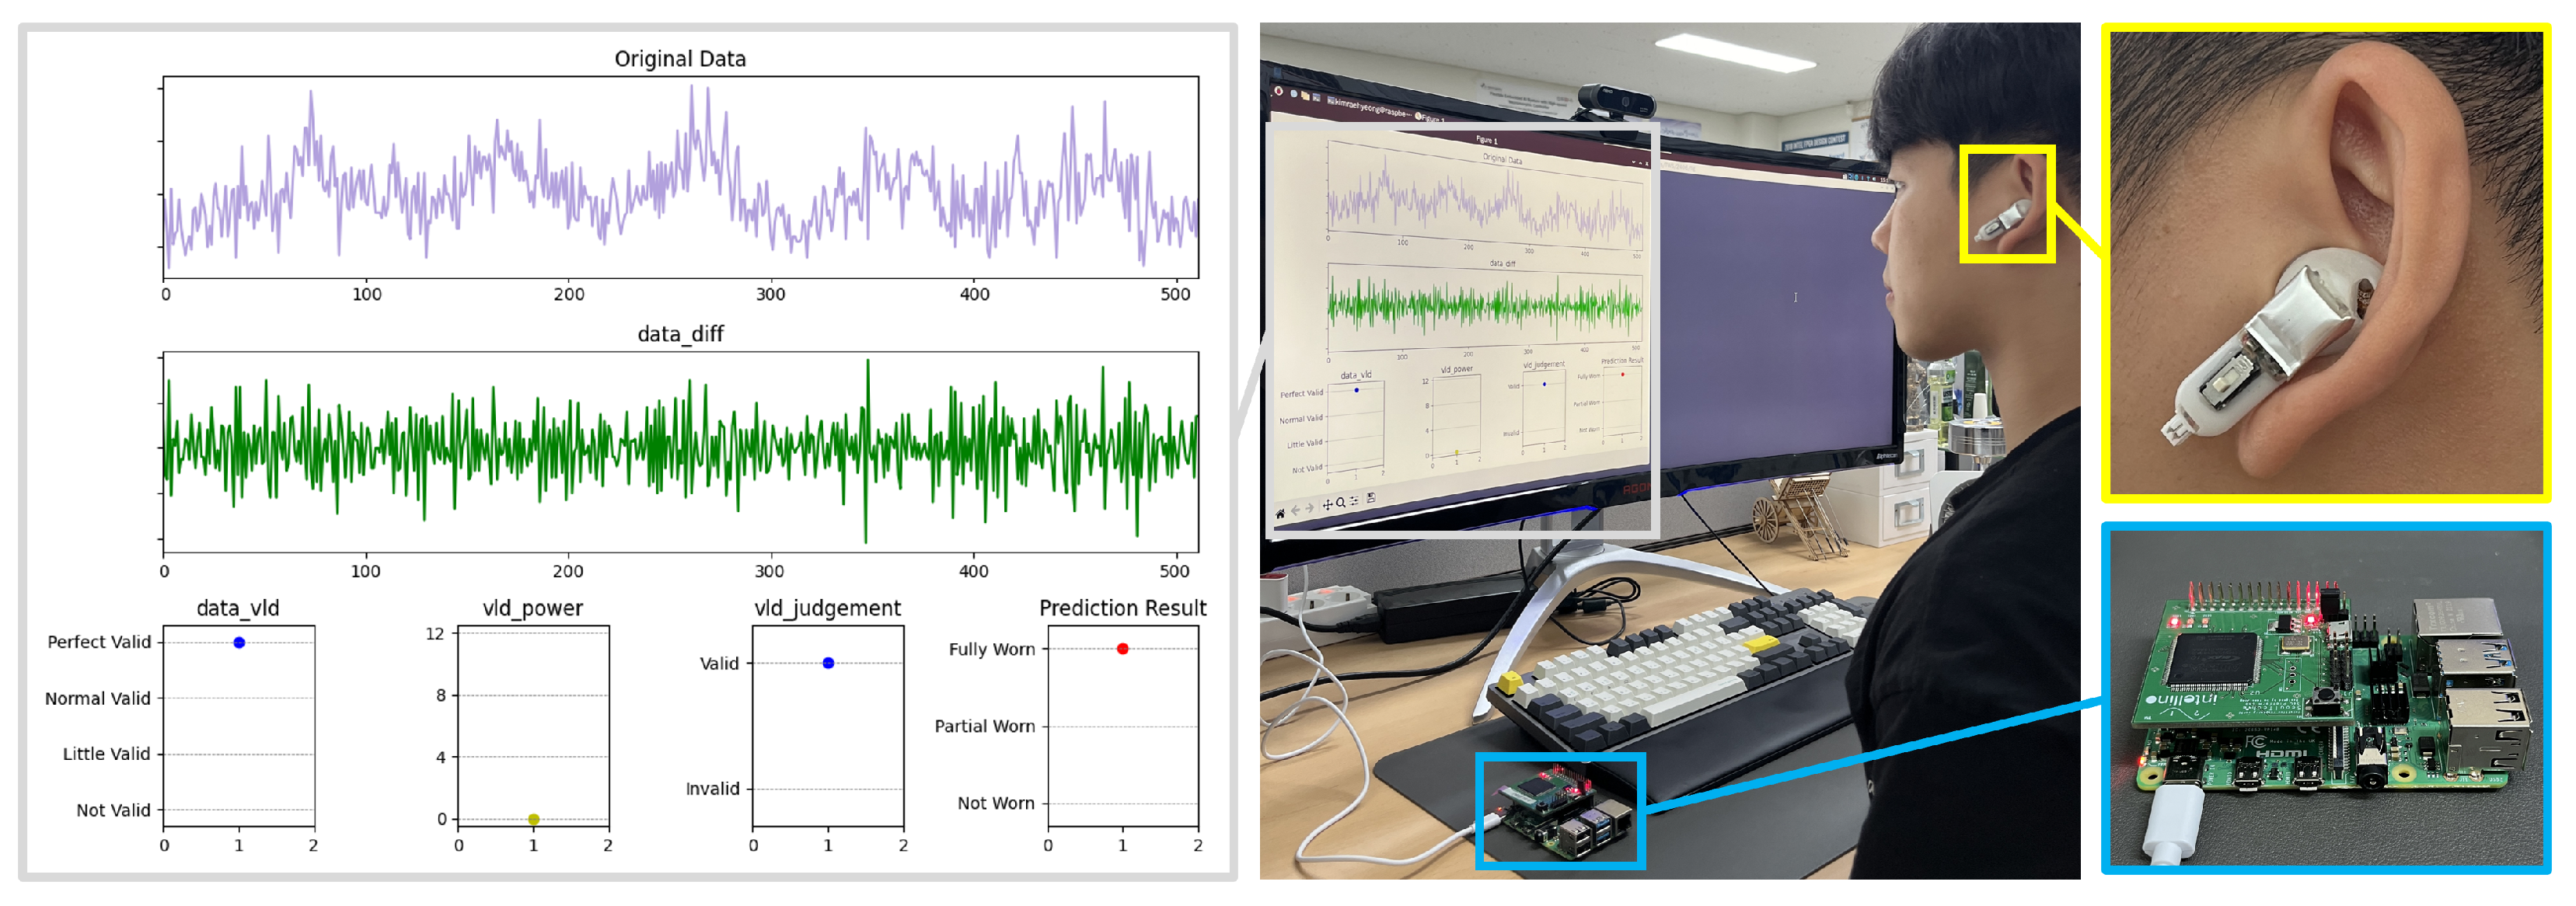
Figure 7 depicts the experimental environment to assess wearing detection performance. PPG data collected via the TWS prototype is stored in the MCU. The MCU segments noise-free data into lengths of 16, 32, 64, 128, and 256, creating respective training datasets of 1024, 512, 256, 128, and 64. Subsequently, the MCU transmits the training data via the SPI to train the edge AI. Post-training, classification was performed with approximately 100,000 sequential data samples containing noise, and performance was evaluated via the F1 score.

5.3. Evaluation

To validate the performance of the proposed approach, we used the F1 score for evaluation. The F1 score is a commonly used metric for classification tasks that has the advantage of considering the performance of both precision and recall. The F1 score ranges between 0 and 1, where a score closer to 1 signifies better classification performance, balancing both precision and recall effectively. The calculation methods for F1 score are as follows:
F 1 score = 2 × Precision × Recall Precision + Recall
The experimental results are presented in Table 2, showing F1 scores with and without validation for different lengths of training and inference data. Without validation, there is no significant F1 score difference observed as data length increases. However, when validation is applied, greater data lengths correlate with higher F1 scores. Table 3 provides further details on F1 scores for each distance category with validation. It shows that, except for a length of 16, fully worn status consistently yields the highest F1 score. Moreover, overall F1 scores demonstrate an increasing trend with longer data lengths.
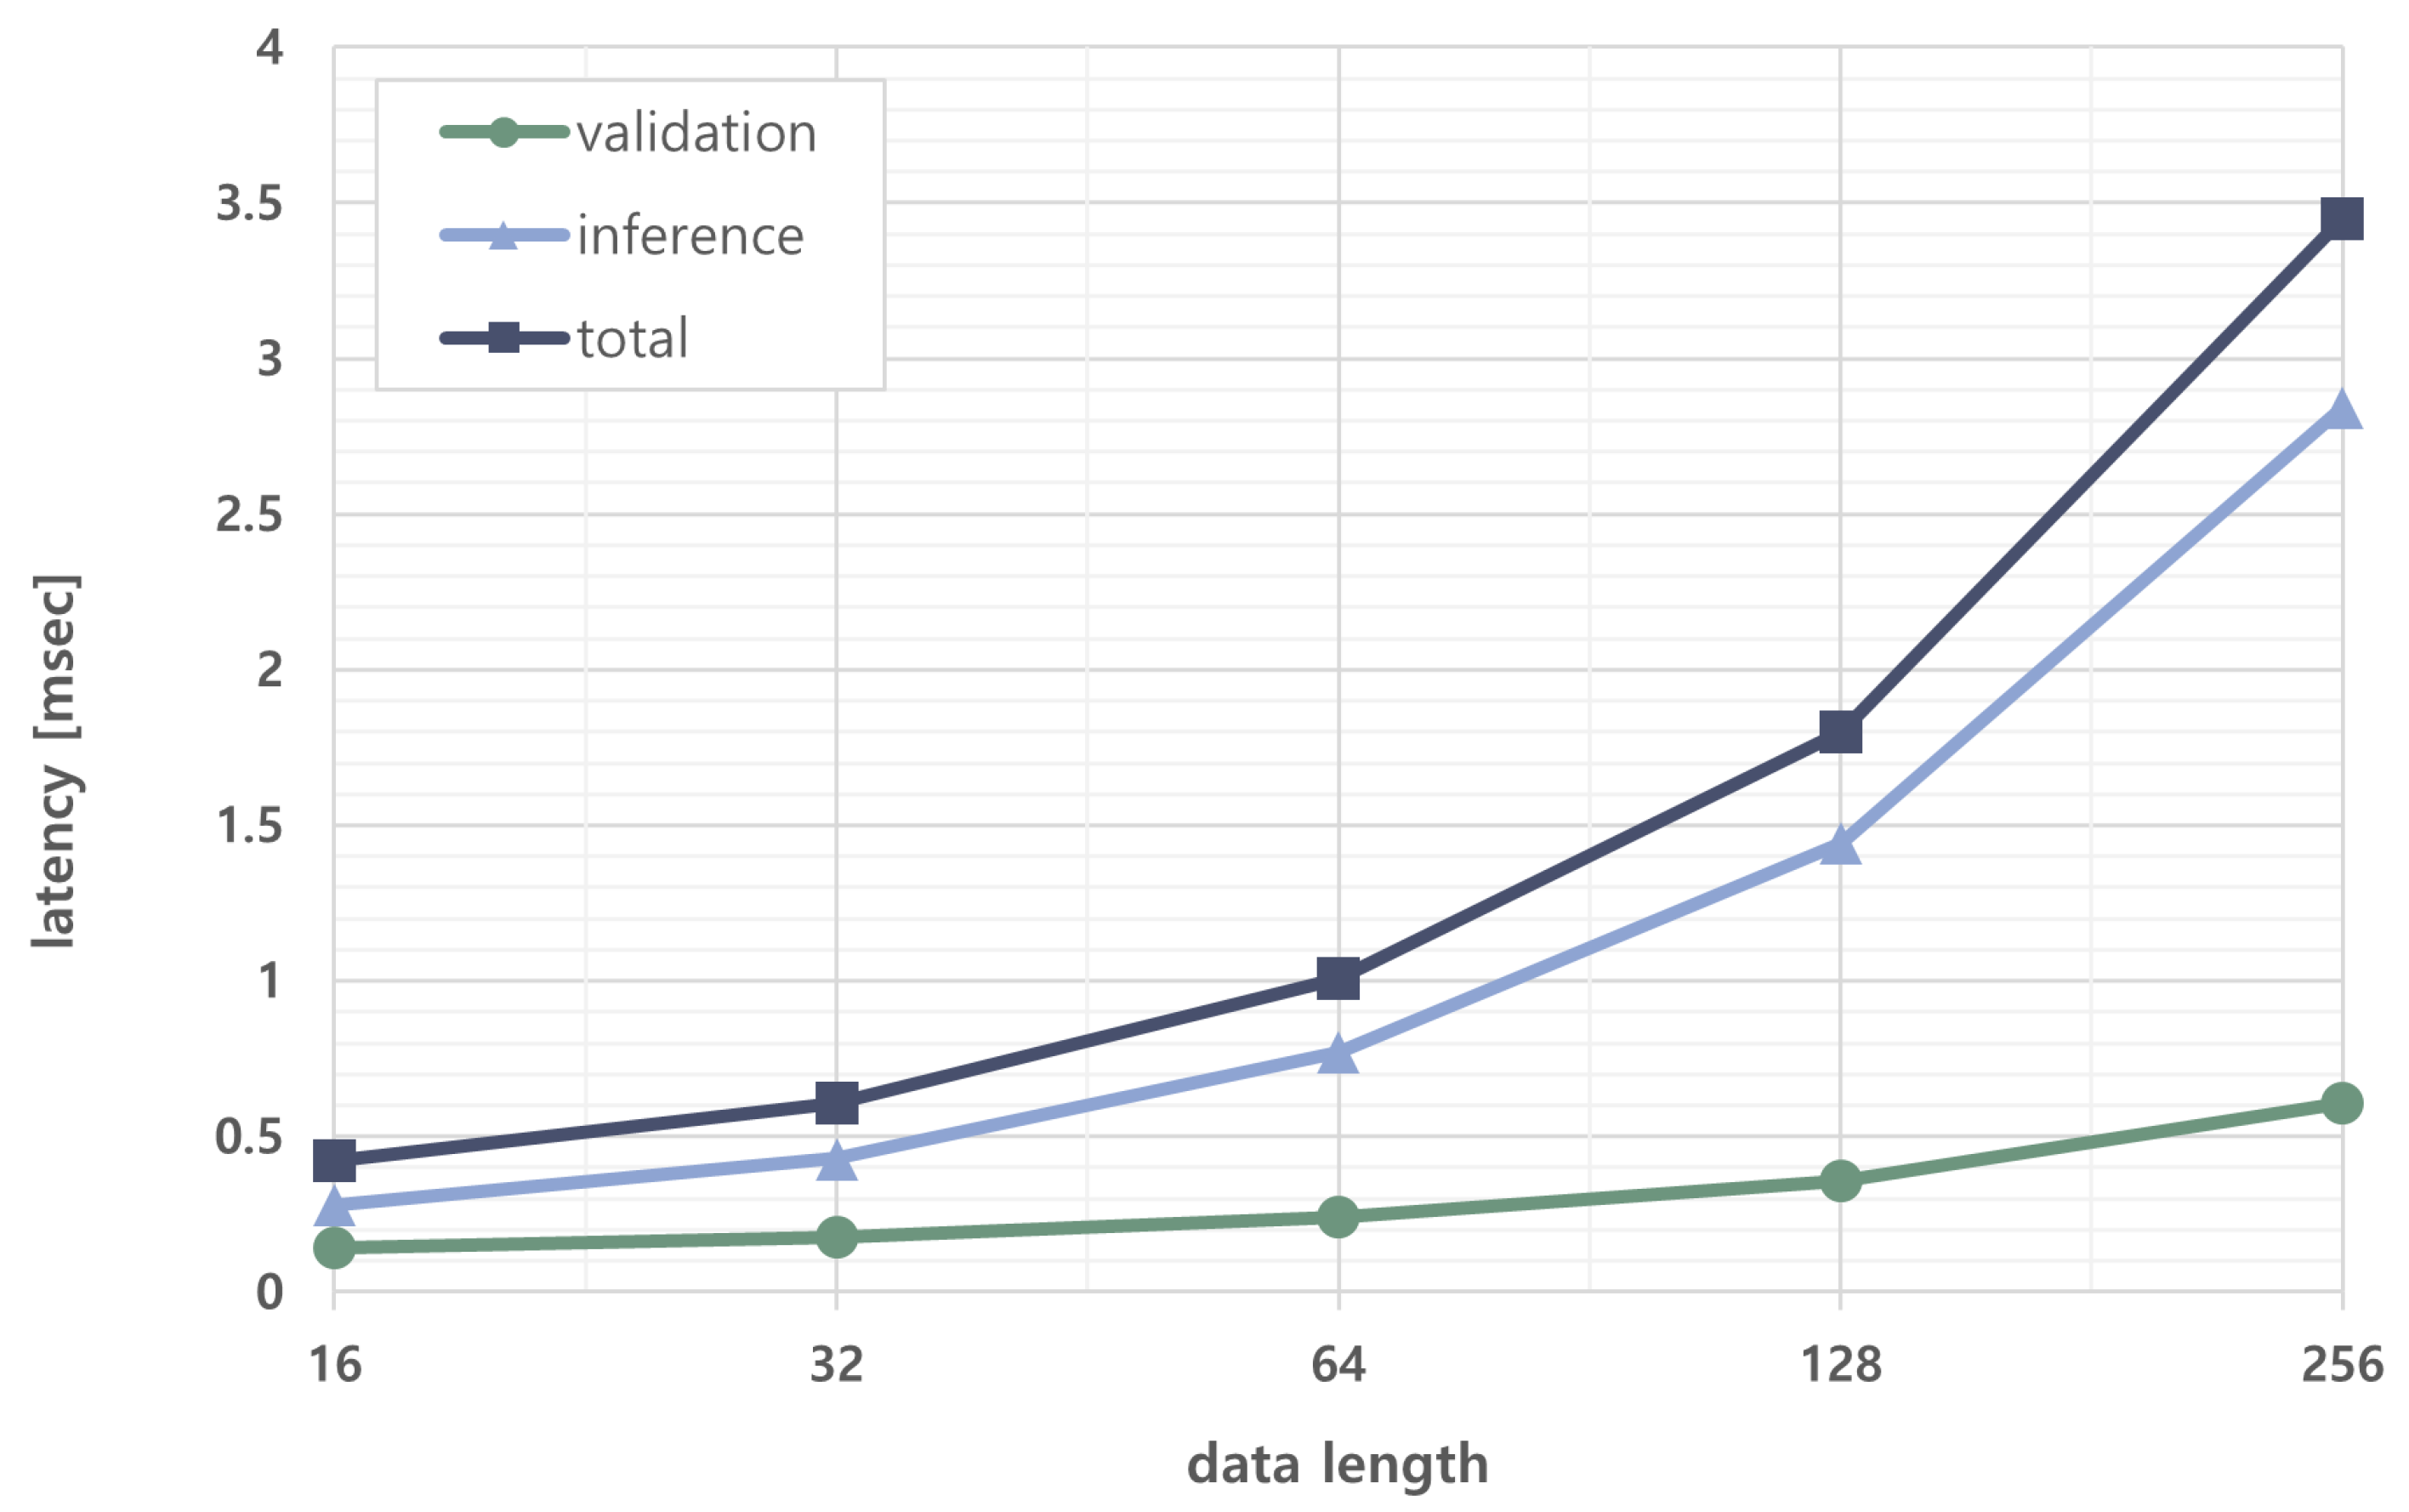
Figure 8 illustrates latency based on data length. Validation latency represents the time taken for Python-based validation within the MCU, while inference latency includes the time for data transmissions via the SPI from the MCU to the AI processor and the return of predicted results to the MCU. Total latency sums up the times for validation and inference. As data length increases, the communication time via the SPI lengthens inference latency significantly more than validation time.
Through this experiment, we confirmed that F1 scores increase with data length when validation is applied. However, the rate of F1 score improvement diminishes with longer data lengths, while the increase in validation and inference times exhibits a considerable trade-off. Therefore, selecting the optimal data length that maximizes F1 score improvements without excessively increasing the overall processing time is crucial for practical application. In this study, a data length of 64 was determined as optimal due to its greatest significant improvement in F1 score.
Figure 9 demonstrates real-time monitoring with the identified optimal data length of 64. The AI processor, trained with 256 datasets of length 64, processes PPG data measured via the TWS prototype in real time, transmitted to the MCU via Bluetooth. Every 64 data inputs, the MCU performs validation and transmits valid data via the SPI for classification. The classified results are then fed back to the MCU via the SPI and displayed on a monitor. This experiment validated that our proposed method operates at 991 samples per second or higher and functions effectively in real time.

6. Conclusions

This paper introduces a wearing detection method for TWS devices using a PPG sensor. We address noise issues caused by TWS device movements within the ear canal by employing finite difference methods. A prototype equipped with a PPG sensor collected data, and its functionality was validated using a Raspberry Pi. An AI processor running a k-NN algorithm was utilized for classifying wearing conditions. Wearing conditions are categorized into fully worn, partially worn, and not worn. In the validation experiments, the input sequential data length was varied from 16 to 256. The results show that without validation, there is minimal change in the F1 score (0.91) across different input data lengths. However, with validation, longer input data lengths consistently yielded higher F1 scores, particularly achieving F1 scores above 0.95 for all wearing conditions at a data length of 256. For validation and inference with k-NN using a data length of 64, the processing time was approximately 1 ms, demonstrating a processing rate of over 991 samples per second and confirming real-time capability.
The findings demonstrate that PPG sensors can serve as an effective alternative to conventional proximity sensors for wearing detection in TWS devices. By reducing reliance on dedicated proximity sensors, this approach opens opportunities for integrating additional functionalities within the strict hardware constraints of earbuds and highlights the potential for expanding PPG-based sensing toward healthcare-oriented applications. Looking ahead, further investigations across broader user groups and more diverse wearing scenarios, together with the incorporation of richer physiological signals and energy-efficient operation strategies, will help strengthen the generalizability and practical utility of the proposed approach. In particular, self-powered operation through energy-harvesting could provide long-term autonomy for TWS devices and broaden the range of healthcare services supported by PPG-based wearing detection.

Author Contributions

Conceptualization, R.K. and S.E.L.; methodology, J.P. and S.E.L.; hardware, R.K.; software, R.K. and J.P.; validation, J.P.; formal analysis, J.P.; investigation, R.K. and J.K.; data curation, J.O. and J.P.; writing—original draft preparation, R.K.; writing—review and editing, R.K., J.P., J.K. and S.E.L.; visualization, J.O. and J.K.; supervision, S.E.L. All authors have read and agreed to the published version of the manuscript.

Funding

This work was supported by the IITP (Institute of Information & Coummunications Technology Planning & Evaluation)-ITRC (Information Technology Research Center) grant funded by the Korea government (Ministry of Science and ICT) (IITP-2025-RS-2022-00156295).

Institutional Review Board Statement

The study was conducted in accordance with the Declaration of Helsinki and approved by the Institutional Review Board of Seoul National University of Science and Technology (protocol code 2025-0025-01, 26 August 2025).

Data Availability Statement

The original contributions presented in this study are included in the article. Further inquiries can be directed to the corresponding author.

Conflicts of Interest

The authors declare no conflicts of interest.

References

  1. Alarfaj, A.A.; AlAhmmed, L.M.; Ali, S.I. Perception of earbuds side effects among teenager and adults in Eastern Province of Saudi Arabia: A cross sectional study. Clin. Epidemiol. Glob. Health 2021, 12, 100784. [Google Scholar] [CrossRef]
  2. Röddiger, T.; Clarke, C.; Breitling, P.; Schneegans, T.; Zhao, H.; Gellersen, H.; Beigl, M. Sensing with Earables: A Systematic Literature Review and Taxonomy of Phenomena. Proc. ACM Interact. Mob. Wearable Ubiquitous Technol. 2022, 6, 1–57. [Google Scholar] [CrossRef]
  3. Kuo, S.; Mitra, S.; Gan, W.S. Active noise control system for headphone applications. IEEE Trans. Control Syst. Technol. 2006, 14, 331–335. [Google Scholar] [CrossRef]
  4. Ferlini, A.; Montanari, A.; Mascolo, C.; Harle, R. Head Motion Tracking Through in-Ear Wearables. In Proceedings of the 1st International Workshop on Earable Computing, New York, NY, USA, 10 September 2019; EarComp’19. pp. 8–13. [Google Scholar] [CrossRef]
  5. Alkiek, K.; Harras, K.A.; Youssef, M. EarGest: Hand Gesture Recognition with Earables. In Proceedings of the 2022 19th Annual IEEE International Conference on Sensing, Communication, and Networking (SECON), Stockholm, Sweden, 20–23 September 2022; pp. 91–99. [Google Scholar] [CrossRef]
  6. Saulsbury, A.N.; J, M.T. Wireless Ear Buds with Proximity Sensors. U.S. Patent 20230247341A1, 3 August 2023. [Google Scholar]
  7. Song, H.; Shin, G.W.; Yoon, Y. The Effects of Ear Dimensions and Product Attributes on the Wearing Comfort of Wireless Earphones. Appl. Sci. 2020, 10, 8890. [Google Scholar] [CrossRef]
  8. Amarasinghe, Y.; Sandaruwan, D.; Madusanka, T.; Perera, I.; Meegahapola, L. Multimodal Earable Sensing for Human Energy Expenditure Estimation. arXiv 2023, arXiv:2305.00517. [Google Scholar]
  9. Loncar-Turukalo, T.; Zdravevski, E.; Machado da Silva, J.; Chouvarda, I.; Trajkovik, V. Literature on Wearable Technology for Connected Health: Scoping Review of Research Trends, Advances, and Barriers. J. Med. Internet Res. 2019, 21, e14017. [Google Scholar] [CrossRef]
  10. Bakar, A.; Rahim, S.; Razali, A.; Noorsal, E.; Radzali, R.; Abd Rahim, A. Wearable Heart Rate and Body Temperature Monitoring Device for Healthcare. J. Phys. Conf. Ser. 2020, 1535, 012002. [Google Scholar] [CrossRef]
  11. Galli, A.; Montree, R.J.H.; Que, S.; Peri, E.; Vullings, R. An Overview of the Sensors for Heart Rate Monitoring Used in Extramural Applications. Sensors 2022, 22, 4035. [Google Scholar] [CrossRef]
  12. Kwon, Y.H.; Meng, X.; Xiao, X.; Suh, I.Y.; Kim, D.; Lee, J.; Kim, S.W. Triboelectric energy harvesting technology for self-powered personal health management. Int. J. Extrem. Manuf. 2025, 7, 022005. [Google Scholar] [CrossRef]
  13. Laput, G.; Chen, X.A.; Harrison, C. SweepSense: Ad Hoc Configuration Sensing Using Reflected Swept-Frequency Ultrasonics. In Proceedings of the 21st International Conference on Intelligent User Interfaces, New York, NY, USA, 7–10 March 2016; IUI’16. pp. 332–335. [Google Scholar] [CrossRef]
  14. Fan, X.; Shangguan, L.; Rupavatharam, S.; Zhang, Y.; Xiong, J.; Ma, Y.; Howard, R. HeadFi: Bringing intelligence to all headphones. In Proceedings of the 27th Annual International Conference on Mobile Computing and Networking, New York, NY, USA, 25–29 October 2021; MobiCom’21. pp. 147–159. [Google Scholar] [CrossRef]
  15. Matsumura, K.; Sakamoto, D.; Inami, M.; Igarashi, T. Universal earphones: Earphones with automatic side and shared use detection. In Proceedings of the 2012 ACM International Conference on Intelligent User Interfaces, New York, NY, USA, 14–17 February 2012; IUI’12. pp. 305–306. [Google Scholar] [CrossRef]
  16. Jeong, Y.; Park, J.; Kwon, S.B.; Lee, S.E. Photoplethysmography-Based Distance Estimation for True Wireless Stereo. Micromachines 2023, 14, 252. [Google Scholar] [CrossRef]
  17. Dahiya, E.S.; Kalra, A.M.; Lowe, A.; Anand, G. Wearable Technology for Monitoring Electrocardiograms (ECGs) in Adults: A Scoping Review. Sensors 2024, 24, 1318. [Google Scholar] [CrossRef] [PubMed]
  18. Allen, J. Photoplethysmography and its application in clinical physiological measurement. Physiol. Meas. 2007, 28, R1. [Google Scholar] [CrossRef] [PubMed]
  19. Mancilla-Palestina, D.E.; Jimenez-Duarte, J.A.; Ramirez-Cortes, J.M.; Hernandez, A.; Gomez-Gil, P.; Rangel-Magdaleno, J. Embedded System for Bimodal Biometrics with Fiducial Feature Extraction on ECG and PPG Signals. In Proceedings of the 2020 IEEE International Instrumentation and Measurement Technology Conference (I2MTC), Dubrovnik, Croatia, 25–28 May 2020; pp. 1–6. [Google Scholar] [CrossRef]
  20. Vostrikov, S.; Benini, L.; Cossettini, A. Complete Cardiorespiratory Monitoring via Wearable Ultra Low Power Ultrasound. In Proceedings of the 2023 IEEE International Ultrasonics Symposium (IUS), Montreal, QC, Canada, 3–8 September 2023; pp. 1–4. [Google Scholar] [CrossRef]
  21. Schlesinger, O.; Vigderhouse, N.; Eytan, D.; Moshe, Y. Blood Pressure Estimation From PPG Signals Using Convolutional Neural Networks And Siamese Network. In Proceedings of the ICASSP 2020—2020 IEEE International Conference on Acoustics, Speech and Signal Processing (ICASSP), Barcelona, Spain, 4–9 May 2020; pp. 1135–1139. [Google Scholar] [CrossRef]
  22. Iqbal, T.; Elahi, A.; Ganly, S.; Wijns, W.; Shahzad, A. Photoplethysmography-Based Respiratory Rate Estimation Algorithm for Health Monitoring Applications. J. Med. Biol. Eng. 2022, 42, 242–252. [Google Scholar] [CrossRef]
  23. Bagha, S.; Shaw, L. A Real Time Analysis of PPG Signal for Measurement of SpO2 and Pulse Rate. Int. J. Comput. Appl. 2011, 36, 45–50. [Google Scholar]
  24. Sharma, V. Mental Stress Assessment Using PPG Signal a Deep Neural Network Approach. IETE J. Res. 2020, 69, 1–7. [Google Scholar] [CrossRef]
  25. Vulcan, R.S.; André, S.; Bruyneel, M. Photoplethysmography in Normal and Pathological Sleep. Sensors 2021, 21, 2928. [Google Scholar] [CrossRef]
  26. Ferlini, A.; Montanari, A.; Min, C.; Li, H.; Sassi, U.; Kawsar, F. In-Ear PPG for Vital Signs. IEEE Pervasive Comput. 2022, 21, 65–74. [Google Scholar] [CrossRef]
  27. Azudin, K.; Gan, K.B.; Jaafar, R.; Ja’afar, M.H. The Principles of Hearable Photoplethysmography Analysis and Applications in Physiological Monitoring—A Review. Sensors 2023, 23, 6484. [Google Scholar] [CrossRef]
  28. Haddad, S.; Boukhayma, A.; Caizzone, A. Ear and Finger PPG Wearables for Night and Day Beat-to-Beat Interval Detection. In Proceedings of the 2021 43rd Annual International Conference of the IEEE Engineering in Medicine & Biology Society (EMBC), Virtual, 1–5 November 2021; pp. 1686–1689. [Google Scholar] [CrossRef]
  29. Sivanjaneyulu, Y.; Manikandan, M.S.; Boppu, S. CNN Based PPG Signal Quality Assessment Using Raw PPG Signal for Energy-Efficient PPG Analysis Devices in Internet of Medical Things. In Proceedings of the 2022 International Conference on Artificial Intelligence of Things (ICAIoT), Istanbul, Turkey, 29–30 December 2022; pp. 1–6. [Google Scholar] [CrossRef]
  30. Gupta, S.; Singh, A.; Sharma, A. Denoising and Analysis of PPG Acquired From Different Body Sites Using Savitzky Golay Filter. In Proceedings of the TENCON 2022—2022 IEEE Region 10 Conference (TENCON), Hong Kong, China, 1–4 November 2022; pp. 1–4. [Google Scholar] [CrossRef]
  31. Ahmed, R.; Mehmood, A.; Rahman, M.M.U.; Dobre, O.A. A Deep Learning and Fast Wavelet Transform-Based Hybrid Approach for Denoising of PPG Signals. IEEE Sens. Lett. 2023, 7, 1–4. [Google Scholar] [CrossRef]
  32. Tomita, Y. Asynchronous noise removal for earbud-based PPG sensors. In Proceedings of the 2016 38th Annual International Conference of the IEEE Engineering in Medicine and Biology Society (EMBC), Orlando, FL, USA, 16–20 August 2016; pp. 259–262. [Google Scholar] [CrossRef]
  33. Peterson, L.E. K-nearest neighbor. Scholarpedia 2009, 4, 1883, revision #137311. [Google Scholar] [CrossRef]
  34. Yoon, Y.H.; Hwang, D.H.; Yang, J.H.; Lee, S.E. Intellino: Processor for Embedded Artificial Intelligence. Electronics 2020, 9, 1169. [Google Scholar] [CrossRef]
  35. Park, J.; Shin, J.; Kim, R.; An, S.; Lee, S.; Kim, J.; Oh, J.; Jeong, Y.; Kim, S.; Jeong, Y.R.; et al. Accelerating Strawberry Ripeness Classification Using a Convolution-Based Feature Extractor along with an Edge AI Processor. Electronics 2024, 13, 344. [Google Scholar] [CrossRef]
  36. Kim, S.; Park, J.; Jeong, Y.; Lee, S.E. Intelligent Monitoring System with Privacy Preservation Based on Edge AI. Micromachines 2023, 14, 1749. [Google Scholar] [CrossRef] [PubMed]
  37. Shin, J.Y.; Ho Lee, S.; Go, K.; Kim, S.; Lee, S.E. AI Processor based Data Correction for Enhancing Accuracy of Ultrasonic Sensor. In Proceedings of the 2023 IEEE 5th International Conference on Artificial Intelligence Circuits and Systems (AICAS), Hangzhou, China, 11–13 June 2023; pp. 1–4. [Google Scholar] [CrossRef]
  38. Go, K.H.; Han, C.Y.; Cho, K.N.; Lee, S.E. Crime Prevention System: Crashing Window Sound Detection Using AI Processor. In Proceedings of the 2021 IEEE International Conference on Consumer Electronics (ICCE), Las Vegas, NV, USA, 10–12 January 2021; pp. 1–2. [Google Scholar] [CrossRef]
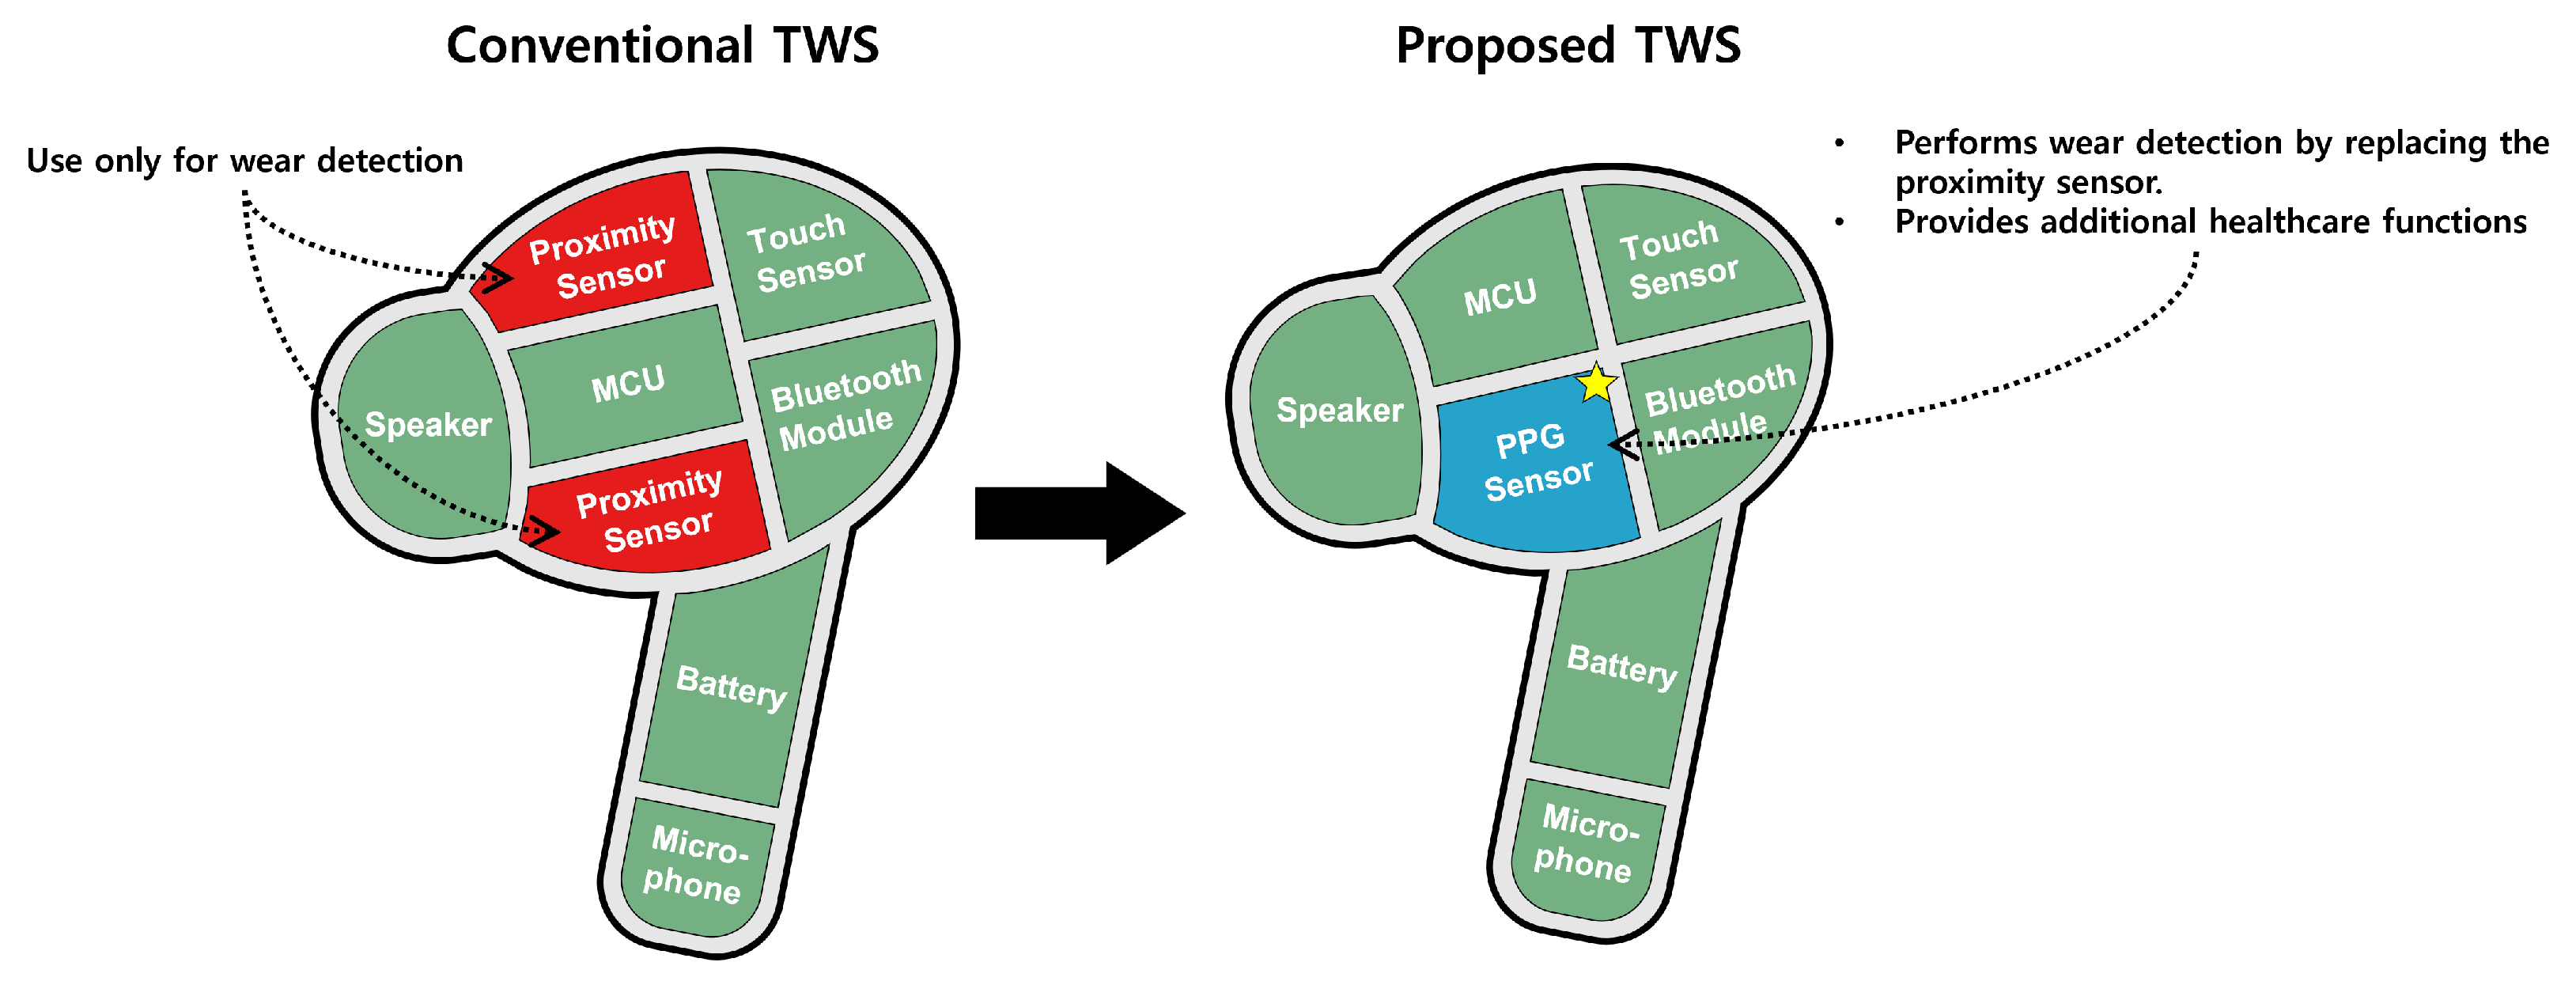
Figure 1. Healthcare TWS conceptual diagram.
Electronics 14 03911 g001
Figure 2. Overall flow of proposed method.
Electronics 14 03911 g002
Figure 3. Signal validity evaluation process. (a) Raw PPG Signal; (b) Signal Difference; (c) Validity Level with categories of High, Moderate, Low, and Invalid; (d) Signal Power; and (e) Final Validity Judgment as a binary output (Valid/Invalid). The x-axis represents the Sample Index (n), and the y-axes indicate the corresponding measurement: Amplitude, ΔAmplitude, Validity Level, Power, or Validity.
Electronics 14 03911 g003
Figure 4. k-NN inference method.
Electronics 14 03911 g004
Figure 5. Architecture of edge AI.
Electronics 14 03911 g005
Figure 6. Prototype front and rear appearance and wearing example.
Electronics 14 03911 g006
Figure 7. Experimental configuration for performance assessment.
Electronics 14 03911 g007
Figure 8. Latency comparison according to data lengths.
Electronics 14 03911 g008
Figure 9. Experimental configuration for real-time performance assessment.
Electronics 14 03911 g009
Table 1. Analysis of related works.
SourceSensorProposed ApproachProsConsAcc.
[13]
Laput, G. et al., 2016
speaker,
microphone
Emit an inaudible frequency through a speaker and monitor the frequency with a microphone.Use only the built-inspeaker and microphone.Sound leakage occurs if the earbuds are partially inserted, making accurate predictions difficult.94.8%
[14]
Fan, X. et al., 2021
speaker,
microphone
Measure ambient noise resonance when wearing headphonesNot sensitive to noise.Requires additional pairing devices.97.93%
[15]
Matsumura, K. et al., 2012
skin
conductance
sensor
Detect the wearing of both earphones by measuring microcurrent flow through the body when both are worn.Achieves high accuracy by directly measuring the current flowing through the skin.Requires both earphones to determine wearing status; low utility of skin conductivity sensors.-
[16]
Jeong, Y. et al., 2023
PPG sensorClassify PPG input data based on the wearing condition with a WA filter and MobileNet.Classifies wearing status with a single PPG sensor.Does not account for noise generated by movement.92.5%
Table 2. F1 score depending on validity verification.
163264128256
With validation0.9130.9360.9500.9530.967
Without validation0.9140.9140.9150.9110.907
Table 3. F1 score according to data length.
163264128256
Fully worn0.8940.9410.9710.9740.982
Partially worn0.9090.9330.9230.9280.950
Not worn0.9370.9340.9560.9570.968
Disclaimer/Publisher’s Note: The statements, opinions and data contained in all publications are solely those of the individual author(s) and contributor(s) and not of MDPI and/or the editor(s). MDPI and/or the editor(s) disclaim responsibility for any injury to people or property resulting from any ideas, methods, instructions or products referred to in the content.