Abstract
With growing urban populations and rapid technological advancement, major cities worldwide are facing pressing challenges from surging energy demands. Interestingly, substantial unused space within residential buildings offers potential for installing renewable energy systems coupled with energy storage. This study innovatively proposes a grid-connected photovoltaic (PV) system integrated with pumped hydro storage (PHS) and battery storage for residential applications. A novel optimization algorithm is employed to achieve techno-economic optimization of the hybrid system. The results indicate a remarkably short payback period of about 5 years, significantly outperforming previous studies. Additionally, a threshold is introduced to activate pumping and water storage during off-peak nighttime electricity hours, strategically directing surplus power to either the pump or battery according to system operation principles. This nighttime water storage strategy not only promises considerable cost savings for residents, but also helps to mitigate grid stress under time-of-use pricing schemes. Overall, this study demonstrates that, through optimized system sizing, costs can be substantially reduced. Importantly, with the nighttime storage strategy, the payback period can be shortened even further, underscoring the novelty and practical relevance of this research.
1. Introduction
The massive consumption of energy brought about by population growth and technological progress is gradually posing a huge threat to the living environment of mankind in recent decades. In large cities around the world, the dense population and high demand of energy pose a huge challenge to the power system [1]. Although traditional fossil energy can meet these electricity needs, it will be exhausted one day. Therefore, the top priority is to promote and exploit renewable energy (RE) systems in these metropolises to reduce the consumption of natural resources [2].
Almost all traditional renewable energy systems are large-scale and require extremely strict terrain constraints. However, RE is slowly developing small- and medium-sized systems, such as the installation of solar photovoltaic panels on the limited roof area of urban buildings [3]. However, renewable energy systems are generally subject to many restrictions, including weather and time [4]. This shortcoming also gave birth to the development of energy storage systems (ESS). Similarly, energy storage systems were all large-scale projects in the early days, and now small- and medium-sized systems are gradually being developed, including pumped hydro storage (PHS) [5], battery storage [6], flywheel energy storage [7], compressed air energy storage (CAES) [8], and phase change material energy storage [9], as well as other energy storage methods [10,11].
At present, PHS is the most widely used energy storage technology in the world [12]. Specifically, there are many studies and applications on large-scale PHS systems. Most of them are combined with renewable energy systems, such as solar and wind power systems. Canales et al. studied a wind–PHS system in southern Brazil in Ref. [13], wherein the results derived by HOMER show that the pumped storage plant has the highest initial costs at around USD 2000/kW, but the solution represents a lower environmental impact. A feasibility study utilizing abandoned coal mine graves combined with PV–wind–PHS hybrid system is presented by Fan et al. [14], wherein the authors concluded that the developed system for daily regulation was feasible in a short-term scenario. Research about a PHS-based renewable energy system on remote islands was performed by Ma et al. [15], wherein the results show that the proposed system is an ideal solution for the remote areas with 100% renewable penetration rate. An analysis of energy balance was also conducted by Kaldellis et al. [16], which also focuses on remote islands, illustrating that the application of off-grid hybrid systems is feasible in the proposed region. Tan et al. [17,18] conducted an in-depth study on the dispatch of hybrid pumped storage–wind–PV systems.
Although most PHS-related applications are focused on large-scale systems [19,20], research in recent years has also tended to move closer to small- and medium-sized systems. Whether in urban or suburban areas of a metropolis, there are many conditions that are good for PHS. For people living in the suburbs, there may be some high-lying mountains near their communities, and this natural height difference will be the best condition for PHS application; moreover, people living in urban areas are almost always surrounded by tall buildings. Although there is no natural area for them to utilize, the natural height of the building is also a very advantageous resource for PHS. Therefore, PHS may also be used in urban cities, especially on residential buildings. A building with 240 households was studied by de Oliveira e Silva et al. in Ref. [21], where the analysis of the LCOE in the range of EUR 1.66 to 3.59/kWh, adopting four different reservoirs, was demonstrated, which shows that the flexible materials are favorable. Ciric et al. [22] studied the diminutive hydroelectric systems applied on buildings and Bhandari et al. [23] summarized the mathematical models for renewable energy systems composed of small hydro–solar–wind systems. Mousavi et al. [24] focused on the modelling, design, and experimental validation of a grid-connected farmhouse using a PV–PHS system. The research considered the losses of storage, the feed-in income, and the cost-saving, which showed that the proposed PHS management system can reduce USD 121,260 on electricity costs of the farmhouse over its lifetime and the payback period of the proposed energy storage system is 8 months. A feasibility study of high-rise buildings with PV and mini-hydro pumping in cities was proposed by Zhang et al. in Ref. [25], in which a building was simulated and the load-bearing capacity of the roof was initially discussed. Lahmer et al. [26] evaluated the performance of grid-connected PV with PHS in high-rise buildings.
However, adopting only one type of energy storage system, such as PHS, cannot meet the electricity demand and energy storage well due to its typical round-trip efficiency of 70–85% and site-specific constraints. It is wise to have another type of energy storage system combined to form a hybrid energy storage system. Battery storage is a good choice, and now there is a lot of research aimed at the application on residential buildings. Akter et al. conducted a case study in Australia, which included comprehensive economic evaluations of a residential building with PV–battery systems [27]. Baniasadi et al. studied smart buildings that combine a battery with other storage systems [28], demonstrating that investment in combined battery and other storage systems can be more profitable, as the proposed system can minimize life cycle costs. So far, there are only a few research papers on the combination of PHS and battery systems. An off-grid PV–battery–PHS system proposed by Bhayo et al. was focused on power management optimization with particle swarm optimization [29], and different cases show that it is possible to achieve environmental appropriateness and reliable and low-cost power generation by the integration of harvesting rainfall with PV–battery systems. In addition, a hybrid pumped and battery storage system in standalone mode was studied by Javed et al. [30], with a focus on the storage usage factor, energy utilization ratio, and overall system performance for overall system performance evaluation, concluding that the proposed system can effectively manage energy variations and seems a promising aspect. Wang et al. [31] optimized the short-term scheduling of a coupled wind–photovoltaic–hydropower–thermal–pumped hydro storage system. Ameur et al. [32] designed a intelligent energy management system for smart homes with grid-connected hybrid PV energy storage systems.
In order to meet the load demand while saving costs as much as possible, some optimization algorithms are employed to optimize the installed capacity of the system components. For example, the geographic information system algorithm used to locate prospective sites for pumped hydro energy storage was proposed by Lu et al. [33], and another algorithm named binary sort and search was applied by Ayodele et al. [34] to select the optimal renewable energy generator of PHS for an isolated community. The daily multi-objective optimization algorithm is applied to optimize an energy storage system with a PV system in residential buildings in Ref. [35], proposed by Jung et al. In Ref. [36], written by Stoppato et al., particle swarm optimization (PSO) is used to optimize the component size, showing that the PHS system can reduce the battery discharge rate and the depth of discharge. In addition, some relatively new optimization algorithms are usually used. Teaching–learning-based optimization (TLBO) is a new algorithm that is very suitable for optimizing capacity, which was confirmed in Ref. [37], written by Ashtiani et al. The results show that the TLBO algorithm reaches the final answer faster than PSO and the genetic algorithm (GA), and it shows TLBO’s advantage in convergence speed.
After a comprehensive review, it has been found that the existing literature is less focused on the application of hybrid energy storage on grid-connected residential buildings, as most focused on battery storage without considering the combination of other energy storage methods. In addition, from the perspective of optimization methods, most studies use optimization algorithms proposed in the early years, such as GA and PSO, to optimize installed capacity. Moreover, from the perspective of application scenarios, most studies mainly focus on remote areas that are off-grid, while ignoring urban areas that consume large amounts of electricity. In this context, this paper proposes a grid-connected hybrid-storage-based PV system for distributed buildings that combines PHS with battery storage. The TLBO algorithm is adopted to optimize the installed capacity of a PV system, battery, and UR volume in a PHS system. On the other hand, as can be seen from the conclusion of Ref. [38], due to the height of the building, only PHS used on villa buildings does not show good performance. Therefore, in this paper, a villa building is still selected as the objective, and battery storage is used as a supplement to the PHS system. In addition, a new operation principle is introduced under the time-of-use electricity prices, electricity is purchased from the grid at night to store water, and energy is provided to residents during the next day when electricity prices are expensive, which can save a lot of costs for the household.
The remaining part of this paper is structured as follows: In Section 2, the introduction of the system, the discussion on environmental resources, and load consumption are provided; in Section 3 is the modelling and methodology, including the formulas of each part of the system, the evaluation indicators, the optimization algorithm used and the objective function, and the operation principle; and Section 4 is the case study, discussion, and analysis of the results. The conclusion is in Section 5.
2. System Description
This section will mainly introduce the entire system, including the type of building and the structure of the system. In addition, this section will also present the solar radiation resources at the location of the building and the electricity consumption of the residents in this building.
As presented in Figure 1, a residential villa building is considered, and the characteristics of the entire system are as follows: the upper reservoir is placed on the roof, and the natural height of the building is used to store gravitational potential energy. As an auxiliary energy source for the pumped storage system, batteries are also introduced into the system, and they have better complementarity. The battery can respond quickly to energy supply or storage, while the pumped storage system is cheaper and can store more energy with sufficient capacity. In this study, the height difference in the building is about 13 m, and the key equipment is connected to the grid. The energy storage system will store electricity when there is surplus power and release the electricity during the peak electricity consumption period to achieve the role of peak clipping and valley filling.
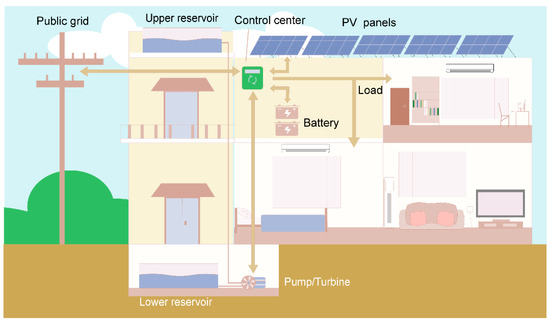
Figure 1.
Villa building with a grid-connected PV–PHS–battery system.
Figure 2 shows Shanghai’s solar radiation data for one year, and the peak of the year occurred in summer. Obviously, the solar radiation in spring and winter is significantly lower than that observed in summer.
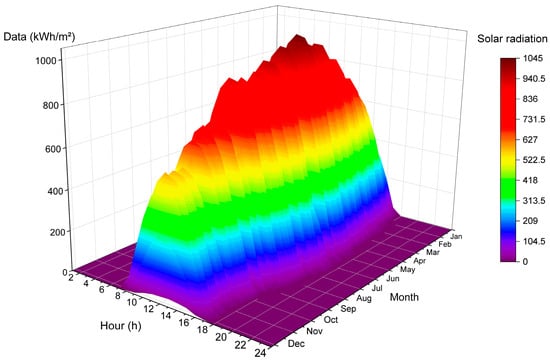
Figure 2.
Solar radiation on Shanghai for one year.
Figure 3 illustrates the annual load demand of the residents in the villa building. It can be clearly seen that the two small peaks of household electricity consumption in a day occurred at around 12 a.m. and 7 p.m., and the electricity consumption of the evening peak increased significantly and lasted longer. The peak season for household electricity consumption occurs in summer and winter of one year, which is because of the high cooling and heating load during those two seasons.
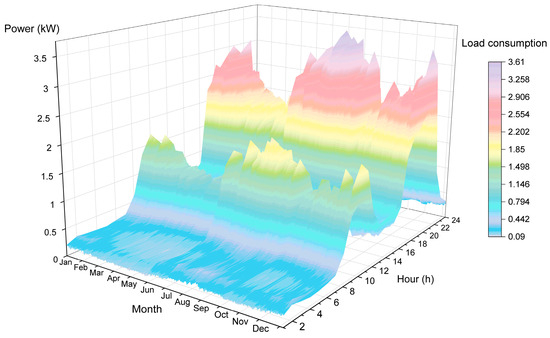
Figure 3.
Monthly variation and daily load demand of a household in a villa building.
3. Modelling and Simulation
The main content of this section will describe the models, evaluation indicators, optimization algorithms, and the operating strategies used in this study. The system modeling and optimization algorithm are implemented and simulated using MATLAB 9.10.
3.1. Mathematical Modelling of Main Components
This section presents the mathematical framework for three core components: the PV system, PHS system, and battery. The models govern energy conversion processes and capacity variations under the proposed system architecture.
3.1.1. Photovoltaic System
The PV power output is calculated based on the validated model from [39], which is also widely used in the literature:
Here, represents the overall performance of the PV system, which is 88.5% in this study; and denote the efficiency of the inverter and grid-connected system, which are 97% and 99%, respectively [40]; is an efficiency parameter influenced by the temperature of the PV cell; is the capacity of the installed PV system; is the global solar irradiance on the inclined surface; and (1000 W/m2) is the standard radiation parameter. The calculation of is expressed by the following equation:
where (1/°C) is the efficiency temperature coefficient of PV modules and (20 °C in this study) is the reference standard temperature. The formula for the PV cell’s temperature is presented as follows:
where the normal operating cell temperature (NOCT) refers to the expected temperature at which solar cells function under specific weather conditions, excluding extreme scenarios, typically in a controlled laboratory setting. It is defined as the temperature reached by open-circuited cells in a module under the following specific conditions: the irradiance on the cell surface is 800 W/m2, the air temperature is 20 °C, the wind velocity is 1 m/s, and the mounting condition is an open back side.
The solar radiation data in this paper are transformed into an inclined surface value through the well-known Klein and Theilacker model [41], as shown for the Northern Hemisphere:
where is the direct solar irradiance on the horizontal plane and is the solar scatter irradiance on the horizontal plane; is the tilt angle of the PV panel; the third term represents the ground reflection irradiance; represents the ground reflectivity, which is 0.2 in this study [42]; and represents the total solar irradiance on the horizontal plane, i.e., .
Consequently, based on the above equations and given parameters, the solar radiation on an inclined plane can be computed and utilized for subsequent research.
3.1.2. Pumped Hydro Storage
The pumped hydro storage system operates in two modes: the pumping mode and the generation mode. During the pumping mode phase, the pumping coefficient and the volume of pumped water can be expressed as [43]:
where is the efficiency of the pump, which is set as 85% in this paper, and is the surplus power from the PV system after meeting the load demand.
In the power generation mode phase, the power generated by turbine is related to the turbine generating coefficient and the volume of water released from the upper reservoir (UR), as expressed in study [43]:
where is the efficiency of the turbine, which is set as 90% in this paper.
The state of charge (SOC) of the UR is a crucial indicator, therefore, the water volume stored in UR at any time is defined by the following formula:
where is the electricity generated by the PV system; is the difference between and the load demand , namely surplus power; is the electricity cost at time in Shanghai; and is the whole-day power generated by the PV system the next day.
3.1.3. Battery Banks
In this study, the battery is introduced as the hybrid storage system, and there are charging and discharging processes for the battery storage, with the efficiency of these two processes at 95% [44]. is the amount of charge in time , and is the amount of discharge. The expression of battery SOC can be expressed as:
Detailed information about the parameters of the PV module, battery, and pumped storage can be found in Reference [38].
3.2. Evaluation Indicators
Evaluation indicators are vital to measure the performance of a whole system. Both technical and economic indicators are considered below.
3.2.1. Technical Indicators
This study employs the self-consumption rate (SCR) and self-sufficiency rate (SSR) to preliminarily measure the performance of hybrid systems using some case studies. The definition of SCR is as follows [45]:
where is the power that the PV system directly supplies the load, and and are the power values that the PV system store in the battery or supply pump for pumping water, respectively. In addition, SCR represents the rate at which the power of the PV system is directly consumed by the building, including the load demand and PHS system. Another indicator is SSR, and the equation is defined as follows [45]:
where and are the power values produced by the PHS and battery that directly supply to the load, respectively, and is the total power demanded by the household. SSR represents the proportion of load demand that can be directly supplied by the PV–PHS system.
3.2.2. Economic Indicators
In addition, the payback period (PBP) is also used in this study to evaluate the economic feasibility of the system, which refers to the years that it takes to recover the cost of an investment. It is expressed as follows [46]:
where represents the initial investment of the system, including the cost of the PV system, reservoirs, battery, PAT equipment, penstock, and control center. represents the annual operation and maintenance costs and equipment replacement costs. The item contains the net revenue from trading with the power grid, the electricity cost savings from using the PV system, and the subsidies for PV system power generation from the national or local government policies.
3.3. Objective Function and Constraints
The objective function in this study is the sum of the initial investment in the PV system, battery storage system, and pumped hydro storage system. In Equation (14), represents the price of the photovoltaic panels per kilowatt. Similarly, represents the price of batteries per kilowatt hour, and represents the price per cubic meter of reservoir. Moreover, corresponds to the installed capacity of the photovoltaic system, battery, and pumped hydro storage system.
3.4. Teaching–Learning-Based Optimization Algorithm
In the early days, most optimization algorithms focused on mathematical techniques, while the main problem of these methods is that it is easy to fall into the local optimal solution; therefore, they cannot find the optimal solution. Recently, various heuristic algorithms have become popular, including evolutionary algorithms such as the genetic algorithm, evolutionary planning, evolutionary strategy, genetic planning, and swarm intelligence algorithms, such as the ant colony algorithm and the particle swarm algorithm [47].
However, in these methods, in addition to the population size and the number of iterations, there are often other hyperparameters that need to be set. Reasonable setting and proper adjustment of these algorithm-specific hyperparameters are critical to the search capabilities of these algorithms. Therefore, it is necessary to develop optimized algorithms without algorithm-specific hyperparameters. Rao et al. proposed an optimization algorithm based on teaching and learning [48], which was inspired by the classroom teaching process and imitated the teacher’s influence on students. Similar to other swarm intelligence algorithms, the teaching–learning optimization algorithm is based on the population heuristic random optimization algorithm [49], while the advantage of this algorithm is that it does not require any algorithm-specific hyperparameters [50].
As illustrated in Figure 4, teaching–learning-based optimization (TLBO) simulates the traditional classroom teaching process. The entire optimization process includes the teaching phase and the learning phase. In the teaching phase, every student learns from the best individual; furthermore, in the learning phase, each student learns from other students randomly. In TLBO, the population is regarded as a class of learners. Each learner represents a possible solution to the optimization problem, and the score represents the fitness value. The teacher is considered the best solution so far.
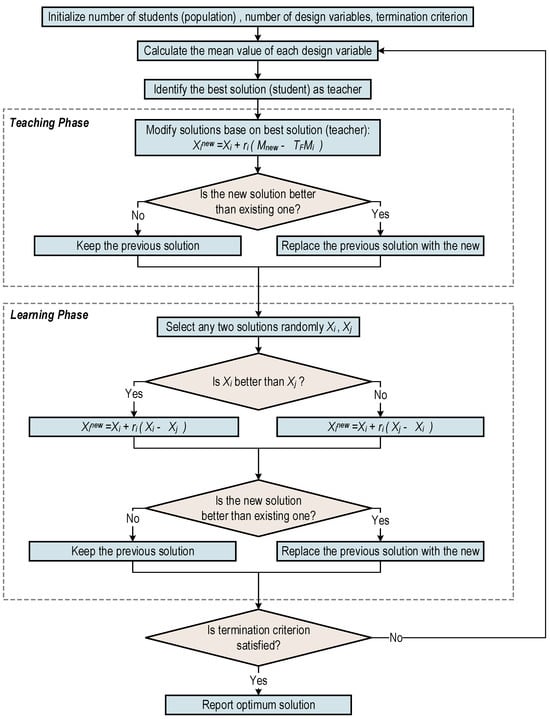
Figure 4.
Flowchart of teaching–learning-based optimization (TLBO) method.
Before the start of the algorithm, it needs to initialize the students (i.e., search points). The dimension of the decision variable is , which is the number of subjects that students need to study, that is, the number of variables to be optimized in the case. Student is expressed as , is the fitness function, then can be initialized as [51]:
where and are the upper and lower bounds of the j-th dimension decision variables respectively, and is a random number between 0 and 1.
In the teaching phase, is the solution with the best fitness value in a group. is the average grade of this class. Learners try to improve their average grades through the teachers’ teaching. For the i-th learner , the candidate solution new is calculated as follows [52]:
where is the teaching factor that determines the value of the to be changed:
In the learning phase, each learner improves his grades by interacting with learners randomly selected from the classroom, and the new is calculated as follows:
If the optimal value has not been obtained, then we continue to loop the entire optimization program until the optimal solution is obtained.
3.5. Operation Principle
The system proposed in this study operates according to the strategy shown in the flowchart of Figure 5, which is mainly divided into three parts: the charging phase during the peak hours, the discharging phase during the peak hours, and the charging phase during the valley hours. The operation principle of the system is based on the time-of-use background, and different operations are performed on the pumped hydro storage system, battery, or public grid, according to the different periods. In Shanghai, the peak hours are from 6 a.m. to 10 p.m. and the valley hours are from 10 p.m. to 6 a.m. the next day.
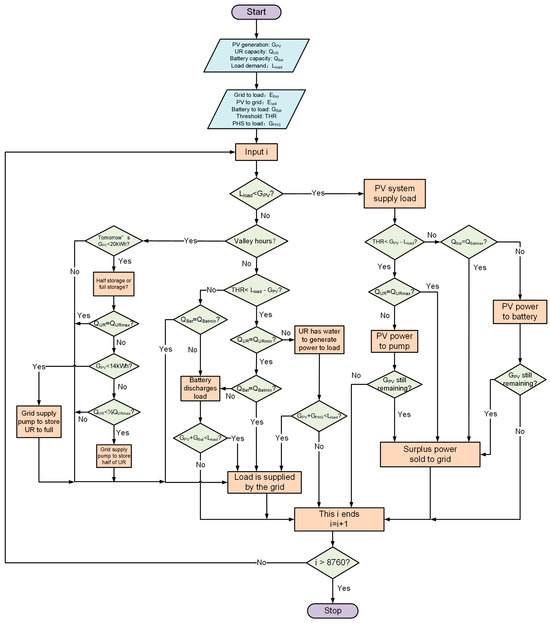
Figure 5.
The flowchart of the operation principle.
Table 1 lists the electricity prices of Shanghai’s residents. Three pricing strategies are adopted at three stages, according to the cumulative consumption of electricity in one year.

Table 1.
Electricity prices of residents in Shanghai [44,53].
The step length of each cycle in the operation principle is 1 h. Before explaining its operation logic, it is necessary to clarify several important parameters: the amount of electricity purchased by the household , the amount of electricity sold by the household , the power that the battery discharges to the load , the power supplied by the PHS system to the load , and the threshold (THR) of electricity used to start the pump for pumping . The meaning of the is to distribute the surplus power generated by the PV system. If the electricity generated by the PV system is surplus after supplying it to the load, it needs to be distributed to the battery or pumped hydro storage system to store the power. However, it is necessary to determine whether the surplus power is allocated to the battery or the PHS system first before that, so the parameter is introduced. When the PHS system is working, due to the height of the building, the pump needs a certain amount of power to pump the water to the reservoir on the roof for storage. If the amount of electricity supplied to the pump is lower than that of the , the act of impounding water will be invalid. Therefore, the amount of electricity is exactly the threshold for starting the PHS system, which is set at 0.7 kWh in this study.
3.5.1. Charging Phase (Peak Hours)
When the electricity generated by the PV system is more than the demand of the load, the entire system is in the charging phase, and the households’ consumption is all provided by the PV system at this time. When the surplus power is less than that of the after meeting the load demand and the battery is not fully charged, the battery is directly charged by the PV system then. If there is remaining power after the battery is fully charged, the surplus power is sold to the grid for profit; however, when the surplus power is less than that of the and the battery is fully charged, the surplus power is directly sold to the grid, and no energy storage system is charged.
When the surplus power is greater than that of the after meeting the load demand, and the reservoir on the rooftop is full, similar to that of the previous operation, the household directly sells the surplus power to the grid; however, if the reservoir is not full, the pump will be started to store water and sell the remaining power (if there is any).
3.5.2. Discharging Phase (Peak Hours)
When the electricity generated by the PV system is less than that of the load demand and it is still in peak hours, the entire system is in the discharging phase. The consumption of the residents is provided by the PV system, the energy storage system, and the grid. In this phase, the role of the is to determine which energy storage system should be used to start to supply power. When the load demand gap is small (less than ), it is more suitable to start the battery instead of the PHS system, because the start speed of the two systems is different, and a small amount of electricity can be quickly supplied by the battery. However, if the battery is already at the lowest level at this time, or the power supplied by the PV system and the battery is not enough to meet the load demand, then the power that the load lacks is supplied by the grid.
Similarly, when the load demand gap is relatively large (greater than ), the PHS system is given priority to supply power. However, if the storage of reservoir on the roof of the building is zero, then the battery will be started for auxiliary supply. In addition, other conditions are similar to those of the previous content, and the power shortage of the household is all supplied by the grid.
3.5.3. Charging Phase (Valley Hours)
Under valley hours, the consumption of the residents is all provided by the grid. Since the electricity price of valley hours is cheaper than half of the peak hours’ electricity price, the function of storing water at night can be introduced to prepare for the next day’s electricity consumption. However, it is not necessary to store water every night, and whether to operate the function is judged based on the weather of the next day.
The forecast in this study is based on the solar radiation data of previous years and the weather forecast for the next day to determine the operation of water storage at night. Once the weather forecast confirms the poor state of the sunlight on the next day, the solar irradiance data of previous years will be used as a reference, and the power generation of the PV system in a whole day will be divided into three levels by calculating in advance, as follows: 0–14 kWh, 14–20 kWh, and above 20 kWh. If the predicted/calculated power generation is less than 14 kWh, the upper reservoir will be filled when there is space; if the power generation is between 14 kWh and 20 kWh, the UR will be stored to half full; and if the power generation is greater than 20 kWh, no operation will be performed on the PHS system. The above functions are all operated under the condition that the solar radiation data in previous years and the weather forecast are not contradictory. No operation is performed in other situations, and only the load is supplied by the power grid at night.
4. Case Study and Results Analysis
In this study, the optimal capacity of the PV, UR, and battery was achieved through the TLBO algorithm, and the results are presented in Table 2. Due to the existence of the time-of-use policy, only the surplus power from the PV system is used to store water in the reservoir during the daytime. The electricity price is much cheaper at night than it is during the day, therefore, the household can purchase electricity from the grid to supply the pump. The stored water in the UR can prepare for electricity consumption the next day in bad weather conditions. This study considered two application scenarios for the residents of villa buildings: (1) Case 1: PV–PHS–battery system without water storage at night; (2) Case 2: PV–PHS–battery system with water storage at night, according to the weather forecast of the next day.
Table 2.
The optimal capacity of the major components in the system.
For the PHS system, the capacity of the pump should be selected according to the installed capacity of the PV system; therefore, 3.5 kW is set, which can absorb all electricity from the PV system under the safest conditions. The selection of the power of the turbine should be based on the peak load, i.e., 3.6 kW in this study, while, due to the limitation of the reservoir’s capacity and building height, the maximum power that the PHS system can provide is 2.4 kW, so the power of the turbine can be set to 2.5 kW. In addition, there are some studies in the literature that mount cement concrete UR on the roof, but this solution is neither safe nor economic. Taking into account the load-bearing capacity of the floor, this study uses a UR made of a material similar to plastic [54], which reduces the construction cost and safety risk. The prices of every piece of equipment within the total investment are listed in Table 3. The income of the household includes three items: national and local government subsidies, electricity cost savings, and net revenue from trading with the grid. In China, the national government will subsidize residents who use photovoltaic systems for power generation for 20 years (CNY 0.18/kWh), and the Shanghai Municipal Government will also subsidize households for 5 years (CNY 0.4/kWh) [55]. Due to the existence of subsidies, the households that adopt the scheme can obtain their payback time within a limited number of years.
Table 3.
Costs of each component.
4.1. Performance Analysis
In this section, the system performance on a typical day is chosen as an example for detailed analysis. During this day, the solar radiation is not very good, and the electricity generated by the PV system is 19.87 kWh, as shown in Figure 6. Most of the electricity is supplied to the load and sold to the grid, and the rest is stored in the battery or the PHS system. After adopting the optimized capacity of the system, the amount of electricity traded with the grid is 9.11 kWh, and it can be seen that the revenue of the electricity sold to the grid can cover part of the increased cost in installed capacity, so the total cost will not increase too much. It seems that the smaller the installed capacity, the less surplus power that can be generated, and it can reduce the instability and pressure of the grid. However, when the installed capacity becomes smaller, the load demand cannot be well met from the renewable energy system, and more electricity should be purchased from the grid accordingly, which will eventually deviate from the original intention of alleviating the pressure on the grid during the peak power consumption period.
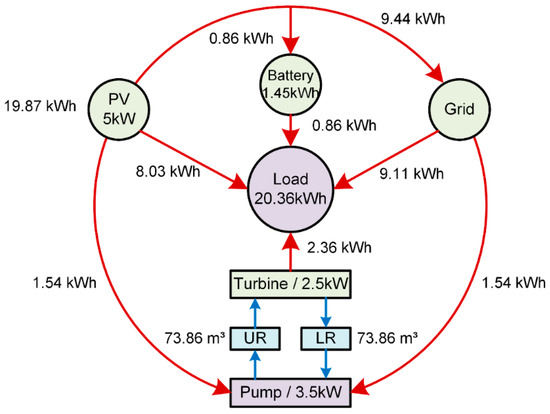
Figure 6.
Energy flow in the day with bad weather.
As shown in Figure 7, the power generation curve and load consumption curve of the PV system can be clearly expressed, which are represented by red and black lines, respectively. It reaches the peak period of electricity consumption at 5 p.m., and the load demand at this time can be fully satisfied by the PV and the PHS systems. It is worth noting that the electricity demand at 5 p.m. and 6 p.m. is relatively large, therefore, after the system utilizing the operation principle to judge, the PHS system with larger storage capacity is activated first. After the energy of the PHS system is exhausted, the battery starts to supply power. This set of logic is in full compliance with the operation principle shown in Section 3 and has value of application.
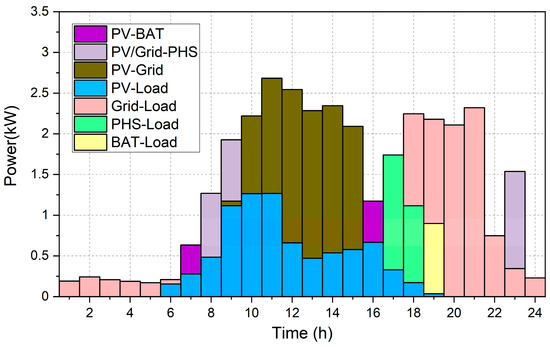
Figure 7.
Energy exchange of Case 2 in a typical day of bad weather.
4.2. Comparison of Two Cases
In the case study section, the value of THR is set to 0.7. Figure 8 and Figure 9 show the SOC of battery and UR in these two cases. Table 4 lists the technical indicators and economic indicators for these two cases, and the SCR values in both cases exceed 50%. The reason for the difference between the two cases is the introduction of water storage at night, and the SCR of Case 2 is slightly lower than that of Case 1. As the UR is fully stored at night, the surplus power from the PV system on the next day cannot be completely consumed because of the lower volume of UR. Similarly, the SSR in Case 2 is lower than that in Case 1 because Case 2 adopts the strategy of storing water at night, and this part of the electricity is supplied by the grid. The definition of SSR in this study is the electricity provided by the renewable energy system, and part of the load is provided by the water that is stored at night, so the value of SSR is lower. Due to considerations of cost, mounting the optimal installed capacity of the whole system will make the load receive less power, resulting in a reduction in SSR. However, the cost saved by reducing the battery and UR capacity is far greater than the cost of purchasing electricity from the grid, which is very beneficial to residents from an economic perspective.
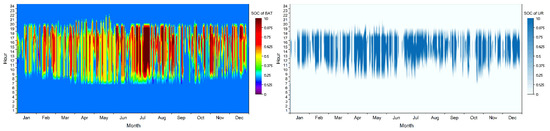
Figure 8.
SOC of battery and UR in Case 1.
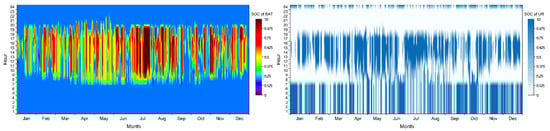
Figure 9.
SOC of battery and UR in Case 2.
Table 4.
Indicators of the two cases.
For comparison, this study introduces “Case 3,” in which the residents do not use any energy storage system or PV system, i.e., the reference case. Through calculation, in Case 3, the household’s annual net expenditure is about CNY 5263. In cases where the energy storage system is used (Case 1 and Case 2), although there is a large expense in the first year, which is about CNY 21,000, from the second year onwards (when there is no need to replace the system), the residents only need to spend about CNY 1500 per year. As shown in Figure 10, starting from the sixth year, that is, when households have reached the payback period for using this system, the total cost of Case 1 and Case 2 in the past 6 years has been less than the total cost of Case 3. In addition, the residents can also receive the benefits from the national and local governments. After the payback period is reached, the household can have net revenue from using the PV system, which could encourage the residents to install PV systems.
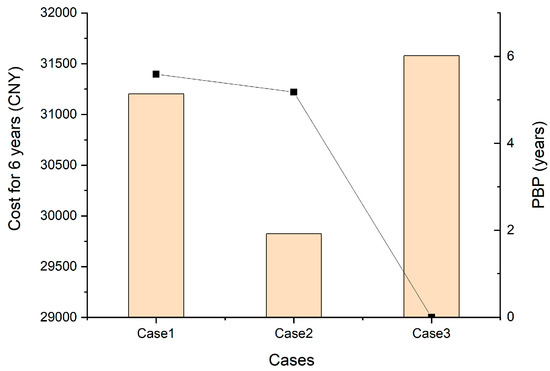
Figure 10.
Total cost for 6 years.
The payback periods of Case 1 and Case 2 are 5.6 years and 5.2 years, respectively. The cost of Case 2 is less than that of Case 1, indicating that the function of storing water at night can save costs. Because of the difference in electricity prices between morning and evening, the residents can utilize this policy for arbitrage of electricity price between peak and valley periods. In addition, users start the pump for storing water during valley electricity price periods and use the stored energy during peak price in the daytime, which can reduce the interaction between residents and the grid. This can not only save electricity bills, but also reduce the pressure on the grid. In conclusion, both Case 1 and Case 2 are more economical than Case 3.
4.3. Sensitivity Analysis
In this part, Case 2 is selected for sensitivity analysis, and THR will be changed to analyze the impact of it on technical and economic indicators (Figure 11). The analysis range of THR is 0.4 to 1.1 kWh, with a step size of 0.1 kWh. Obviously, simply increasing or decreasing THR will not simply cause an increase or decrease in cost. On the contrary, cost decreases and then increases as the THR increases, with the lowest point being 0.6 kWh. While the SCR increases with the increase in THR, SSR increases first and then decreases. However, the change in THR does not have much impact on the cost and the payback period. In the entire range of cost, it only changes within CNY 100.
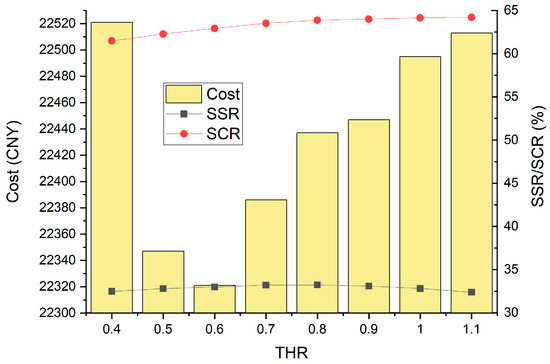
Figure 11.
Technical and economic indicators change under different THR values.
5. Conclusions
This study presents a grid-connected photovoltaic (PV) system integrated with pumped hydro storage (PHS) and battery storage, designed for distributed building applications. A refined formulation is introduced to accurately model the capacity variations of the upper reservoir (UR) and the battery. The system sizing—including the PV installed capacity, UR storage volume, and battery capacity—is optimized using the teaching–learning-based optimization (TLBO) algorithm. A nighttime water storage strategy is incorporated into the operational framework and compared against a non-storage baseline scheme. The results indicate that the proposed hybrid energy storage system is significantly more economical than the configuration without storage.
By employing advanced UR materials and the TLBO algorithm to minimize costs, the system achieves a payback period of approximately 5 years, which is considerably shorter than those reported in previous studies. Furthermore, an analysis of the pump activation threshold reveals that the system cost first decreases and then increases as the threshold rises, with the optimal value identified as 0.6 kWh within the examined range of 0.4–1.1 kWh.
This research demonstrates the feasibility and economic benefits of utilizing off-peak electricity through a nighttime water storage strategy. By storing water during low-price periods and supplying power during high-price daytime hours, residents can significantly reduce electricity expenses while also alleviating grid pressure. This approach offers a practical pathway toward enhancing energy sustainability in distributed building contexts.
It should be noted that this study remains at a preliminary stage. Future work should focus on experimental validation of the models and refining the nighttime storage strategy by integrating weather prediction methods, such as machine learning, to enhance operational accuracy under real-world conditions.
Author Contributions
Conceptualization, T.M.; Methodology, T.M., B.W. and C.D.; Software, B.W.; Validation, C.D.; Investigation, T.M., B.W. and C.D.; Data curation, M.S.J.; Writing—original draft, T.M.; Writing—review & editing, T.Z. All authors have read and agreed to the published version of the manuscript.
Funding
The authors gratefully acknowledge the financial support provided by the National Key R&D Program of China through Grant 2022YFB4201003, the National Natural Science Foundation of China (NSFC) through Grant 52376201, and the Science and Technology Commission of Shanghai Municipality through Grant 22160713800.
Data Availability Statement
The original contributions presented in this study are included in the article. Further inquiries can be directed to the corresponding author.
Conflicts of Interest
The authors declare no conflict of interest.
Abbreviations
| RE | Renewable energy |
| COE | Cost of energy |
| LCOE | Levelized cost of energy |
| ESS | Energy storage systems |
| PHS | Pumped hydro storage |
| CAES | Compressed air energy storage |
| PSO | Particle swarm optimization |
| TLBO | Teaching–Learning-based optimization |
| GA | Genetic algorithm |
| NOCT | Normal operating cell temperature |
| UR | Upper reservoir |
| SOC | The state of charge |
| SCR | Self-consumption rate |
| SSR | Self-sufficiency rate |
| PBP | Payback period |
| THR | Threshold |
References
- Ma, T.; Javed, M.S. Integrated sizing of hybrid PV-wind-battery system for remote island considering the saturation of each renewable energy resource. Energy Convers. Manag. 2019, 182, 178–190. [Google Scholar] [CrossRef]
- Javed, M.S.; Song, A.; Ma, T. Techno-economic assessment of a stand-alone hybrid solar-wind-battery system for a remote island using genetic algorithm. Energy 2019, 176, 704–717. [Google Scholar] [CrossRef]
- Ma, T.; Yang, H.; Gu, W.; Li, Z.; Yan, S. Development of walkable photovoltaic floor tiles used for pavement. Energy Convers. Manag. 2019, 183, 764–771. [Google Scholar] [CrossRef]
- Yang, C.-J.; Jackson, R.B. Opportunities and barriers to pumped-hydro energy storage in the United States. Renew. Sustain. Energy Rev. 2011, 15, 839–844. [Google Scholar] [CrossRef]
- Xu, X.; Hu, W.; Cao, D.; Liu, W.; Chen, Z.; Lund, H. Implementation of repowering optimization for an existing photovoltaic-pumped hydro storage hybrid system: A case study in Sichuan, China. Int. J. Energy Res. 2019, 43, 8463–8480. [Google Scholar] [CrossRef]
- Li, J. Optimal sizing of grid-connected photovoltaic battery systems for residential houses in Australia. Renew. Energy 2019, 136, 1245–1254. [Google Scholar] [CrossRef]
- Bolund, B.; Bernhoff, H.; Leijon, M. Flywheel energy and power storage systems. Renew. Sustain. Energy Rev. 2007, 11, 235–258. [Google Scholar] [CrossRef]
- Lund, H.; Salgi, G. The role of compressed air energy storage (CAES) in future sustainable energy systems. Energy Convers. Manag. 2009, 50, 1172–1179. [Google Scholar] [CrossRef]
- Ma, T.; Yang, H.; Zhang, Y.; Lu, L.; Wang, X. Using phase change materials in photovoltaic systems for thermal regulation and electrical efficiency improvement: A review and outlook. Renew. Sustain. Energy Rev. 2015, 43, 1273–1284. [Google Scholar] [CrossRef]
- Ma, T.; Li, Z.; Zhao, J. Photovoltaic panel integrated with phase change materials (PV-PCM): Technology overview and materials selection. Renew. Sustain. Energy Rev. 2019, 116, 109406. [Google Scholar] [CrossRef]
- Ma, T.; Zhao, J.; Li, Z. Mathematical modelling and sensitivity analysis of solar photovoltaic panel integrated with phase change material. Appl. Energy 2018, 228, 1147–1158. [Google Scholar] [CrossRef]
- Deane, J.P.; Ó Gallachóir, B.P.; McKeogh, E.J. Techno-economic review of existing and new pumped hydro energy storage plant. Renew. Sustain. Energy Rev. 2010, 14, 1293–1302. [Google Scholar] [CrossRef]
- Canales, F.A.; Beluco, A.; Mendes, C.A.B. A comparative study of a wind hydro hybrid system with water storage capacity: Conventional reservoir or pumped storage plant? J. Energy Storage 2015, 4, 96–105. [Google Scholar] [CrossRef]
- Fan, J.; Xie, H.; Chen, J.; Jiang, D.; Li, C.; Ngaha Tiedeu, W.; Ambre, J. Preliminary feasibility analysis of a hybrid pumped-hydro energy storage system using abandoned coal mine goafs. Appl. Energy 2020, 258, 114007. [Google Scholar] [CrossRef]
- Ma, T.; Yang, H.; Lu, L. A feasibility study of a stand-alone hybrid solar–wind–battery system for a remote island. Appl. Energy 2014, 121, 149–158. [Google Scholar] [CrossRef]
- Kaldellis, J.K.; Kapsali, M.; Kavadias, K.A. Energy balance analysis of wind-based pumped hydro storage systems in remote island electrical networks. Appl. Energy 2010, 87, 2427–2437. [Google Scholar] [CrossRef]
- Tan, Q.; Qiao, L.; Wen, X.; Wang, Z. Short-term scheduling of a hybrid pumped storage-photovoltaic power complementary system considering market-oriented electricity prices. Energy 2025, 329, 136687. [Google Scholar] [CrossRef]
- Tan, Q.; Wang, Y.; Wen, X.; Qiao, L.; Wang, Z. Cross-regional peak-shaving scheduling for the hybrid pumped storage-wind-photovoltaic complementary system. Energy 2025, 326, 136119. [Google Scholar] [CrossRef]
- Kusakana, K. Hybrid DG-PV with groundwater pumped hydro storage for sustainable energy supply in arid areas. J. Energy Storage 2018, 18, 84–89. [Google Scholar] [CrossRef]
- Kim, Y.M.; Shin, D.G.; Favrat, D. Operating characteristics of constant-pressure compressed air energy storage (CAES) system combined with pumped hydro storage based on energy and exergy analysis. Energy 2011, 36, 6220–6233. [Google Scholar] [CrossRef]
- de Oliveira e Silva, G.; Hendrick, P. Pumped hydro energy storage in buildings. Appl. Energy 2016, 179, 1242–1250. [Google Scholar] [CrossRef]
- Ciric, R.M. Review of techno-economic and environmental aspects of building small hydro electric plants—A case study in Serbia. Renew. Energy 2019, 140, 715–721. [Google Scholar] [CrossRef]
- Bhandari, B.; Poudel, S.R.; Lee, K.-T.; Ahn, S.-H. Mathematical modeling of hybrid renewable energy system: A review on small hydro-solar-wind power generation. Int. J. Precis. Eng. Manuf.-Green Technol. 2014, 1, 157–173. [Google Scholar] [CrossRef]
- Mousavi, N.; Kothapalli, G.; Habibi, D.; Das, C.K.; Baniasadi, A. Modelling, design, and experimental validation of a grid-connected farmhouse comprising a photovoltaic and a pumped hydro storage system. Energy Convers. Manag. 2020, 210, 112675. [Google Scholar] [CrossRef]
- Jianmin, Z.; Zhang, Q. Feasibility and simulation study of high-rise building Micro-grid with PV and mini-hydro pumping. In Proceedings of the 2013 IEEE Power & Energy Society General Meeting, Vancouver, BC, Canada, 21–25 July 2013; pp. 1–5. [Google Scholar]
- Lahmer, Y.; Chaker, A.; Nedjar, A. Performance evaluation of grid-connected photovoltaic with pumped hydro storage system in high-rise building. Energy Sustain. Dev. 2024, 81, 101470. [Google Scholar] [CrossRef]
- Akter, M.N.; Mahmud, M.A.; Oo, A.M.T. Comprehensive economic evaluations of a residential building with solar photovoltaic and battery energy storage systems: An Australian case study. Energy Build. 2017, 138, 332–346. [Google Scholar] [CrossRef]
- Baniasadi, A.; Habibi, D.; Al-Saedi, W.; Masoum, M.A.S.; Das, C.K.; Mousavi, N. Optimal sizing design and operation of electrical and thermal energy storage systems in smart buildings. J. Energy Storage 2020, 28, 101186. [Google Scholar] [CrossRef]
- Bhayo, B.A.; Al-Kayiem, H.H.; Gilani, S.I.U.; Ismail, F.B. Power management optimization of hybrid solar photovoltaic-battery integrated with pumped-hydro-storage system for standalone electricity generation. Energy Convers. Manag. 2020, 215, 112942. [Google Scholar] [CrossRef]
- Javed, M.S.; Zhong, D.; Ma, T.; Song, A.; Ahmed, S. Hybrid pumped hydro and battery storage for renewable energy based power supply system. Appl. Energy 2020, 257, 114026. [Google Scholar] [CrossRef]
- Wang, K.; Zhu, H.; Dang, J.; Ming, B.; Wu, X. Short-term optimal scheduling of wind-photovoltaic-hydropower-thermal-pumped hydro storage coupled system based on a novel multi-objective priority stratification method. Energy 2024, 309, 133190. [Google Scholar] [CrossRef]
- Ameur, A.; Berrada, A.; Emrani, A. Intelligent energy management system for smart home with grid-connected hybrid photovoltaic/ gravity energy storage system. J. Energy Storage 2023, 72, 108525. [Google Scholar] [CrossRef]
- Lu, B.; Stocks, M.; Blakers, A.; Anderson, K. Geographic information system algorithms to locate prospective sites for pumped hydro energy storage. Appl. Energy 2018, 222, 300–312. [Google Scholar] [CrossRef]
- Ayodele, T.R.; Ogunjuyigbe, A.S.O.; Ibitoye, T.Y. Optimal selection of pumped hydro storage based renewable energy generator(s) for isolated community using binary sort and search algorithm. Renew. Energy Focus 2019, 28, 100–111. [Google Scholar] [CrossRef]
- Jung, S.; Kang, H.; Lee, M.; Hong, T. An optimal scheduling model of an energy storage system with a photovoltaic system in residential buildings considering the economic and environmental aspects. Energy Build. 2020, 209, 109701. [Google Scholar] [CrossRef]
- Stoppato, A.; Benato, A.; Destro, N.; Mirandola, A. A model for the optimal design and management of a cogeneration system with energy storage. Energy Build. 2016, 124, 241–247. [Google Scholar] [CrossRef]
- Najafi Ashtiani, M.; Toopshekan, A.; Razi Astaraei, F.; Yousefi, H.; Maleki, A. Techno-economic analysis of a grid-connected PV/battery system using the teaching-learning-based optimization algorithm. Sol. Energy 2020, 203, 69–82. [Google Scholar] [CrossRef]
- Lin, S.; Ma, T.; Shahzad Javed, M. Prefeasibility study of a distributed photovoltaic system with pumped hydro storage for residential buildings. Energy Convers. Manag. 2020, 222, 113199. [Google Scholar] [CrossRef]
- Ma, T.; Shen, L.; Li, M. Electrical Energy Storage for Buildings. In Handbook of Energy Systems in Green Buildings; Springer: Berlin/Heidelberg, Germany, 2018; pp. 1–29. [Google Scholar]
- Notton, G.; Lazarov, V.; Stoyanov, L. Optimal sizing of a grid-connected PV system for various PV module technologies and inclinations, inverter efficiency characteristics and locations. Renew. Energy 2010, 35, 541–554. [Google Scholar] [CrossRef]
- Klein, S.A.; Theilacker, J.C. An Algorithm for Calculating Monthly-Average Radiation on Inclined Surfaces. J. Sol. Energy Eng. 1981, 103, 29–33. [Google Scholar] [CrossRef]
- Gu, W.; Ma, T.; Li, M.; Shen, L.; Zhang, Y. A coupled optical-electrical-thermal model of the bifacial photovoltaic module. Appl. Energy 2020, 258, 114075. [Google Scholar] [CrossRef]
- Ma, T.; Yang, H.; Lu, L.; Peng, J. Technical feasibility study on a standalone hybrid solar-wind system with pumped hydro storage for a remote island in Hong Kong. Renew. Energy 2014, 69, 7–15. [Google Scholar] [CrossRef]
- Zhang, Y.; Ma, T.; Elia Campana, P.; Yamaguchi, Y.; Dai, Y. A techno-economic sizing method for grid-connected household photovoltaic battery systems. Appl. Energy 2020, 269, 115106. [Google Scholar] [CrossRef]
- Luthander, R.; Widén, J.; Nilsson, D.; Palm, J. Photovoltaic self-consumption in buildings: A review. Appl. Energy 2015, 142, 80–94. [Google Scholar] [CrossRef]
- Kumar, S.; Tiwari, G. Life cycle cost analysis of single slope hybrid (PV/T) active solar still. Appl. Energy 2009, 86, 1995–2004. [Google Scholar] [CrossRef]
- Ekren, O.; Ekren, B.Y. Size optimization of a PV/wind hybrid energy conversion system with battery storage using simulated annealing. Appl. Energy 2010, 87, 592–598. [Google Scholar] [CrossRef]
- Rao, R.V.; Savsani, V.J.; Vakharia, D.P. Teaching–learning-based optimization: A novel method for constrained mechanical design optimization problems. Comput.-Aided Des. 2011, 43, 303–315. [Google Scholar] [CrossRef]
- Rao, R.V.; Savsani, V.J.; Vakharia, D.P. Teaching–Learning-Based Optimization: An optimization method for continuous non-linear large scale problems. Inf. Sci. 2012, 183, 1–15. [Google Scholar] [CrossRef]
- Rao, R.V.; Patel, V. An elitist teaching-learning-based optimization algorithm for solving complex constrained optimization problems. Int. J. Ind. Eng. Comput. 2012, 3, 535–560. [Google Scholar] [CrossRef]
- Rao, R.V.; Patel, V. An improved teaching-learning-based optimization algorithm for solving unconstrained optimization problems. Sci. Iran. 2012, 20, 710–720. [Google Scholar] [CrossRef]
- Rao, R.V.; Patel, V. Multi-objective optimization of heat exchangers using a modified teaching-learning-based optimization algorithm. Appl. Math. Model. 2013, 37, 1147–1162. [Google Scholar] [CrossRef]
- Grid, S. Shanghai Electricity Price List. Available online: http://www.sh.sgcc.com.cn/html/main/col706/2017-09/15/20170915104247687553782_1.html (accessed on 24 September 2025).
- Mousavi, N.; Kothapalli, G.; Habibi, D.; Khiadani, M.; Das, C.K. An improved mathematical model for a pumped hydro storage system considering electrical, mechanical, and hydraulic losses. Appl. Energy 2019, 247, 228–236. [Google Scholar] [CrossRef]
- Photovoltaic Energy Circle. The Latest 2019 PV Subsidy Standards. Available online: http://guangfu.bjx.com.cn/news/20190221/964037.shtml (accessed on 24 September 2025).
- Motwani, K.H.; Jain, S.V.; Patel, R.N. Cost Analysis of Pump as Turbine for Pico Hydropower Plants—A Case Study. Procedia Eng. 2013, 51, 721–726. [Google Scholar] [CrossRef]
- Saxena, M.; Sharma, S.P.; Mohan, C. Cost Optimization of Intze Tanks on Shafts Using Nonlinear Programming. Eng. Optim. 1987, 10, 279–288. [Google Scholar] [CrossRef]
Disclaimer/Publisher’s Note: The statements, opinions and data contained in all publications are solely those of the individual author(s) and contributor(s) and not of MDPI and/or the editor(s). MDPI and/or the editor(s) disclaim responsibility for any injury to people or property resulting from any ideas, methods, instructions or products referred to in the content. |
© 2025 by the authors. Licensee MDPI, Basel, Switzerland. This article is an open access article distributed under the terms and conditions of the Creative Commons Attribution (CC BY) license (https://creativecommons.org/licenses/by/4.0/).