Abstract
Automatic modulation classification (AMC) of received unknown signals is critical in modern communication systems, enabling intelligent signal interception and spectrum management. In this paper, we propose a wavelet-based spectrum convolutional neural network (WS-CNN) model that integrates signal processing techniques with deep learning to achieve robust classification under challenging conditions, including noise, fading, and Doppler effects. The WS-CNN model is based on wavelet analysis and a convolutional neural network (CNN). Specifically, the proposed wavelet analysis, including wavelet threshold denoising, median filtering, and continuous wavelet transformation, is used for signal preprocessing to extract features and generate a compact 2D diagram. The 2D diagram is subsequently fed into the CNN for classification. The simulation results show that the proposed WS-CNN model achieves higher classification rates across a wide range of signal-to-noise ratios (SNRs) compared with existing methods.
1. Introduction
Modulation classification is the core technology in non-cooperation systems, which have become increasingly significant in military and civilian applications. The purpose of automatic modulation classification (AMC) is to accurately classify modulation modes of digital signals with less prior information. Primary AMC approaches can be categorized into two types: likelihood-based (LB) and feature-based (FB) classification methods [1].
The typical example of LB methods is the maximum likelihood (ML) modulation classifier [2], which can achieve a low error rate under a high signal-to-noise ratio (SNR). However, it relies on precise prior information in LB methods and increases the computational complexity compared to FB methods. In [3], the constellation shape is extracted and subsequently follows an FB variance (VAR) method, providing an innovative feature extraction strategy for classification models. Furthermore, a support vector machine (SVM) is often employed as a traditional classifier to improve classification rates [4].
In recent years, deep learning (DL) has demonstrated remarkable progress in modulation classification, with convolutional neural networks (CNNs) and long short-term memory (LSTM) networks being widely used to classify I/Q signals or time–frequency representations [5,6]. Combining DL with feature extraction processes can significantly increase classification rates while reducing dependency on prior information. For instance, a graph convolutional network (GCN) is utilized in [7], which validates the feasibility of using feature diagrams as input to convolutional neural networks (CNNs). To further improve performance, a multi-network method that combines a CNN with gated recurrent units (GRUs) has been proposed, applying a weighting mechanism to model results [8].
Although this method greatly enhances AMC performance compared to single-network methods, it comes with increased network complexity. Generally, CNNs have proven effective in processing 2D diagrams and classifying in AMC systems. Recently, diagram generation methods have been utilized before being fed into CNNs, such as short-time discrete Fourier transformation (STFT), constellation mapping [9], and continuous wavelet transformation (CWT). However, the performance of these approaches remains constrained in low-SNR environments. Furthermore, most DL-based models require extensive labeled datasets for training, but in practical non-cooperative scenarios, acquiring sufficient annotated samples presents significant challenges.
Modulation recognition research has revealed that preprocessing signals with denoising filters significantly enhances model performance. Neural networks trained on denoised inputs exhibit a 3.6% average accuracy improvement over non-denoised baselines [10]. In addition, during data preprocessing, signal denoising can effectively improve feature diagrams by increasing the SNR of the signal [11]. Compared to other methods, AMC systems based on time–frequency diagrams require less prior information, such as carrier frequency and timing information. Notably, wavelet-based deep learning has also gained attention in related domains. For example, shrinkage-based representations have been applied to machinery signals, where the shrinkage mechanism provides robustness against noise and data scarcity [12]. This validates the significance of wavelets in enhancing feature stability under low-SNR scenarios.
In addition, extensive research has demonstrated the effectiveness of wavelet–CNN hybrids in two-dimensional signal processing tasks. Representative approaches include the multi-level wavelet–CNN (MWCNN) for image restoration [13], Wavelet–SRNet for multi-scale face super-resolution [14], and a medical imaging super-resolution framework that leverages wavelet multi-resolution transformation analysis [15]. These studies confirm that wavelet-domain preprocessing can improve feature fidelity and computational efficiency. Moreover, more advanced paradigms such as attention mechanisms, Transformer-based architectures, and few-shot or zero-shot learning have been explored in AMC tasks [16,17,18]. These methods represent promising directions for scalability and open-set recognition.
Existing studies have demonstrated the effectiveness of CWT for modulation recognition in radar signals [19]; however, its application to communication signal modulation identification has received limited attention in research. For complex communication environments, our proposed wavelet-assisted AMC system employs a multi-stage approach combining wavelet threshold denoising and CWT [20,21]. Our main contributions are summarized as follows:
- (1)
- We design a novel wavelet-based spectrum convolutional neural network (WS-CNN) model, which incorporates wavelet analysis and CNN. In the wavelet analysis, a signal denoising method consisting of multi-level wavelet threshold denoising and median filtering is utilized before CWT. The proposed WS-CNN model requires substantially smaller training sets and can achieve an average classification rate of 98.2% across an SNR range of −10 dB to 20 dB.
- (2)
- We present a novel center frequency determination method for signal analysis through wavelet time–frequency representation. Compared to conventional square-input approaches, this process generates a more compact time–frequency diagram and reduces network parameters by 70%.
The rest of the paper is organized as follows. Section 2 introduces the system model and signal preprocessing methods, including the signal model, noise suppression, and feature transformation. Section 3 presents the architecture of the proposed WS-CNN network. Section 4 shows the simulation results and performance comparisons between the WS-CNN model and several existing methods. Section 5 provides the discussion, and conclusions are drawn in Section 6.
2. System Model and Signal Preprocessing
2.1. Signal Model
A wireless communication system with a block fading channel is adopted in this paper. The received signal can be represented as
where is the channel gain of the fading channel following a normal distribution, is Gaussian white noise with zero mean, and
is the modulated signal, where is the information bit stream, represents the modulation order, and is the modulation function. Several common digital modulation modes are considered in this paper, including Quadrature Amplitude Modulation (QAM), Frequency Shift Keying (FSK), Amplitude Shift Keying (ASK), and Phase Shift Keying (PSK).
At the receiver, the sampled signal with sampling rate can be written as
where is the sampling index, and is the sampling interval.
2.2. Noise Suppression Approach
Considering the feature distortion caused by noise amplification at low SNRs, our method employs wavelet threshold denoising to achieve noise-robust feature representation, complemented by median filtering to eliminate residual impulsive noise. This dual-processing strategy maintains the integrity of modulation characteristics.
The wavelet denoising method comprises two stages: decomposition and reconstruction. A widely used method for discrete wavelet decomposition is the Mallat algorithm, known for its rapid wavelet analysis capabilities. In the wavelet decomposition process, the approximation signal and detail signal are calculated through a cascade of Finite Impulse Response (FIR) filters, followed by down-sampling. Here, is the level of wavelet decomposition, and is the largest decomposition level. The FIR filters consist of a low- and high-pass filter, which provide the frequency response of wavelet filter coefficients and , respectively. These coefficients are orthogonal mirror images of each other and can be written as
The parameters of can be derived from the wavelet functions [22]. The Mallat algorithm at each level of decomposition is described as
where and represent the coefficients of , and , respectively. is the length of the decomposed signal, and represents the coefficient of the twice-down-sampled approximation signal at the -th level.
At the first decomposition level, the approximation signal and detail signal are extracted from the original signal . During the decomposition, the effective bandwidth of the approximation signal is halved compared to the previous level. In the subsequent decomposition level, the low-frequency signal is then treated as the input signal and decomposed in the same way.
The three-stage wavelet decomposition process is shown in Figure 1. This procedure results in the extraction of the detail signals , and , which contains the noise components of , along with the approximation signal , which represents the essential information of the signal.
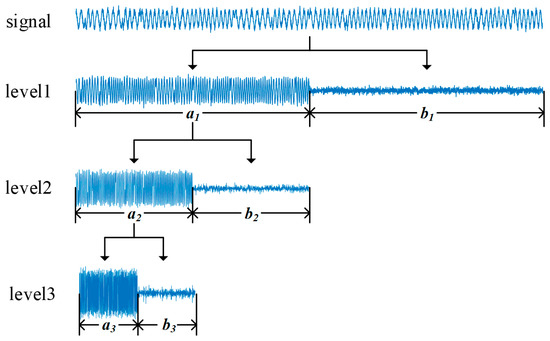
Figure 1.
Process of three-stage wavelet decomposition.
For efficient denoising, the detail signal from different levels is processed by distinct thresholds. In this paper, the Heursure threshold selection rule is employed since it has superior threshold estimation abilities. Moreover, Heursure combines the advantages of both Sqtwolog and Rigrsure methods, thereby providing enhanced adaptivity [23]. Each level of wavelet decomposition generates a distinct threshold. Firstly, the Sqtwolog threshold and the Rigrsure threshold of the -th level are defined as
where is the indicator function, returning 0 or 1 depending on whether the input is incorrect or correct, respectively. Then, the Heursure decision statistics are computed:
and the Heursure threshold is
The fundamental operation function of soft thresholding [24] is defined as
where is the set of wavelet coefficients of the denoised detail signal , which can be reconstructed to the denoised signal along with an approximated signal. The reconstruction expression of wavelet transformation is given by
where is the coefficient of , which represents the denoised approximation signal at the -th level, and are the reverse of and , and and denote the coefficients obtained by inserting zeros between each pair of points in and , respectively. Based on a discrete signal of length , the computational cost of a -level DWT with an -tap filter is proportional to , which simplifies to for practical implementations where and are constants.
To enhance denoising performance, three different wavelet basis functions are employed sequentially to increase the SNR of the signal. After wavelet denoising, unevenness still exists in the approximated signal. A median filter is then applied to attain the denoised signal , resulting in a smoother signal than wavelet denoising alone [8]. The median filter is defined as
2.3. Feature Transformation
In the modulation procedure, the amplitude, phase, and frequency of a signal are used to present different bit streams. CWT can effectively extract frequency information in the time domain by scaling and shifting the wavelet basis function with minimal prior information. The discrete CWT of the denoised signal can be written as
where c is the scale factor, ranging from zero to the Nyquist sampling rate, d is the index of the time domain, and
is the complex Morlet wavelet, where denotes the center frequency.
However, a larger network input size leads to an increased number of network parameters. Consequently, we propose a center frequency determination method, which can be written as
where is the center frequency of the signal. The effective frequency components of the diagram are selected around the center frequency , and the time components are down-sampled. Figure 2 shows the wavelet time–frequency diagrams of different modulation modes without noise. The computational cost of the CWT grows linearly with both the signal length and the number of scales . Specifically, for each scale, the wavelet is convolved with the entire signal, leading to a total complexity of
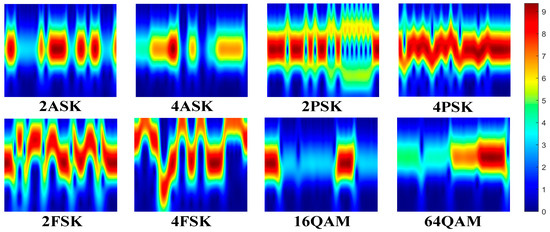
Figure 2.
Wavelet time–frequency diagrams of eight modulation modes without noise.
3. Classification Network
The proposed WS-CNN model consists of two stages: wavelet analysis and CNN. Wavelet analysis serves as the preprocessing step and generates a 2D time–frequency diagram, as is shown in Section 2. As shown in Figure 3, the network of the WS-CNN model consists of four convolutional layers, two maximum pooling layers, two fully connected layers, a flatten layer, and an output layer as its basic structural unit.
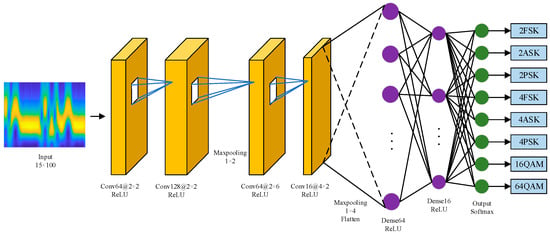
Figure 3.
Network architecture of the WS-CNN model.
The input of the network is a spectrogram of fixed dimensions 15 × 100, which represents the time and frequency characteristics of the signal. The use of rectangular convolutional kernels in our model is motivated by empirical studies indicating that square kernels tend to underperform on rectangular inputs [25]. To address this, we employ anisotropic kernel configurations in both convolutional and pooling layers, effectively aligning with the aspect ratio of input and enhancing feature extraction performance. Additionally, the proposed center frequency determination method demonstrates superior computational efficiency relative to conventional square-input approaches. Specifically, the parameter count is reduced from 1,103,592 to 233,192, representing an 80% reduction in model complexity. This significant reduction in computational requirements is accomplished without compromising analytical performance and produces a more compact and precise time–frequency representation.
In the network, the two initial convolutional layers utilize a kernel of size 2 × 2, followed by a maximum pooling layer with a pooling window size of 1 × 2. The subsequent convolutional layers employ larger kernel sizes of 2 × 6 and 4 × 2, respectively. For a standard convolutional layer, the operation can be expressed as
where is the output feature map at layer , is the convolution kernel, is the input feature map from layer , denotes the bias term, and is the activation function. These larger kernels expand the receptive field, allowing the network to capture more complex frequency-related features. Following these convolutional layers, the maximum pooling layer utilizes a pooling window dimension of 1 × 4, resulting in a set of rectangular feature maps for further processing. The kernels of the convolutional layers are set to 64, 128, 64, and 16, respectively.
Furthermore, after the convolutional and pooling layers, the feature data is passed through fully connected layers consisting of 64 and 16 neurons, respectively. These layers serve to map features into a feature space suitable for classification. After each layer, the data goes through an activation layer utilizing the ReLU activation function, which is defined as
In the output layer, a softmax activation function generates the predicted probabilities for each modulation mode. The softmax function is defined as
where represents the output of the fully connected layers for the -th classes, and represents the total number of modulation modes in the dataset. The output layer produces a probability distribution over the eight modulation modes, with each neuron outputting a value ranging from 0 to 1. Based on the output layer, the final classification result can be written as
where is the output of each neuron in the output layer, and is the modulation mode.
The whole WS-CNN framework is presented in Table 1.

Table 1.
Architecture of the proposed WS-CNN.
4. Simulation Results
The WS-CNN model integrates wavelet denoising and median filtering to process 15 × 100-sized time–frequency scalograms, optimized for rectangular CNN inputs. Ablation experiments confirm that 15 × 100 inputs achieve peak accuracy with minimal complexity. Additionally, we present the CWT-derived results at each processing stage and elucidate the rationale of the preprocessing step. The simulation results show that WS-CNN attains 85.6% accuracy at −10 dB SNR, and an average accuracy of 99.7% above −2 dB. The combination of wavelet preprocessing and aspect-ratio-adaptive CNN design validates the framework’s effectiveness in complex communication scenarios.
4.1. Datasets
In the simulations, eight modulation signals are utilized to evaluate the performance of the proposed WS-CNN model: 16QAM, 64QAM, 2ASK, 4ASK, 2PSK, 4PSK, 2FSK, and 4FSK. Each modulated signal comprises 256 symbols transmitted using a 4 kHz carrier frequency, with a sampling rate of 160 kHz and bit rate of 5000 bits/s. The Doppler frequency shift is randomly set between −500 Hz and 500 Hz. Additive white Gaussian noise (AWGN) is added to simulate channel noise conditions. By adjusting the SNR, we can simulate the real-world signal.
Three wavelet bases (db3, sym2, and coif3) are sequentially used to denoise the signal. The db3 wavelet [26], with its short support, provides strong suppression of high-frequency noise components. The sym2 wavelet [27] exhibits a near-linear phase, which helps preserve transient structures and phase trajectories in the modulated signal. The coif3 wavelet [28], with higher vanishing moments, offers balanced time–frequency localization and further smooths residual low-frequency fluctuations while retaining the modulation contour. By combining these complementary properties in sequence (db3 → sym2 → coif3), the proposed scheme effectively removes noise across different frequency ranges while preserving the essential modulation characteristics.
Subsequently, a median filter with an order of 10 is applied. After feature transformation, the 2D wavelet time–frequency diagram derived from CWT with a fixed size of 15 × 100 is used as the CNN input. The datasets are randomly split into a training set, validation set, and testing set. For all SNRs, 57,600 samples are generated for the training set, 6400 samples for the validation set, and 12,800 samples for the test set. We use Adam optimizers with the default learning rate of 0.0001 to train the network. The training process will not stop early if the validation loss decreases within 30 epochs. The initial parameters of the model are random, the batch size is set to 80, and the maximum number of training epochs is 100. The weights with the smallest loss are saved and utilized to test the model. In addition, the specific hardware configuration used for training and testing involves an Intel Core i7-14650HX CPU and an NVIDIA GeForce RTX 4060 GPU. Under this setup, the proposed model requires 195M FLOPs, with an average inference time of 0.0749 ms per sample. The training and validation losses of the proposed network are shown in Figure 4.
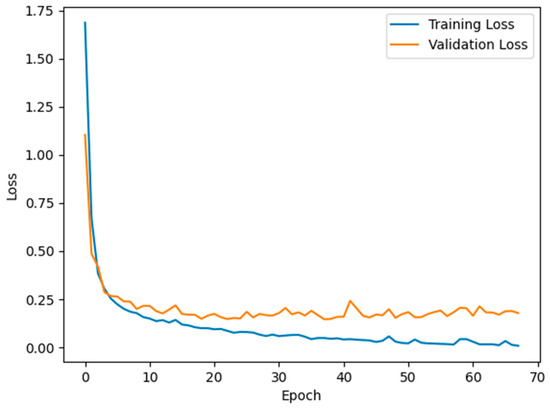
Figure 4.
Training and validation loss of the proposed network.
4.2. Results and Analysis
As illustrated in Figure 5, the CWT results at each processing stage demonstrate that denoising strategies based on db3, sym2, or coif3 wavelets retain significant noise, introducing significant errors into the frequency determination algorithm. After wavelet denoising, the signal still exhibits some unsmooth portions. Median filtering is commonly used after wavelet threshold denoising. The final wavelet time–frequency plot after median filtering has better feature representation, and the central frequency can be calculated accurately.
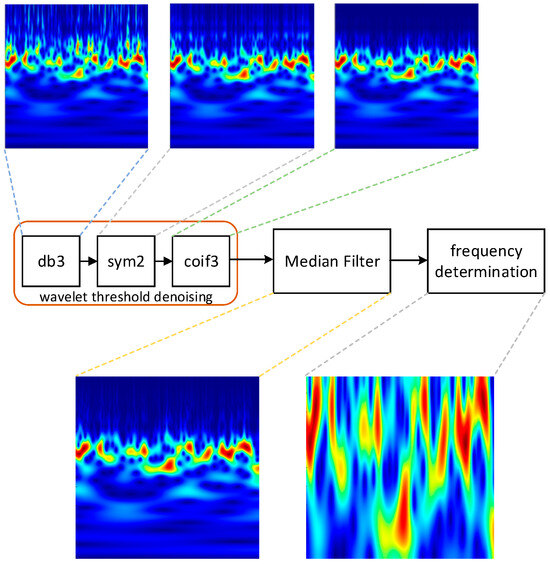
Figure 5.
Time–frequency representations obtained via CWT at each processing stage at 0 dB.
As shown in Table 2, the quantitative results further confirm these observations. When only a single wavelet basis (db3, sym2, or coif3) is applied, the classification accuracy at a low SNR remains limited. Pairwise combinations of wavelet bases provide slight improvements, but the overall robustness is still insufficient. In contrast, the proposed sequential scheme significantly outperforms all alternatives, achieving 85.6% accuracy at −10 dB and nearly perfect recognition. As long as a sufficient number of layers is applied, the specific sequence of wavelets is not critical. These results demonstrate the synergistic effect of combining complementary wavelet bases, which effectively suppresses noise across different frequency ranges and preserves the modulation characteristics for reliable classification.

Table 2.
Accuracy of wavelet basis combinations across various SNRs.
Figure 6 shows a comparative analysis of time–frequency distributions before and after median filtering. The results show that our proposed method achieves the best performance. Specifically, our method outperforms the method without a median filter by 1.5% in accuracy when the SNR is −10 dB. In addition, the accuracy significantly improves for denoised signals when frequency information is limited. Since noise manifests as amplitude variations in the time–frequency diagram, the center frequency of the noised signal cannot be calculated correctly, resulting in a low classification rate. Simulation results also demonstrate that employing wavelet bases solely for denoising yields center frequency estimation errors comparable to those observed in untreated signals.
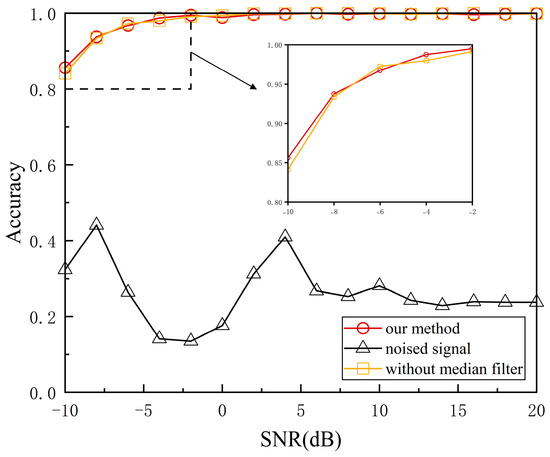
Figure 6.
Classification accuracy for denoised vs. noised signals.
Figure 7 shows the outcomes of ablation experiments conducted with different CNN input sizes. The diagrams of size 10 × 100, 15 × 100, and 25 × 100 are centered on the center frequency , and the size of 100 × 100 is derived from the time–frequency diagram. When SNR is below 0 dB, the average accuracy of diagrams with 10, 15, and 25 frequency components is 93.6%, 94.9%, and 94.8%, respectively. While the 25 × 100-sized diagrams exhibit similar properties compared to the 15 × 100 size, they lead to increased network complexity. A noticeable decline in performance occurs when the frequency component is lower than 15. Additionally, the poor performance of input size 100 × 100 is primarily because the number of training samples is inefficient. The result shows that the 15 × 100-sized diagrams provide a more favorable balance between model efficiency and classification accuracy, especially at low SNRs. Since the CNN input is not square, we also found that the classification rate of the WS-CNN model is the best when the windows of the two maximum pooling layers are not square.
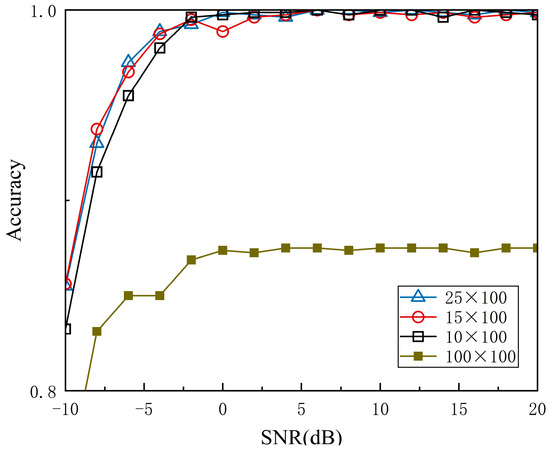
Figure 7.
Classification accuracy for different input sizes.
The performance comparisons between the WS-CNN model and several existing methods are shown in Figure 8. All parameters in these methods are derived from the discrete time series data, with the SNR information excluded from the test label. The results clearly indicate that the WS-CNN model outperforms the other methods, especially at low SNRs. As depicted, the classification rate of the WS-CNN model is 85.6% when SNR is −10 dB, outperforming the new GRU+CNN method by 5.1%. The VAR method demonstrates the poorest performance among the tested methods, primarily due to the reduced model complexity compared to the ML method [8]. Additionally, the performance of VAR degrades significantly at low SNRs due to sensitivity to noise. The GCN method also exhibits suboptimal performance at high SNRs. This decline is attributed to the lack of calculation in the feature extraction process. The WS-CNN model, by contrast, can accurately recognize almost all eight modulation modes with an average classification rate of 99.7% when the SNR is above −2 dB. This superior performance benefits from the advanced feature-extracting capability provided by wavelet analysis, along with the robustness of the network architecture.
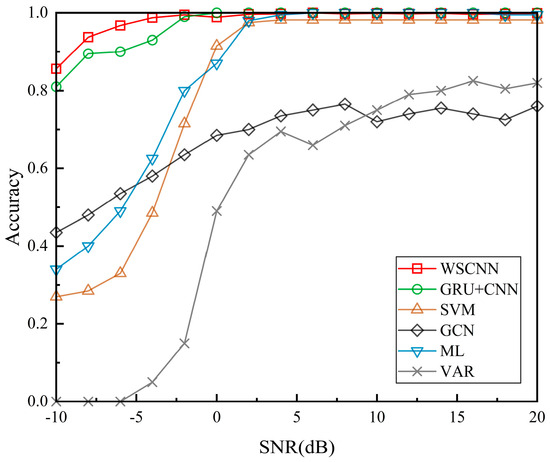
Figure 8.
Comparison of classification performance between WS-CNN model and existing methods.
Figure 9 shows the confusion matrices of the proposed model when the SNR is −10 dB and 10 dB, respectively. When SNR is −10 dB, the classification rate for all modulation modes exceeds 80%, demonstrating the model’s stability even under challenging noise conditions. The WS-CNN model successfully classifies over 90% of 2ASK and 4PSK signals at the cost of confusion between certain modulation modes. Despite this, as depicted in the second confusion matrix, the WS-CNN model achieves nearly perfect classification accuracy at 10 dB, with classification rates for all modulation modes approaching 100%. This significant improvement validates the feasibility of the WS-CNN model. Overall, the proposed WS-CNN model maintains high classification accuracy across different modulation modes.
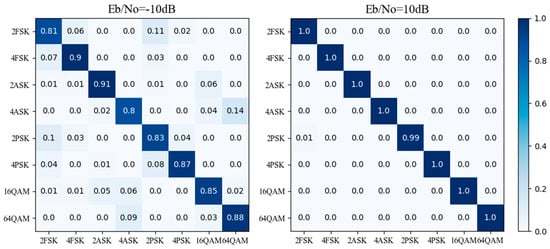
Figure 9.
Confusion matrix of the WS-CNN model on the full test set at −10 dB and 10 dB.
The WS-CNN model is a parameter-efficient deep learning framework for automatic modulation classification, achieving competitive performance with only 57,600 training samples while containing merely 233,192 parameters. It establishes an optimal balance between model complexity and sample efficiency. The efficient parameter utilization and rapid convergence of WS-CNN address critical challenges in radio signal processing where labeled data acquisition remains resource-intensive, thereby offering a practical solution for spectrum-monitoring applications with limited training data in real-world deployment.
Furthermore, we incorporated the Convolutional Block Attention Module (CBAM) and Squeeze-and-Excitation (SE) attention mechanisms into the proposed WS-CNN, and the results are summarized in Table 3. It can be observed that although the introduction of attention modules incurs additional computational overhead, the performance improvement is marginal.

Table 3.
Accuracy combinations across various SNRs with CBAM and SE.
4.3. Statistical Analysis of Performance in SNR
To transparently quantify the uncertainty of our classification results under finite test set sizes, we provide 95% confidence intervals (CIs) for accuracy at each SNR condition. For each SNR bin , let be the number of test items and the number of correct predictions by the model. The observed top-1 accuracy is
We adopt the Wilson score interval for binomial proportions, which is known to be more reliable than the naïve normal approximation, especially for moderate or proportions near 0 or 1. For a two-sided CI with , the interval is
Then the CIs of different methods are summarized in Table 4.

Table 4.
CIs of different methods.
The confidence interval analysis shows that deep learning models, particularly GRU+CNN and WS-CNN, achieve higher accuracies with consistently higher and narrower confidence intervals across all SNR levels. This indicates not only superior average performance but also greater statistical robustness compared to traditional methods, whose intervals are wider and lower, especially under low SNR conditions.
5. Discussion
The results of this study highlight the significant benefits of integrating advanced signal preprocessing with deep learning for AMC. The WS-CNN model demonstrates a robust ability to accurately classify multiple modulation types under a wide range of SNRs, primarily owing to its two-stage feature extraction pipeline. A key observation is that wavelet threshold denoising, when combined with median filtering, effectively suppresses both broadband and impulsive noise, substantially improving the clarity of time–frequency representations. This denoising process is critical for retaining essential modulation features, which is particularly evident at low SNRs where noise can otherwise dominate and distort the extracted features. CWT further enhances feature separability by generating highly distinctive time–frequency patterns for different modulation schemes, providing rich inputs for the subsequent CNN classifier.
Another notable outcome is the optimization of CNN architecture for rectangular time–frequency diagrams (15 × 100), which reduces the parameter count by approximately 80% and improves classification performance. This design accelerates training and inference and addresses the practical constraints of limited computational resources and labeled data availability. The ablation studies confirm that smaller, aspect-ratio-adapted network inputs can achieve a favorable trade-off between accuracy and model complexity, especially in low-SNR scenarios. The comparative experiments reveal that the proposed WS-CNN model consistently outperforms traditional ML, VAR, and other deep learning-based methods, such as GRU+CNN and GCN. The confusion matrix analysis further validates the model’s stability and generalization, as it maintains high classification rates even under significant noise, and only exhibits minor confusion between certain modulation classes at the lowest SNR tested.
Despite these advances, several limitations and future challenges remain. First, the current model is trained and evaluated on simulated datasets with controlled channel and noise conditions. Real-world wireless environments may introduce additional impairments, such as multipath fading, channel non-stationarity, and hardware imperfections, which could impact model performance. Nevertheless, the present study was restricted to eight commonly used modulation types, following [8] to ensure fair comparison. Extending the dataset to include higher-order and emerging modulation schemes, particularly within the framework of open-set recognition, remains an important direction for future research.
Although the proposed model shows promising performance in simulation-based evaluations, we acknowledge that real-world factors such as multipath propagation and dynamic Doppler effects may degrade accuracy. Future work will therefore focus on extending the dataset and validating the approach under more realistic channel conditions to strengthen its practical applicability.
6. Conclusions
In this paper, we have proposed a novel wavelet-based spectrum convolutional neural network (WS-CNN) framework for automatic modulation classification in communication systems. By combining multi-level wavelet threshold denoising, median filtering, continuous wavelet transformation, and an optimized CNN, the method achieves high classification accuracy and strong robustness to noise, as validated by comprehensive simulations across eight modulation formats and a wide SNR range.
The WS-CNN model attains an average classification accuracy of 98.2% over SNRs from −10 dB to 20 dB and a nearly perfect accuracy above −2 dB, surpassing state-of-the-art traditional and deep learning methods. The efficiency of the approach is further enhanced by a novel input size selection and model parameter reduction strategy, supporting deployment in scenarios with limited data and computation budgets. These results demonstrate the effectiveness and generalizability of the proposed WS-CNN model for AMC tasks, especially in challenging low-SNR environments. In future work, we plan to extend the model to accommodate more complex and dynamic wireless channels, incorporate domain adaptation strategies for real-world deployment, and explore open-set and incremental learning capabilities to further enhance system flexibility and resilience.
Author Contributions
Writing—original draft preparation, M.W. and Z.Z.; writing—review and editing, G.L. and W.Z.; conceptualization, M.W.; supervision, J.Z.; formal analysis, G.L. All authors have read and agreed to the published version of the manuscript.
Funding
This research received no external funding.
Data Availability Statement
Data are contained within the article.
Acknowledgments
The authors would like to thank the editor and the anonymous referees for their constructive comments.
Conflicts of Interest
The authors declare no conflicts of interest.
References
- An, Z.; Zhang, T.; Ma, B.; Yi, C.; Xu, Y. Automatic High-Order Modulation Classification for Beyond 5G OSTBC-OFDM Systems via Projected Constellation Vector Learning Network. IEEE Commun. Lett. 2022, 26, 84–88. [Google Scholar] [CrossRef]
- Wen, W.; Mendel, J.M. A new maximum-likelihood method for modulation classification. In Proceedings of the Conference Record of The Twenty-Ninth Asilomar Conference on Signals, Systems and Computers, Pacific Grove, CA, USA, 30 October 1995–1 November 1996; Volume 2, pp. 1132–1136. [Google Scholar]
- Tamakuwala, J.B. New Low Complexity Variance Method for Automatic Modulation Classification and Comparison with Maximum Likelihood Method. In Proceedings of the 2019 International Conference on Range Technology (ICORT), Balasore, India, 15–17 February 2019. [Google Scholar]
- Li, S.-P.; Chen, F.-C.; Wang, L. Modulation classification algorithm of digital signal based on support vector machine. In Proceedings of the 2012 24th Chinese Control and Decision Conference (CCDC), Taiyuan, China, 23–25 May 2012. [Google Scholar]
- Zhou, R.; Liu, F.; Gravelle, C.W. Deep Learning for Modulation Classification: A Survey with a Demonstration. IEEE Access 2020, 8, 67366–67376. [Google Scholar] [CrossRef]
- Chen, Y.; Xu, X.; Qin, X. An Open-Set Modulation Classification Scheme with Deep Representation Learning. IEEE Commun. Lett. 2023, 27, 851–855. [Google Scholar] [CrossRef]
- Liu, Y.; Liu, Y.; Yang, C. Modulation Classification with Graph Convolutional Network. IEEE Wireless Commun. Lett. 2020, 9, 624–627. [Google Scholar] [CrossRef]
- Liu, F.G.; Zhang, Z.W.; Zhou, R.L. Automatic modulation classification based on CNN and GRU. Tsinghua Sci. Technol. 2022, 27, 422–431. [Google Scholar] [CrossRef]
- Peng, C.; Cheng, W.; Song, Z.; Dong, R. A Noise-Robust Modulation Signal Classification Method Based on Continuous Wavelet Transform. In Proceedings of the 2020 IEEE 5th Information Technology and Mechatronics Engineering Conference (ITOEC), Chongqing, China, 12–14 June 2020; pp. 745–750. [Google Scholar]
- Hou, Y.; Liu, C. Modulation Recognition of Communication Signals Based on Cascade Network. IEICE Trans. Commun. 2024, E107-B, 620–626. [Google Scholar] [CrossRef]
- Zhu, H.; Zhou, L.; Chen, C. A Denoising Radio Classifier with Residual Learning for Modulation Classification. In Proceedings of the 2021 IEEE 21st International Conference on Communication Technology (ICCT), Tianjin, China, 13–16 October 2021; pp. 177–181. [Google Scholar]
- Chen, Z.; Huang, H.; Deng, Z.; Wu, J. Shrinkage Mamba Relation Network with Out-of-Distribution Data Augmentation for Rotating Machinery Fault Detection and Localization under Zero-Faulty Data. Mech. Syst. Signal Process. 2025, 224, 112145. [Google Scholar] [CrossRef]
- Liu, P.; Zhang, H.; Zhang, K.; Lin, L.; Zuo, W. Multi-Level Wavelet-CNN for Image Restoration. In Proceedings of the CVPR Workshops, Salt Lake City, UT, USA, 18–22 June 2018; pp. 773–782. [Google Scholar]
- Huang, H.; He, R.; Sun, Z.; Tan, T. Wavelet-SRNet: A Wavelet-Based CNN for Multi-Scale Face Super-Resolution. In Proceedings of the ICCV, Venice, Italy, 22–29 October 2017; pp. 1689–1697. [Google Scholar]
- Yu, Y.; She, K.; Liu, J.; Cai, X.; Shi, K.; Kwon, O.M. A Super-Resolution Network for Medical Imaging via Transformation Analysis of Wavelet Multi-Resolution. Neural Netw. 2023, 166, 162–173. [Google Scholar] [CrossRef] [PubMed]
- Wang, D.; Lin, M.; Zhang, X.; Huang, Y.; Zhu, Y. Automatic Modulation Classification Based on CNN-Transformer Graph Neural Network. Sensors 2023, 23, 7281. [Google Scholar] [CrossRef] [PubMed]
- Ma, W.; Cai, Z.; Wang, C. A Transformer and Convolution-Based Learning Framework for Automatic Modulation Classification. IEEE Commun. Lett. 2024, 28, 1392–1396. [Google Scholar] [CrossRef]
- Zhang, H.; Zhou, F.; Wu, Q.; Yuen, C. FSOS-AMC: Few-Shot Open-Set Learning for Automatic Modulation Classification. arXiv 2024, arXiv:2410.10265. [Google Scholar]
- Han, J.-W.; Park, C.H. A Unified Method for Deinterleaving and PRI Modulation Recognition of Radar Pulses Based on Deep Neural Networks. IEEE Access 2021, 9, 89360–89375. [Google Scholar] [CrossRef]
- Guo, T.; Zhang, T.; Lim, E.; Lopez-Benitez, M.; Ma, F.; Yu, L. A Review of Wavelet Analysis and Its Applications: Challenges and Opportunities. IEEE Access 2022, 10, 58869–58903. [Google Scholar] [CrossRef]
- Chen, T.; Zheng, S.; Qiu, K.; Zhang, L.; Xuan, Q.; Yang, X. Augmenting Radio Signals with Wavelet Transform for Deep Learning-Based Modulation Recognition. IEEE Trans Cog. Commun. Net. 2024, 10, 2029–2044. [Google Scholar] [CrossRef]
- Walczak, B.; Massart, D.L. Noise suppression and signal compression using the wavelet packet transform. Chemom. Intell. Lab. Syst. 1997, 36, 81–94. [Google Scholar] [CrossRef]
- Donoho, D.L.; Johnstone, I.M. Adapting to Unknown Smoothness via Wavelet Shrinkage. Public Am. Stat. Assoc. 1995, 90, 1200–1224. [Google Scholar] [CrossRef]
- Li, S.; Liu, S.; Wang, J.; Yan, S.; Liu, J.; Du, Z. Adaptive Wavelet Threshold Function-Based M2M Gaussian Noise Removal Method. IEEE Internet Things J. 2024, 11, 33177–33192. [Google Scholar] [CrossRef]
- Chen, Q.; Zhang, W.; Zhou, N.; Lei, P.; Xu, Y.; Zheng, Y.; Fan, J. Adaptive Fractional Dilated Convolution Network for Image Aesthetics Assessment. In Proceedings of the 2020 IEEE/CVF Conference on Computer Vision and Pattern Recognition, Seattle, WA, USA, 13–19 June 2020; pp. 14102–14111. [Google Scholar]
- Daubechies, I. Ten Lectures on Wavelets; SIAM: Philadelphia, PA, USA, 1992. [Google Scholar]
- Daubechies, I.; Sweldens, W. Factoring wavelet transforms into lifting steps. J. Fourier Anal. Appl. 1998, 4, 247–269. [Google Scholar] [CrossRef]
- Cohen, A.; Daubechies, I.; Feauveau, J.C. Biorthogonal bases of compactly supported wavelets. Commun. Pure Appl. Math. 1992, 45, 485–560. [Google Scholar] [CrossRef]
Disclaimer/Publisher’s Note: The statements, opinions and data contained in all publications are solely those of the individual author(s) and contributor(s) and not of MDPI and/or the editor(s). MDPI and/or the editor(s) disclaim responsibility for any injury to people or property resulting from any ideas, methods, instructions or products referred to in the content. |
© 2025 by the authors. Licensee MDPI, Basel, Switzerland. This article is an open access article distributed under the terms and conditions of the Creative Commons Attribution (CC BY) license (https://creativecommons.org/licenses/by/4.0/).