Article

Hierarchical Hybrid Control and Communication Topology Optimization in DC Microgrids for Enhanced Performance

1
School of Electric Power, South China University of Technology, Guangzhou 510641, China
2
IREENA, Nantes University, 44600 St Nazaire, France
*
Author to whom correspondence should be addressed.
Electronics 2025, 14(19), 3797; https://doi.org/10.3390/electronics14193797
Submission received: 7 August 2025 / Revised: 7 September 2025 / Accepted: 22 September 2025 / Published: 25 September 2025
(This article belongs to the Special Issue Power Electronics Controllers for Power System)

Abstract

Bus voltage regulation and accurate power sharing constitute two pivotal control objectives in DC microgrids. The conventional droop control method inherently suffers from steady-state voltage deviation. Centralized control introduces vulnerability to single-point failures, with significantly degraded stability under abnormal operating conditions. Distributed control strategies mitigate this vulnerability but require careful balancing between control effectiveness and communication costs. Therefore, this paper proposes a hybrid hierarchical control architecture integrating multiple control strategies to achieve near-zero steady-state deviation voltage regulation and precise power sharing in DC microgrids. Capitalizing on the complementary advantages of different control methods, an operation-condition-adaptive hierarchical control (OCAHC) strategy is proposed. The proposed method improves reliability over centralized control under communication failures, and achieves better performance than distributed control under normal conditions. With a fault-detection logic module, the OCAHC framework enables automatic switching to maintain high control performance across different operating scenarios. For the inherent trade-off between consensus algorithm performance and communication costs, a communication topology optimization model is established with communication cost as the objective, subject to constraints including communication intensity, algorithm convergence under both normal and N-1 conditions, and control performance requirements. An accelerated optimization approach employing node-degree computation and equivalent topology reduction is proposed to enhance computational efficiency. Finally, case studies on a DC microgrid with five DGs verify the effectiveness of the proposed model and methods.

1. Introduction

A microgrid is a decentralized network with self-generating capabilities, supporting the integration of various distributed energy resources such as PV systems, wind turbines, and battery energy-storage systems. By implementing microgrids, several critical issues of the power system such as peak shaving and optimal allocation of energy of distributed energy resources can be tackled conveniently, which contributes to the reducing of the power loss, power fluctuation, and the emission of greenhouse gases [1]. With increasing climate change challenges, microgrid systems have emerged as a technically viable and sustainable solution for enabling clean, low-carbon electricity generation and consumption.
While traditional microgrids predominantly employ AC systems, DC microgrid offers distinct advantages for large-scale integration of distributed renewable generation. Most of the renewable energy sources and the energy-storage devices are in a DC state, so the DC microgrids can easily interface with these devices [2]. Thus, applying DC microgrids can reduce the usage of inverters and converters, eliminating the power loss caused by the devices. In addition, the use of DC microgrids helps to mitigate issues such as frequency instability, synchronization, reactive power, harmonic currents, and the skin effect, thereby enabling the adoption of a simpler control strategy [3].
Bus voltage regulation and accurate power sharing constitute two pivotal control objectives in DC microgrids. The objective of voltage control is to ensure proper operation of all integrated components, while power control aims to prevent distributed sources from overloading that may lead to additional losses. In response to these challenges, researchers have proposed various control methods. Droop control has been applied in DC microgrid control [4]. This method does not rely on communication and responds quickly during faults. However, droop control results in steady-state voltage deviation and fails to achieve power sharing due to differences between line impedances. What is more, in the majority of droop control scenarios, there exists a compromise between voltage regulation and load-sharing accuracy. Choosing a smaller droop gain improves voltage regulation but reduces current sharing accuracy. Conversely, opting for a higher droop gain negatively impacts voltage regulation. To tackle the issue, papers [5,6,7] proposed a strategy based on calculation of the virtual resistances. This method considers the mismatched interconnecting feeder resistances, which are the primary contributors to inaccuracies in proportional power and current sharing among the DC–DC converters. By optimally adjusting the virtual resistance of each converter, precise power sharing even with mismatched feeder resistances is achieved. Thus, the adverse effects of mismatched values in the physical feeder resistances is effectively mitigated [6]. Nevertheless, this method cannot resolve the inherent voltage deviation issue in droop control, and voltage regulation still requires secondary control implementation.
Secondary control can be implemented in either a centralized or distributed nature. In the centralized control, all of the local converters are submitted to a main controller, which monitors the DC bus voltage and compares it with a reference value. A proportional–integral (PI) controller handles the voltage deviation between the reference and the actual value, with its output transmitted to the local controller of each converter [8]. In this way, all of the buses can receive the global information of the system, and thus the goal of power sharing as well as voltage control can be achieved accurately. However, the system is fragile when meeting a single point of failure because of the over-dependence of the central controller.
To tackle this problem, a distributed control strategy is proposed in [9] to enhance the system’s resilience against faults. By implementing this approach, the coordinated performance operates independently from the central controller, thereby improving the overall system’s robustness against single-point failures. In [9], a novel distributed secondary control method that can mitigate the impact of communication noise on consensus convergence and accuracy is proposed. The method presented in [2] can eliminate voltage deviation while achieving total cost minimization through optimal power control. Furthermore, a dynamic average consensus observer is proposed [10] based on bias compensation, which addresses the issue of initial value dependency in distributed algorithms. Additionally, the proposed method considers the effects of communication delays and ensures accurate convergence to the average of tracked variables while tolerating bounded communication delays. Paper [11] investigates the influence of communication topology on control performance, but it does not propose an optimal topology planning method. Through comparative simulations of different topologies, the study revealed that communication topology significantly affects control convergence speed. In the final distributed control model, the authors empirically select a topology with satisfactory control performance and moderate communication costs, without providing quantitative principles for topology selection. References [12,13] proposed an iterative algorithm based on edge swapping for network topology optimization. The algorithm maintains the degree of each node while reconnecting two selected edges, thereby improving the convergence rate and reducing communication events without increasing the number of communication links. However, this approach relies on predefined node-degree parameters and is mainly applicable to online topology optimization of multi-agent systems, rather than achieving globally optimal topology generation from a planning perspective during the initial construction of communication networks. Moreover, both works did not address whether the new links formed by edge swapping can satisfy communication reliability requirements. Table 1 presents a comparison of the constraints and conditions addressed by different studies in the context of communication topology optimization. Currently, no existing communication planning model has been developed that simultaneously carries out topology design during the network framework construction stage.
Actually, communication topology has a significant impact on the performance of distributed control. When distributed controllers are closely interconnected, the system exhibits faster convergence. However, this also results in higher communication costs. Therefore, to avoid redundant communication links and reduce hardware deployment costs, it is necessary to perform optimal communication topology planning. Furthermore, under each topology, there exists an issue of determining the optimal parameter values. However, previous studies have not addressed the planning of communication topologies for consensus algorithms, nor have they proposed quantitative principles for topology selection. In response to this, this paper addresses the contradiction between the control performance of consensus algorithms and communication costs by proposing a distributed device communication topology planning model.
The main contribution of this article can be summarized in three aspects.
(1)
Capitalizing on the complementary advantages of different control methods, an operation-condition-adaptive hierarchical control (OCAHC) strategy is proposed. The proposed strategy exhibits higher reliability than conventional centralized control under communication device failures, while achieving superior control performance compared to traditional distributed control during normal operating conditions. By incorporating a fault-detection logic module, the OCAHC framework enables automatic switching under different operating conditions, thereby ensuring enhanced control performance.
(2)
To address the trade-off between control performance and communication costs in consensus algorithms, a distributed communication topology optimization model is proposed. The proposed planning model formulates communication cost minimization as the objective function, subject to constraints including communication intensity, algorithm convergence rate, and control performance metrics. The model can incorporate various practical operational constraints during the offline planning phase, meeting the communication topology design requirements for distributed systems.
(3)
During the topology generation process, an optimization strategy is proposed based on node-degree computation and equivalent topology reduction to accelerate the convergence of the optimization algorithm.
The remainder of this paper is organized as follows. In Section 2, the limitations of conventional control methods are analyzed, which makes sure the subsequent control framework designed to mitigate these weaknesses. Section 3 presents a hierarchical control architecture incorporating control-mode-switching mechanisms. Section 4 then focuses on the distributed control design within this framework, proposing a consensus-based algorithm along with distributed device communication topology that satisfies all specified operational constraints. In Section 5, a Monte Carlo simulation was conducted to quantitatively evaluate the reliability of different control algorithms, demonstrating the superiority of the proposed method in terms of reliability. In Section 6, the proposed topology planning model is applied to a DC microgrid, with discussions on both the planning outcomes and computational efficiency of the model. A case study of a five-DG DC microgrid validates the proposed topology planning model and hierarchical control algorithm. The complexity cost of the planning algorithm lies in the additional hardware investment and communication energy consumption. By calculating indicators such as the cost–benefit ratio, both the economic feasibility of the planning scheme and the rationality of its associated complexity cost are verified. Experimental results highlight its efficacy in maintaining voltage stability and ensuring accurate power distribution.

2. Limitations of Conventional Control Methods

2.1. Droop Control

Droop control is widely applied in control scheme of DC microgrids because of its plug-and-play ability as well as robustness under topology variation. Droop control aims at power sharing, and is achieved by setting droop gain, an important parameter of droop control. As shown in Figure 1, voltage changes with current with a droop gain setting to be 4% [14]. In this case, for every 1.0 p.u. fluctuation of current, the output deviation of voltage will be 0.4 p.u.
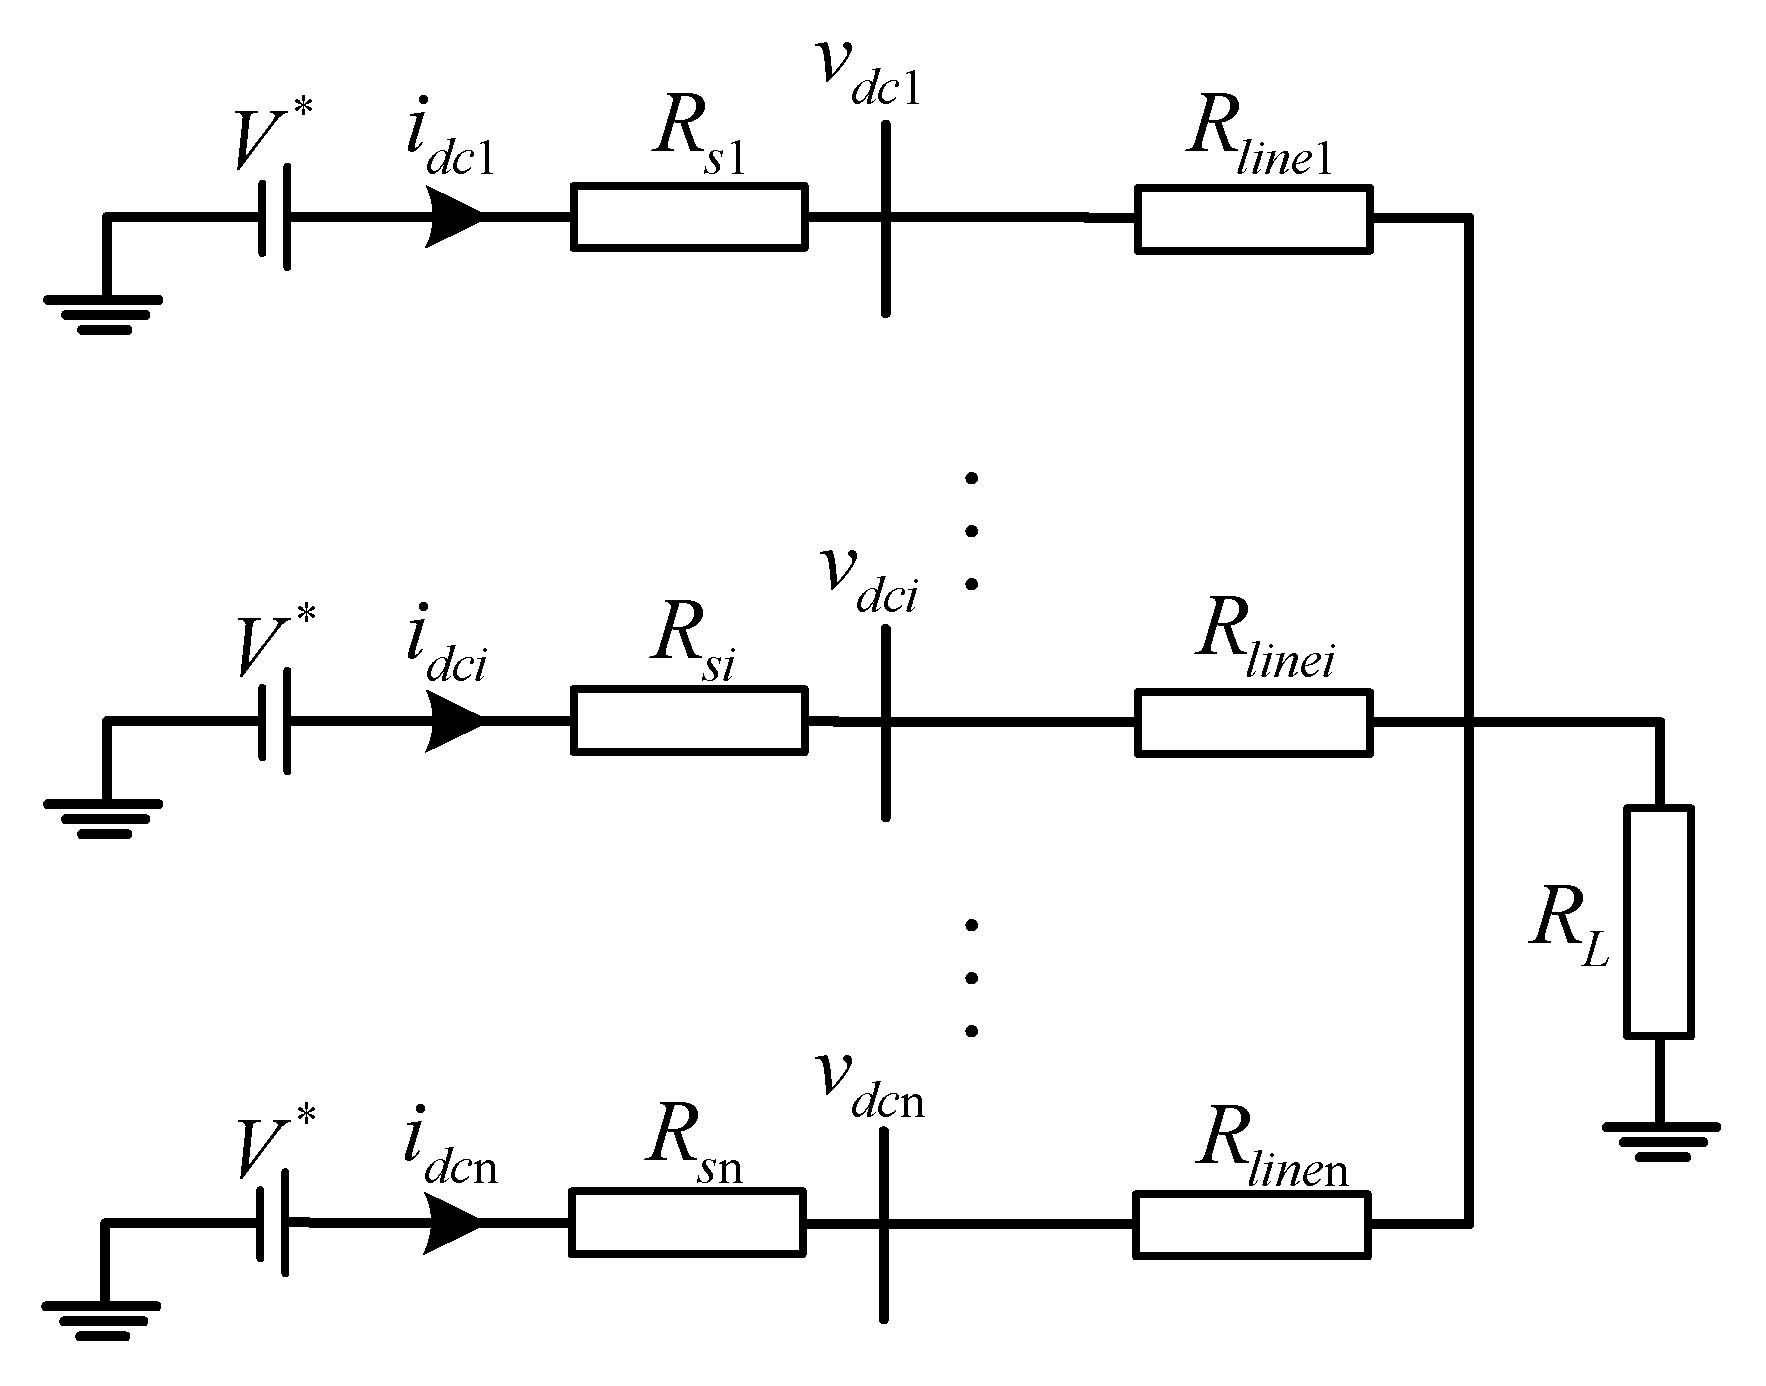
Applying droop control in DC microgrid shown in Figure 2, the output voltage of agent i is:
v d c i = V * R s i i d c i
where i d c i and V d c i are the output current and voltage of agent-i, V * is the reference of voltage, R s i is the droop gain. Thus, droop control has an inherent voltage deviation, which is caused by virtual resistance [9]:
Δ v d c i = R s i i d c i
In addition, the load voltage v L can also be derived from (1):
v L = V * ( R s i + R l i n e i ) i d c i
To agent i and agent n, the output power i d c i and i d c n can be obtained as:
i d c i = V * v L R s i + R l i n e i
i d c n = V * v L R s n + R l i n e n
In DC microgrids, it is necessary to achieve equal power sharing in order to reduce line losses, maintain stable voltage levels and prevent certain power sources from overloading due to excessive power output [5]. Hence, consider the current sharing error between agent i and agent n as:
Δ i d c = ( V * v L ) ( 1 R s i + R l i n e i 1 R s n + R l i n e n )
From which the condition of accurate current sharing can be derived:
R s i + R l i n e i = R s n + R l i n e n
In this case, consider all the agents share the same droop gain:
R s 1 = R s 2 = = R s n
It can be concluded from (7) and (8) that the zero-error current sharing can be achieved if and only if the line impedance satisfies R l i n e i = R l i n e j for all i , j = 1 , 2 , , n . However, this condition is an ideal one and is impossible to be achieved. Thus, the differences in line impedances will lead to unbalanced power distribution, especially in large-scale DC microgrids, causing overloading of power sources and voltage instability. Therefore, secondary control is applied on the proposed system to achieve equal power sharing.

2.2. Centralized Control Strategy

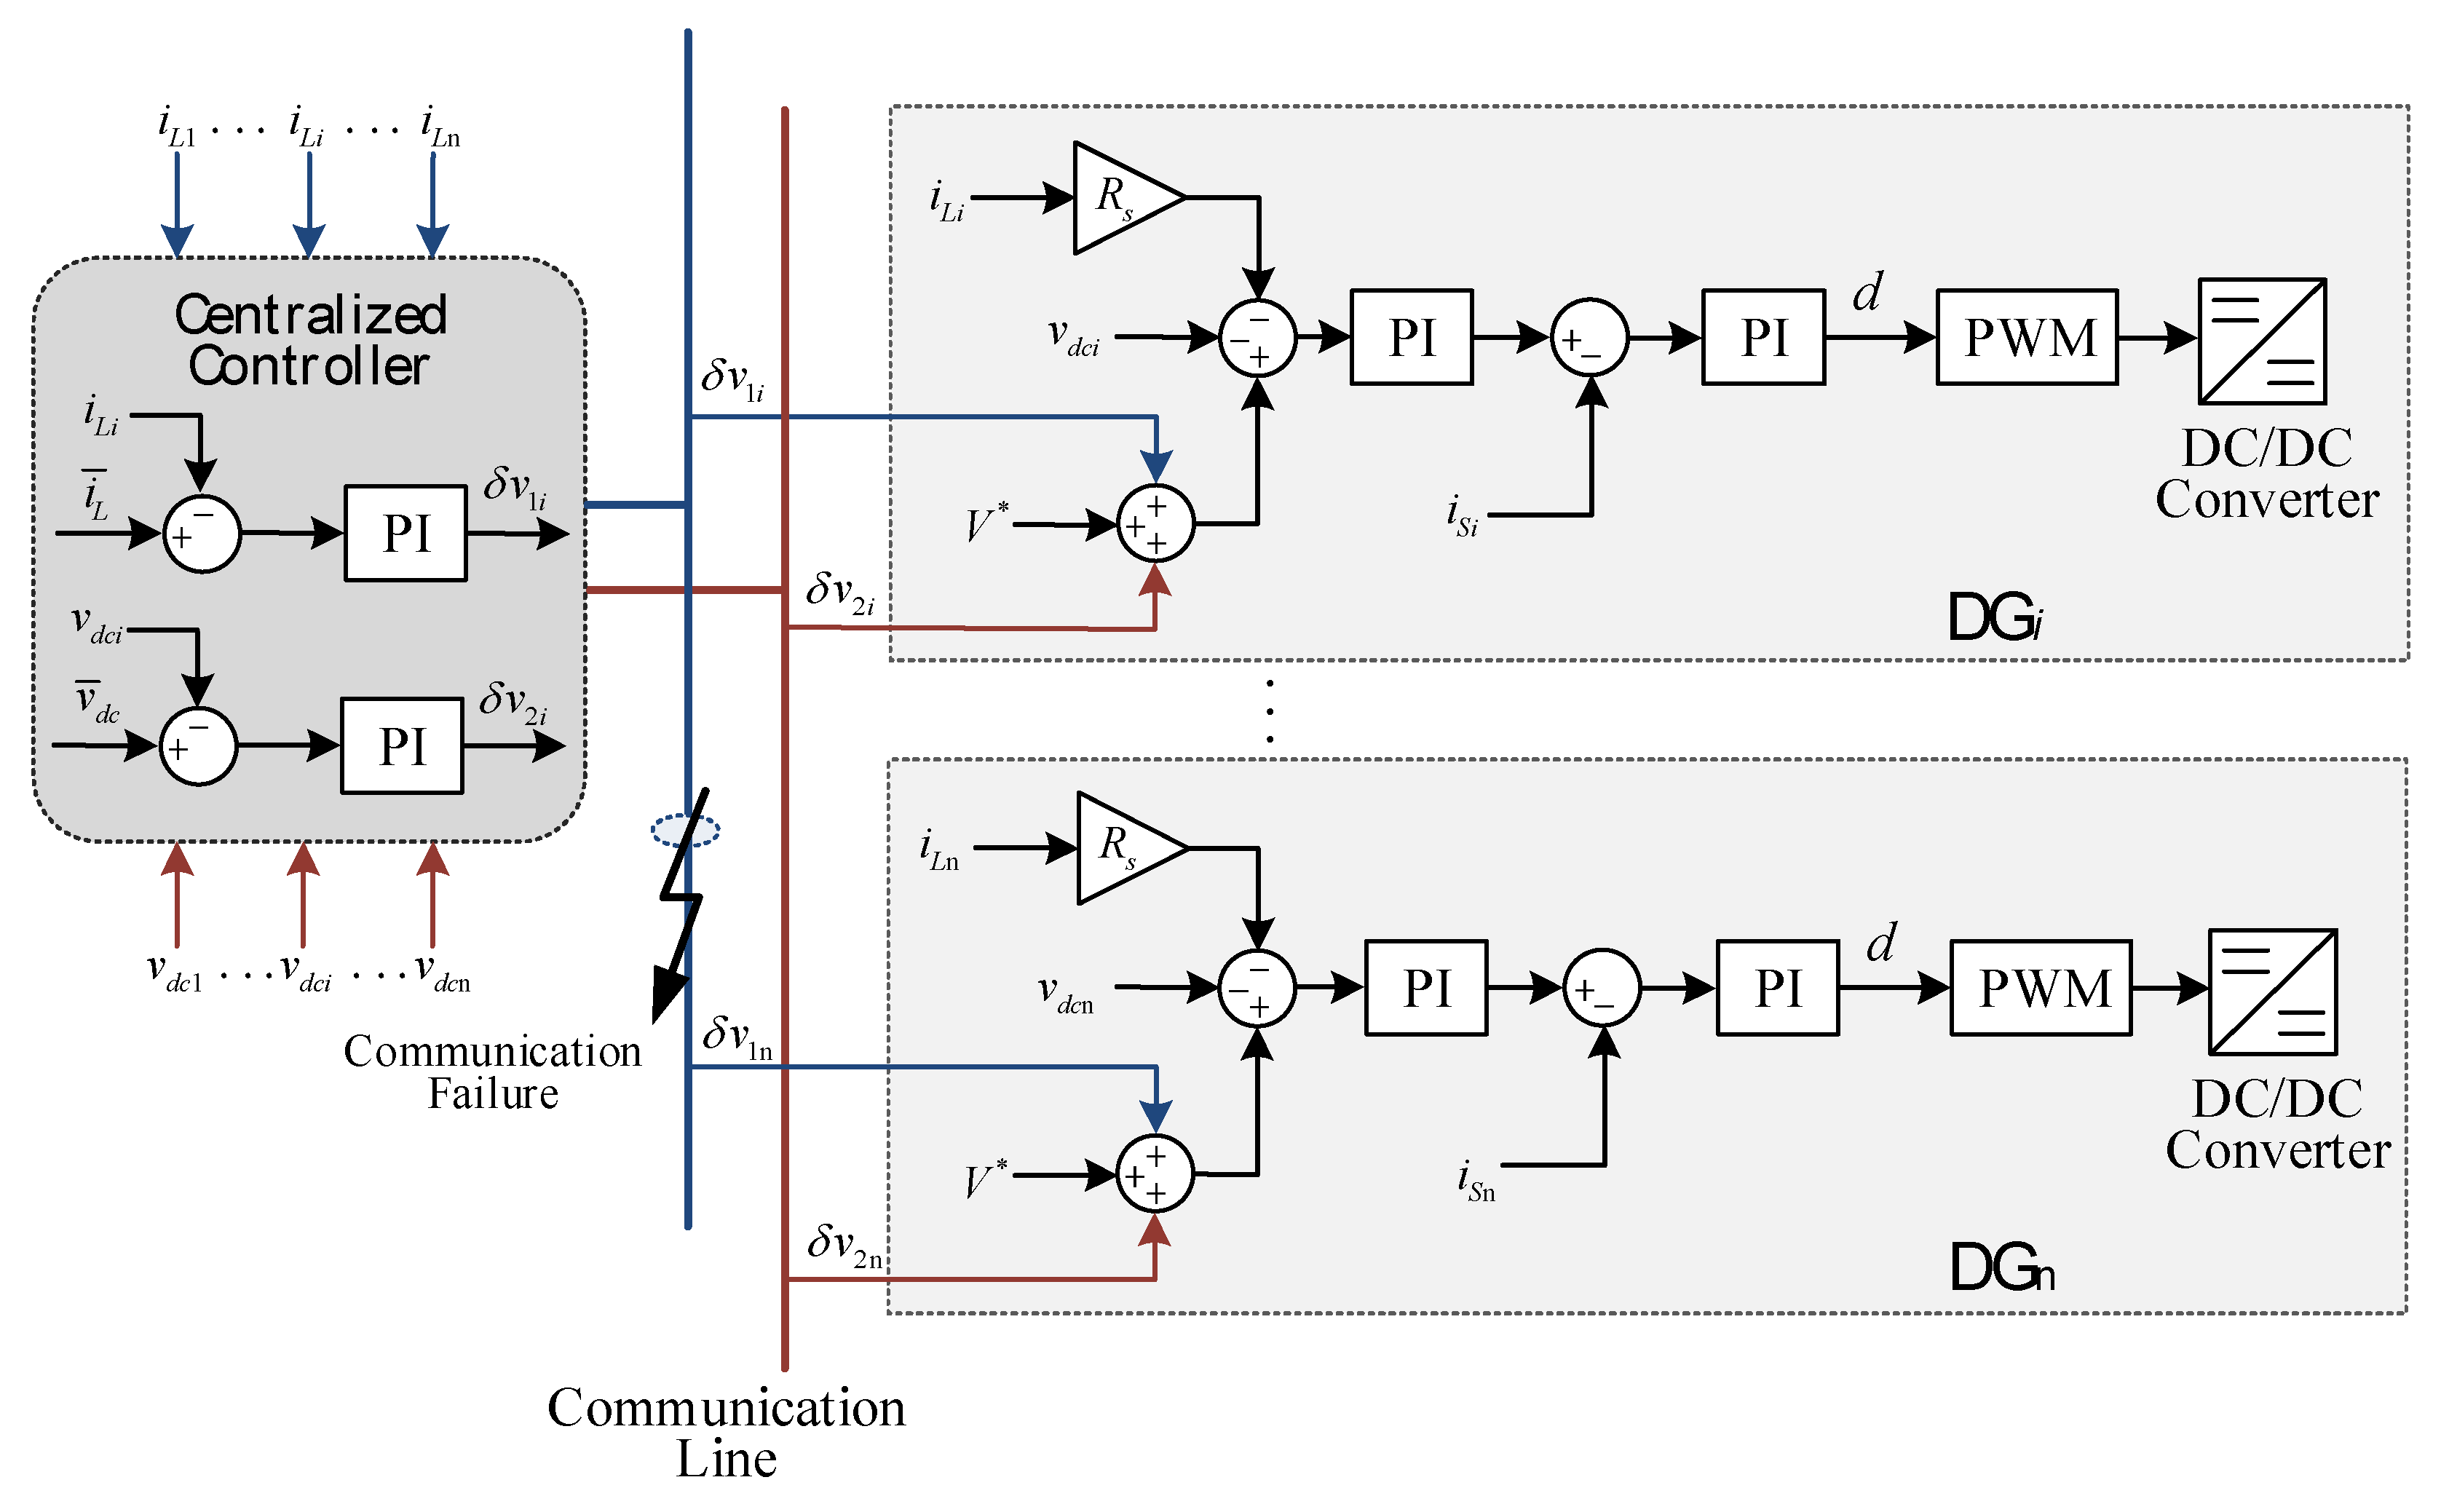
Primary control is in charge of voltage regulation as well as power sharing. In the proposed system, droop control and proportional integral control are used. The proposed primary control combined PI controller [15] and droop controller [6]:
d = ( K i c s + K p c ) × ( i r e f i S i )
i r e f = ( K i v s + K p v ) × ( V * + δ v 1 + δ v 2 v d c i R s i L i )
where d is the duty ratio of the PWM control. K i c and K p c are the parameter of the current PI controller. s is the Laplacian operator. i r e f is the reference of current, which is given by the output of the voltage-control loop. K i v and K p v are the parameter of the voltage PI controller. δ V 1 and δ V 2 are the voltage deviation generated by secondary controller. The structure of the primary control in the proposed system is shown in Figure 3.
Centralized control aims at improve the power sharing performance based on primary control. In the centralized control, all of the local controllers are submitted to a main controller. The outer microgrid central controller (MGCC) monitors the DC bus voltage and compares it with a reference value. A proportional–integral (PI) controller within the MGCC handles the voltage deviation between the reference and the actual value, and its output is transmitted to the local controller of each converter through a communication network. Consequently, each converter can adjust its output voltage reference in the local controller to mitigate the DC bus voltage deviation detected by the central controller. In this way, all of the buses can receive the global information of the system, and thus the goal of power sharing as well as voltage control can be achieved accurately.
The structure of the centralized control strategy in the proposed system is shown in Figure 3. PI controllers are used in both voltage regulation and power sharing [8]:
δ v 1 = ( K i s c s + K p s c ) × ( i ¯ L i L i )
δ v 2 = ( K i s v s + K p s v ) × ( v ¯ d c V * )
i ¯ L = 1 n i = 1 n i L i
v ¯ d c = 1 n i = 1 n v d c i
where δ V 1 and δ V 1 are voltage deviations generated by current sharing and voltage regulation, and they are directly output to the primary control. K i s c , K p s c , K i s v , and K p s v are the parameters of current loop and voltage loop of PI controllers. i L i and v d c i are the output current and voltage of DGi. n is the number of DGs in the microgrid.
However, compared with droop control, centralized control exhibits slower response speed and inferior robustness under contingencies such as communication topology changes or abrupt communication fault. Its control performance is highly susceptible to communication latency and quality, while also being more vulnerable to systemic collapse due to single-point failures. Therefore, a hierarchical control scheme is proposed to ensure the control effect under faults in the following section.

3. Operation-Condition-Adaptive Hierarchical Control

The centralized control has better performance in transient overshoot, converge speed, and steady-state error, but it is fragile under single point fault. Therefore, to enhance the stability of system while ensuring its control effect and efficiency, a hierarchical control scheme is proposed. In the proposed scheme, both centralized and distributed method are used. Centralized and distributed algorithms share the same underlying hardware infrastructure but execute distinct control laws. Generally, the system works under centralized control in order to achieve high power quality. However, when a fault occurs in the communication bus of the microgrid, the control system will detect the fault and switch to distributed control automatically to sustain the stability of the system. In practical operation, centralized control offers superior voltage and current regulation, with steady-state errors typically lower than those of distributed control under normal operating conditions. Therefore, following fault recovery, the system should switch back to centralized control to ensure effective voltage and current regulation during long-term operation.
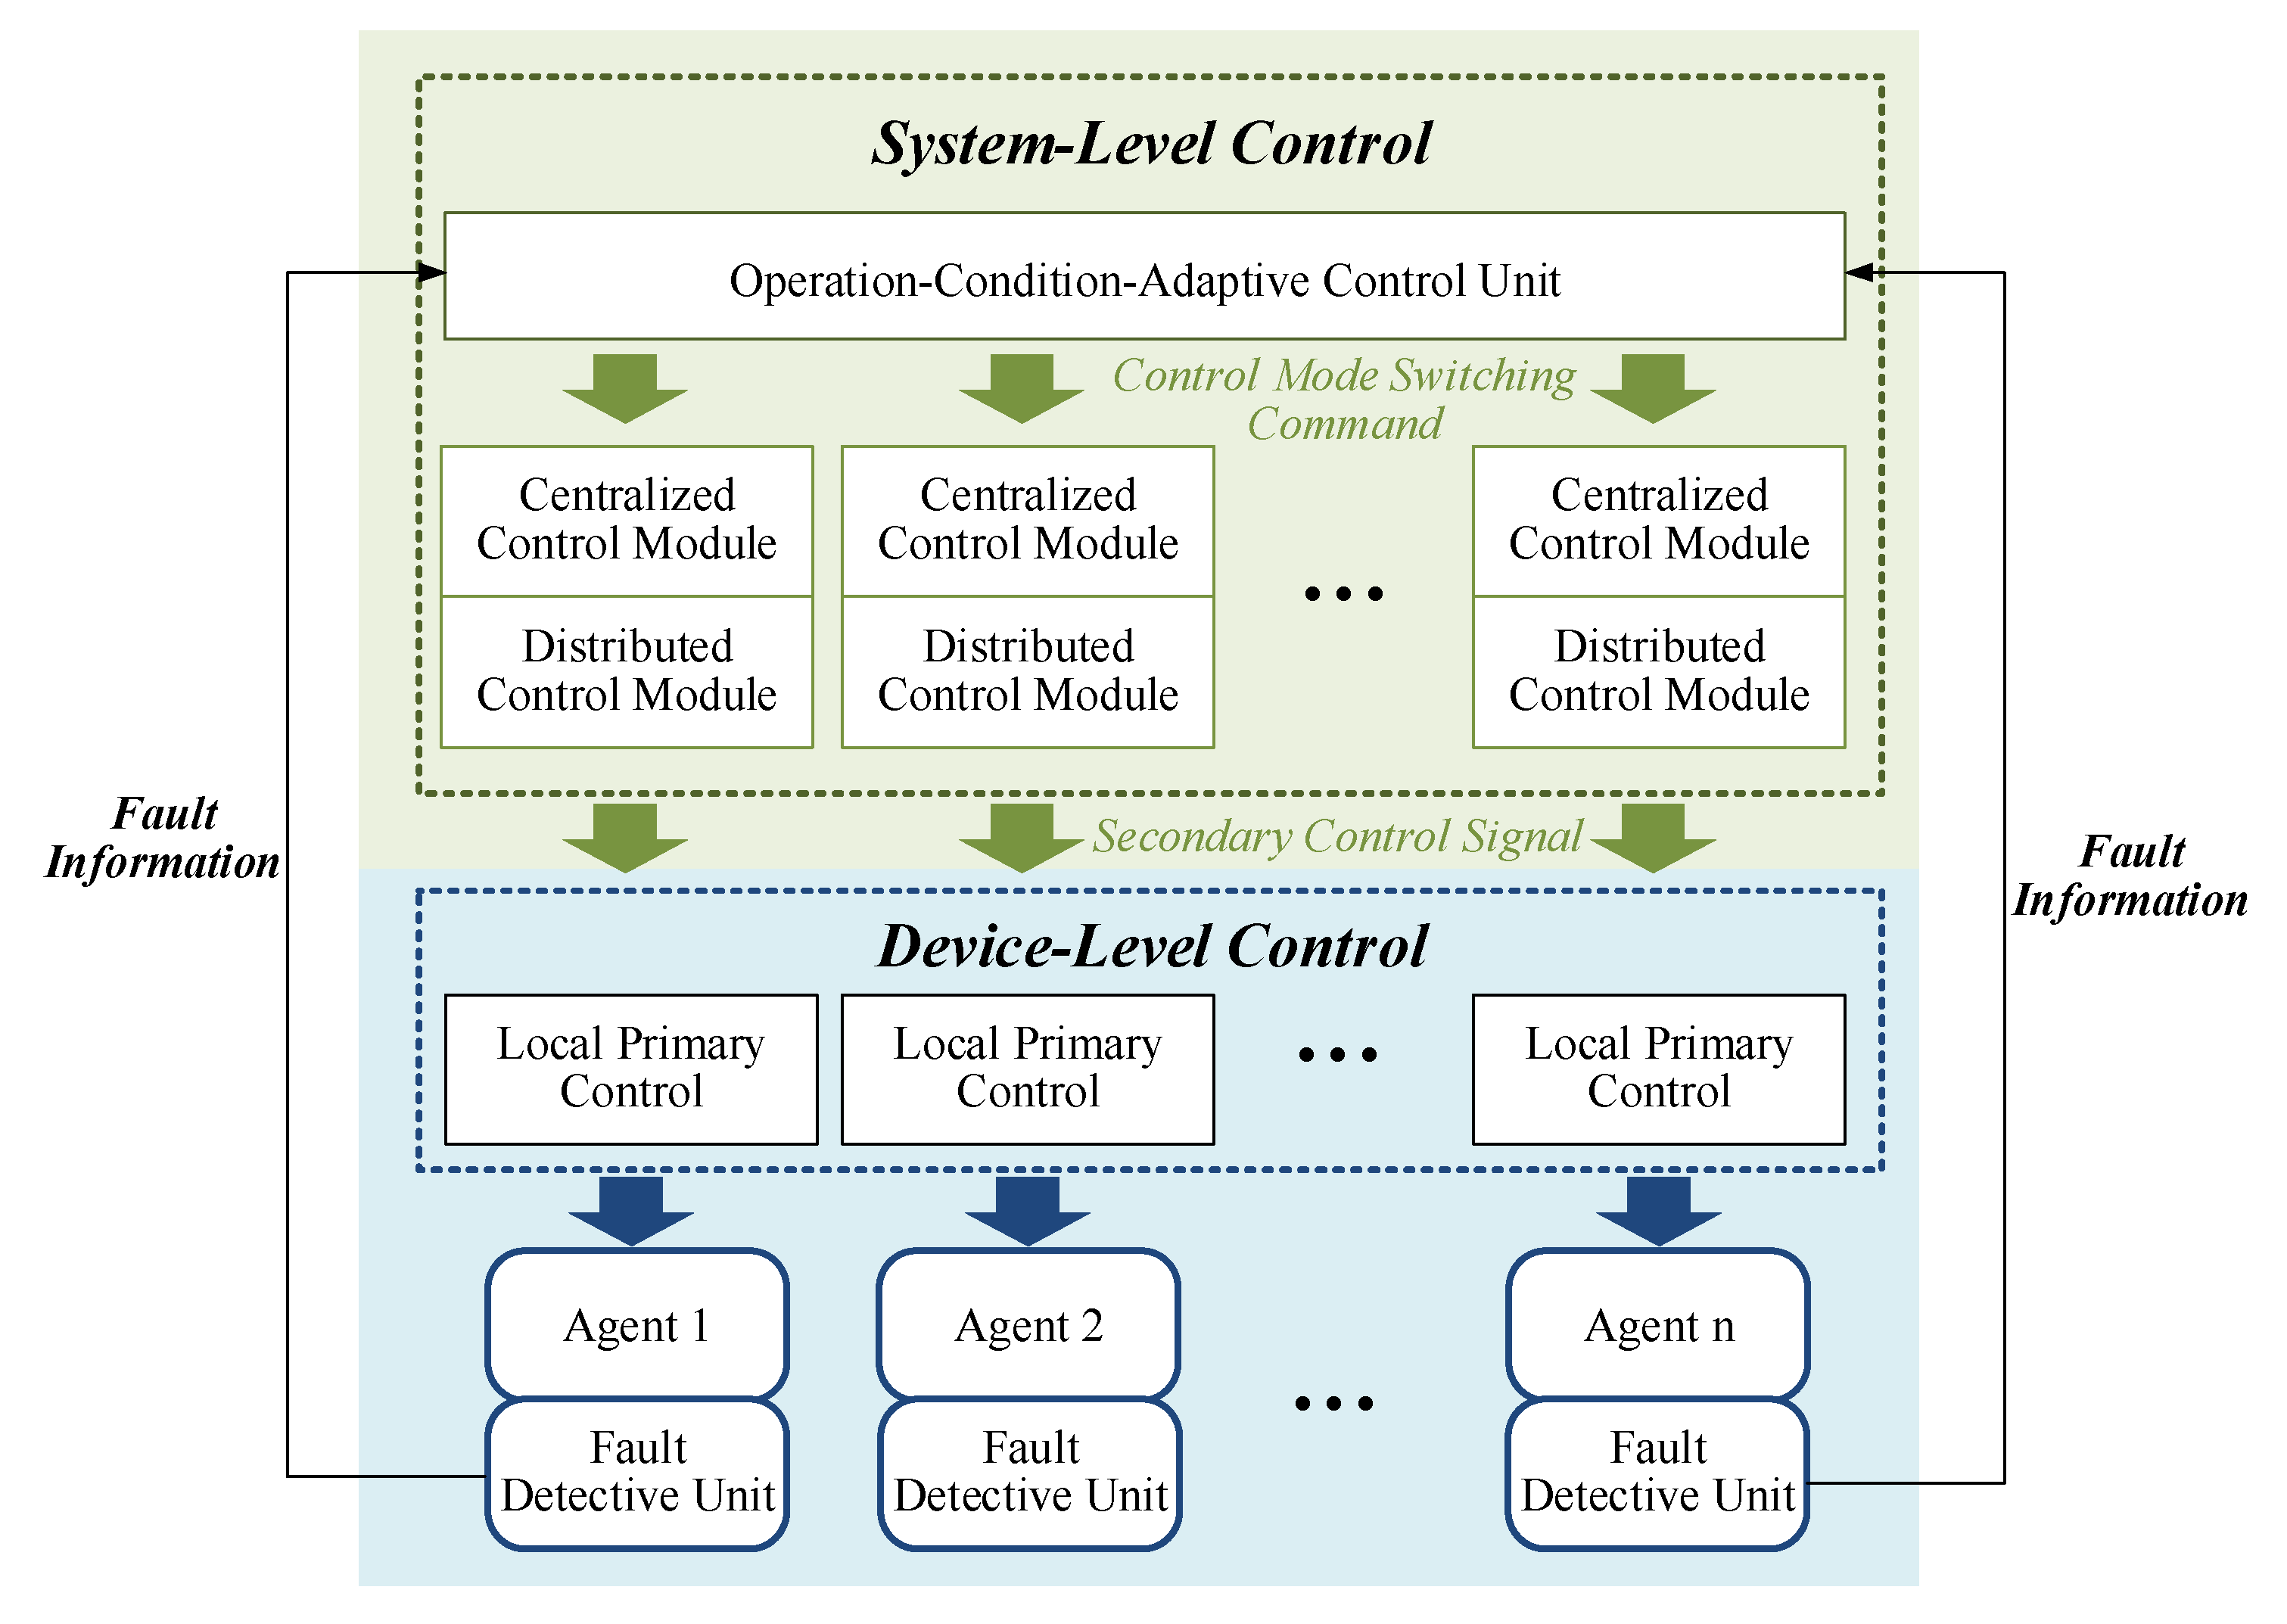
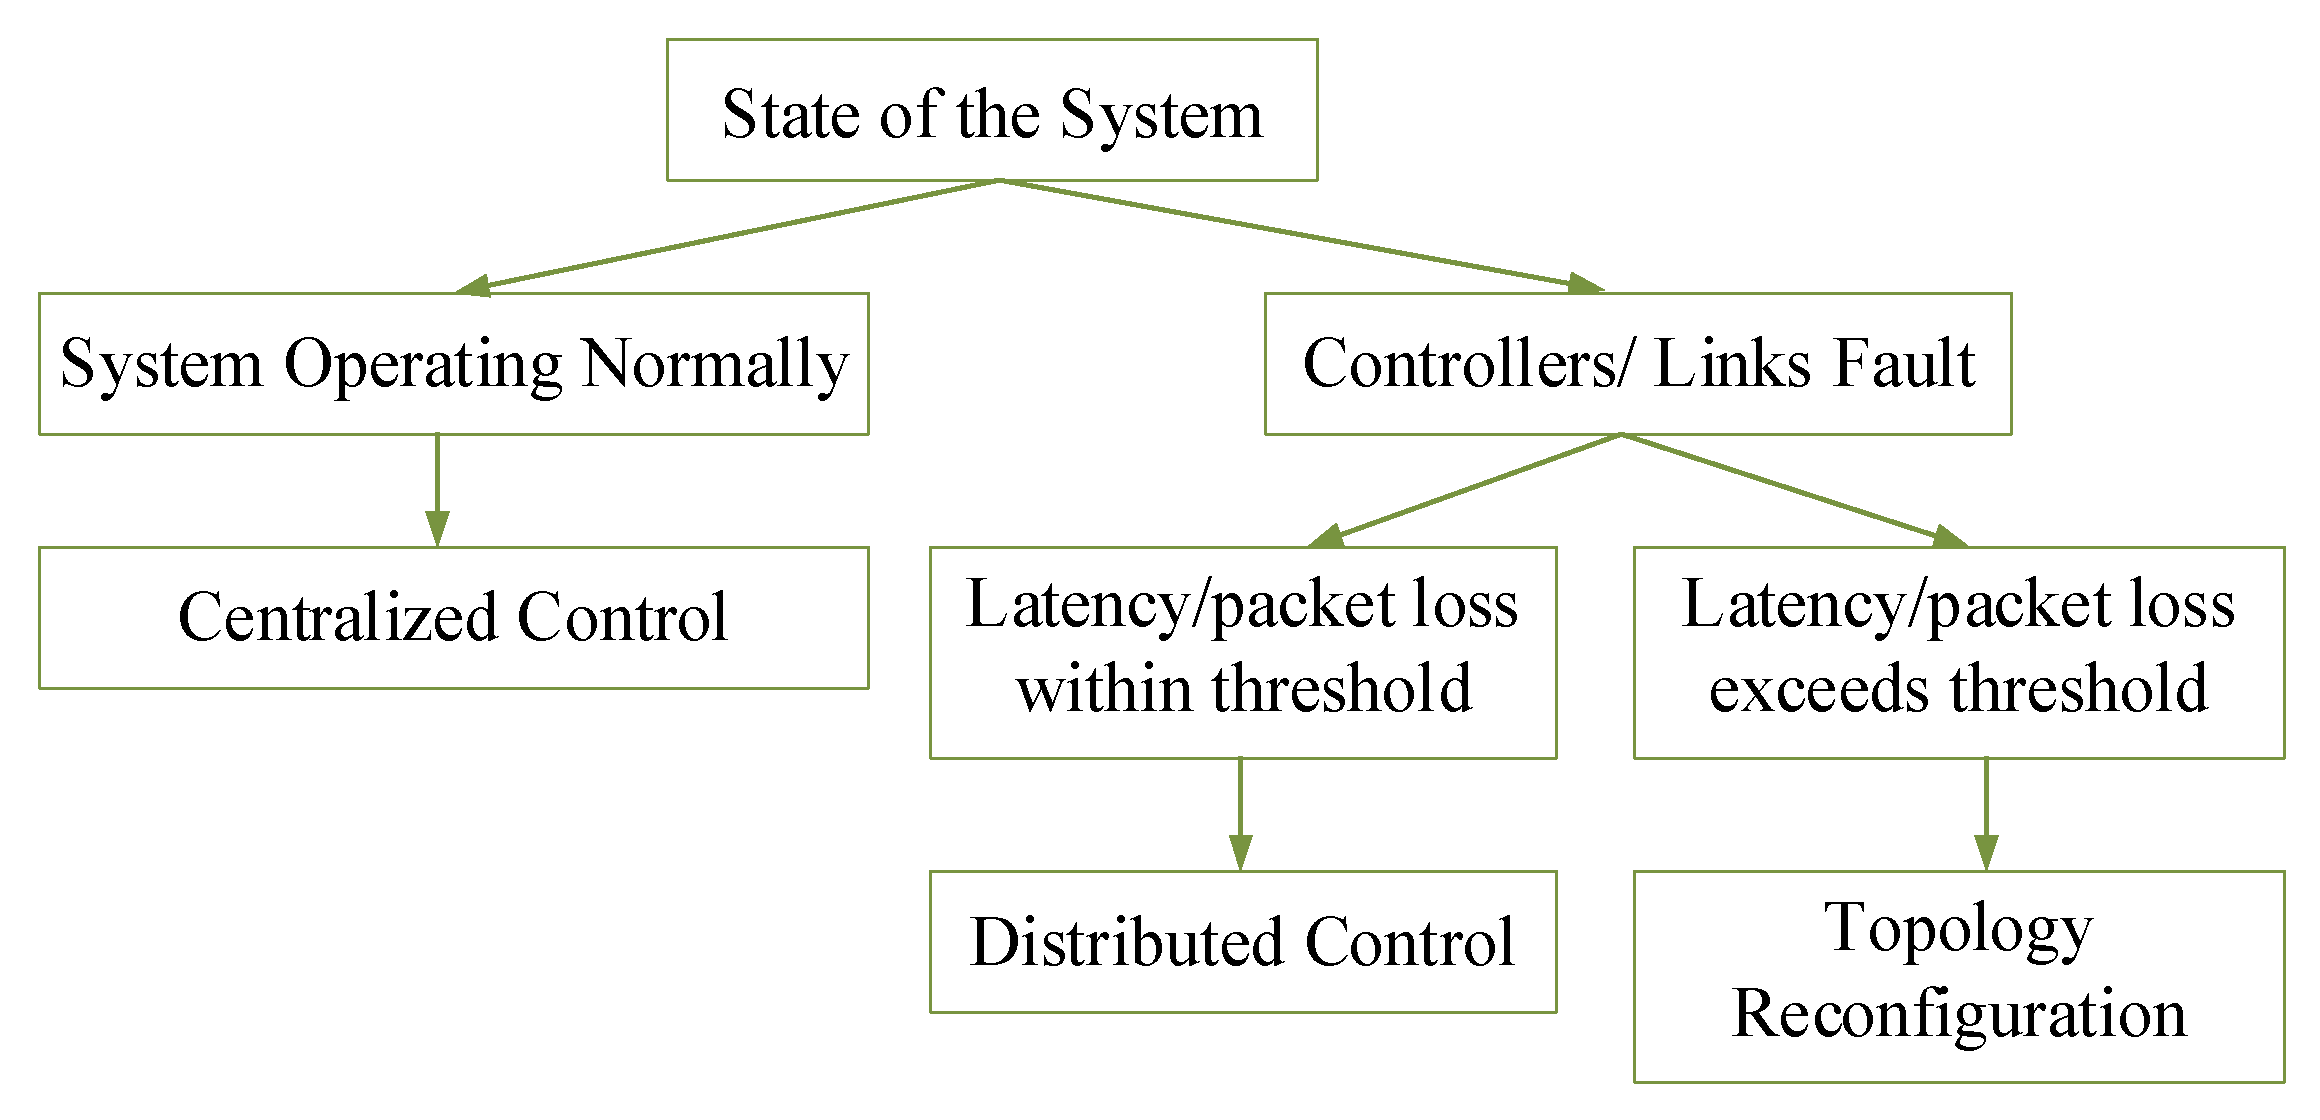
The main structure of the proposed OCAHC strategy is shown in Figure 4. The control system includes centralized controller and local controllers. The centralized controller includes a controller module and a control-mode-setting module, which are used to achieve centralized control and the operation-condition-adaptive function separately. Each local controller consists of fault-detect module, dynamic consensus module and primary control module, which are used to detect the fault of communication network, apply the distributed control based on consensus algorithm and perform primary control. Both centralized and distributed control are secondary control, which are based on primary control and share the same primary control module in the proposed system. The control logic of the OCAHC framework is illustrated by a decision tree, as shown in Figure 5.
The structure of the operation-condition-adaptive strategy is shown in Figure 6. Where U i j and I i j is the voltage and current of agent i ’s neighbor. N M i is the number of agent i ‘s neighbors. a is a threshold close to 0, considering the minor detect and control error. If the condition δ v 1 < a is meet, it means that the input signal is zero, which may imply that the receiver i has failed. b and c are the current and voltage thresholds. If the condition U i U i j b is met, it means that the voltage of agent i is remarkably different from one of its neighbor agent j . If the both the two conditions above are meet, it shows that although the system fails to maintain the voltage, there is no deviation command given to agent i . In this situation, it can be determined that the component i is faulty, and the system should switch to distributed control. In the simulations, the fault detection thresholds are introduced to prevent spurious triggering caused by measurement noise. In practical applications, the thresholds are typically set to 2 to 3 times the maximum RMS measurement noise, with default values in the range of 0.05–0.1 p.u.

4. Distributed Control Strategy

4.1. Graph Theory

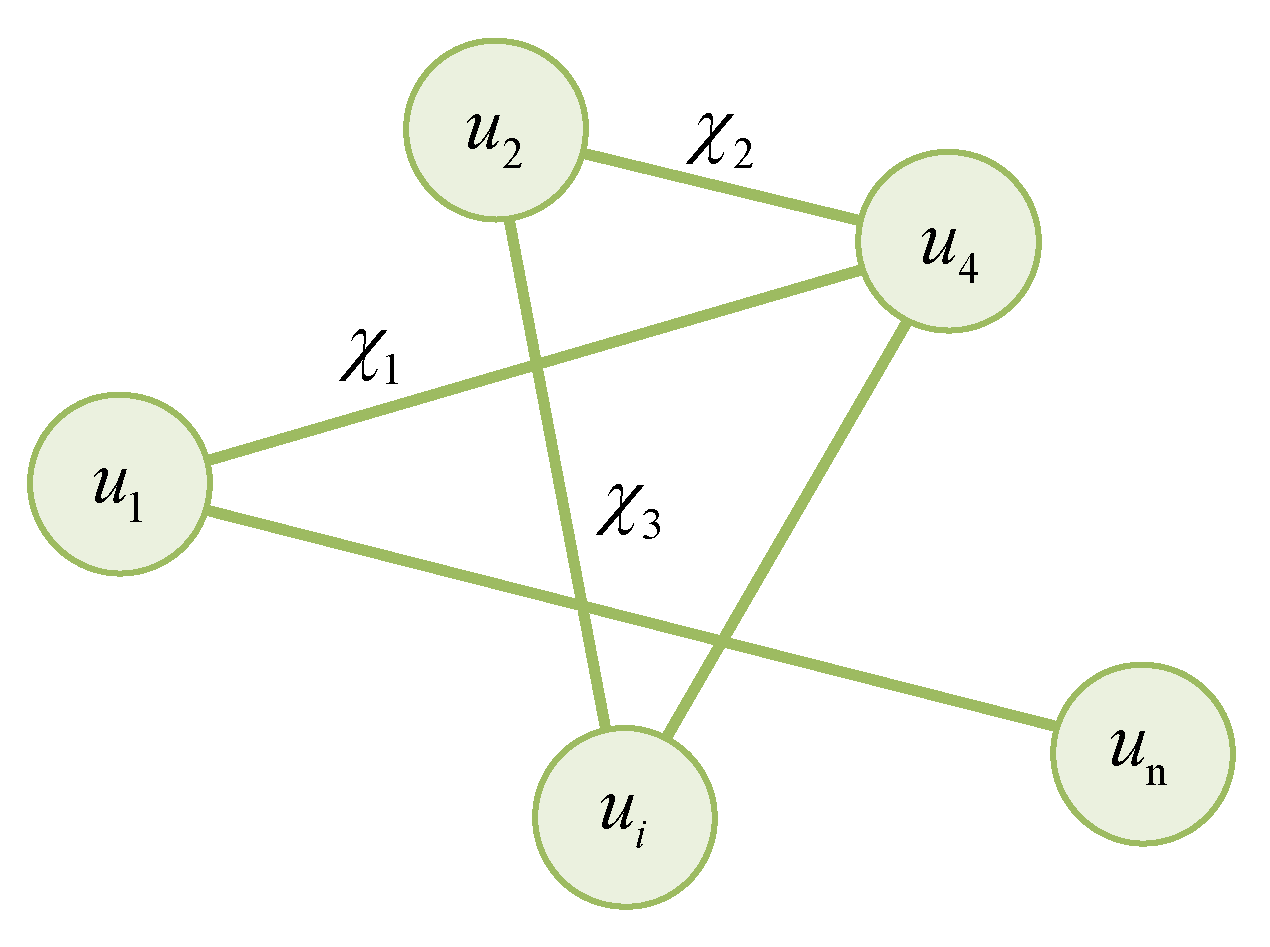
We consider a undirected graph G = ( U , E ) to describe the communication topology of the DC microgrids. U = { u 1 , u 2 , , u n } is the vertex set, in which each node represents a distributed agent. E = { χ 1 , χ 2 , , χ k } is the edge set, which reveals the communication link between different agents. As shown in Figure 7, χ 1 denotes that agent u 1 and agent u 4 are neighbors, and the two agents will share the voltage and current information under the distributed control mode [16]. Describe the adjacency matrix as A = [ a i j ] , with the matrix elements calculated by the following rule: If u i and u j are neighbors, a i j = a j i = 1 . Otherwise, a i j = a j i = 0 .
Define the Laplacian matrix as L , which can be written as [9]:
L = j M 1 a 1 j a 1 n a 1 n j M n a n j
where M 1 , …, M n denote the set of neighbors of agent 1, …, n.
Consider λ i as the i-th smallest eigenvalue of matrix ( 1 i n ). λ 2 is the Fiedler eigenvalue, which is also called algebraic connectivity, quantitatively reflecting the connectivity of the graph. λ n is the spectral radius of L , which reveals the stability of the graph.

4.2. Control Strategy Design

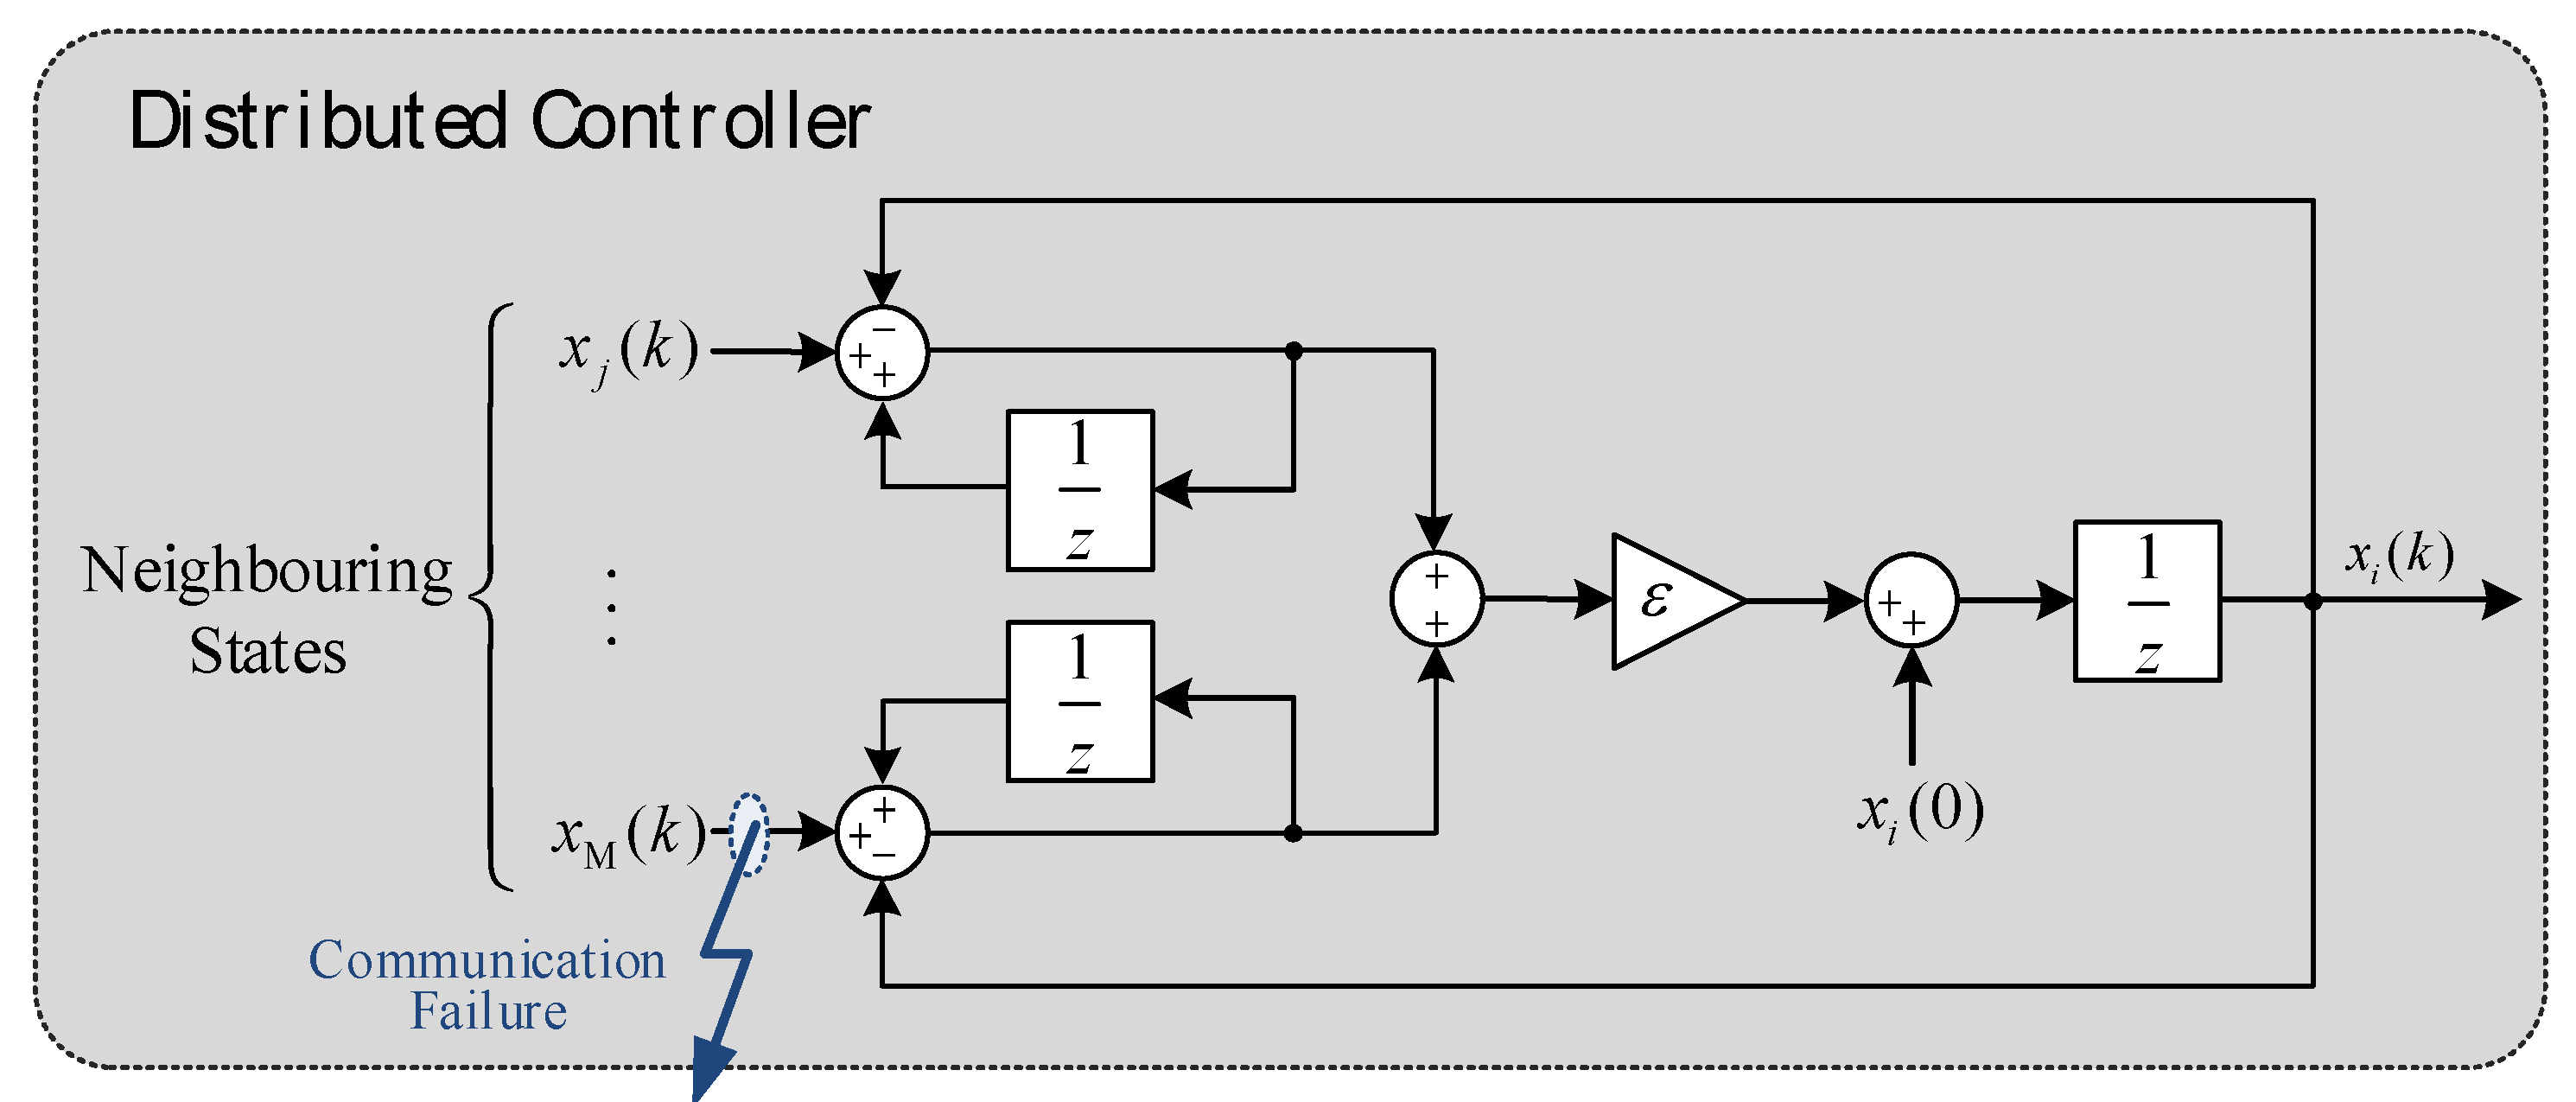
Distributed control aims to improve power-sharing performance under communication faults. The structure of the distributed control strategy based on dynamic consensus algorithm is shown in Figure 8. The main purpose of the dynamic consensus algorithm is managing a set of agents to reach an agreement, which specifically in this case, is to control the [voltage, current] vector of all of the agents to achieve consensus. The basic principle of the dynamic consensus algorithm can be described as following equations [11], in which (16) is the continuous form and (17) is the discrete one.
x ˙ i ( t ) = j M i a i j ( x j ( t ) x i ( t ) )
x i ( k + 1 ) = x i ( k ) + ε j M i a i j ( x j ( k ) x i ( k ) )
where x i ( k ) = [ v ¯ d c i , i ¯ L i ] is the state variable of the agent i , which denotes the reference voltage and current at time k .
The discrete form of consensus algorithm applied in the system can be described as follow [11]:
x i ( k + 1 ) = x i ( 0 ) + ε j M i δ i j ( k + 1 )
δ i j ( k + 1 ) = δ i j ( k ) + a i j ( x j ( k ) x i ( k ) )
where δ i j ( k ) works as a storage of the cumulative difference between agent i and agent j . In the simulations, δ i j ( 0 ) = 0 was adopted as the default setting. For practical applications, saturation or leakage techniques can be employed to prevent numerical divergence. Since no accumulator explosion was observed in our simulations, no additional anti-drift mechanism was explicitly introduced in this study.
Different from the centralized algorithm, the consensus algorithm is based on communication between neighbor agents. For each agent in the system, the state variables of its neighbors x j ( k ) ,   ,   x l ( k ) ( j , , l M i ) work as input of the local distributed controller. By applying the consensus algorithm, the distributed controllers then generate the instructions x i ( k ) for local primary control. As shown in Figure 8, we assume that a communication fault occurs between agent and agent N M i , and it is obvious that agent i can still receive information from N M i 1 agents. In this scenario, although communication failures may affect the convergence speed of the algorithm to some extent, they will not lead to control failure with appropriate communication topology design. The consensus-algorithm-based control system exhibits strong robustness under faults. Since both the control performance and convergence speed are closely related to the communication topology, this paper will provide a detailed introduction to the planning method of communication topology in the next section.

4.3. Communication Topology Optimization

The communication topology significantly impacts the effectiveness of distributed control. In this section, a communication topology planning model to minimize the communication costs is established. The model considers constraints such as communication intensity, algorithm convergence under normal operating conditions and N-1 fault scenarios, and control performance. The planning objective is to seek the topology with the lowest possible communication costs, while also calculating the parameter values that result in the optimal control performance.

4.3.1. Objective Function

For the topology planning model, the decision variables are the interconnecting link relationship of local controllers, corresponding to the linkage status of branches between every two nodes in the graph. In the proposed model, binary decision variables e i j { 0 , 1 } determine if branch ( i , j ) is activated. The optimization objective of the model is to minimize the cost of the communication system. In this work, we adopt the classical LEACH energy consumption model proposed by Heinzelman et al. [17]. As shown in (20), not only the energy consumption cost of the communication system but also its hardware and maintenance costs are considered. C s y s is the total cost of ownership for the system, and C h w , C m t , C r e represent the hardware cost, maintenance cost, and hardware redundancy cost. The final term in (20) represents the energy consumption cost of the communication system over its entire operational lifecycle, while the engineering significance of (21) is the system’s communication energy consumption per second. For a system of a given node scale, the costs associated with various hardware modules and their maintenance are deterministic. It follows that the minimization of the total cost of ownership is functionally equivalent to minimizing the energy consumption cost of the communication system. On this basis, (21) is defined as the objective function.
C s y s = C h w + C m t + C r e + C e l e c T l i f e T C A i = 1 n j = 1 , j i n e i j ( E T x , i j + E R x , j + E d e , j )
min f = 1 T C A i = 1 n j = 1 , j i n e i j ( E T x , i j + E R x , j + E d e , j )
C h w = C c t r + C s w + C g w + n × C n d + C f d + C s + 1.1 × C c a × L s u m + 2 n × C t m
C m t = m r a C h w
C r e = m r e C h w
E T x , i j = E T x , i j e l e c + E T x , i j m p = E T x , i p u l + ε f s D i j 2 l , D i j < D 0 E T x , i p u l + ε m p D i j 4 l , D i j D 0
E R x , j = E R x , j p u l
E d e , j = E d e , j p u l
D 0 = ε f s ε m p
where C e l e c refers to the unit electricity price, and T l i f e is the operational lifecycle of the communication system. C c t r , C s w , C g w , C f d , C s are the cost of central controller, switch, gateway, communication fault detection module, and power supply unit. C n d , C c a and C t m denote the unit cost of the wireless communication agent, optical cable line, and its terminals. L s u m is the total length of the optical cable line. m r a and m r e denote the hardware maintenance rate and the redundancy rate, respectively. E T x , i j represents the energy consumption generated when controller i sends data to controller j . E R x , j and E d e , j denote the energy consumption of controller j for receiving and processing the data. The system adopts a periodic polling communication scheme, where T C A is the sampling period. E T x , i j is calculated using the communication energy consumption model established in [15]. For transmission energy consumption, both free-space and multipath fading channel models are considered, as shown in (25). When the communication distance is below D 0 , the free-space model is applied. Otherwise, the multipath fading model is used to compute the transmission energy consumption of the transmitter i . E T x , i p u is the per-bit transmission energy consumption (in pJ / bit ) of transmitter i . l is the packet size (in bit ). D i j is the communication distance. ε f s (in pJ / bit / m 2 ) and ε m p (in pJ / bit / m 4 ) are the energy parameters for the free-space and multipath fading models, respectively. D 0 is the predefined communication distance threshold, which can be calculated by (24). For the receiver, the reception energy consumption E R x , j and processing energy consumption E d e , j are computed by (26) and (27), where E R x , j p u and E d e , j p u represent the per-bit energy consumption for data reception and processing (in pJ / bit ) at controller j , respectively.

4.3.2. Convergence Conditions

To ensure the stability of consensus algorithm, the convergence conditions must be discussed. The consensus algorithm can be written in matrix form as [9]:
x ( k + 1 ) = W x ( k )
where x ( k ) = [ x 1 ( k ) , x 2 ( k ) , , x n ( k ) ] T is the state vector. Consider ε as the constant edge weight used to tune the dynamic of the consensus algorithm, weight matrix W can be written as:
W = Ι ε L
The control algorithm converges when the following conditions are satisfied [11]:
lim k x ( k ) = lim k W k x ( 0 ) = ( 1 1 T n ) x ( 0 )
where 1 represents an all-ones vector. As derived by Lin Xiao et al., the control algorithm converges if and only if (32)–(34) are satisfied, based on which the convergence constraint of the topology is established:
1 T W = 1 T
W 1 = 1
ρ ( W 1 1 T n ) < 1
where ρ ( ) denotes the spectral radius of a matrix.

4.3.3. N-1 Resilient Topology Constraints

To ensure the stability of the system under N-1 contingency, it is essential to maintain the convergence of the algorithm under any single-link (N-1) communication failure. Building upon the constraints (32)–(34), we further verify whether the weight matrix W under N-1 conditions still satisfies (32)–(34). Considering that only four elements are modified under N-1 contingency, this paper proposes an incremental verification method for N-1 verification, eliminating the need for complete matrix recalculation. Specifically, if a communication fault occurs between controller i and j , four elements in the weight matrix W , namely W i i   W i j , W j i , and W j j , are altered. By analyzing the constraints (32) and (33) satisfied by the original W , it is noted that the sum of elements in each row and each column is equal to 1. Therefore, the satisfaction of constraints (32) and (33) is equivalent to the unity summation condition on the specified rows/columns:
W i q = 1   , q 1 , 2 , , n W j q = 1   , q 1 , 2 , , n
W q i = 1   , q 1 , 2 , , n W q j = 1   , q 1 , 2 , , n
where W i q denotes the element in the i -th row and q -th column of matrix W .
In addition, let Δ W R n × n denote the symmetric perturbation matrix induced by element-wise modifications:
W = W + Δ W
By the properties of symmetric matrices, the following triangle inequality holds:
ρ ( W 1 1 T n + Δ W ) ρ ( W 1 1 T n ) + ρ ( Δ W )
Based on the above, we first verify whether constraint (39) is satisfied:
ρ ( Δ W ) 1 ρ ( W 1 1 T n )
where Δ W is a sparse perturbation matrix with only 4 non-zero elements. For high-dimensional networks, constraint (39) reduces the eigenvalue computation of the dense matrix ( W 1 1 T / n ) to that of a sparse matrix Δ W , significantly cutting computational costs.
Constraint (39) is a sufficient but non-necessary condition for constraint (40). During optimization, we first check constraint (39). If satisfied, constraint (40) is automatically met; otherwise, explicit validation of constraint (40) is required:
ρ ( W 1 1 T n + Δ W ) < 1
For convergence verification, conditions (35), (36), and (40) constitute the necessary and sufficient criteria for system stability under N-1 contingencies, whereas condition (39) is a sufficient but not necessary condition implied by (40). Given that ρ ( W 1 1 T / n ) has already been computed in the algorithm and that Δ W is a symmetric sparse matrix with only four nonzero elements, the evaluation of condition (39) incurs a computational cost of O ( k c a ) , where k c a denotes the number of iterations and typically satisfies k c a n in such sparse cases. In contrast, verifying condition (40) requires eigenvalue computation of the n -dimensional matrix W , with a complexity of O ( k c a n 2 ) , which is substantially higher than that of (39). Therefore, for each N-1 contingency topology, constraints (35)–(36) are verified first. If these are satisfied, condition (39) is subsequently checked. If the matrix also satisfies (39), the N-1 topology is deemed convergent; otherwise, condition (40) is explicitly verified to ensure that no feasible solution is incorrectly excluded. This hierarchical strategy, which combines fast screening with exact verification, substantially reduces the computational burden by minimizing spectral radius evaluations.

4.3.4. Control Performance Constraints

According to the derivation by Lin Xiao et al. [18], the fastest converge speed is obtained when ε is assigned values according to the following principles:
ε = 2 λ n ( L ) + λ 2 ( L )
The derivation in reference [18] reveals that the spectral radius of matrix ( W 1 1 T / n ) can also characterize the convergence rate of the algorithm:
r a s y m ( W ) = sup x ( 0 ) x ¯ lim t x ( t ) x ¯ 2 x ( 0 ) x ¯ 2 1 t = ρ ( W 1 1 T n )
τ a s y m = 1 lg ( r a s y m )
where r a s y m is defined as asymptotic convergence factor, and τ a s y m represents the number of steps to achieve convergence. Based on the derivation above, the convergence time constraint is established as:
T C A lg ( ρ ( W 1 1 T n ) + ε c a ) T con
where T con is the convergence time threshold. Let ε c a be a sufficiently small positive number. Since the spectral radius of the fully connected matrix ρ ( W 1 1 T / n ) is zero, parameter ε c a needs to be properly set to ensure correct computation of the communication delay constraints.

4.3.5. Communication Link Reliability Constraint

Communication quality is measured by the channel gain between any two controllers. Considering large-scale fading in wireless channels caused by changes in the distance of communication links, the communication link reliability constraint is as follow [19]:
β z 10 α z lg ( D i j D r e f ) + η z g min M 1 e i j
where β z represents the logarithm of the average channel gain at the reference point D r e f . α z is the path loss exponent, and η z represents the shadowing component, which is a random variable following a Gaussian distribution N ( 0 , σ z 2 ) . g min is the channel gain threshold. Communication distances that do not meet this constraint will result in increased packet loss rates, excessive communication delays, and other related issues. Since the formulation involves random variables, it is difficult to determine a tight lower bound. Therefore, a sufficiently large constant M is adopted in this work, with e i j serving as an indicator variable. Specifically, when the link e i j = 1 , the constraint is activated.

4.3.6. Efficient Solving Strategy for Planning Models

The graph should also satisfy some basic constraints including topological connectivity constraint and node-degree constraint:
λ 2 > 0
L i i 2 , i = 1 , 2 , , n
Actually, the constraint established in this section serves as a necessary but not sufficient condition for the constraints in Section 4.3.2, Section 4.3.3, Section 4.3.4 and Section 4.3.5, while its computational complexity is significantly lower than the matrix operations in the constraints above. Therefore, the introduction of this constraint aims to provide preliminary validation for the preceding constraints, thereby reducing the computational burden of the optimization model.
Furthermore, the most computationally intensive components of the planning model are the verification of convergence conditions and N-1 resilient topology constraints. To tackle the problem, an equivalent topology reduction strategy is proposed to enhance the computational efficiency of the model.
In graph theory, nodes are termed exchangeable if their permutation does not affect the graph’s probability distribution or topological structure [20]. Two graphs are isomorphic if their adjacency relations become identical through vertex relabeling. In the proposed system, nodes do not satisfy exchangeability due to parameter discrepancies. However, the evaluation of constraints (32)–(34) and (39) and (40) is independent of actual grid parameters. Thus, nodes can be treated as exchangeable while validating these constraints. During model solving, all topologies that have undergone convergence tests for constraints (32)–(34) and (39) and (40) are stored, and isomorphic graph recognition is employed to achieve equivalent topology reduction. This strategy replaces repeated eigenvalue computations with a lookup-table approach, significantly improving computational efficiency.
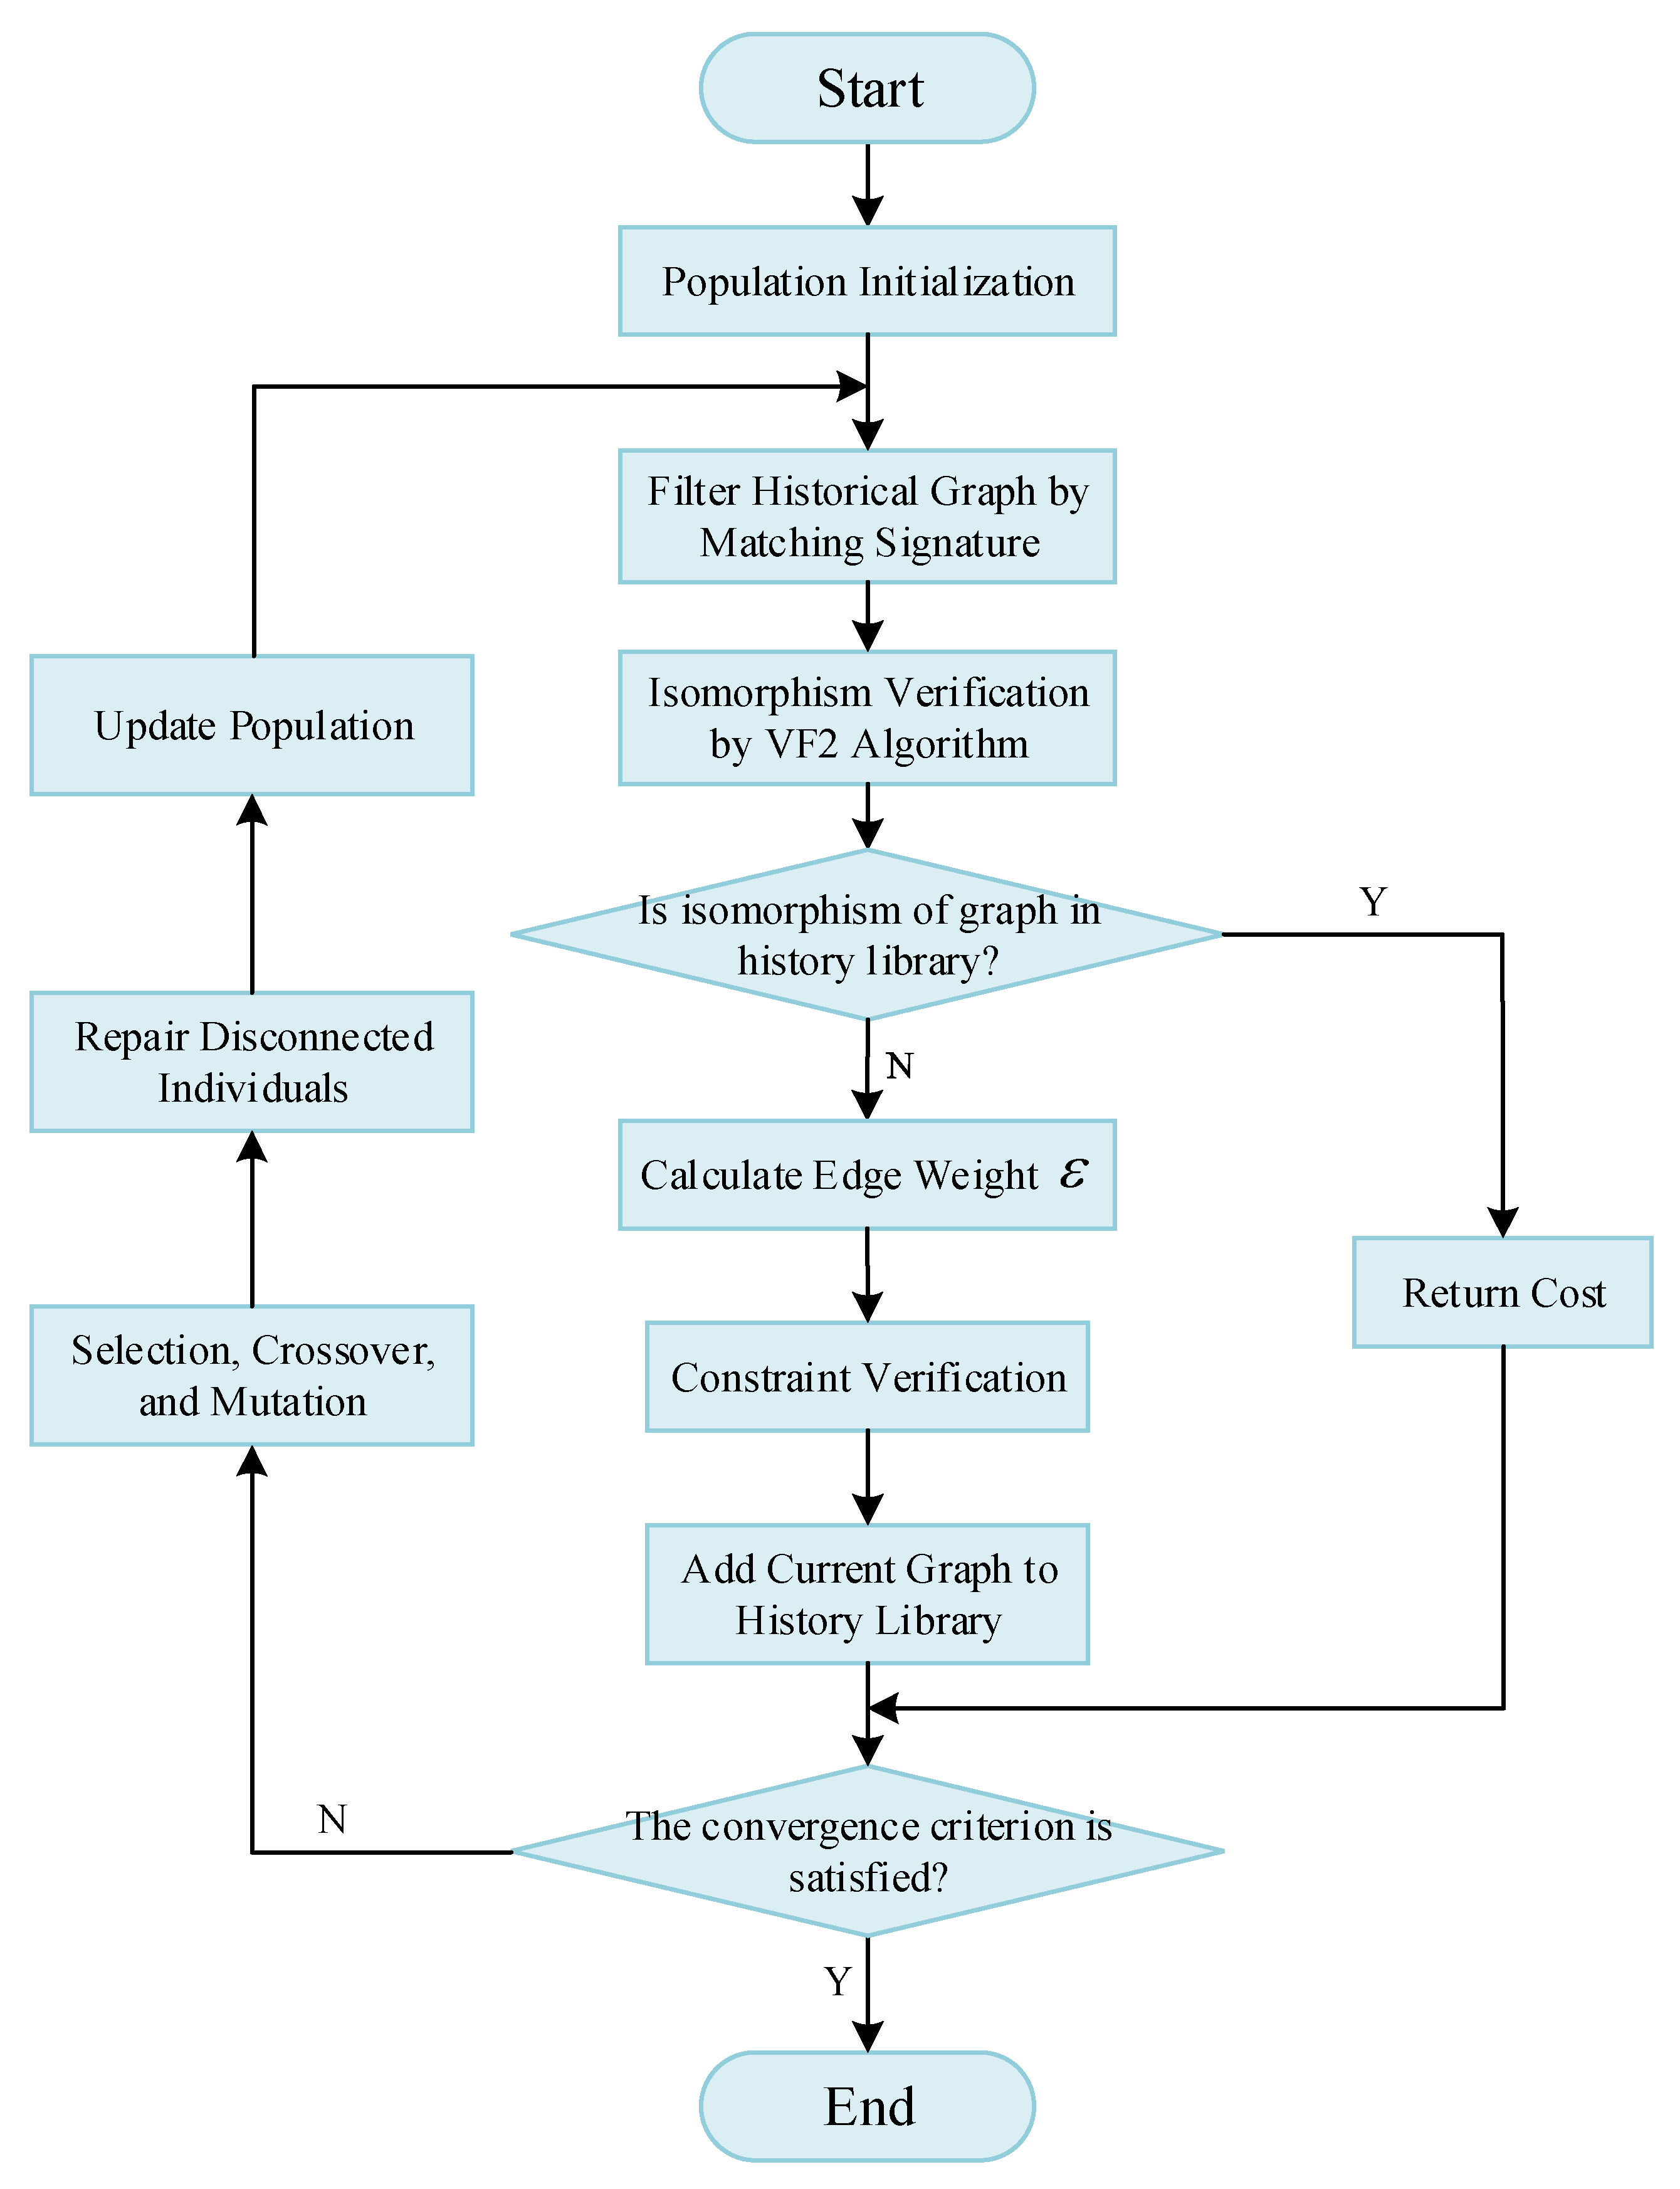
In the proposed method, genetic algorithm (GA) is employed to solve the model. The flowchart of the proposed model-solving process is shown in Figure 9. Chromosomes represent communication links between system nodes and are mapped to the upper-triangular part of the adjacency matrix, which is then symmetrized to obtain the full adjacency matrix. During population initialization, a minimum spanning tree with N-1 edges is first generated using Prim’s algorithm, after which a small number of redundant edges are added randomly to complete the individual initialization. During the optimization process, graph signatures are first generated based on node and edge features to rapidly filter historical graphs with matching characteristics, thereby reducing the search space for isomorphism checking. Subsequently, VF2 algorithm (in NetworkX) is applied for exact graph isomorphism verification. If the current graph is isomorphic to any graph in the historical library, the associated cost information is returned directly. If not, the edge weight ε corresponding to the fastest convergence rate under this topology is first computed online based on (41). The current graph is then verified against all imposed constraints. Individuals violating any constraint are assigned a large penalty, whereas those satisfying all constraints have their objective function evaluated. Subsequently, the chromosome, cost, and penalty information of the current graph are recorded in the historical graph repository. The next-generation population is then produced via selection, crossover, and mutation. A DFS algorithm is employed to verify the connectivity of individuals in the new population, and any individuals containing multiple disconnected components are repaired using a random reconnection strategy. The algorithm iterates repeatedly and is considered to have converged when no improvement is observed over G max consecutive generations.
The number of labeled and non-isomorphic graphs for systems of varying node scales are presented in Table 2 [21]. As evidenced, non-isomorphic graphs are substantially fewer than labeled graphs for a given system scale. Consequently, isomorphic graph recognition not only reduces computational complexity but also minimizes the storage footprint of tabulated information.

5. Reliability Analysis and MTBF Assessment

To quantitatively assess the reliability differences among various control strategies over long-term operation, this section employs a Monte Carlo simulation [22] approach to estimate system availability and mean time between failures (MTBF). The considered failure sources include MGCC units, the bus, communication links, as well as latency exceedance events. Each device is represented using a two-state reliability model, as illustrated in Figure 10. It is assumed that a hardware equipment can only reside in one of two states: operational or failed. Upon failure, the equipment immediately undergoes repair. Figure 10 illustrates the two-state transition diagram of the equipment, where S U denotes the operational state and S D represents the failed state. The symbol λ d e denotes the failure rate of the equipment, and μ d e denotes its repair rate [23].
For each component, both failure and repair processes are modeled by exponential distributions. Based on this modeling framework, the system availability and MTBF are then calculated as:
A = U s u m T y
M T B F = t TF
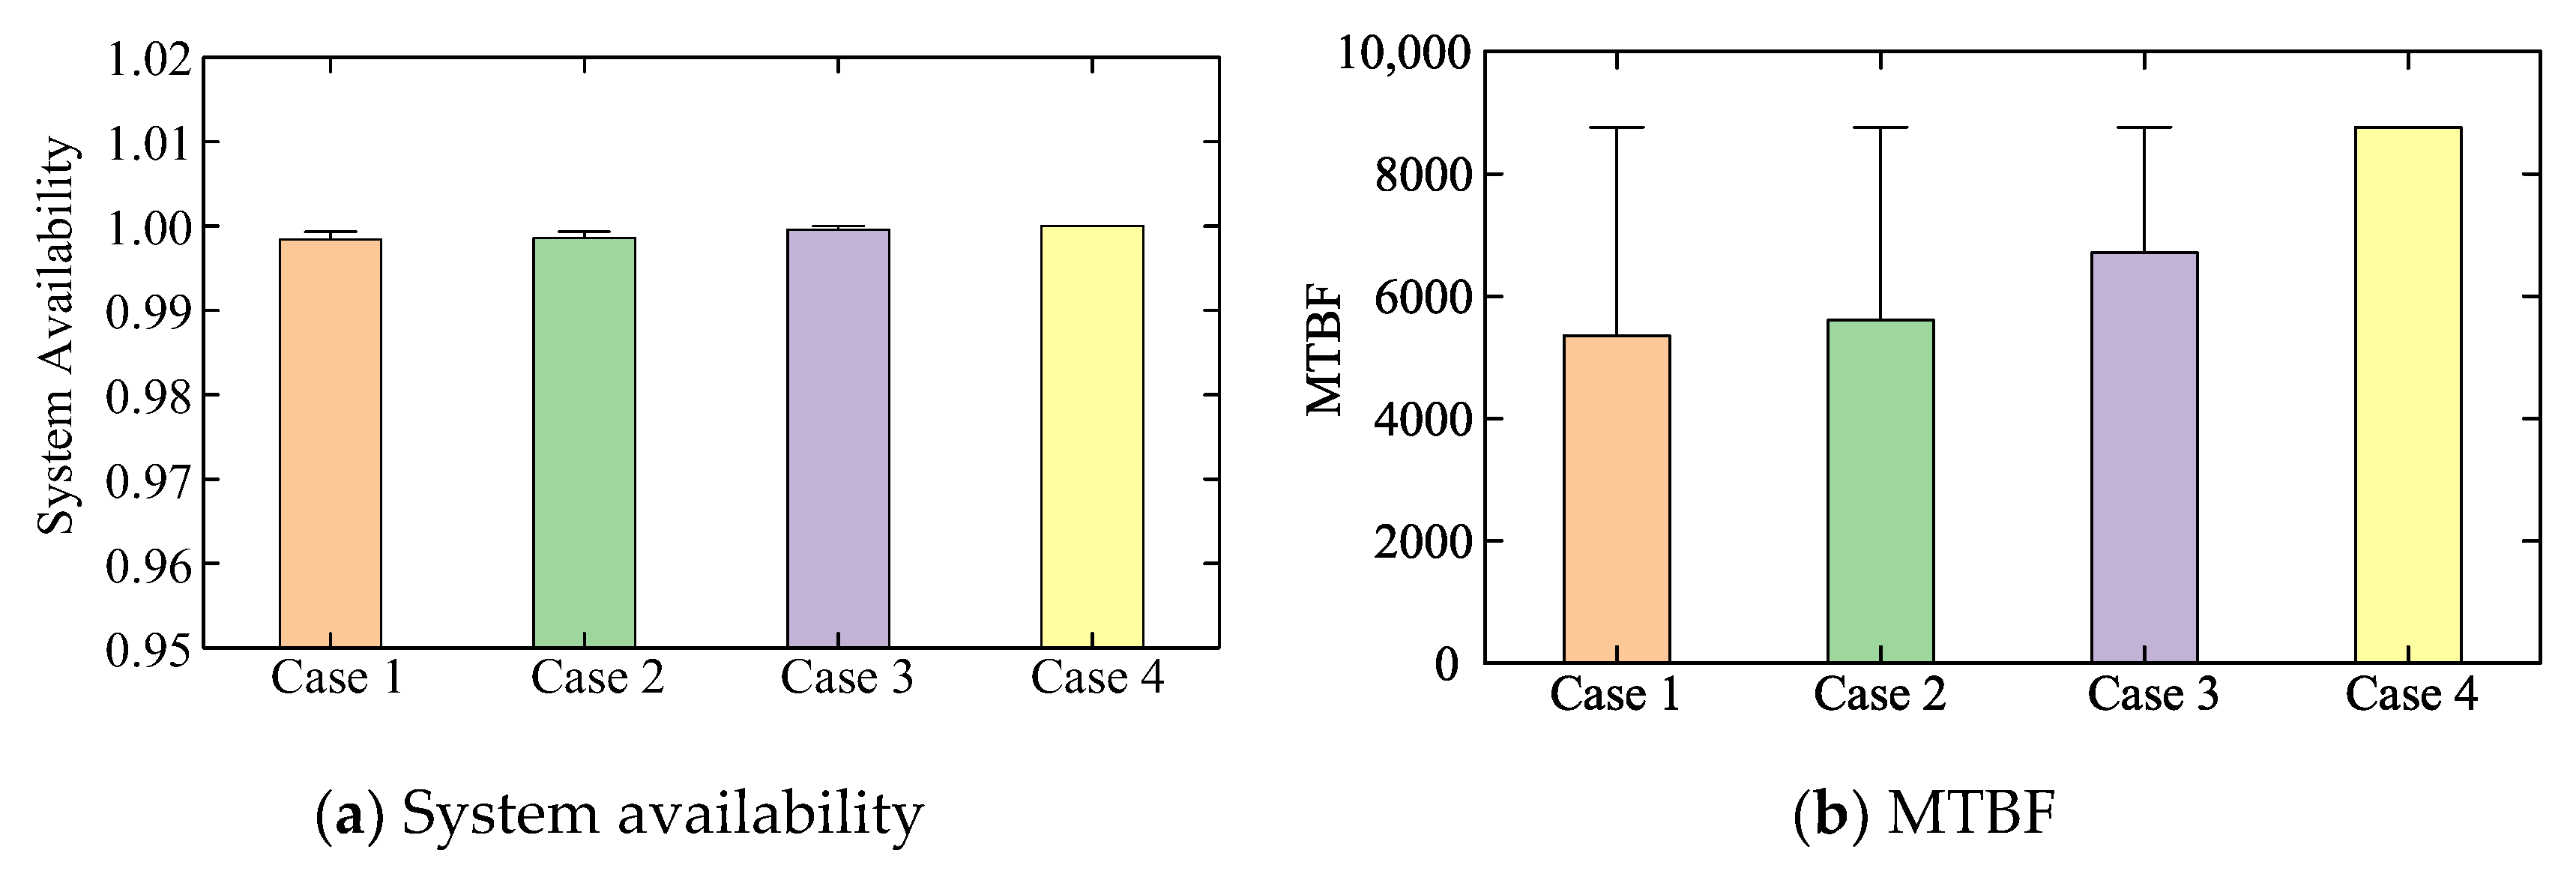
where U s u m represents the cumulative duration of system availability within that trial, T y refers to the total simulation horizon, which is set to 8760 h in this study, and t TF denotes the time of the first transition of the system to an unavailable state in a single trial. A total of 500 Monte Carlo simulations were performed for each of the four scenarios:
Case 1: Centralized control without controller redundancy.
Case 2: Centralized control with 1 + 1 redundancy for the central controller.
Case 3: Distributed control under a topology that does not satisfy N-1 convergence.
Case 4: Distributed control under a topology that satisfies N-1 convergence.
The simulation results for availability and MTBF are presented in Figure 11. The overall system availability in all cases is close to 1. For centralized control, adopting a 1 + 1 controller redundancy strategy improves reliability but still results in lower availability compared with distributed control. Among all cases, distributed control with a topology that ensures convergence under N-1 communication failures achieves the highest system availability.
The availability of different types of control systems was evaluated using an analytical calculation model, and the analytical results are compared with the Monte Carlo simulation outcomes in Table 3. It is shown that among the four scenarios, case 4 exhibits the largest MTBF value. A larger MTBF indicates that failures occur less frequently, meaning the system can operate for longer periods without interruption. This finding reinforces that case 4 not only achieves the highest availability but also offers superior long-term reliability compared with the other scenarios.
According to foregoing analysis, even with 1 + 1 controller redundancy, the reliability of centralized control remains inferior to that of distributed control. By contrast, in distributed control, adopting a communication topology that ensures convergence under N-1 failures can increase system availability to 1, virtually eliminating the risk of control failure.
Above all, both the analytical model and the Monte Carlo simulation suggest that adopting distributed control with topology adjustments that ensure convergence under N-1 contingencies can provide the highest level of system stability.

6. Case Study

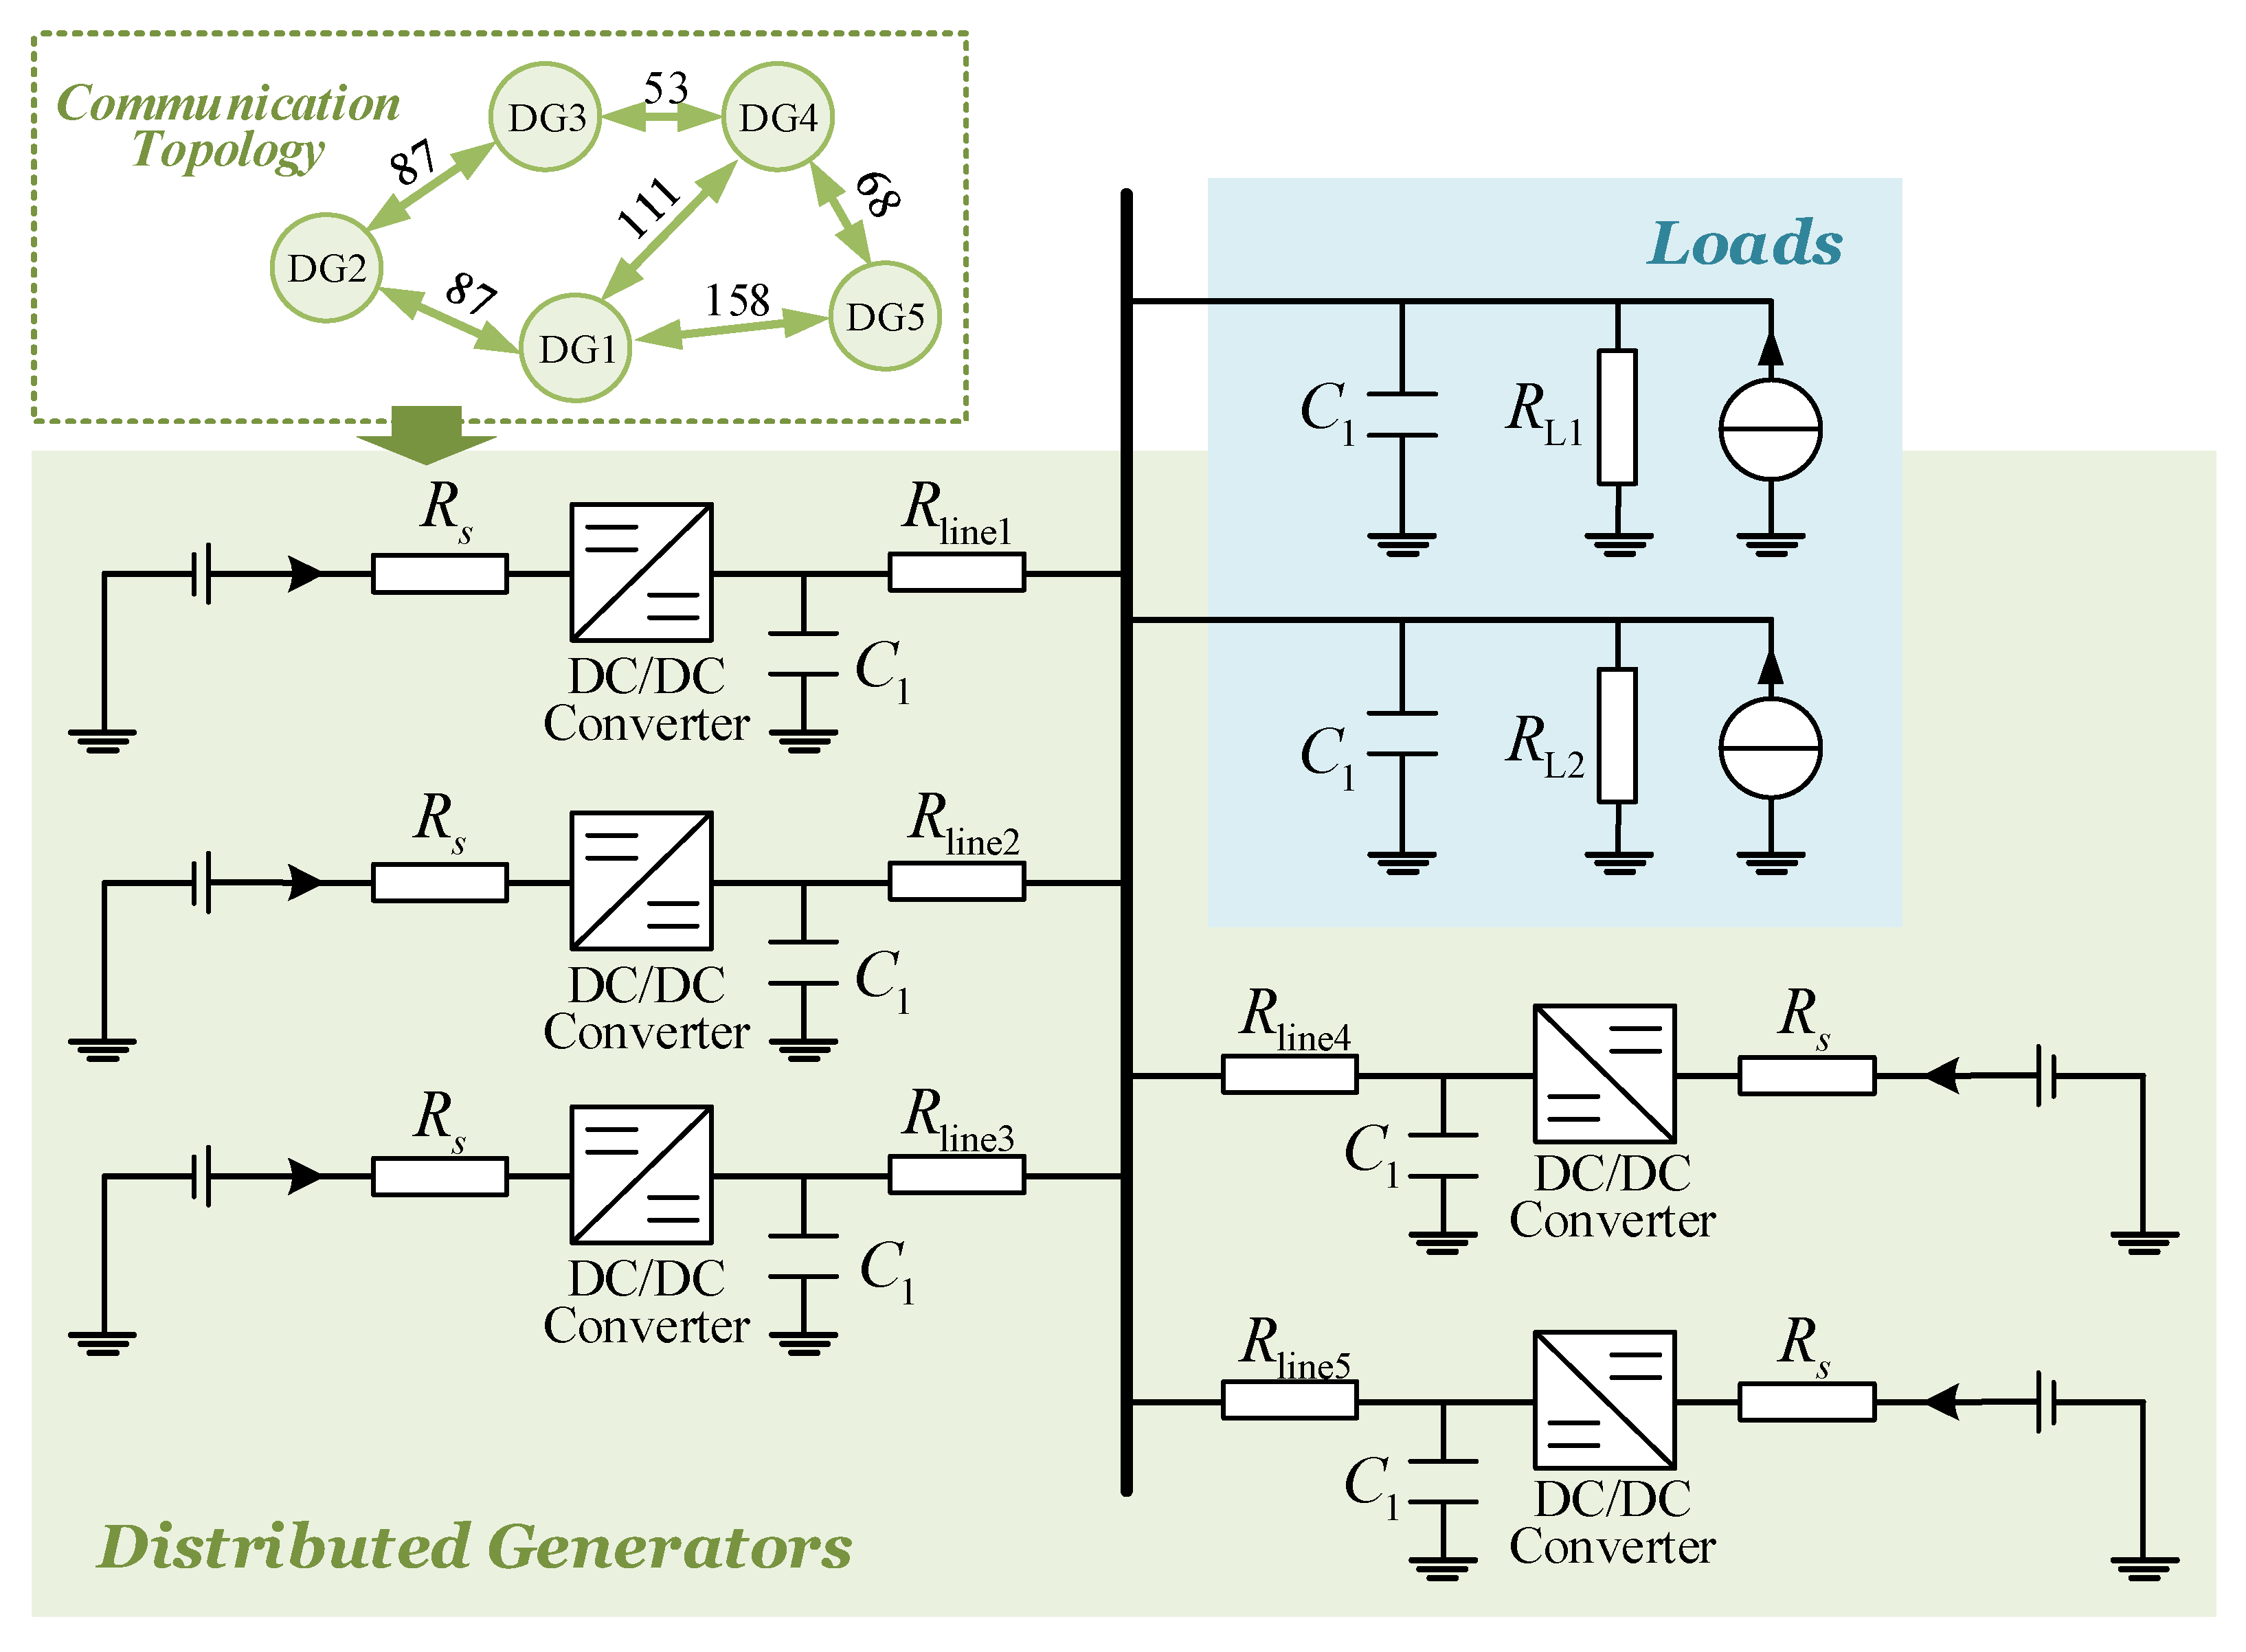
In order to verify the effectiveness of the proposed model and control method, a DC microgrid model is established in MATLAB/Simulink environment. The configuration and communication topology of the microgrid is shown in Figure 12. Parameters of the system and controllers are chosen in Table 4, Table 5, Table 6 and Table 7. The system parameters are selected with reference to previous studies [10], while incorporating variations to reflect the inherent differences in actual line impedances. The parameters of the PI controllers were selected empirically following conventional tuning practices, which are consistent with commonly adopted settings in related studies [8,11]. The computer used is a PC with an 12th Gen Intel(R) Core(TM) i5-12400F and 16 GB of RAM.

6.1. Analysis of Topology Planning

This paper employs GA to solve the planning model, with parameter configurations including a population size of 150, crossover rate of 0.9, and mutation rate of 0.1. Table 8 presents the computational time required for topology planning solutions of systems with varying node scales. Results demonstrate that the proposed model maintains high solving efficiency even for 25-node systems, fully meeting the requirements for microgrid offline planning. Moreover, if higher computational efficiency is required, the solution process can be further accelerated through parallel computing techniques.
In addition, a comparison of experimental results before and after implementing the equivalent topology reduction strategy demonstrates that incorporating isomorphic graph recognition can effectively reduce the algorithm’s runtime. From the perspective of the proportion of isomorphic graphs, the convergence time savings are expected to become more pronounced as the system size increases. However, our experiments also reveal that in larger-scale systems, the memory required to store historical isomorphic graphs grows substantially, and the time consumed in matching a new graph against the stored set also increases. These factors may, to some extent, offset the expected gains in convergence speed. Nevertheless, the overall findings indicate that the equivalent topology reduction strategy can still achieve a notable reduction in runtime and thereby accelerate the topology planning process.
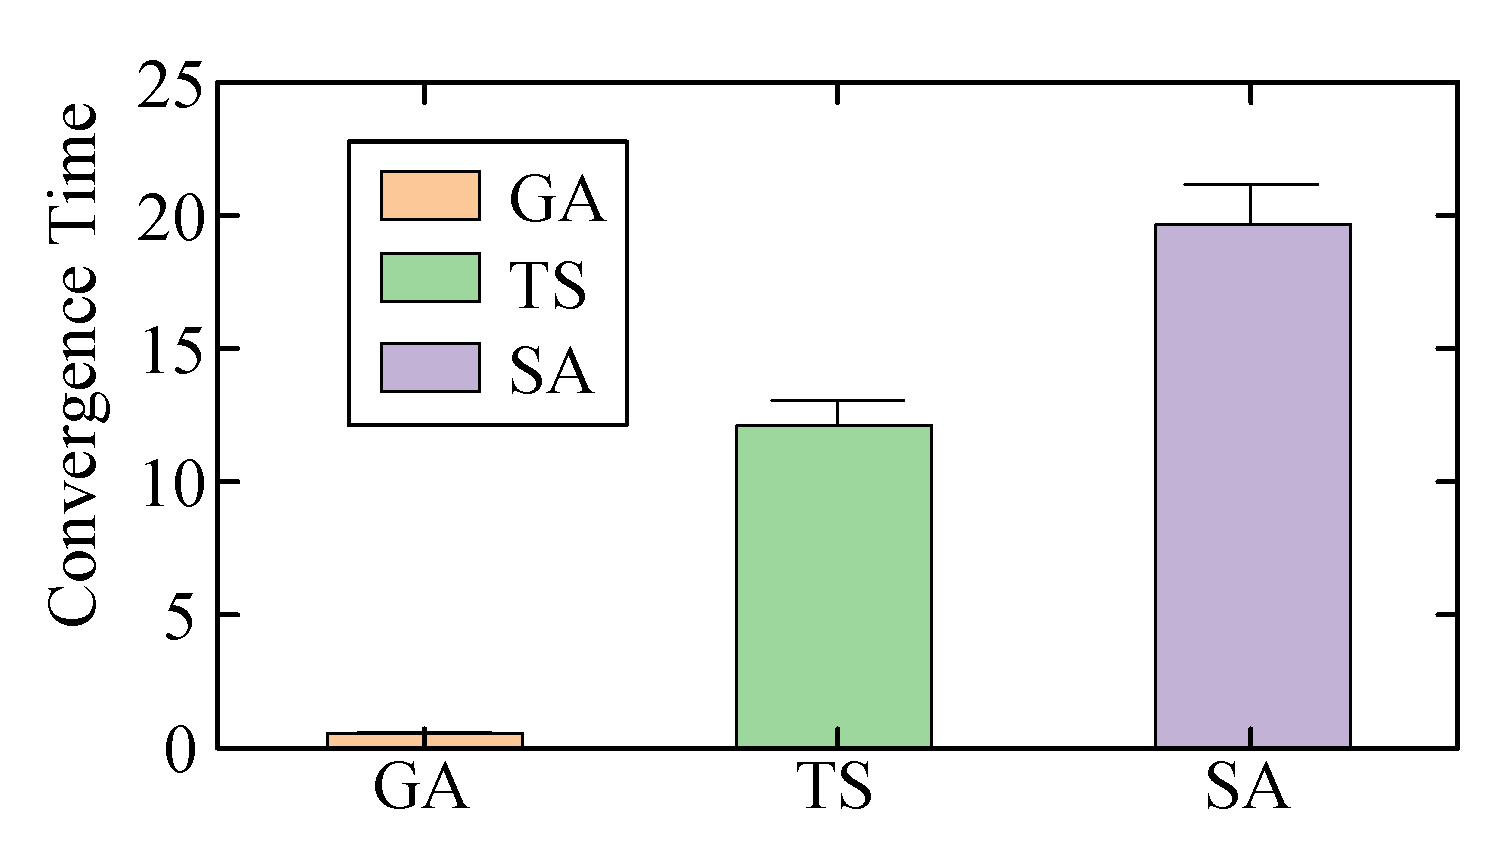
The model was solved for a 5-node system using GA, Tabu Search Algorithm (TSA), and Simulated Annealing Algorithm (SAA). For each algorithm, 100 independent experimental trials were conducted. The corresponding results are presented in Figure 13. Statistical analysis was performed using the Kruskal–Wallis test followed by post hoc Mann–Whitney U tests to evaluate differences among the three groups. The results revealed statistically significant differences (p < 0.001), indicating the superior convergence efficiency of the GA compared to the two conventional algorithms.
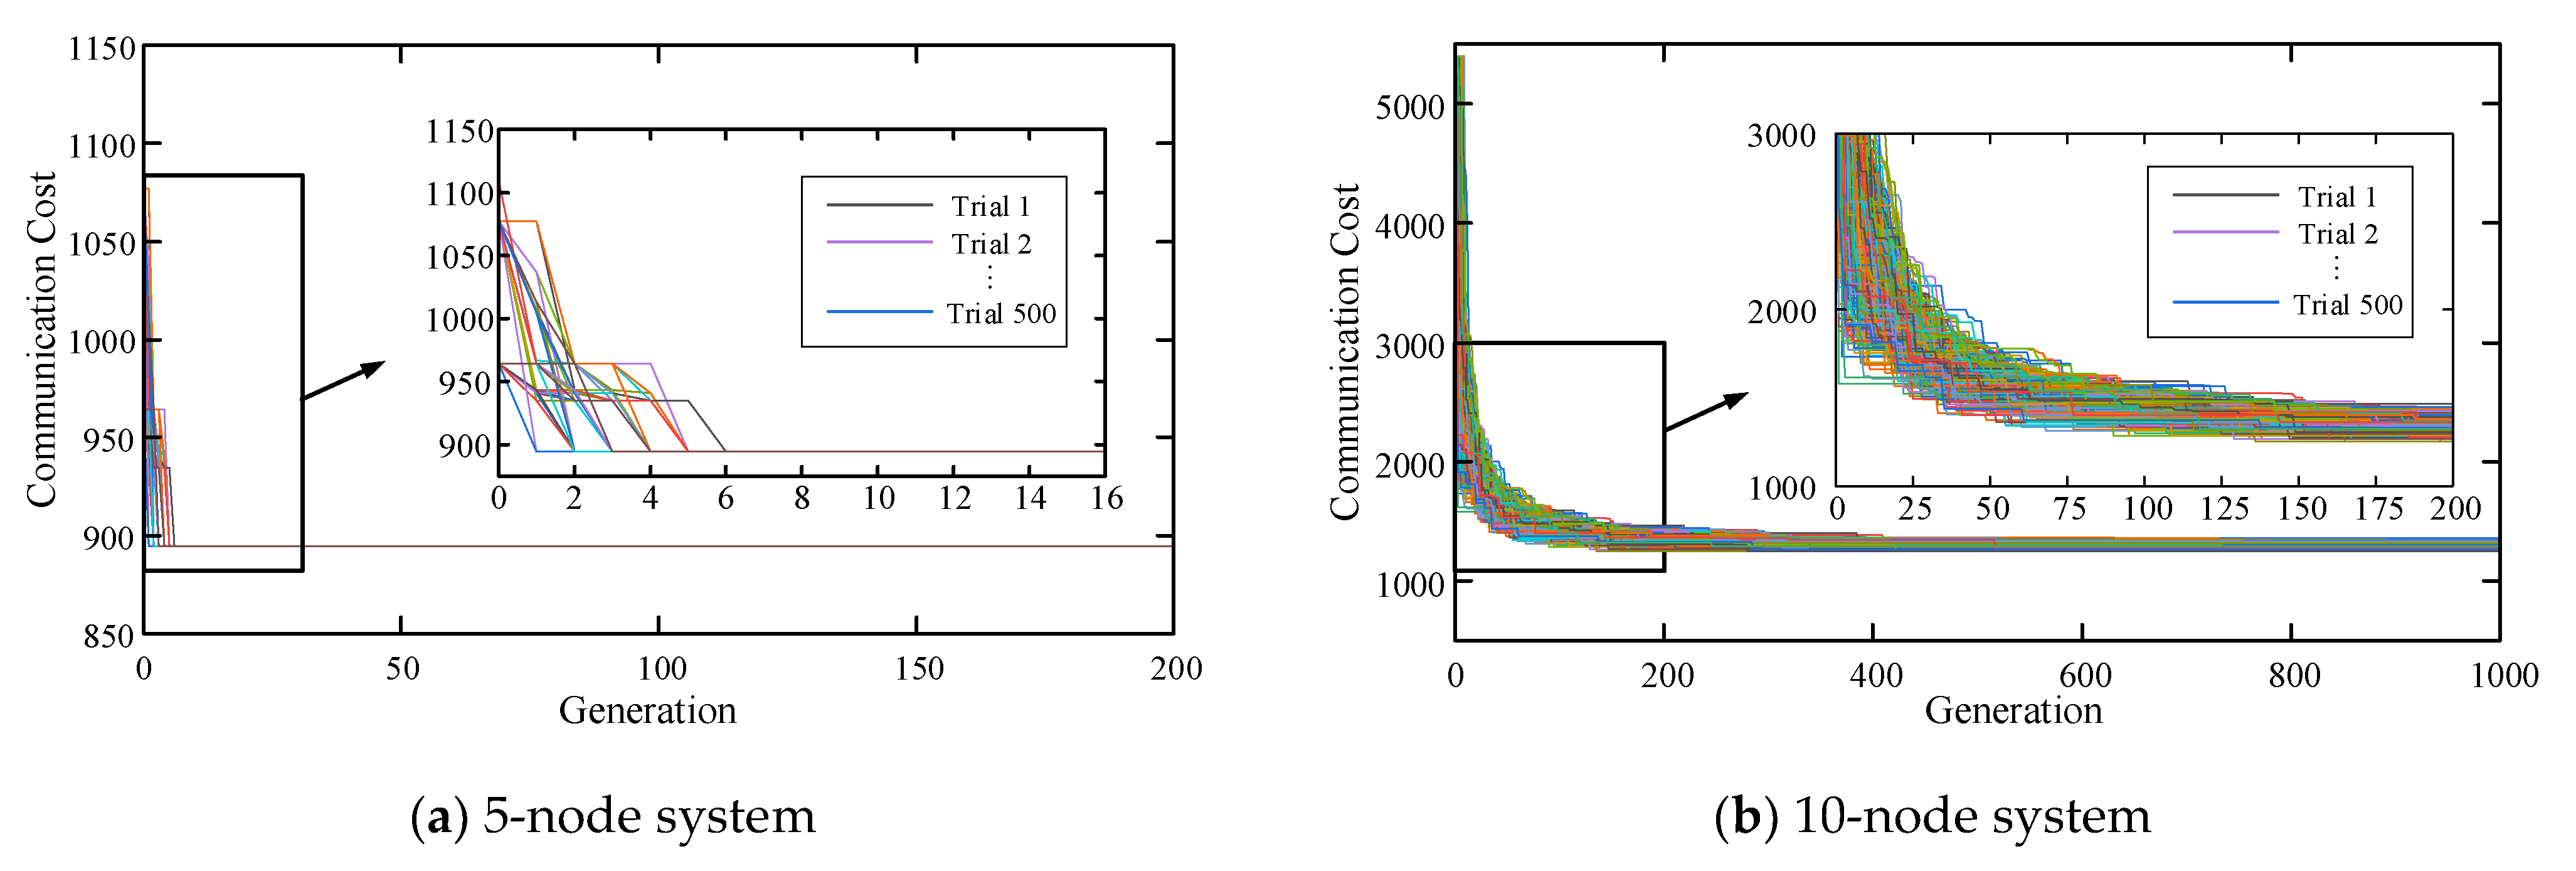
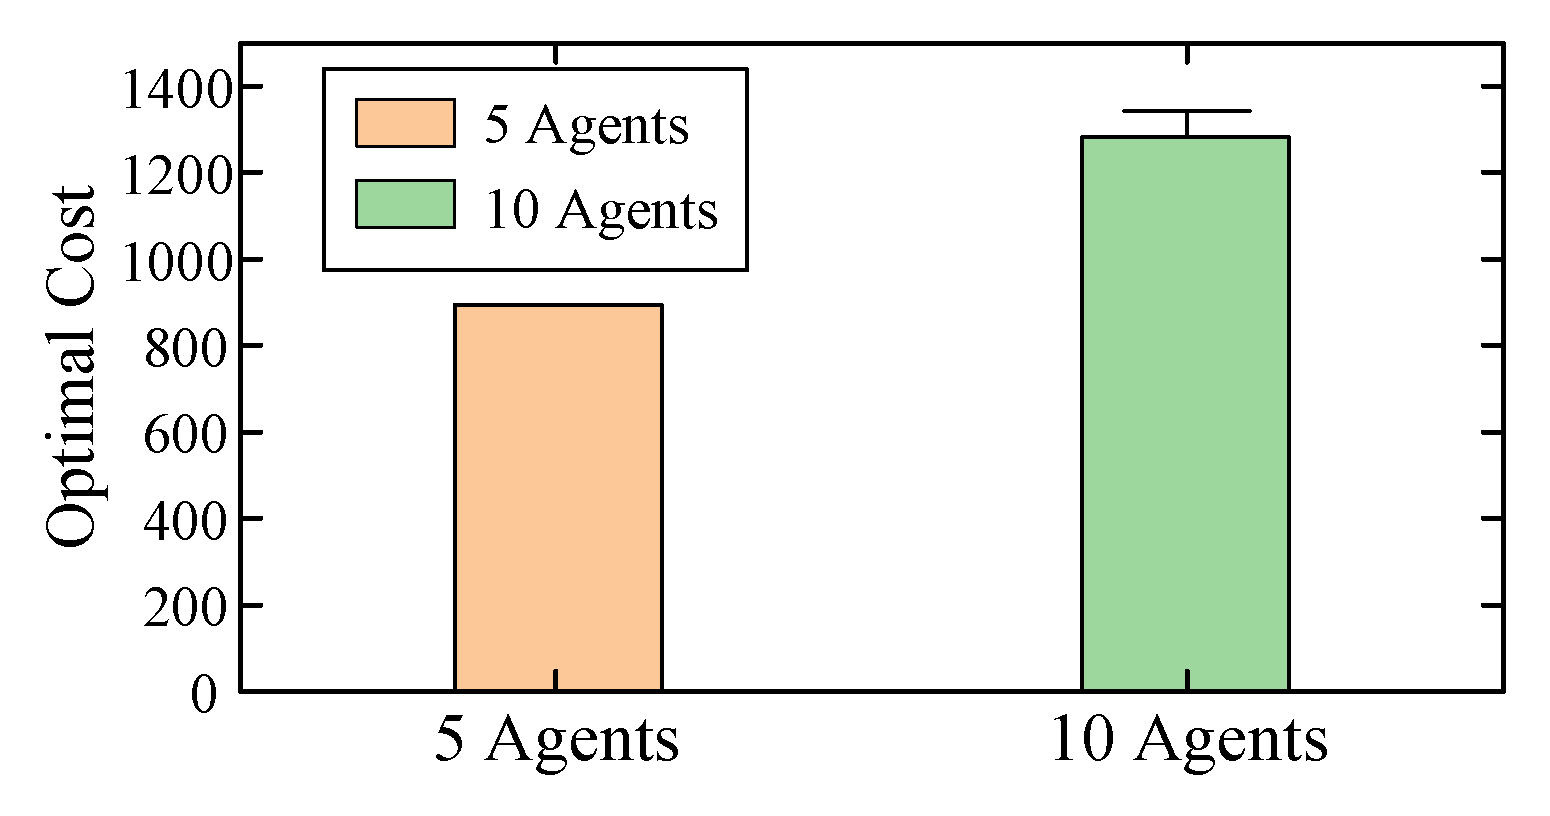
Figure 14 displays the convergence characteristics, showing that the GA consistently achieves convergence. Figure 15 shows the optimal cost of different scale systems. Statistical properties of the 500 solutions are summarized in Table 9, where C ¯ o p represents the mean optimal cost. s 2 indicates the variance of optimal costs. G a v denotes the average convergence generation. p max represents the modal solution’s occurrence frequency in 500 trials.
The repeated solving experiments confirm that the GA ensures both precision and rapid optimization. The optimal communication topology derived from model solutions is illustrated in Figure 12, which will be adopted for subsequent simulation validations.
An economic analysis was conducted for the topologies generated by the proposed planning model. As indicated by the analysis of Equations (20) and (21), minimizing the planning and operational cost in this model is equivalent to minimizing the unit power consumption, which serves as the objective function of this study. Accordingly, the unit power consumption is taken as the cost of each topology, while the MTBF index is used to quantitatively evaluate their reliability. Based on these two metrics, the cost–benefit ratio is calculated for each topology. In addition, using Scheme 1 as the reference, the marginal cost of Schemes 2–4 is also computed. The four corresponding topologies are illustrated in Figure 16, where Scheme 2 represents the optimal topology derived from the proposed model. As shown in Table 10, among all candidate topologies, Scheme 2 achieves the lowest cost–benefit ratio and the lowest marginal cost, indicating that it is the most economical solution.

6.2. Performance of Conventional Control Method

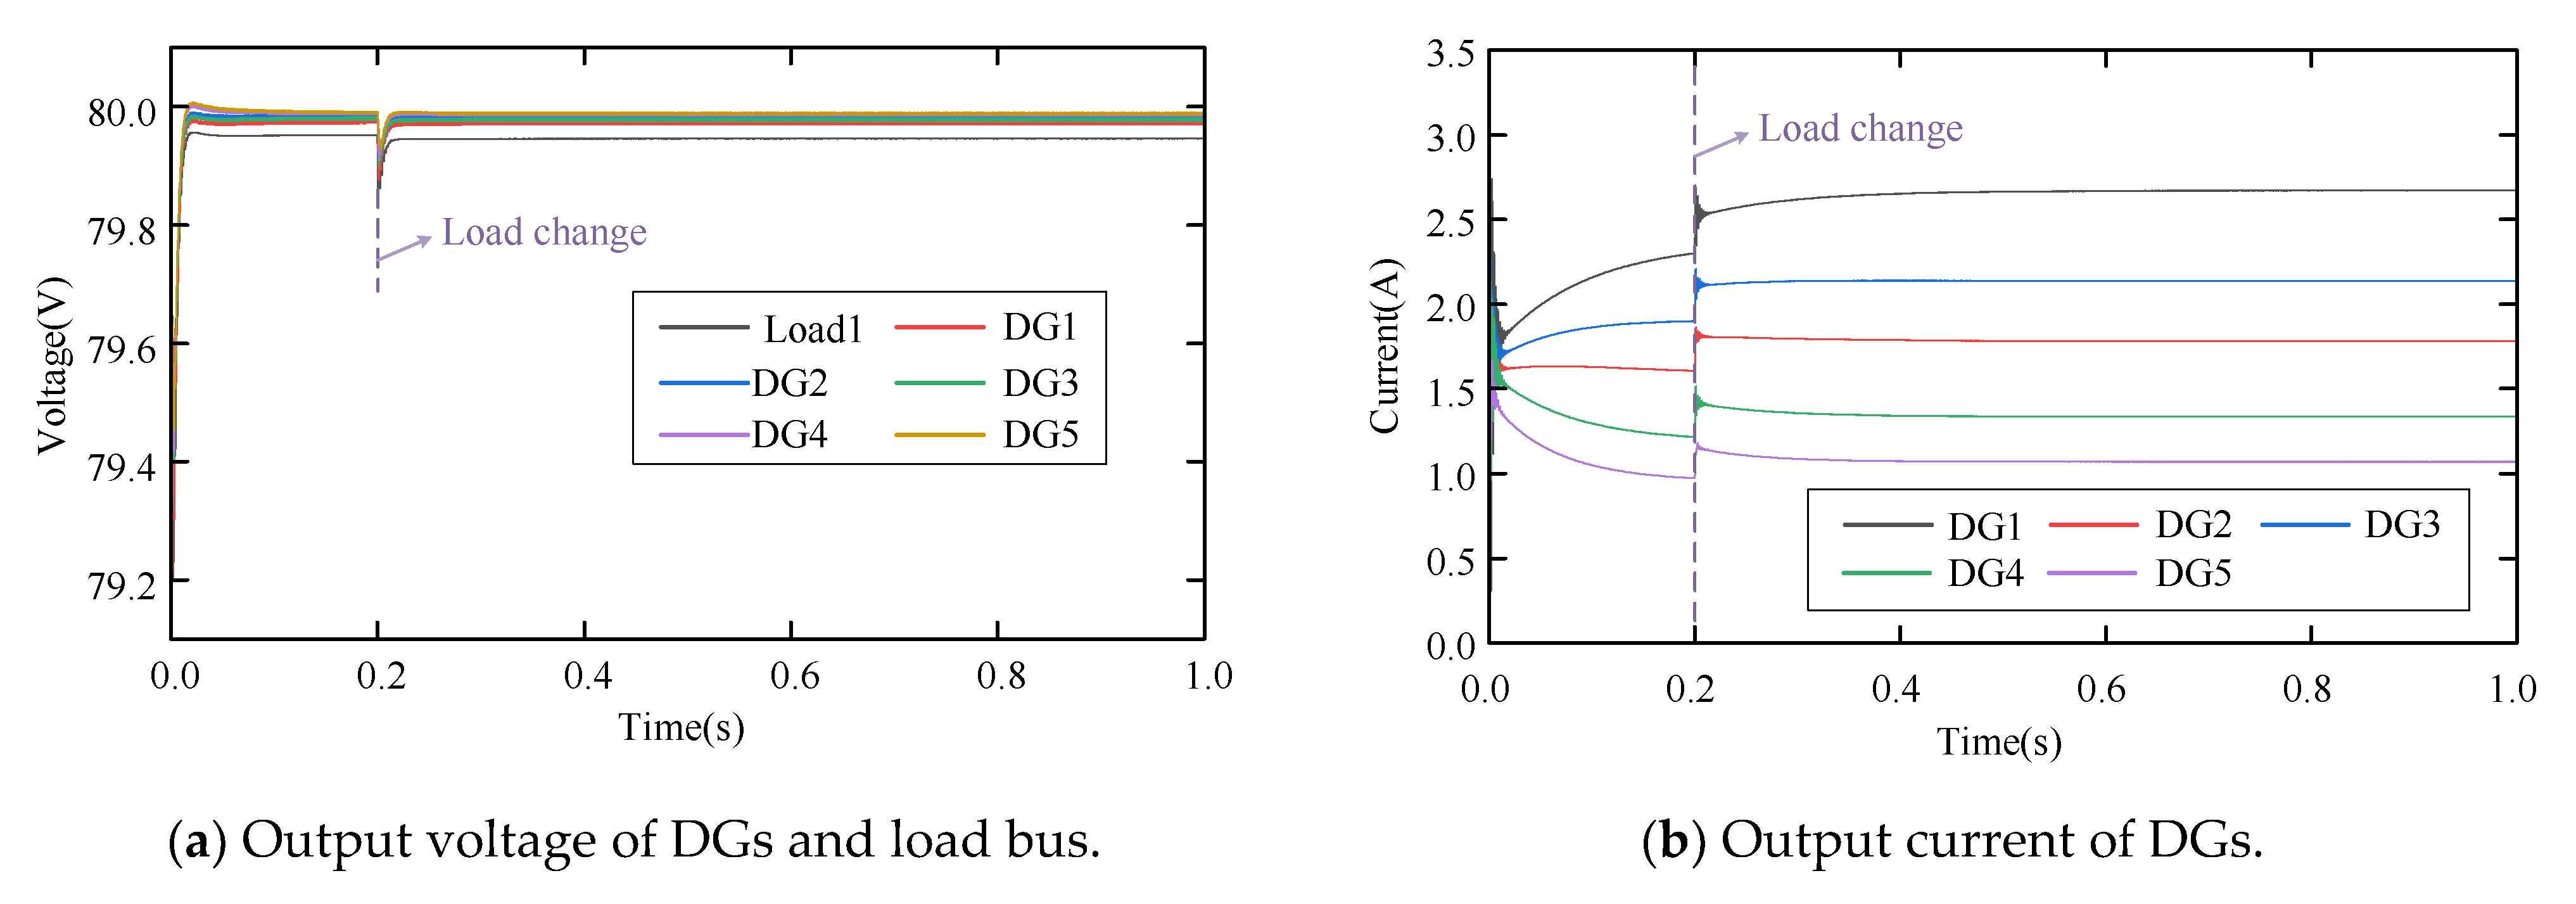
In the proposed microgrid, primary control, centralized control, and distributed control are applied, respectively, and compared in terms of their performance. The simulation results of primary control are presented in Figure 17. In this case, a sudden load change occurs at t = 0.2     s . As shown in Figure 17a, the primary control exhibits strong voltage stability under load-step changes, resulting in only a 0.25% voltage deviation. However, as demonstrated in Figure 17b, the power control capability of the system is weak when relying solely on primary control. Due to the variation in line impedances, significant imbalances in current distribution among DGs are observed. The steady-state current error is 47.50%, signifying a notable deviation from the expected current value.
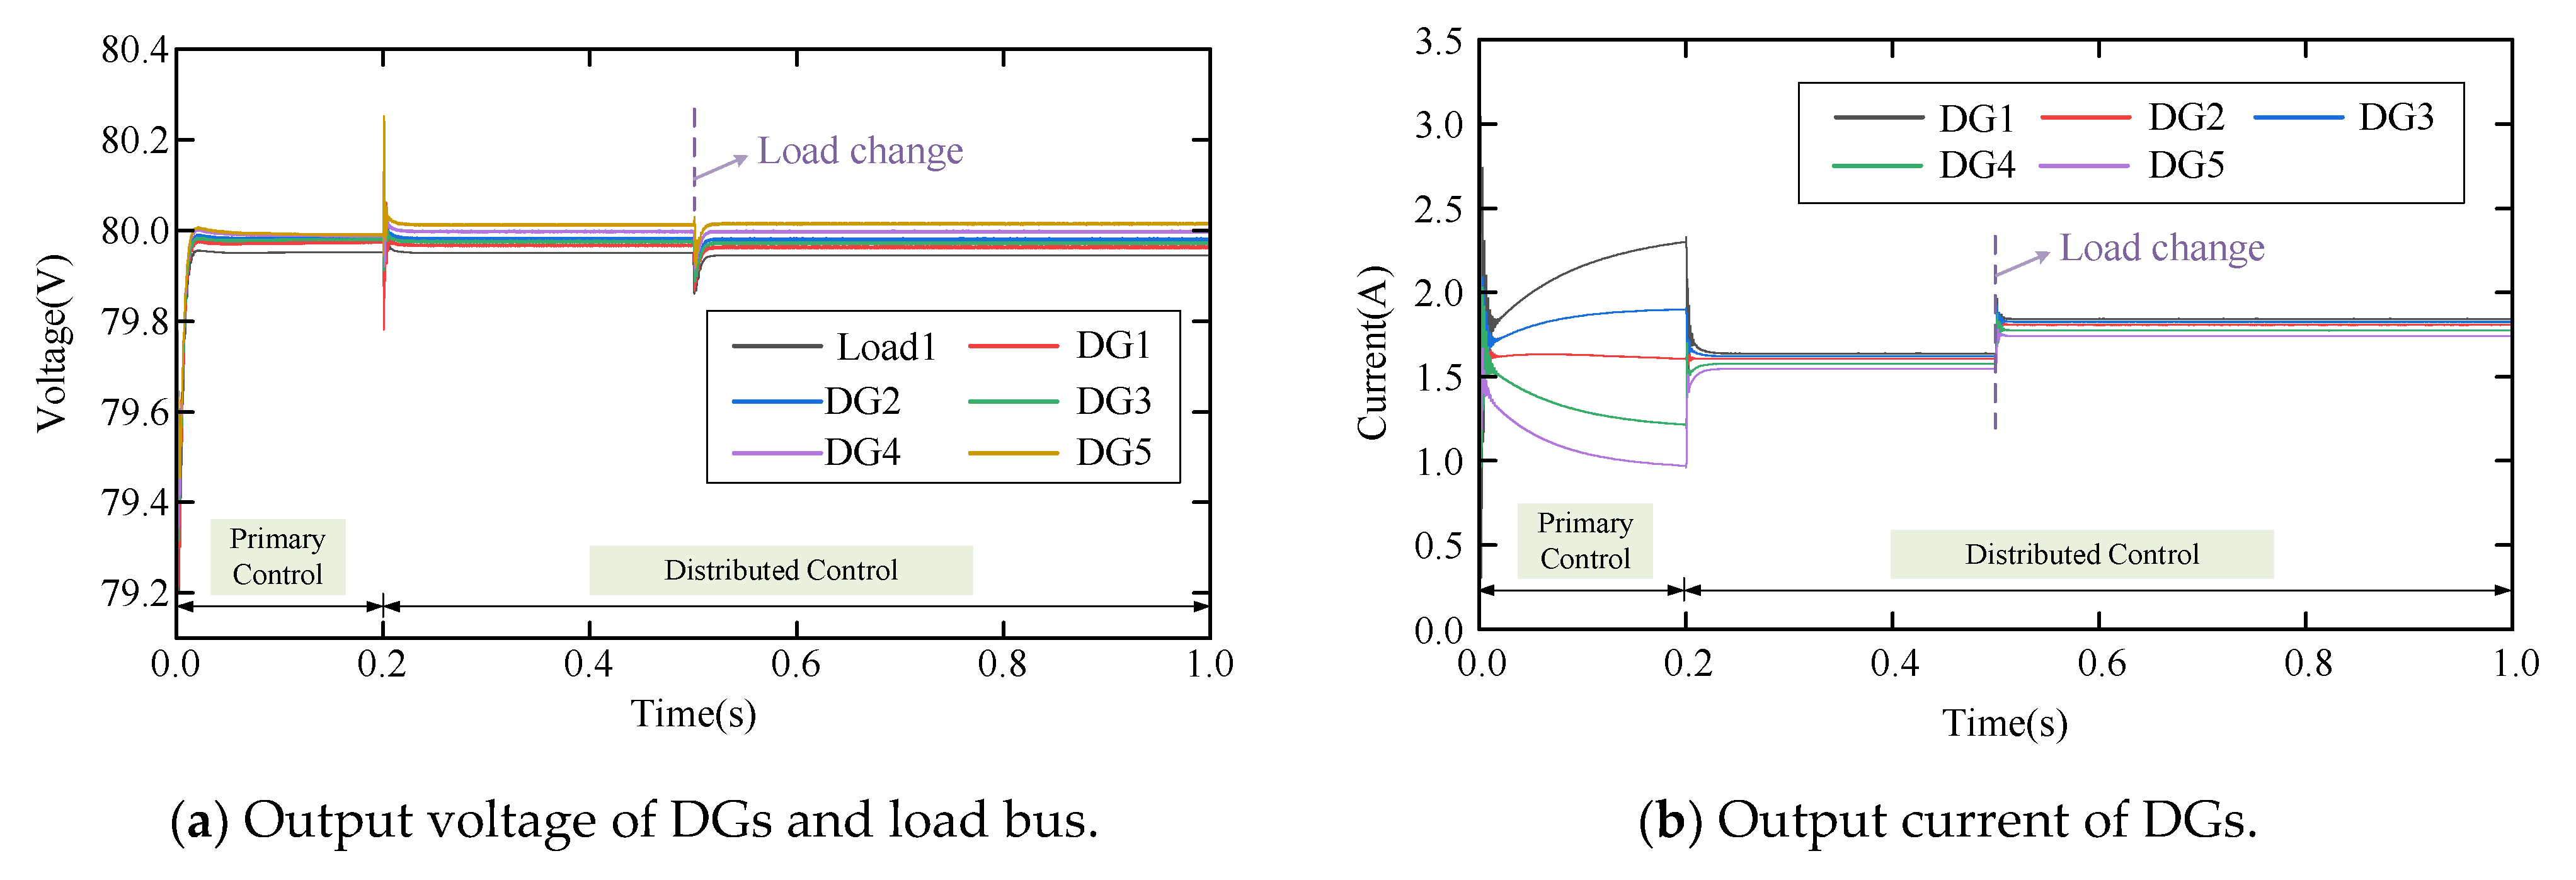
To address these limitations, distributed control is implemented in the proposed system, and the corresponding simulation results are shown in Figure 18. The simulation is divided into two stages. During Stage 1 ( 0 ~ 0.2     s ), only primary control is applied, resulting in poor current sharing performance. At t = 0.2     s , distributed control is activated, and the current of all DGs rapidly converges to the ideal value. Despite the load-step change at t = 0.2     s , the distributed control demonstrates excellent voltage and current control performance, with voltage overshoot not exceeding 0.04% and current overshoot not exceeding 13.91%. Additionally, under distributed control, the voltages and currents of all DGs reach steady state within 2 and 9 sampling steps, respectively, corresponding to 20 μ s and 90 μ s , demonstrating significantly faster convergence than primary control.
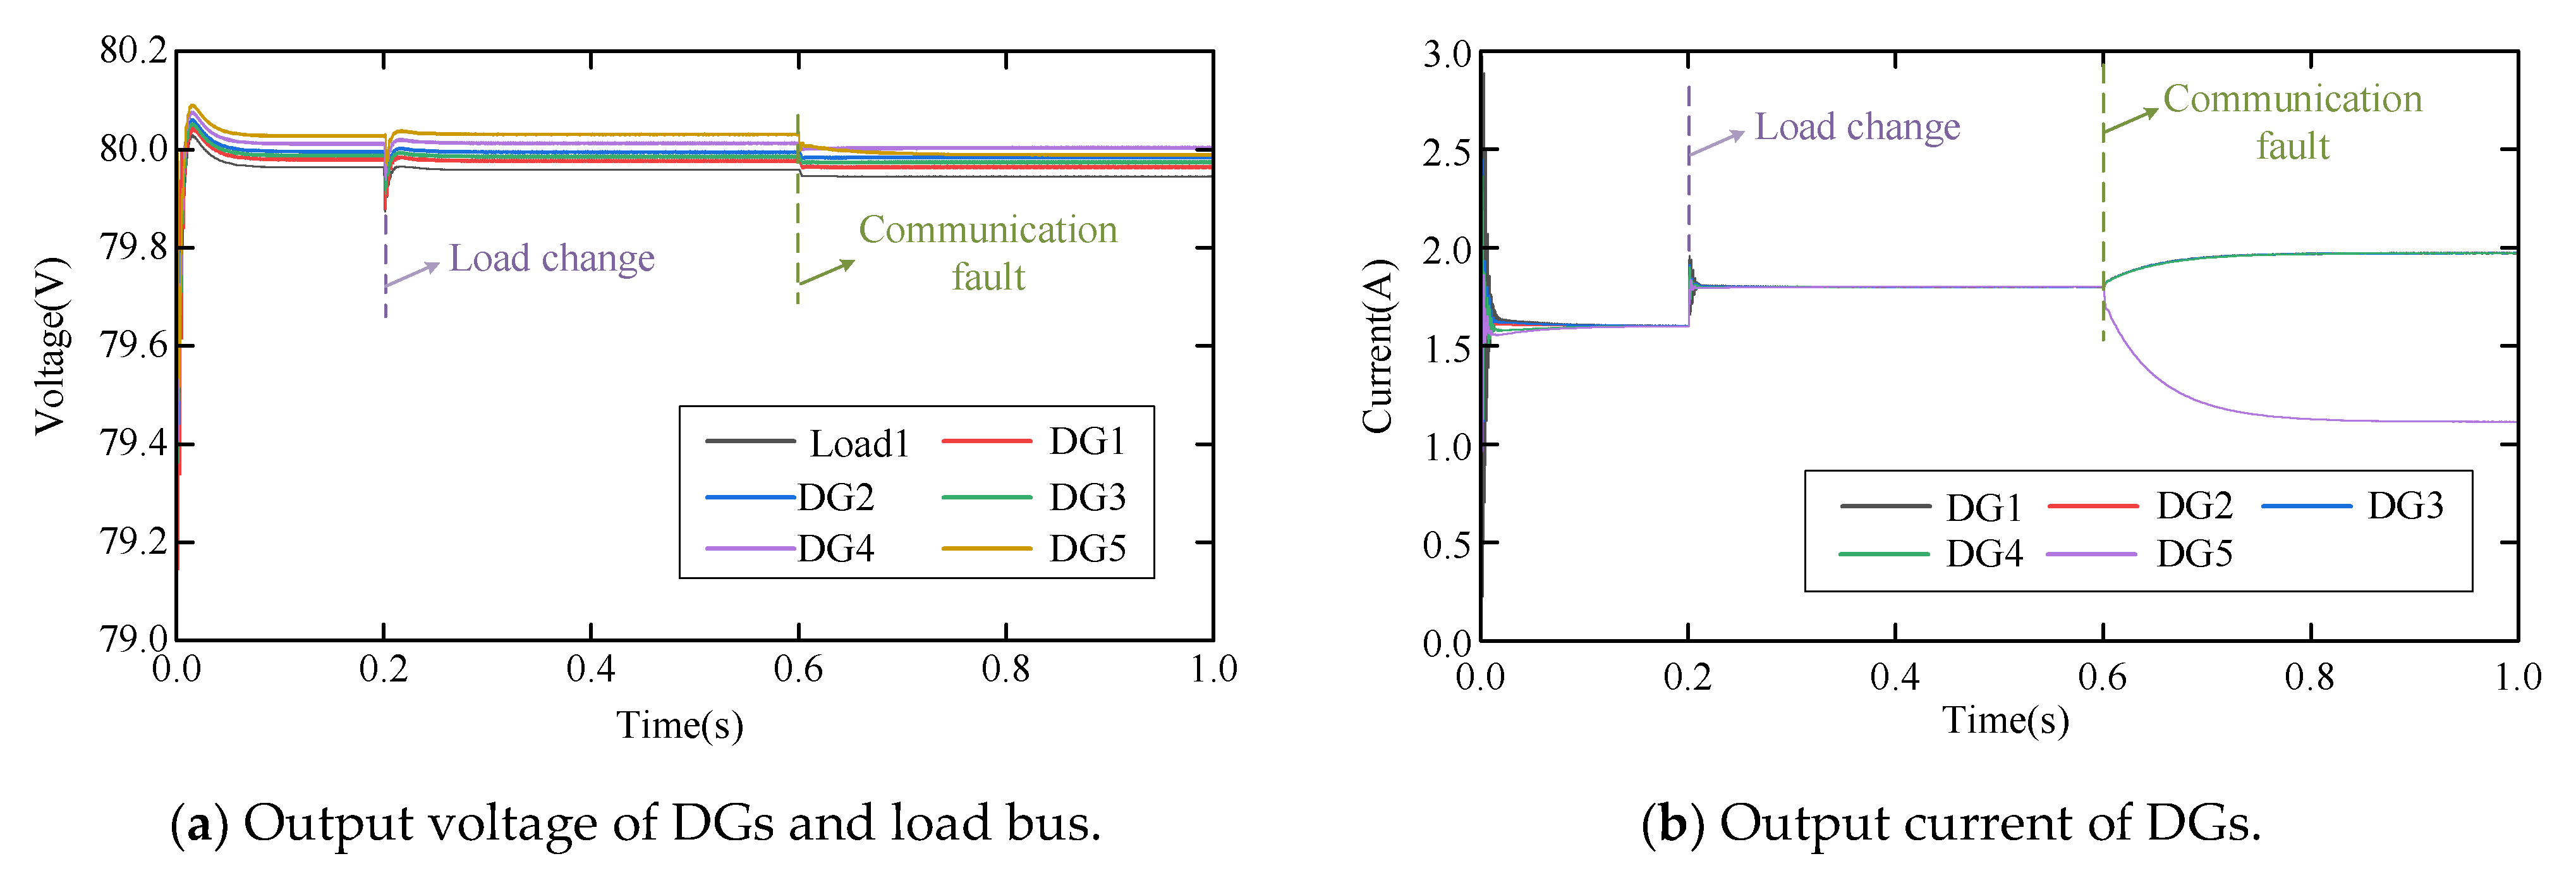
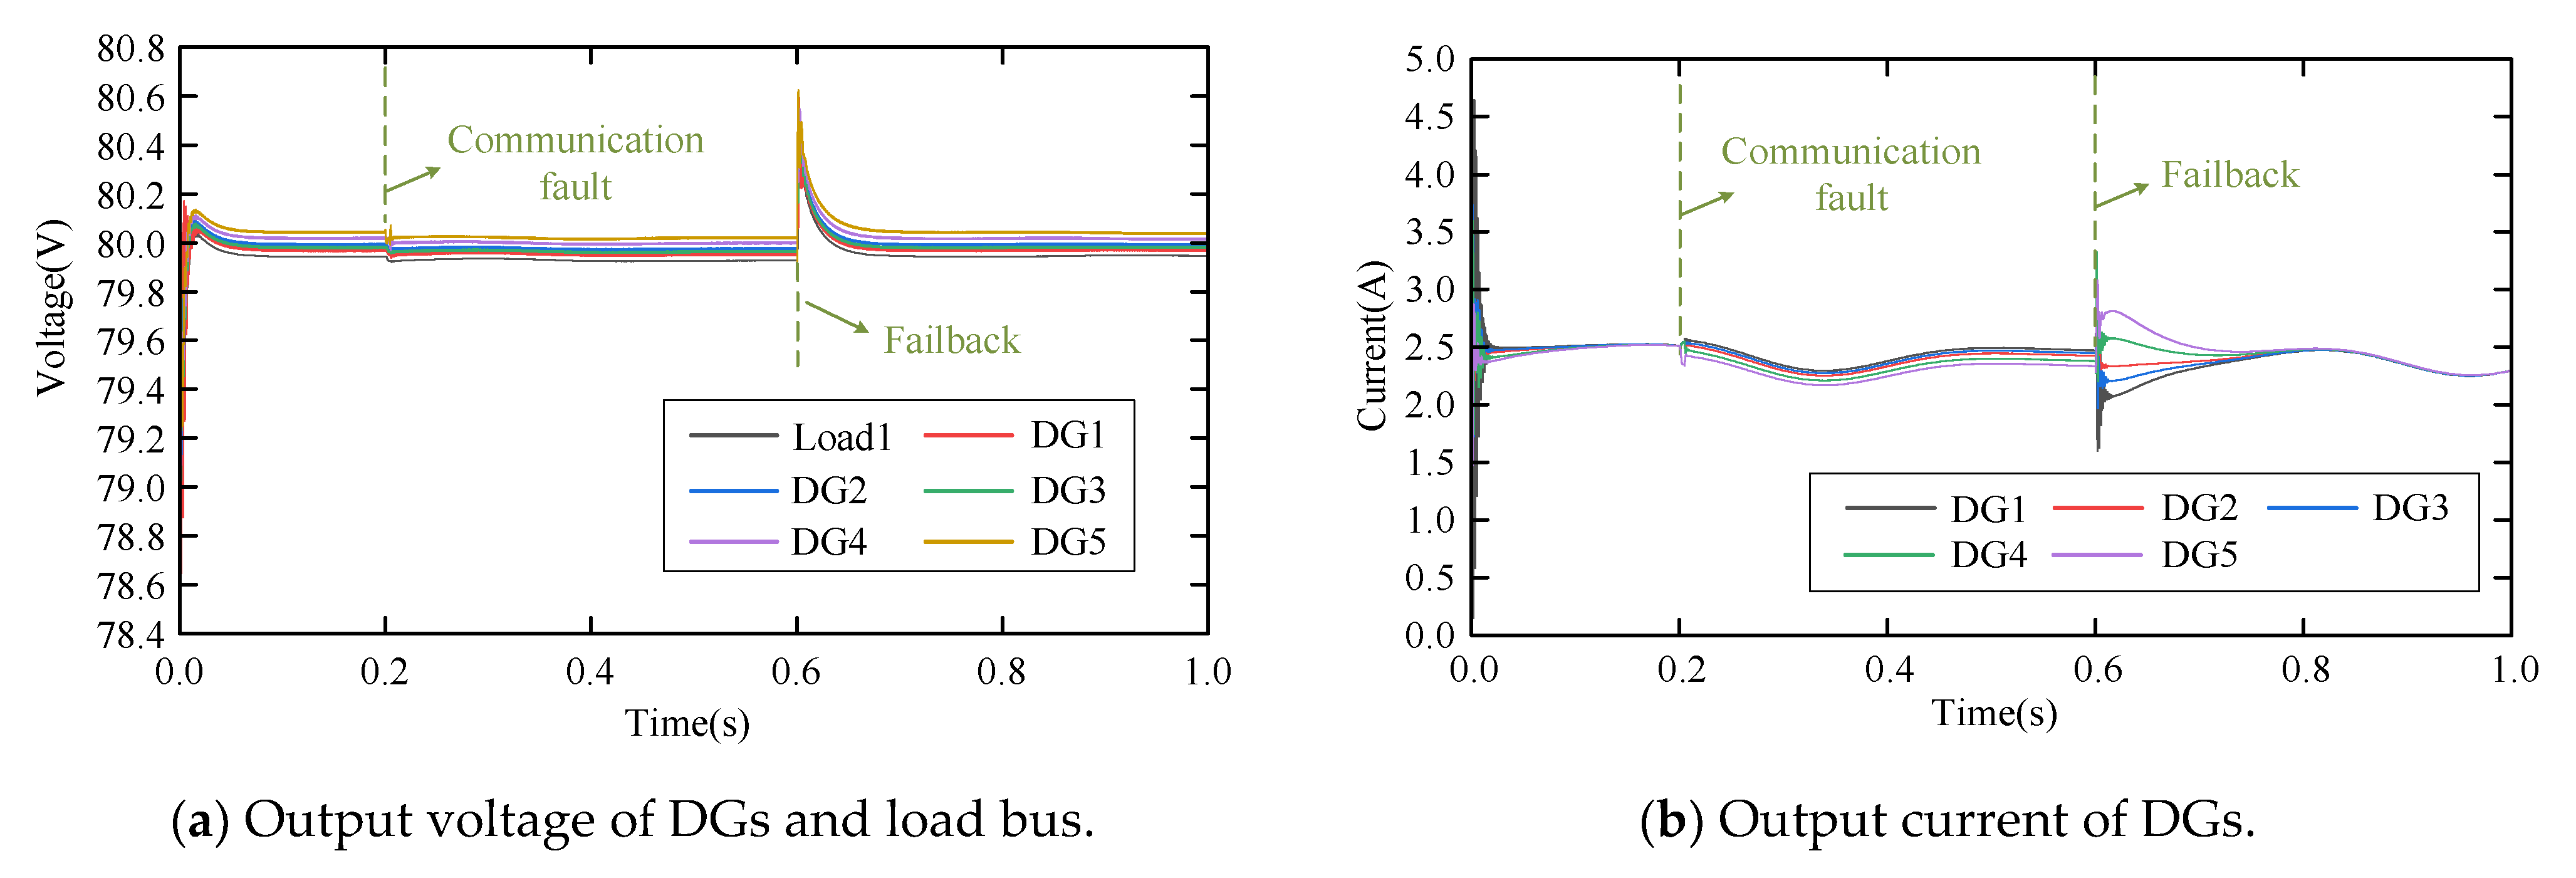
Furthermore, centralized control is implemented in the proposed system with control parameters listed in Table 6. The simulation results are presented in Figure 19. Two faults are predetermined in the simulation. At t = 0.2     s , a sudden current change occurs in Load 1. At t = 0.6     s , a communication fault occurs between the central controller and DG5. The simulation results indicate that both voltage and current can rapidly converge and remain stable under load-step changes. By implementing centralized control, the current achieves a steady-state control precision of 0.08%, which outperforms both primary and distributed control strategies. However, under the communication fault condition, DG5 experiences significant current instability, with a steady-state current deviation of up to 37.38%. This highlights the limited robustness of centralized control under single-point failures. In a centralized control system, communication faults can disrupt current control performance and introduce significant risks to system safety and stability.

6.3. Validation of Proposed Method

6.3.1. N-1 Condition

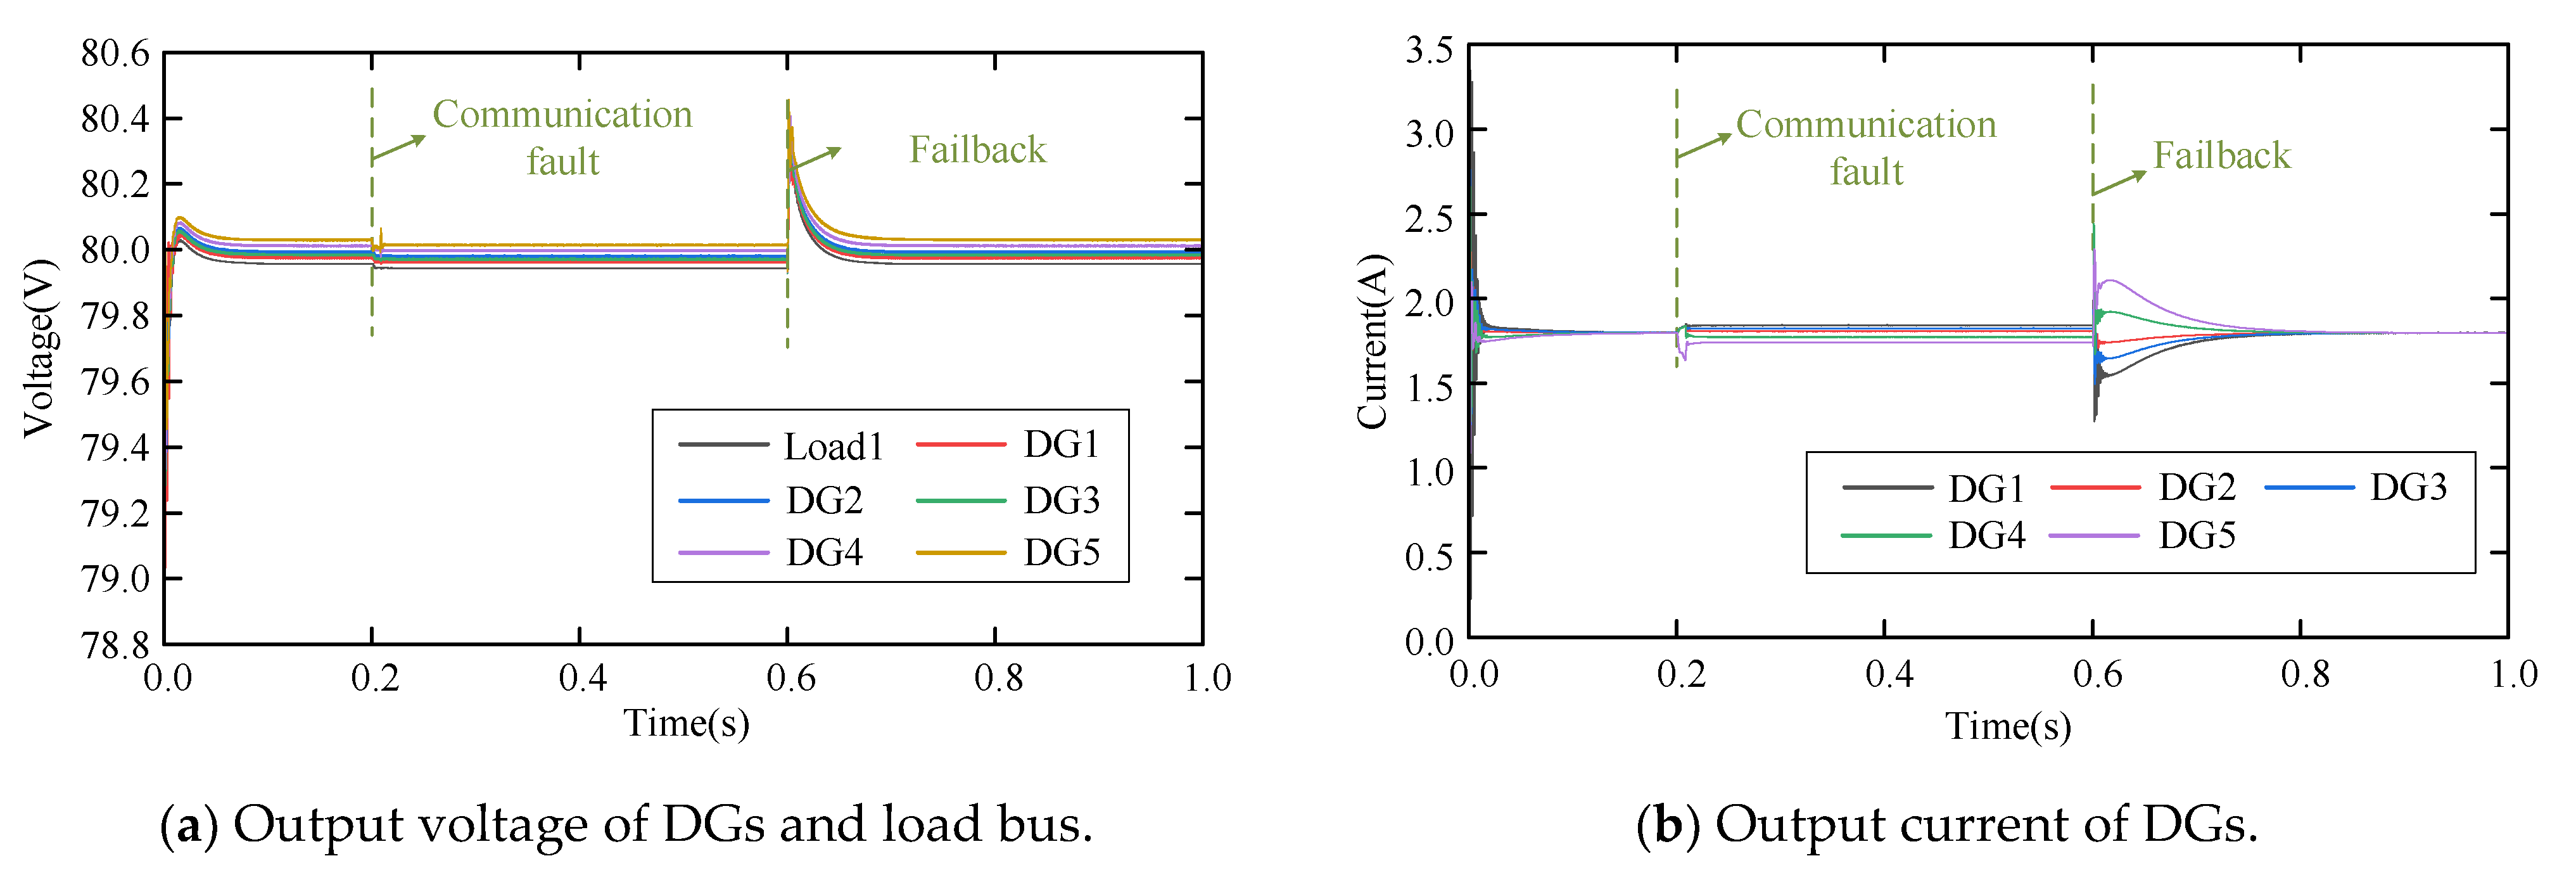
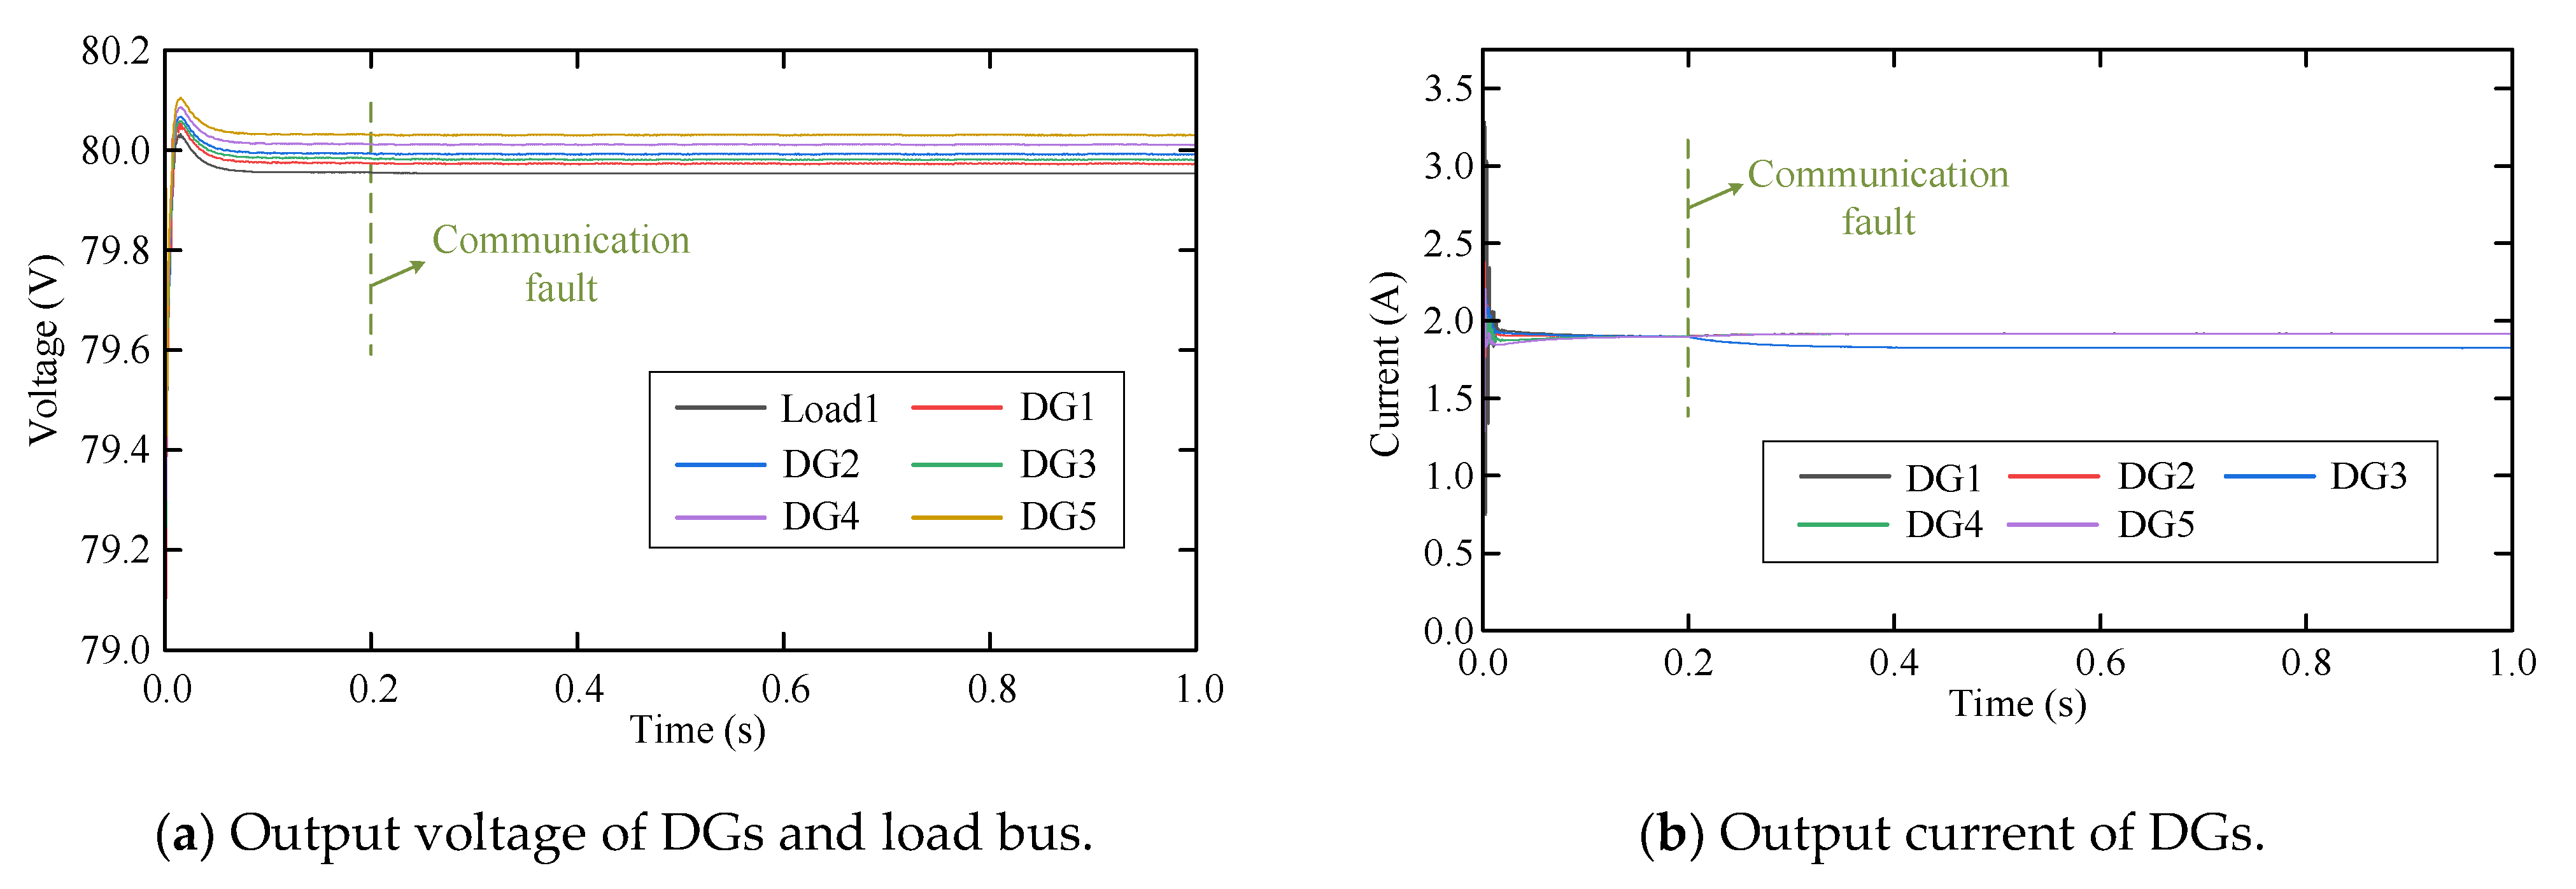
The robustness of algorithm under N-1 contingency is examined through simulations, with results displayed in Figure 20. At t = 0.2   s , a communication interruption occurs between DG5 and the centralized controller, simulating an N-1 fault. Communication is restored at t = 0.6     s seconds. The simulation results indicate that the system maintains stable operation, with both voltage and current converging to ideal values throughout the fault and subsequent recovery periods. In comparison with centralized control strategies, the proposed framework demonstrates superior performance under communication faults. During the fault, the system maintains control precision, with voltage and current deviations remaining within acceptable limits (3.15%). Post-recovery, transient fluctuations are minimal. The system reaches steady state within 31 and 87 sampling steps for voltage and current, respectively, corresponding to 310 μ s and 870 μ s . This persistent performance validates the robustness of proposed algorithm in ensuring grid stability under severe contingency scenarios.

6.3.2. Step-Varying Load

The ability of proposed control method to handle sudden load changes is further evaluated in Figure 21. A step change of 1A in current demand occurs at t = 0.2     s , which then returns to normal levels by t = 0.6     s . Simulation results highlight the strong transient response characteristics of the system, with the voltage and current reaching steady state within 25 and 1 sampling steps, corresponding to 250 μ s and 10 μ s , respectively. During the transient phase, overshoots are tightly controlled, with voltage exceeding steady-state values by 0.05%. This performance closely resembles an ideal step response, which indicates the well-damped dynamic behavior of the control system. In steady-state conditions, the system maintains high precision. By maintaining steady-state voltage and current errors within 0.04% and 0.02%, the algorithm ensures optimal operational performance.

6.3.3. Slow-Varying Load

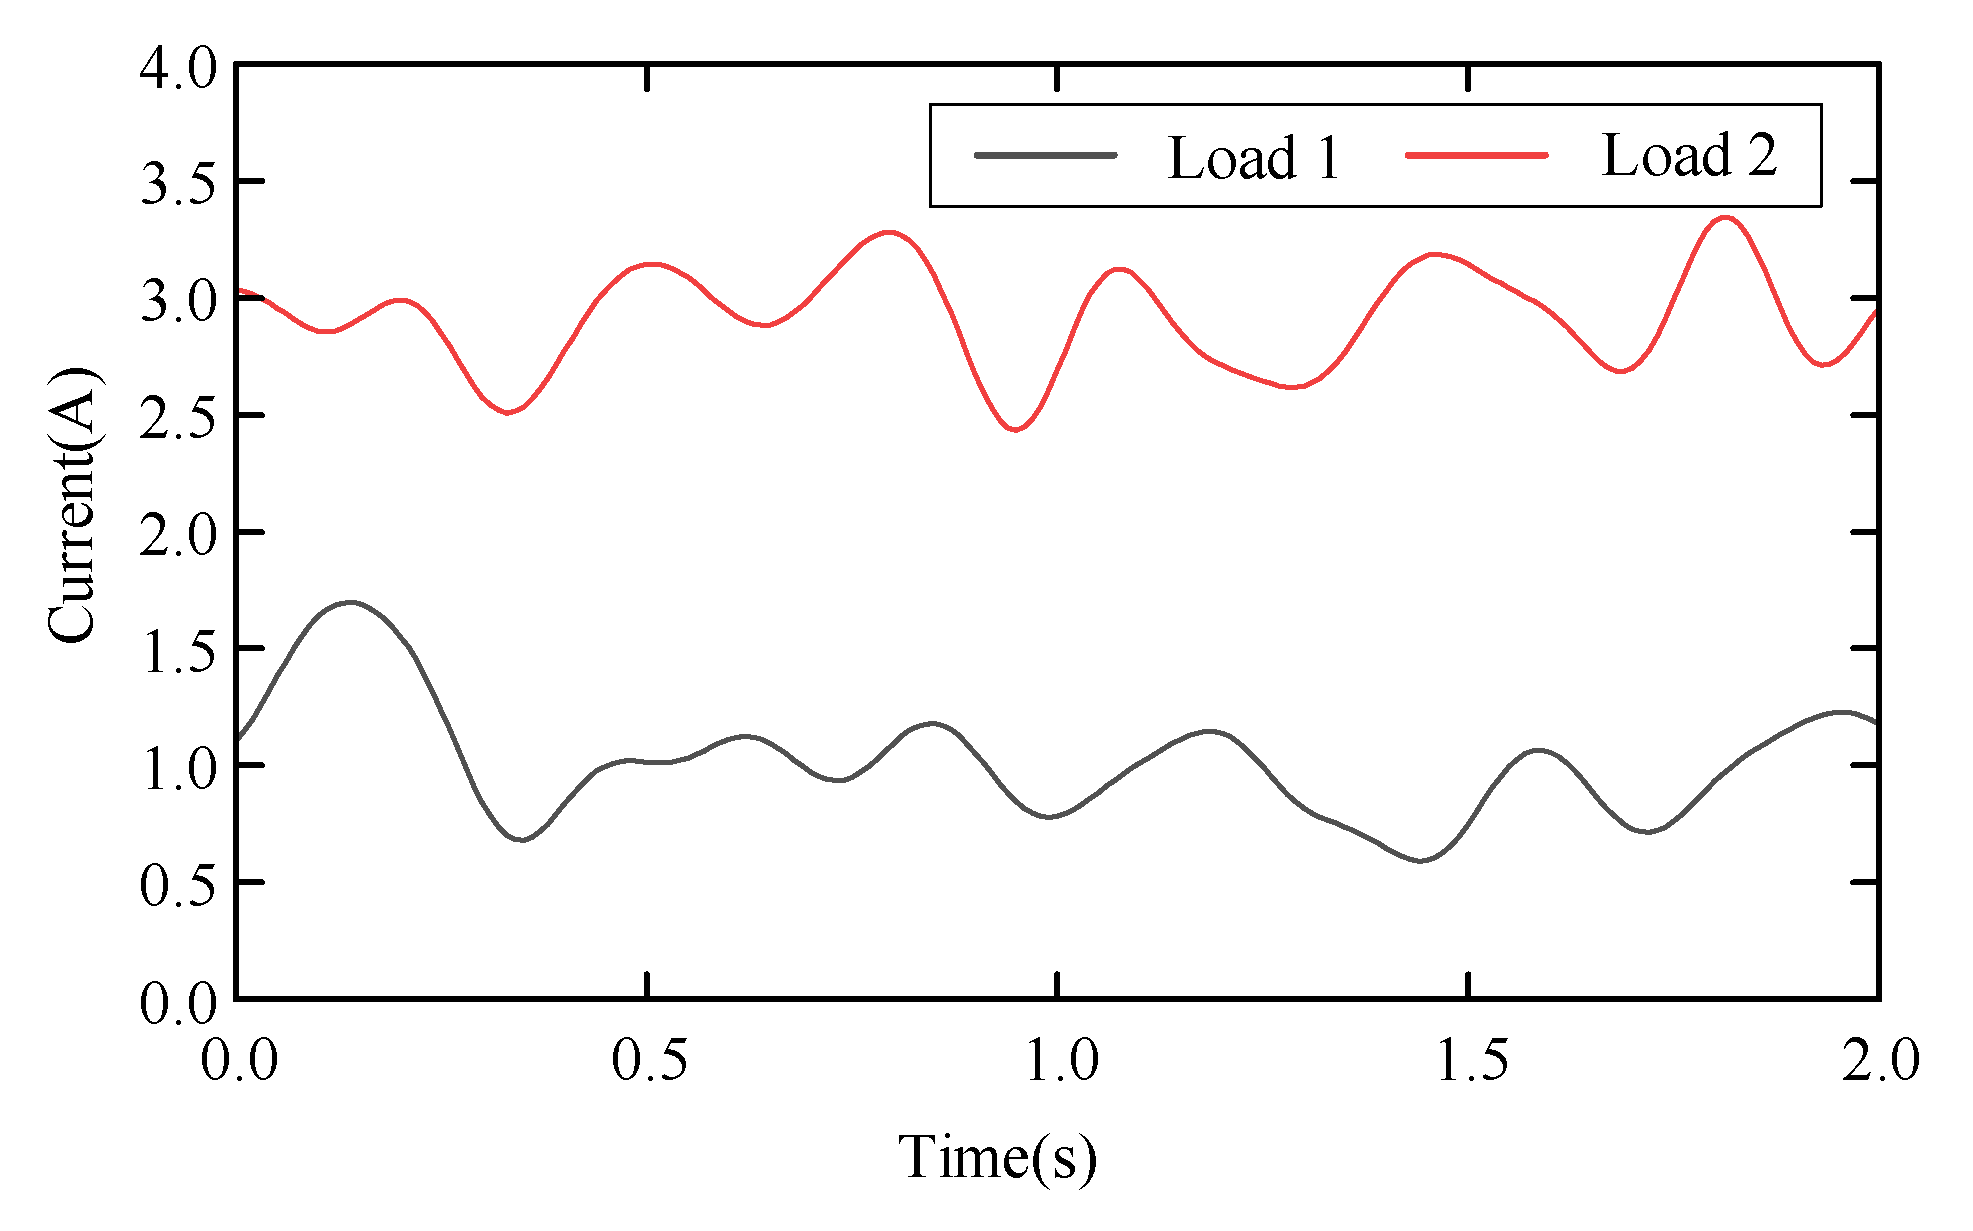
Finally, the system’s performance under slowly varying load conditions is analyzed. The variation curve of load current is shown in Figure 22, with simulation results shown in Figure 23. A communication interruption occurs between DG5 and centralized controller at t = 0.2   s , which recovers at t = 0.6     s . The simulation results demonstrate that the control system maintains effective voltage regulation. Although the precision is slightly reduced compared to steady-state conditions, it remains within acceptable limits throughout the load variation period.
Under communication faults, voltage-control overshoots are constrained to 0.09%. The convergence of the algorithm is achieved within 560 μ s . The error between actual and target currents is maintained at 0.06%, demonstrating the system’s capability for voltage regulation. Notably, current responses across all DGs remain synchronized, aligning closely with the slow load variations. Overall, the comprehensive simulation results validate the effectiveness of the proposed hierarchical hybrid control algorithm across various challenging operating conditions. Through adaptive voltage regulation and accurate current sharing, the proposed algorithm ensures the reliability and efficiency of DC microgrids.

6.3.4. Long-Term Load Variation

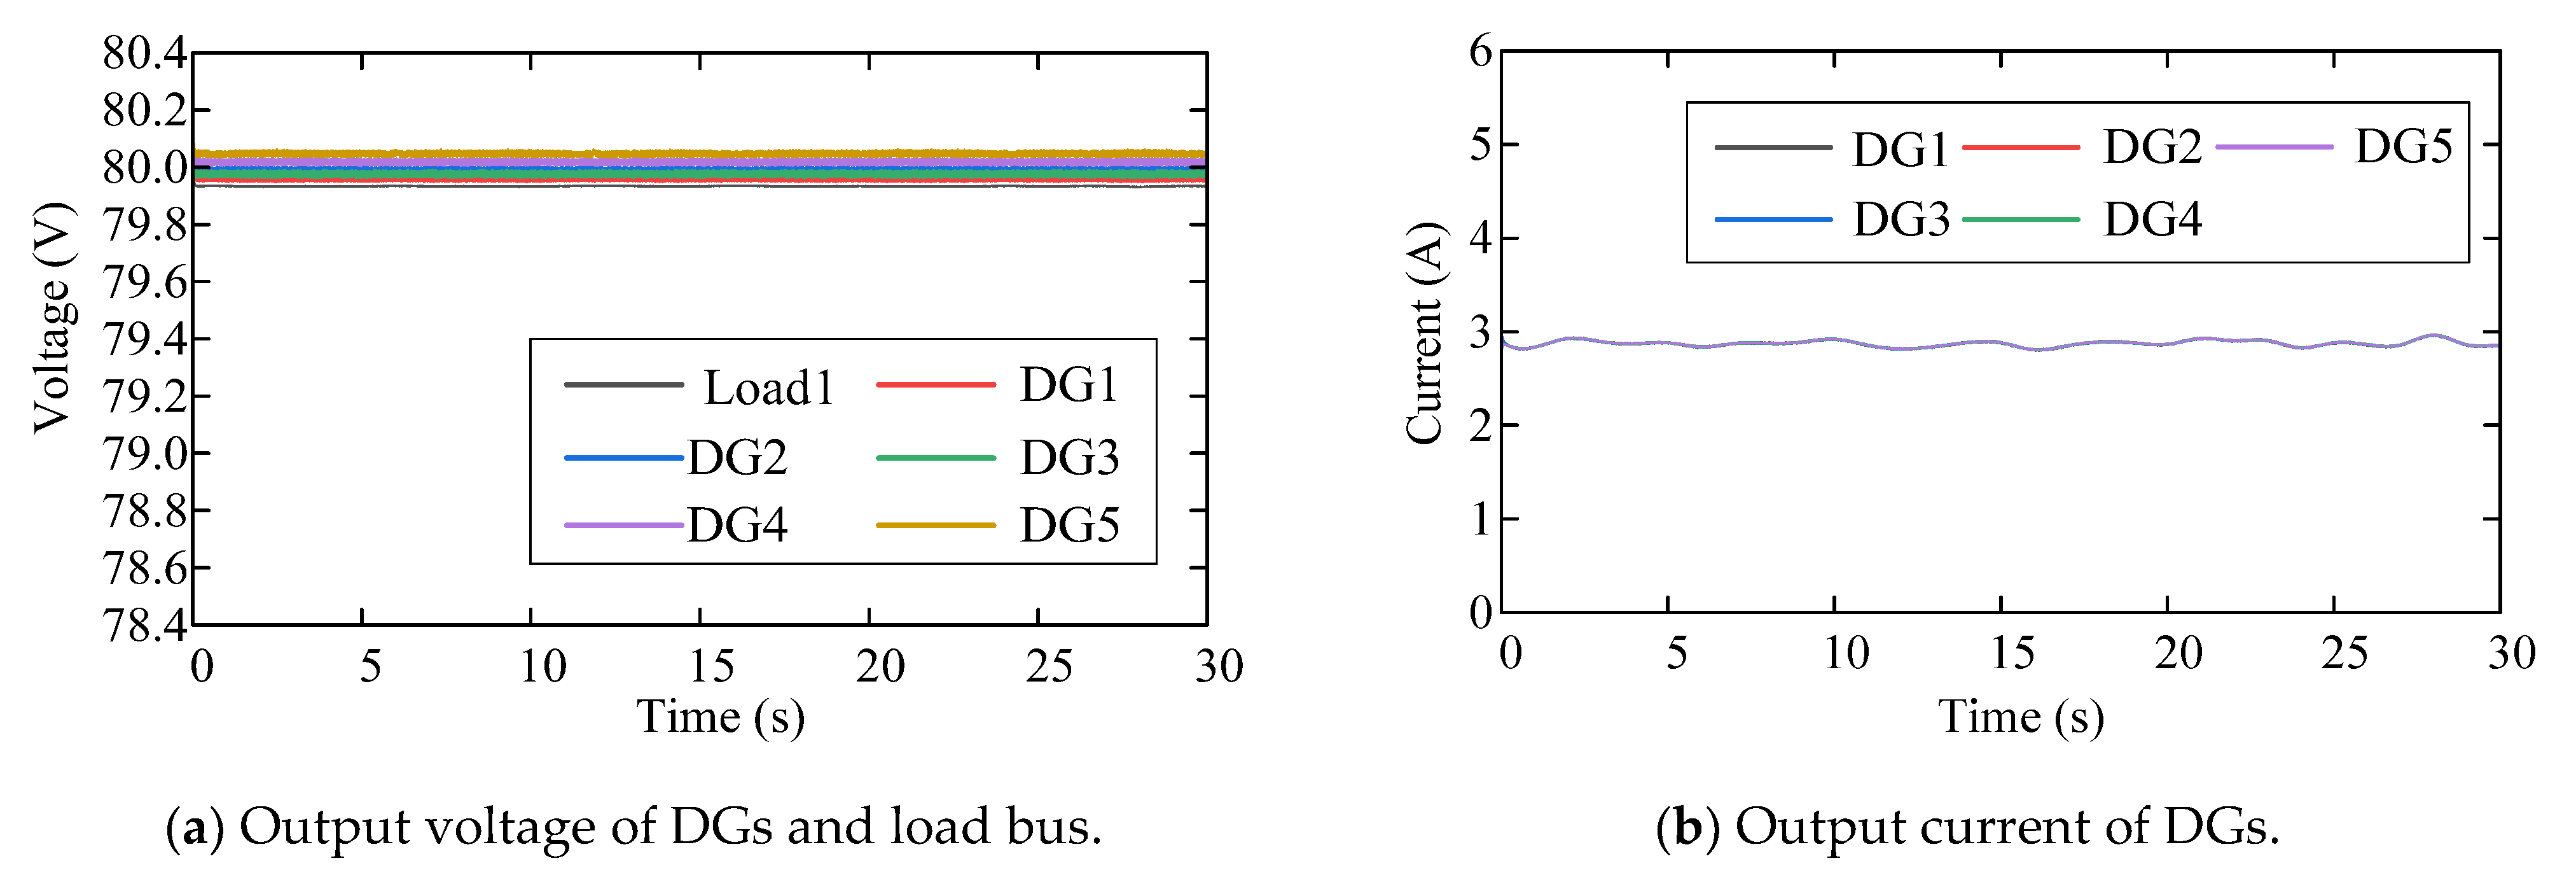
This section validates the proposed algorithm using field-measured load data from a region in China. Due to the sampling interval limitation of the actual measurements, high-resolution load curves were constructed through interpolation for dynamic simulation, ensuring consistency with the overall trend of measured data. Random fluctuations were then superimposed on the curves to emulate high-frequency variations at short timescales. The daily load profile of the Chinese region generated by the proposed method is illustrated in Figure 24. Since transient response processes in power systems typically complete within seconds to tens of seconds, a 30 s time-domain simulation window was adopted in this study, which sufficiently covers the dynamic convergence characteristics of controllers.
As shown in Figure 25, during long-term load fluctuations, the voltage-control overshoot remains limited to 1.74%, while the algorithm achieves convergence within 1500 μ s . The deviation between reference and measured currents is restricted to just 0.06%, highlighting the high precision of current regulation. Moreover, the current responses of all DG units remain well synchronized and consistently track the long-term load variations, indicating that the system sustains reliable control performance over extended time scales. These results collectively confirm that the proposed hierarchical hybrid control strategy performs effectively under diverse and demanding operating conditions. By enabling adaptive voltage stabilization and precise current sharing, the strategy enhances both the reliability and efficiency of DC microgrid operation.

6.3.5. Validation of Fault Detection Logic

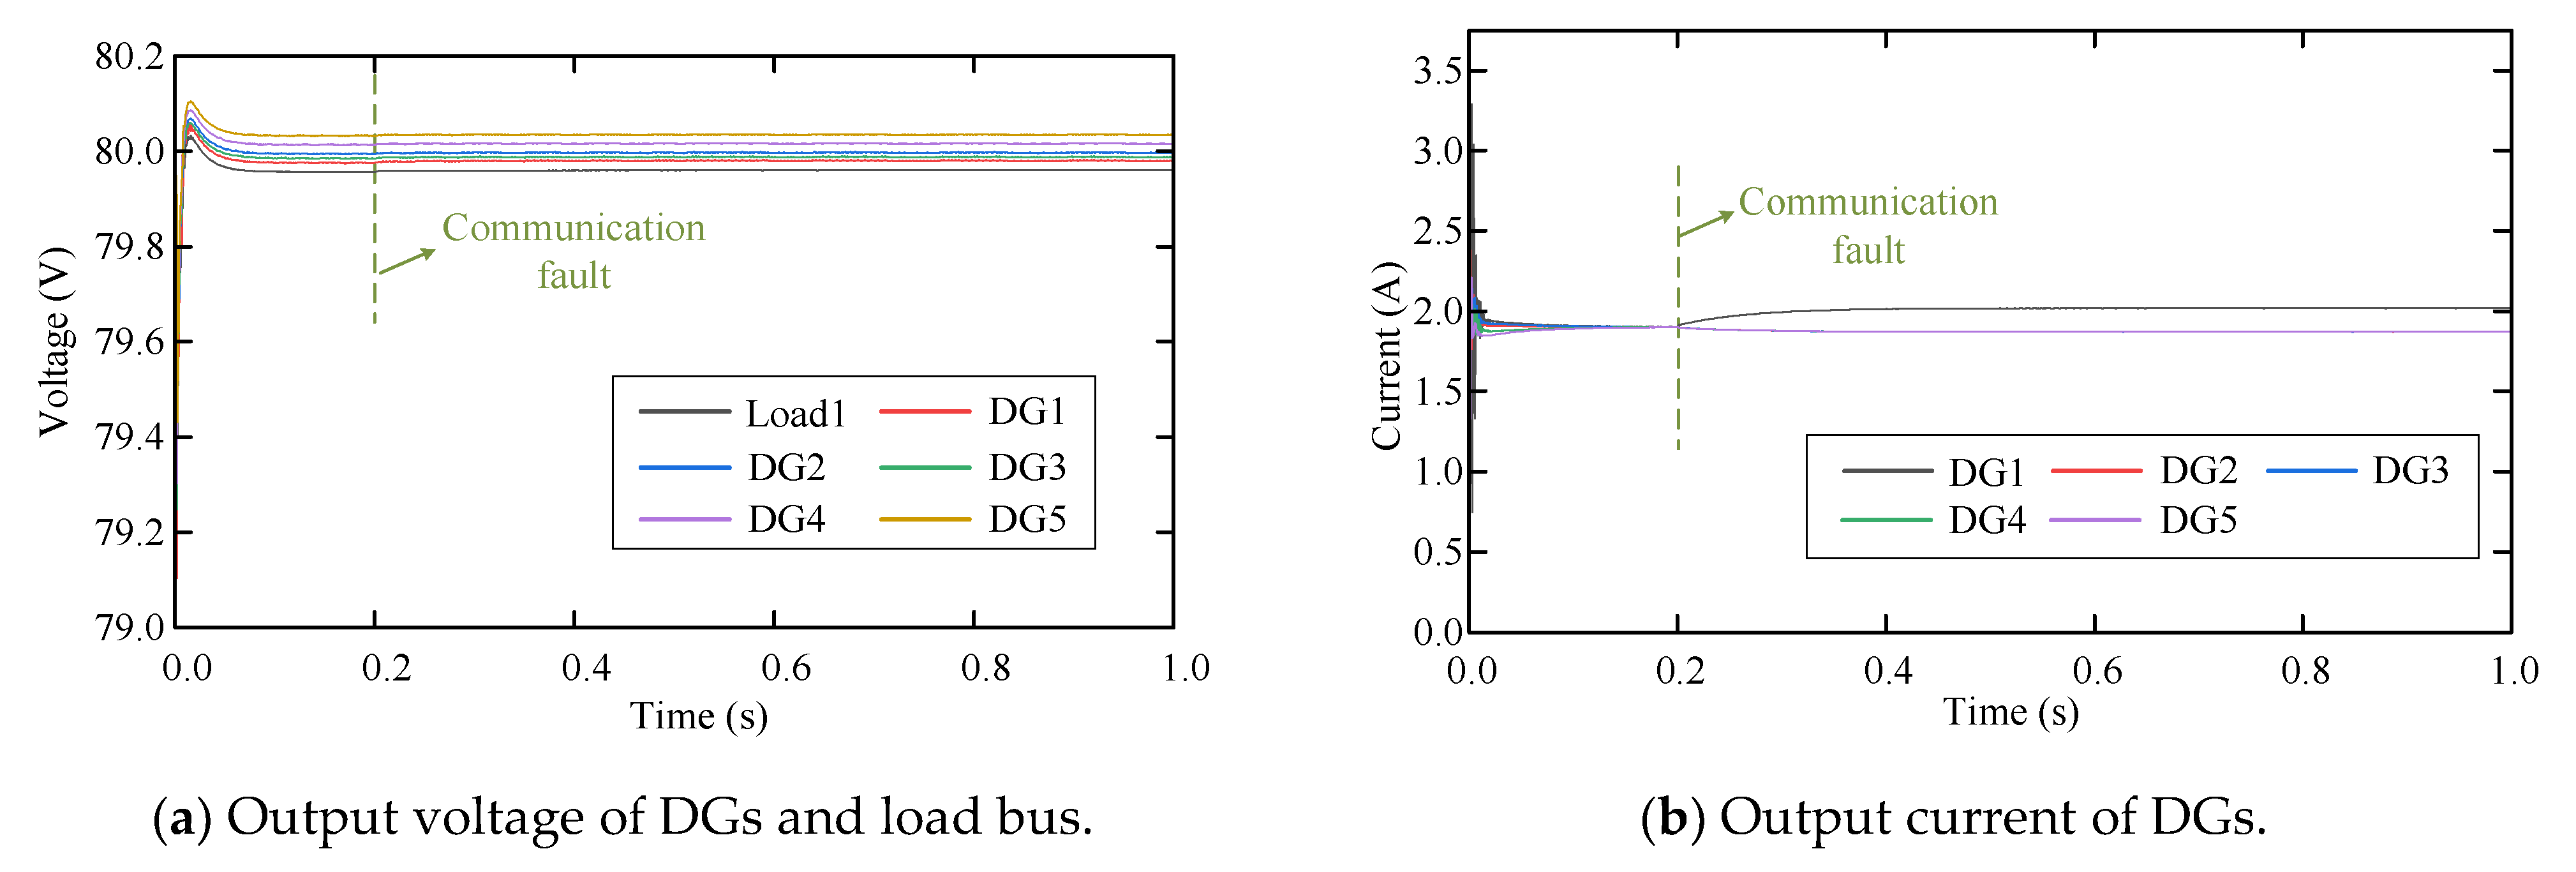
Subsequently, the effectiveness of the proposed fault detection logic is analyzed. Statistical evaluation was conducted across all predefined simulation scenarios, which include N-1 and N-2 contingencies as well as load disturbances. The proposed detection logic yields a false-positive rate of 0% and a false-negative rate of 11.11%. The missed detections occurred primarily in cases where DG1 and DG3 experienced N-1 faults, and the corresponding voltage and current waveforms are illustrated in Figure 26 and Figure 27. In the first missed detection case, the maximum deviations of voltage and current were 0.04% and 6.26%, respectively, while in the second case, the maximum deviations were 0.04% and 3.91%. It can be observed that the deviations in these scenarios are relatively small, which explains the occurrence of missed detections; however, they did not compromise the system’s stable operation. Overall, the proposed detection logic can effectively identify severe faults that pose significant risks to the system, thereby ensuring satisfactory voltage and current control performance.

6.3.6. Overall Performance

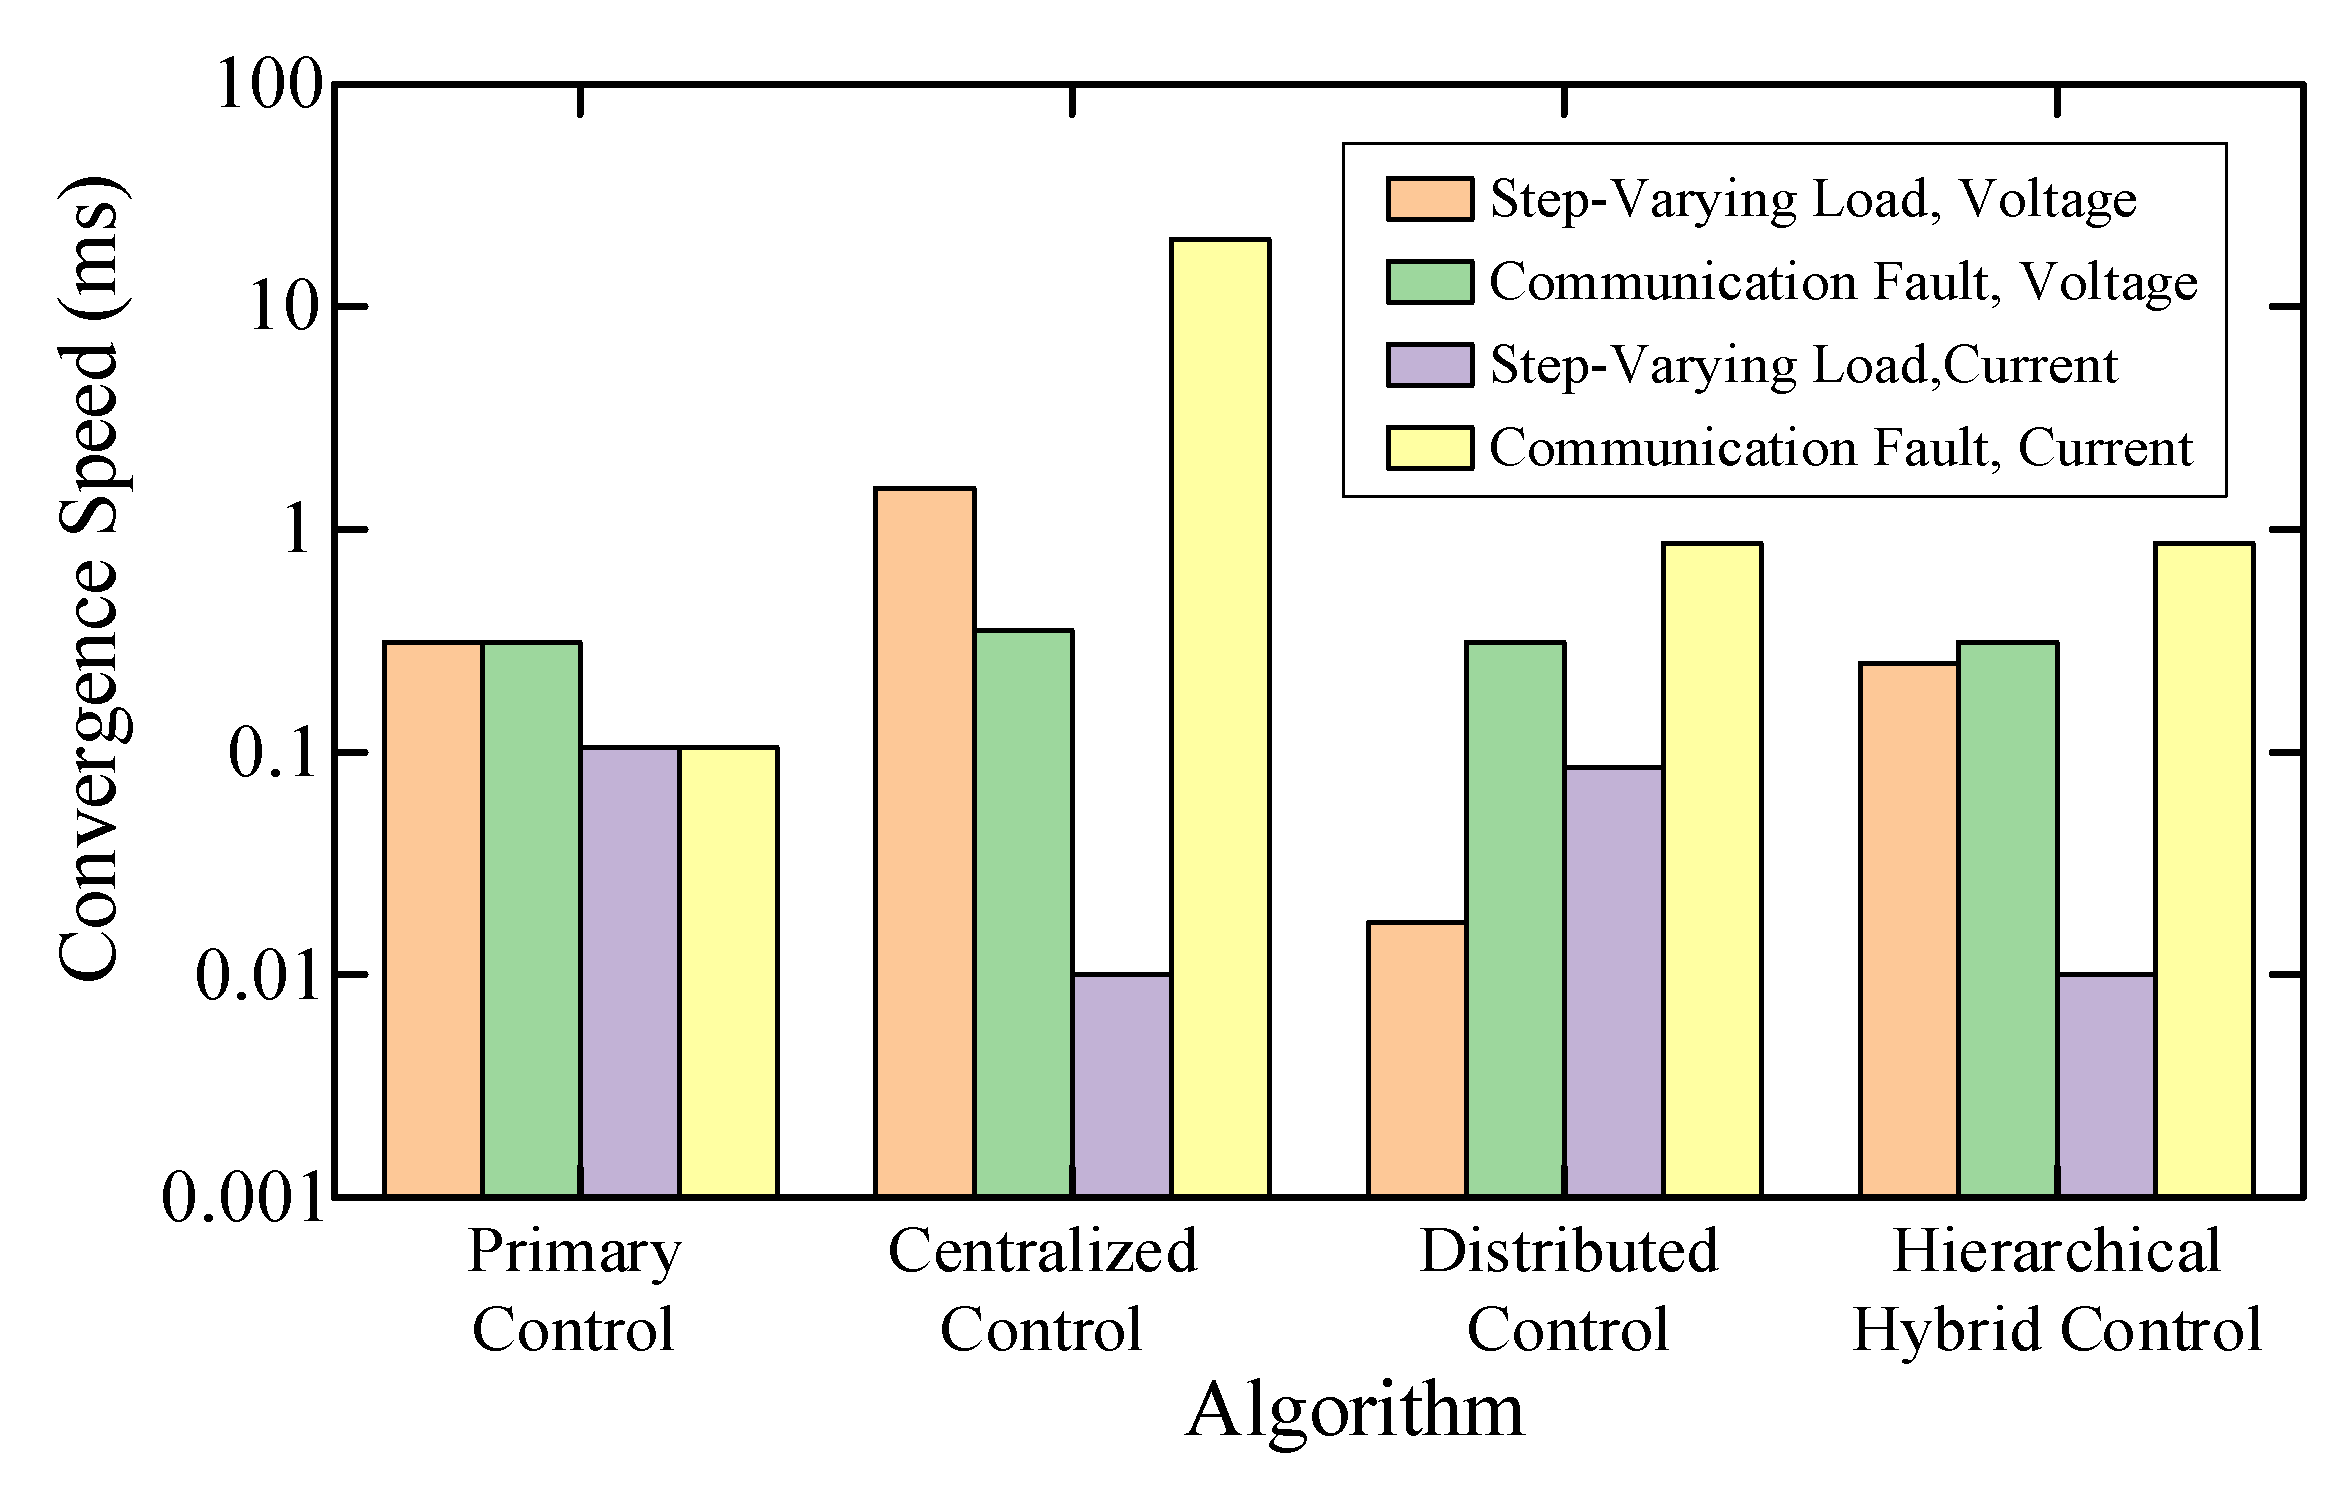
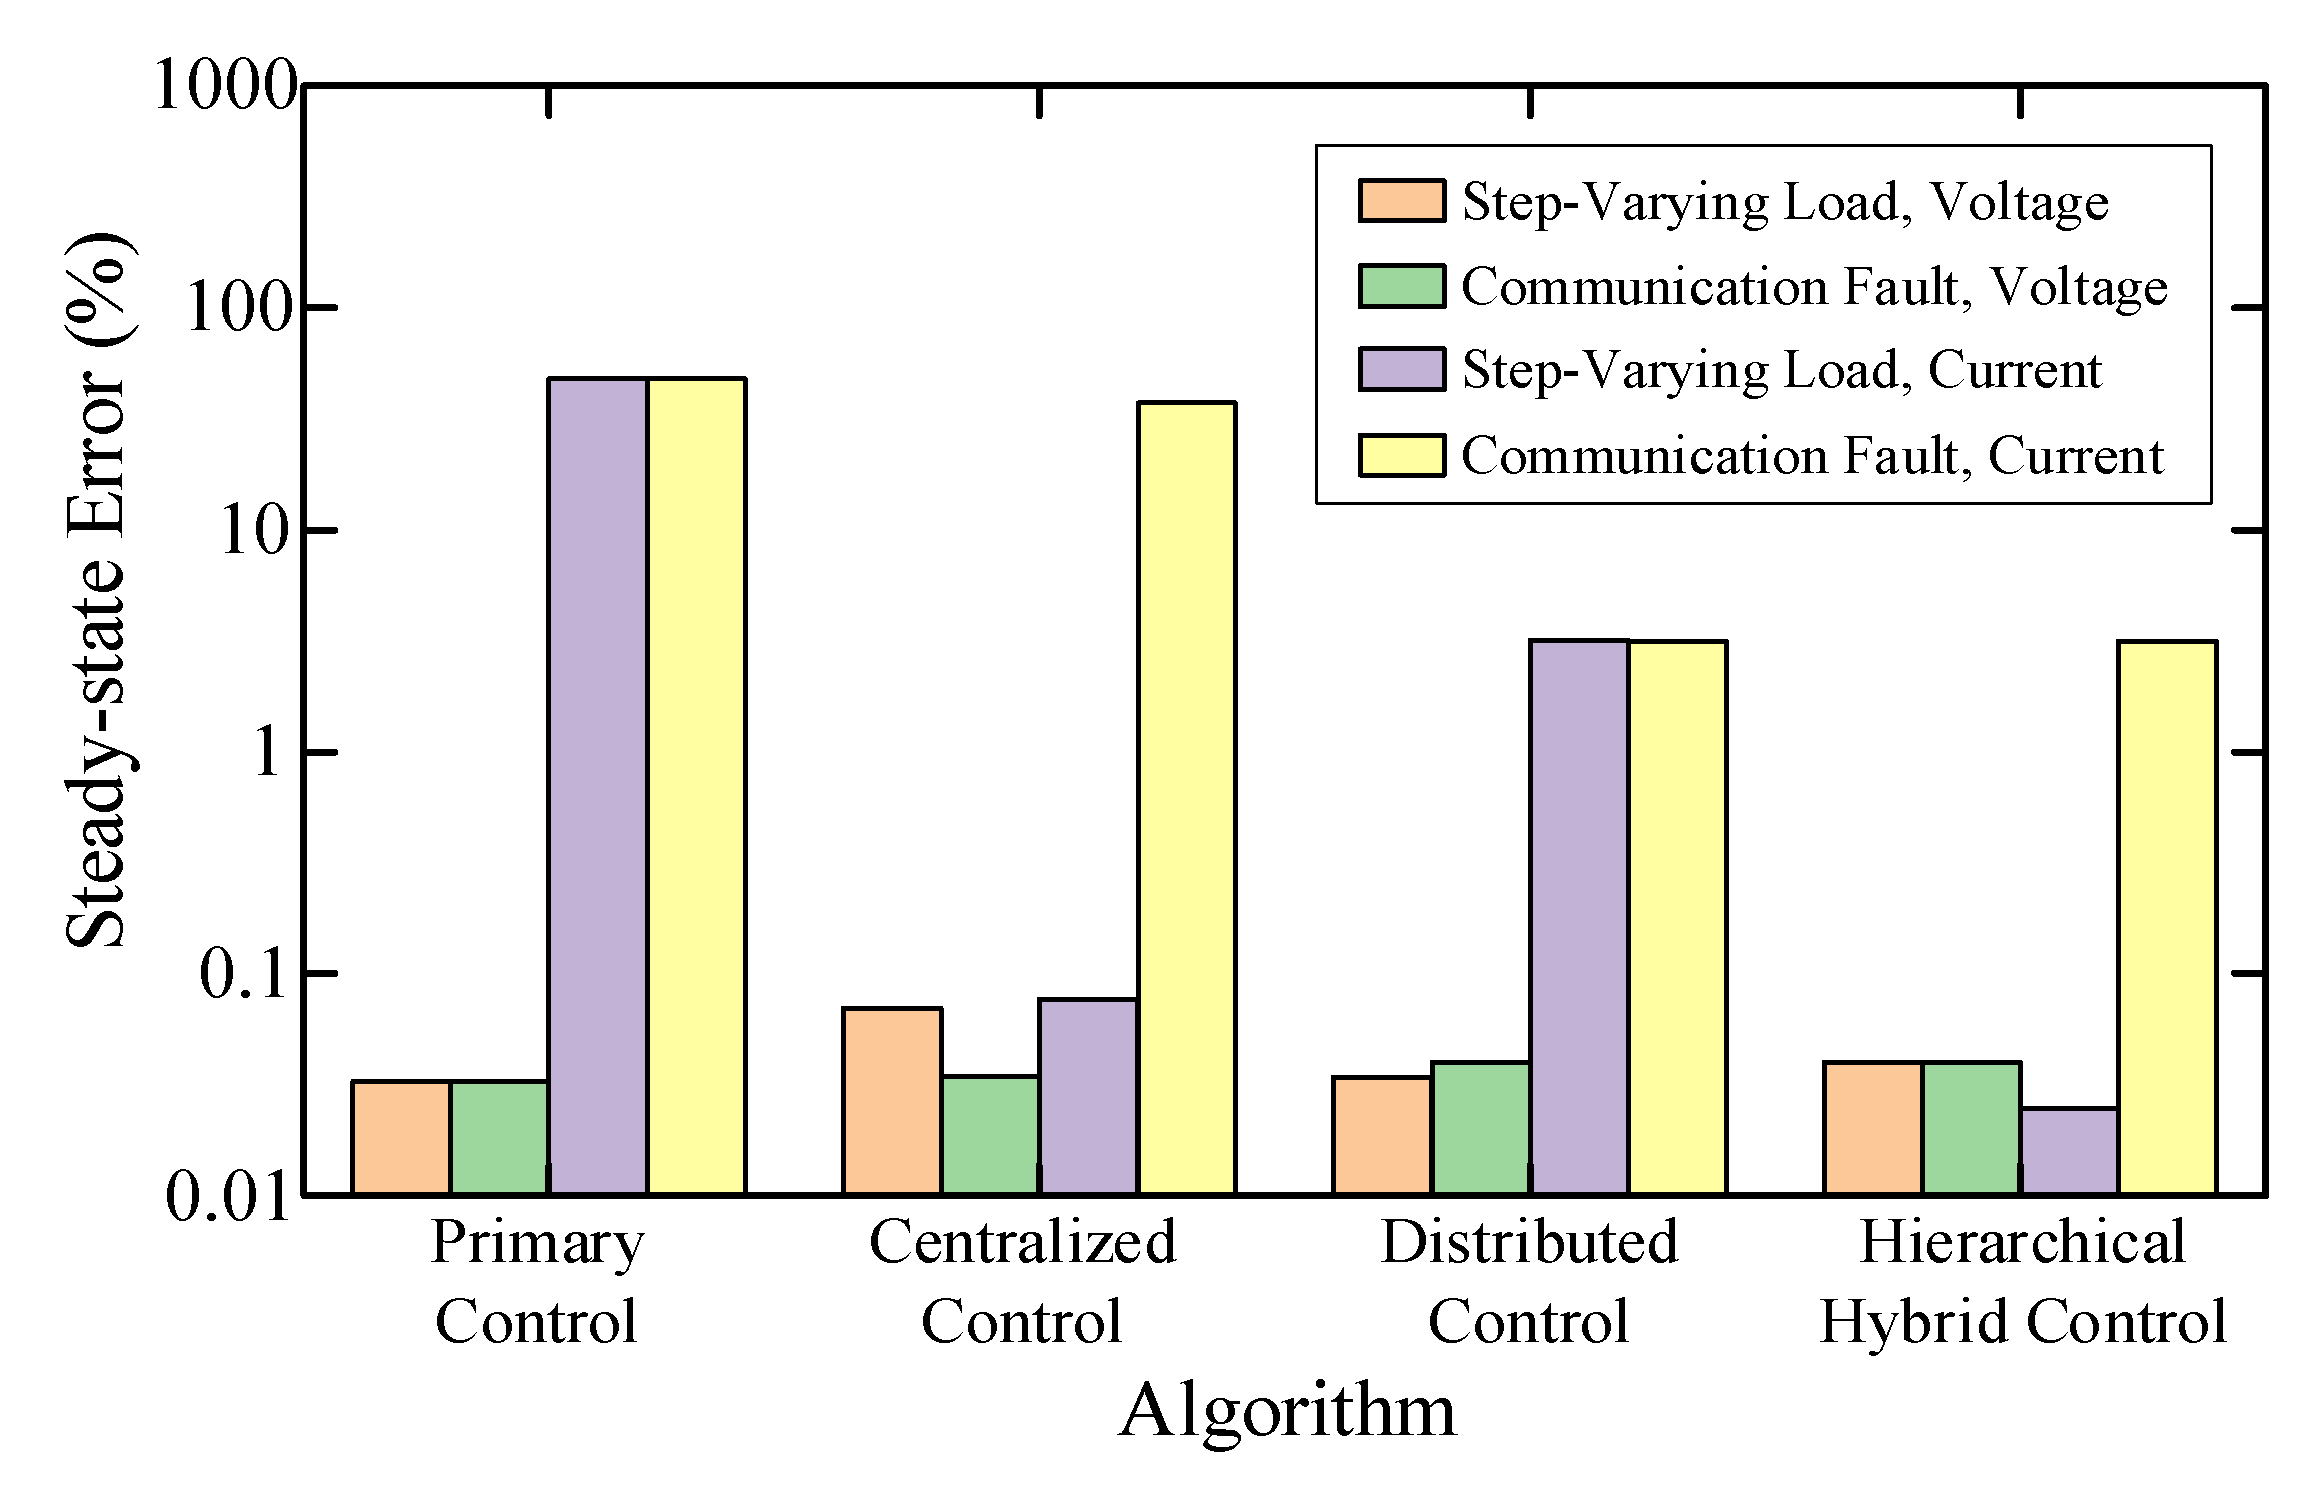
The effectiveness comparison of primary control, centralized control, distributed control, and the proposed control algorithm is presented in Figure 28, Figure 29 and Figure 30. Due to the significant variation in voltage and current regulation performance under different operating conditions, the vertical axes in Figure 28, Figure 29 and Figure 30 are plotted on a logarithmic scale. It can be observed that, under normal operating conditions, centralized control achieves higher control precision, with a steady-state error of no more than 0.08% in current sharing. Compared with centralized control, primary control and distributed control exhibit slightly inferior steady-state performance. Specifically, the steady-state error of primary control is 47.50%, while that of distributed control is 3.16%. However, as shown in Figure 28, the centralized control strategy demonstrates a convergence time of 19,983 μ s under communication fault, which is substantially longer than that of the primary and distributed control approaches (105 μ s and 869 μ s , respectively). What is more, as demonstrated in Figure 29 and Figure 30, centralized control exhibits an overshoot of 37.39% and a steady-state error of 37.38%, both of which are significantly higher than those observed in distributed control and hierarchical hybrid control, indicating poor robustness under N-1 operating scenarios. In contrast, the proposed algorithm demonstrates the best control performance under fault conditions, with a steady-state error of 3.15% and an overshoot of 9.05%. Although the proposed algorithm demonstrates inferior convergence speed compared to primary control, Figure 29 and Figure 30 reveals its substantially superior control accuracy. Overall, the proposed hierarchical control framework excels in multiple aspects, including control precision, fault robustness, and convergence speed, providing an effective solution for microgrid control.

6.3.7. Scalability and Robustness Discussion

The experimental results confirm the effectiveness of the proposed methodology in systems of varying scales. A further question is whether the planning model and control algorithm remain applicable in much larger microgrid systems. Based on the analysis above, both the planning model and the distributed control algorithm can be extended to larger-scale microgrid systems. The main challenge of scaling up the planning model lies in the increased computational burden, as the optimization problem requires longer solving time and slower convergence. Nevertheless, as demonstrated in Section 6.1, systems of different scales were tested, and the results show that the convergence of the planning model remains within an acceptable range, thereby satisfying the requirements for topology design in microgrids planning.
For systems with a larger number of nodes, the distributed consensus algorithm primarily faces challenges such as communication delays and link failures. To address these issues, communication links with excessive delays or high packet-loss probabilities are already excluded during the planning stage through dedicated constraints. In addition, potential single-point failures are mitigated by incorporating N-1 convergence constraints into the proposed model. Consequently, the core challenges that may arise in large-scale microgrid systems are effectively addressed through topology design at the offline planning stage, which significantly enhances the applicability and reliability of the proposed control framework in practical large-scale systems.

7. Conclusions

In this article, the voltage-control and power-regulation algorithms of DC microgrids are studied. A hybrid hierarchical control architecture integrating multiple control strategies is proposed to achieve deviation-free voltage regulation and precise power sharing in DC microgrids. For the inherent trade-off between consensus algorithm performance and communication costs, a communication topology optimization model is established with communication cost as the objective, subject to constraints including communication intensity, algorithm convergence, and control performance requirements. Through iterative model verification via repeated solutions, the feasibility of the proposed communication planning model is demonstrated. Applying the optimal topologies obtained from solutions, simulations of the proposed control algorithms in MATLAB/Simulink are conducted to verify the superior performance of the developed control strategies. The experimental results confirm that the proposed control framework enables automatic switching across different operating conditions, while maintaining robust control performance under fault scenarios, with maximum steady-state error e s s < 3.15 % , convergence time t c < 1500   μ s , and maximum overshoot M p < 10 % .
In future research, we plan to build upon the current simulation-based analysis by developing a hardware-in-the-loop experimental platform. This will enable us to conduct empirical validation of the improved algorithm under more realistic operating conditions, thereby bridging the gap between simulation and practical implementation. Such experimental studies will provide stronger evidence for the algorithm’s effectiveness in real microgrid systems and further enhance the credibility and applicability of the proposed control framework.

Author Contributions

Methodology, A.H. and A.S.; software, Y.T.; validation, Y.T. and A.H.; writing—original draft preparation, Y.T.; writing—review and editing, A.H., L.G. and A.S.; visualization, Y.T.; supervision, A.H. and L.G.; funding acquisition, L.G. All authors have read and agreed to the published version of the manuscript.

Funding

This research was funded by Science and Technology Project of China Southern Power Grid (YNKJXM20222400). And The APC was funded by China Southern Power Grid.

Data Availability Statement

Data is contained within the article.

Conflicts of Interest

The authors declare no conflict of interest.

References

  1. Zhang, L.; Yang, Y.; Li, Q.; Gao, W.; Qian, F.; Song, L. Economic optimization of microgrids based on peak shaving and CO2 reduction effect: A case study in Japan. J. Clean. Prod. 2021, 321, 128973. [Google Scholar] [CrossRef]
  2. Dou, Y.; Chi, M.; Liu, Z.; Wen, G.; Sun, Q. Distributed Secondary Control for Voltage Regulation and Optimal Power Sharing in DC Microgrids. IEEE Trans. Control Syst. Technol. 2022, 30, 2561–2572. [Google Scholar] [CrossRef]
  3. Cucuzzella, M.; Trip, S.; De Persis, C.; Cheng, X.; Ferrara, A.; Van Der Schaft, A. A Robust Consensus Algorithm for Current Sharing and Voltage Regulation in DC Microgrids. IEEE Trans. Control Syst. Technol. 2019, 27, 1583–1595. [Google Scholar] [CrossRef]
  4. Gao, F.; Kang, R.; Cao, J.; Yang, T. Primary and secondary control in DC microgrids: A review. J. Mod. Power Syst. Clean Energy 2019, 7, 227–242. [Google Scholar] [CrossRef]
  5. Tah, A.; Das, D. An Enhanced Droop Control Method for Accurate Load Sharing and Voltage Improvement of Isolated and Interconnected DC Microgrids. IEEE Trans. Sustain. Energy 2016, 7, 1194–1204. [Google Scholar] [CrossRef]
  6. Mohammed, N.; Callegaro, L.; Ciobotaru, M.; Guerrero, J.M. Accurate power sharing for islanded DC microgrids considering mismatched feeder resistances. Appl. Energy 2023, 340, 121060. [Google Scholar] [CrossRef]
  7. Mokhtar, M.; Marei, M.I.; El-Sattar, A.A. Improved Current Sharing Techniques for DC Microgrids. Electr. Power Compon. Syst. 2018, 46, 757–767. [Google Scholar] [CrossRef]
  8. Peyghami, S.; Mokhtari, H.; Davari, P.; Loh, P.C.; Blaabjerg, F. On Secondary Control Approaches for Voltage Regulation in DC Microgrids. IEEE Trans. Ind. Appl. 2017, 53, 4855–4862. [Google Scholar] [CrossRef]
  9. Wan, Q.; Zheng, S. Distributed cooperative secondary control based on discrete consensus for DC microgrid. Energy Rep. 2022, 8, 8523–8533. [Google Scholar] [CrossRef]
  10. Chen, Y.; Wan, K.; Zhao, J.; Yu, M. Accurate consensus-based distributed secondary control with tolerance of communication delays for DC microgrids. Int. J. Electr. Power Energy Syst. 2024, 155, 109636. [Google Scholar] [CrossRef]
  11. Meng, L.; Dragicevic, T.; Roldan-Perez, J.; Vasquez, J.C.; Guerrero, J.M. Modeling and Sensitivity Study of Consensus Algorithm-Based Distributed Hierarchical Control for DC Microgrids. IEEE Trans. Smart Grid 2016, 7, 1504–1515. [Google Scholar] [CrossRef]
  12. Chen, X.; Gao, S.; Zhang, S.; Zhao, Y. On topology optimization for event-triggered consensus with triggered events reducing and convergence rate improving. IEEE Trans. Circuits Syst. II Express Briefs 2022, 69, 1223–1227. [Google Scholar] [CrossRef]
  13. Xu, T.; Tan, Y.Y.; Gao, S.; Zhan, X. Interaction topology optimization by adjustment of edge weights to improve the consensus convergence and prolong the sampling period for a multi-agent system. Appl. Math. Comput. 2025, 500, 129428. [Google Scholar] [CrossRef]
  14. MathWorks. What Is Droop Control? Available online: https://www.mathworks.com/discovery/droop-control.html (accessed on 5 August 2025).
  15. Lu, X.; Guerrero, J.M.; Sun, K.; Vasquez, J.C. An improved droop control method for dc microgrids based on low bandwidth communication with dc bus voltage restoration and enhanced current sharing accuracy. IEEE Trans. Power Electron. 2014, 29, 1800–1812. [Google Scholar] [CrossRef]
  16. Wang, X.; Wang, S.; Liu, J.; Wu, Y.; Sun, C. Bipartite finite-time consensus of multi-agent systems with intermittent communication via event-triggered impulsive control. Neurocomputing 2024, 598, 127970. [Google Scholar] [CrossRef]
  17. Heinzelman, W.B.; Chandrakasan, A.P.; Balakrishnan, H. An application-specific protocol architecture for wireless microsensor networks. IEEE Trans. Wirel. Commun. 2002, 1, 660–670. [Google Scholar] [CrossRef]
  18. Xiao, L.; Boyd, S. Fast linear iterations for distributed averaging. Syst. Control. Lett. 2004, 53, 65–78. [Google Scholar] [CrossRef]
  19. Esrafilian, O.; Bayerlein, H.; Gesbert, D. Model-aided deep reinforcement learning for sample-efficient UAV trajectory design in IoT networks. In Proceedings of the 2021 IEEE Global Communications Conference (GLOBECOM), Madrid, Spain, 7–11 December 2021; pp. 1–6. [Google Scholar] [CrossRef]
  20. Jiang, X.; Bunke, H. Optimal quadratic-time isomorphism of ordered graphs. Pattern Recognit. 1999, 32, 1273–1283. [Google Scholar] [CrossRef]
  21. OEIS Foundation Inc. Sequence A000088: Number of Graphs on n Unlabeled Nodes. In the On-Line Encyclopedia of Integer Sequences. Available online: https://oeis.org/A000088 (accessed on 5 August 2025).
  22. Manso, B.A.S.; Leite da Silva, A.M.; Milhorance, A.; Assis, F.A. Composite reliability assessment of systems with grid-edge renewable resources via quasi-sequential Monte Carlo and cross-entropy techniques. IET Gener. Transm. Distrib. 2024, 18, 326–336. [Google Scholar] [CrossRef]
  23. Shu, H.; Dong, H.; Zhao, H.; Xu, C.; Yang, Y.; Zhao, X. Reliability analysis of electrical system in ±800 kV VSC-DC converter station. Electr. Power Autom. Equip. 2023, 43, 119–126. (In Chinese) [Google Scholar] [CrossRef]
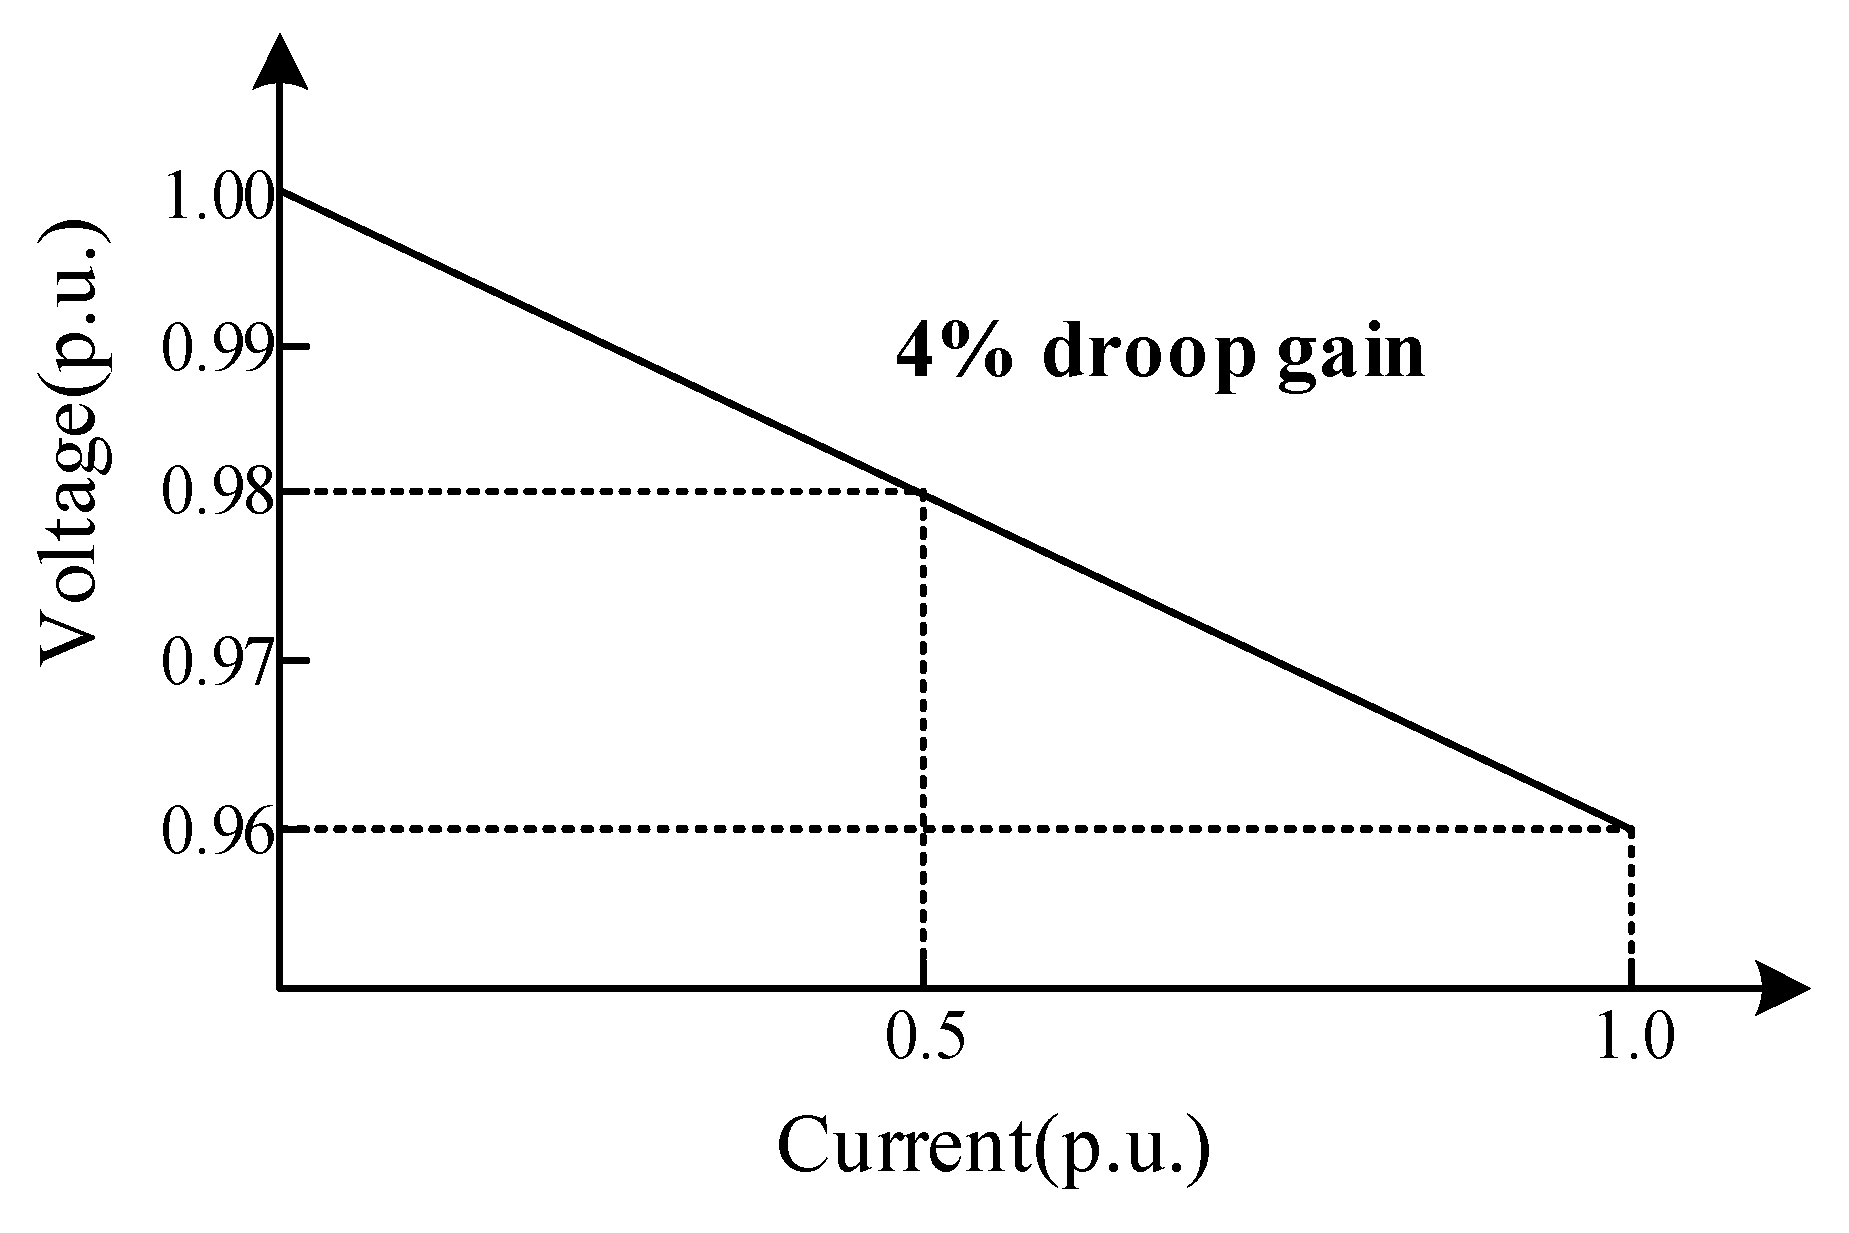
Figure 1. Basic principle of droop control.
Electronics 14 03797 g001
Figure 2. Thevenin equivalent model of an i-agent’s DC microgrid.
Electronics 14 03797 g002
Figure 3. DC microgrids under centralized control.
Electronics 14 03797 g003
Figure 4. Structure of proposed operation-condition-adaptive hierarchical control.
Electronics 14 03797 g004
Figure 5. Decision tree within the OCAHC framework.
Electronics 14 03797 g005
Figure 6. Control logic of operation-condition-adaptive strategy.
Electronics 14 03797 g006
Figure 7. Communication topology.
Electronics 14 03797 g007
Figure 8. Structure of proposed distributed control.
Electronics 14 03797 g008
Figure 9. Flowchart of the model-solving process.
Electronics 14 03797 g009
Figure 10. Two-state model for repairable equipment.
Electronics 14 03797 g010
Figure 11. Simulation results for availability and MTBF under different cases.
Electronics 14 03797 g011
Figure 12. Configuration of the DC microgrid.
Electronics 14 03797 g012
Figure 13. Convergence time of different algorithms.
Electronics 14 03797 g013
Figure 14. Convergence curve of topology planning. (Only three representative lines are shown in the legend, while all other lines denote individual experiments.)
Electronics 14 03797 g014
Figure 15. Optimal cost of different scale systems.
Electronics 14 03797 g015
Figure 16. Topology of different schemes.
Electronics 14 03797 g016
Figure 17. Performance of primary control.
Electronics 14 03797 g017
Figure 18. Performance of distributed control.
Electronics 14 03797 g018
Figure 19. Performance of centralized control.
Electronics 14 03797 g019
Figure 20. Performance of proposed control under communication fault.
Electronics 14 03797 g020
Figure 21. Performance of proposed control under step-varying load.
Electronics 14 03797 g021
Figure 22. Variation in load current.
Electronics 14 03797 g022
Figure 23. Performance of proposed control under slow-varying load and communication fault.
Electronics 14 03797 g023
Figure 24. Actual load profile of a Chinese region.
Electronics 14 03797 g024
Figure 25. Performance of proposed control under long-term load variation.
Electronics 14 03797 g025
Figure 26. Performance of proposed control under missed detection case 1.
Electronics 14 03797 g026
Figure 27. Performance of proposed control under missed detection case 2.
Electronics 14 03797 g027
Figure 28. Convergence speed of voltage and current regulation under different algorithms.
Electronics 14 03797 g028
Figure 29. Steady-state error of voltage and current regulation under different algorithms.
Electronics 14 03797 g029
Figure 30. Overshoot of voltage and current regulation under different algorithms.
Electronics 14 03797 g030
Table 1. Comparison of the constraints considered by different studies.
ReferenceControl
Performance
Qualitative
Topology Analysis
Topology
Planning Model
N-1
Constraint
Communication Energy ConsumptionCommunication Link Reliability
[2]×××××
[10]×××××
[11]××××
[12]×××
[13]×××
Table 2. Number of labeled and non-isomorphic graphs.
Number of Agent(s)Number of Labeled Graph(s)Number of Non-Isomorphic Graph(s)
120 = 11
221 = 22
323 = 84
426 = 6411
5210 = 102434
6215 = 32,768156
7221 = 2,097,1521044
8228 = 268,435,45612,346
9236 = 68,719,476,736274,668
10245 = 35,184,372,088,83212,005,168
Table 3. Availability and MTBF under different cases.
Case 1Case 2Case 3Case 4
Availability (Analytical Results)0.99740.99760.99961.0000
Availability (MC Results)0.99840.99860.99961.0000
MTBF (MC Results)/h5352.605609.506711.408760.00
Table 4. Simulation parameters of DC microgrid.
System ParametersValue
Vrated80 V
Rs0.010 Ω
C1 2.2 × 10 3   F
Rline10.010 Ω
Rline20.020 Ω
Rline30.015 Ω
Rline40.030 Ω
Rline50.040 Ω
RL120 Ω
RL220 Ω
TCA 10   μ s
time step 1   μ s
Table 5. Geographical distance between buses.
From BusTo BusDistance/m
DG1DG287
DG1DG3134
DG1DG4111
DG1DG5158
DG2DG387
DG2DG464
DG2DG5111
DG3DG453
DG3DG5100
DG4DG568
Table 6. Simulation parameters of controllers.
Control ParametersValue
Kic97
Kpc1
Kiv800
Kpv4
Kisc8
Kpsc0.4
Kisv80
Kpsv0.4
Table 7. Parameters related to cost function.
Unit CostValueUnit CostValue
Celec0.15 (USD/kWh)Ctm3 (USD)
Cctr70 (USD)mra0.1
Csw30 (USD)mre0.05
Cgw55 (USD) E T x , i p u 50 (nJ/bit)
Cnd10 (USD) E R x , i p u 50 (nJ/bit)
Cfd20 (USD) E d e , i p u 5 (nJ/bit)
Cs50 (USD) ε f s 10 ( pJ / bit / m 2 )
Cca1.20 (USD/m) ε m p 0.0013 ( pJ / bit / m 4 )
Table 8. Convergence speed of topology planning.
Number of AgentsConvergence Speed/s
(with Isomorphic Graph Recognition)
Convergence Speed/s
(without Isomorphic Graph Recognition)
50.46070.6122
1025.966158.1719
15365.7051921.1013
204603.649917,021.6014
257854.582563,264.7821
Table 9. Statistical characteristics of 5-agents’ topology planning.
Statistical CharacteristicsValue
C ¯ o p 894.35
s 2 1.29 × 10 26
G a v 1.36
p max 100%
Table 10. Economic analysis of topologies.
Scheme 1Scheme 2Scheme 3Scheme 4
Unit Power Consumption749.22894.351000.811145.93
MTBF/h6711.408745.108745.108760.00
Marginal Cost-0.07140.12280.1937
Cost–Benefit Ratio0.11160.10230.11420.1308
Disclaimer/Publisher’s Note: The statements, opinions and data contained in all publications are solely those of the individual author(s) and contributor(s) and not of MDPI and/or the editor(s). MDPI and/or the editor(s) disclaim responsibility for any injury to people or property resulting from any ideas, methods, instructions or products referred to in the content.