Abstract
This project introduces an add-on device that monitors key data points essential for evaluating the daily performance of a photovoltaic (PV) array. It is designed for homeowners who are transitioning to solar energy for economic or environmental benefits. The goal is to enhance the operational understanding for users by offering a smart system capable of detecting inefficiencies, especially for users with limited technical knowledge of PV components. The device measures five parameters: light intensity, temperature, humidity, current, and voltage. These metrics have been successfully integrated and are fully operational. This paper details the electronic design, hardware prototype, and data collected to validate the system’s performance.
1. Introduction
As the global urgency to reduce carbon emissions continues to grow, renewable and sustainable energy sources are rapidly becoming central to the energy market [1,2,3,4]. The cost of installing new solar photovoltaic (PV) systems decreased by 81.3% between 2010 and 2020 [5,6,7,8,9]. Alongside this cost reduction, solar PV capacity in the U.S. surged from 18 megawatts in 2000 to 73,814 megawatts in 2020. Additionally, the U.S. surpassed 2 million solar PV installations as of 2019 [10,11,12,13,14,15]. The rise in solar photovoltaic (PV) technology has significantly transformed the energy landscape. Traditionally, electricity generation was dominated by large corporations due to the high capital costs associated with conventional power plants like coal, hydroelectric, and nuclear facilities [16,17,18,19,20,21]. However, the decreasing cost of solar PV systems now empowers individuals to install their own setups, even on small plots of land. This technological shift supports a new energy paradigm, one where residential users can generate electricity to supplement, or even replace, their reliance on the traditional power grid.
As solar PV installation rates continue to grow, there is increasing interest in having the systems operate under optimal conditions; thus, daily monitoring of their status is valuable. While initial baseline systems have been explored, further progress depends on the development of affordable manufacturing techniques. Several recent studies have proposed low-cost, real-time photovoltaic (PV) monitoring devices for residential or small-scale systems [22,23,24,25]. For instance, Arduino-based sensor nodes with RF backhaul to a Raspberry Pi server provide per-module data collection and visualization, while IoT platforms using ESP32/Arduino microcontrollers transmit voltage, current, temperature, and energy data to cloud dashboards [26]. Other work integrates real-time monitoring with control features [27] or adds machine-learning-enhanced data logging for predictive analysis [28]. Practical data loggers have also been designed for on-grid PV and off-grid solar home systems [29], while open hardware platforms such as OpenEnergyMonitor (emonPi) demonstrate production-grade residential monitoring solutions [30,31,32,33,34]. Together, these devices highlight the common design of microcontroller-based sensing, real-time communication, and low-cost deployment, providing useful comparators for each system. Moreover, a critical component of practical PV monitoring systems is the ability to transmit collected data wirelessly and store it on cloud-based platforms for real-time visualization, long-term analysis, and remote accessibility. By integrating Wi-Fi or low-power communication protocols (e.g., LoRa, ZigBee, or RF modules) with a cloud service, system performance can be monitored continuously without the need for physical data retrieval, enabling timely detection of faults and performance degradation. Cloud integration also facilitates advanced analytics, such as trend detection, predictive maintenance, and cross-comparison across multiple sites, which are essential for improving residential PV adoption. Furthermore, mobile and web dashboards provide homeowners, installers, and researchers with intuitive access to live and historical performance data, enhancing usability and decision-making. This capability ensures that monitoring devices are technically sound in their hardware and aligned with modern smart-grid and IoT practices.
In this paper, we present a low-cost PV sensing system designed to enable homeowners to monitor the operational health of their solar installations.
2. Materials and Methods
This project is dedicated to the design and fabrication of a device capable of monitoring various data points useful for understanding and operating a photovoltaic (PV) system. Currently, maintenance of PV arrays is limited, and the only common method for assessing performance is by monitoring power output [14]. However, this metric alone is an unreliable indicator of overall PV health due to unrelated factors such as cloud coverage or fluctuating weather conditions [15]. To address this issue, we aim to provide an economical system that utilizes sensors to measure key parameters, including light intensity, voltage, current, and temperature, and display this information via an LCD interface. Such a system can detect inefficiencies—such as dust accumulation on the PV surface—that contribute to reduced power output. When the system identifies an issue, the user is notified through the LCD interface and can take corrective action. This approach promotes optimal and consistent PV array performance, potentially extending the system’s lifespan. The complete package consists of a sensor-equipped device mounted on the PV module, as shown in Figure 1 and Figure 2, and an LCD display positioned for user interaction. Figure 1 shows a sketch of the position of mounting the temperature and the light sensor on the photovoltaic panel. Figure 2a shows the components that are mounted on the back of the panel. A box that contains a power supply and a charge controller is mounted on the back of the panel, and it connects to the sensors. It features an LDR sensor, a voltage divider principle, a current sensor, and a temperature sensor. The measured data is displayed by a microcontroller on an LCD screen, as shown in Figure 2b. The power supply for the system is provided by a conventional AC supply. To accomplish compatibility with our system, the voltage will be stepped down to 12 V with a transformer, then converted from AC to DC current with a rectifier before being passed through a 5 V regulator.
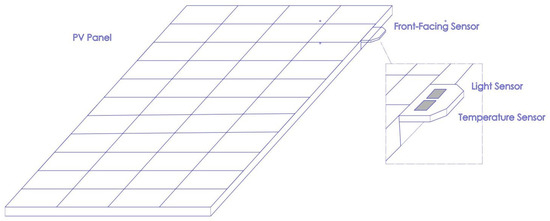
Figure 1.
The light and temperature sensors are connected on the side of the panel.
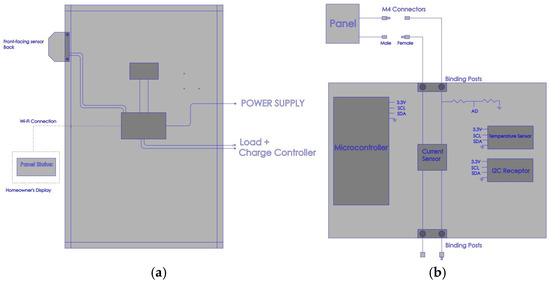
Figure 2.
(a) The power supply, load and charge controller are all contained in a box that is mounted on the back of the panel. (b) The current sensor, microcontroller and I2C receptors, which connect to the panel and are mounted on the back.
We sized and designed all components of this project to operate with the Evergreen Solar ES-A-200 model solar panel, which has a maximum voltage of 22 V and a maximum current of 12 A. Voltage and Current meters may need to be adjusted if using panels of different specifications; however, current meters capable of such demands are available, and the voltage divider can be adjusted. We have elected to use the Feather M4 Express paired with the Airlift Featherwing as our microcontroller. Two of these feathers are used, one on the panel collecting data, and the other receiving data and displaying it on the LCD screen. We used the following sensors: (1) Current Meter: TMCS1108A3U-Q1; (2) Voltmeter: Voltage Divider (R1 = 52 kΩ; R2 = 8.2 kΩ); (3) Temp & Humidity Sensor: Si7021; and (4) Light Sensor: BH1750. The control box is the main component of the system’s hardware and represents where all information is collected and pushed to the cloud. This piece of hardware is given a central location in the system.
3. Results
Once the design was completed, we created a printed circuit board (PCB) for implementation in the project. We started by identifying the location of all the components (microcontrollers, sensors, connectors, power regulation circuits, and passive elements). Once the system architecture was mapped out, the schematic design was developed using the electronic design automation (EDA) software, Altium Designer 23. After the schematic was developed, components were placed on a board outline, and copper traces were routed to form connections between them. This stage requires attention to factors like grounding and component orientation to ensure both performance and manufacturability. Design rules are applied to prevent errors like short circuits or broken traces. After completing the layout, design files are generated in Gerber format, which are then sent to a PCB manufacturer. The manufacturing process includes etching copper layers, drilling holes for through-hole components or vias, and applying a solder mask and silkscreen layers. Once the physical PCB was produced, components were soldered using automated pick-and-place machines. Electrical testing and debugging were also performed to verify that the system functioned as intended. Once the final PCB functionality (shown in Figure 3) was validated, it was ready to be integrated into the larger system or enclosure of the project (shown in Figure 4).
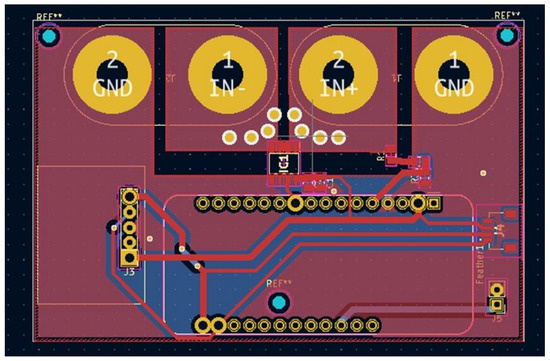
Figure 3.
The data file for the PCB design.
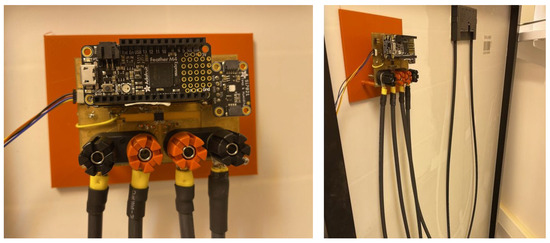
Figure 4.
The layout of the circuitry with the board connected to the terminals of the PV panel.
We chose to manufacture a sensor housing case using a 3D printer for flexibility and cost-effectiveness. The process begins with designing the case using CAD software 2024, as shown in Figure 5. We ensured precise dimensions to accommodate the specific sensors, wiring, and any required mounting hardware. Key design considerations include sensor placement for optimal exposure to the environment, airflow openings, cable routing paths, and structural integrity to protect the components. Once the design is finalized, it is exported as an STL file and prepared for printing using slicing software, where print settings such as infill density, support structures, and layer height are configured. We used PLA material because it offers the desired strength and thermal resistance needed for environmental conditions. The 3D printing process enables rapid iteration, which allows us to correct errors in a quick fashion. After printing, the case was sealed as shown in Figure 6. The final result is a custom-fit enclosure that protects the sensors, facilitates integration with other systems, and supports reliable data collection in lab or field environments.

Figure 5.
The CAD layout of the sensors’ enclosure.
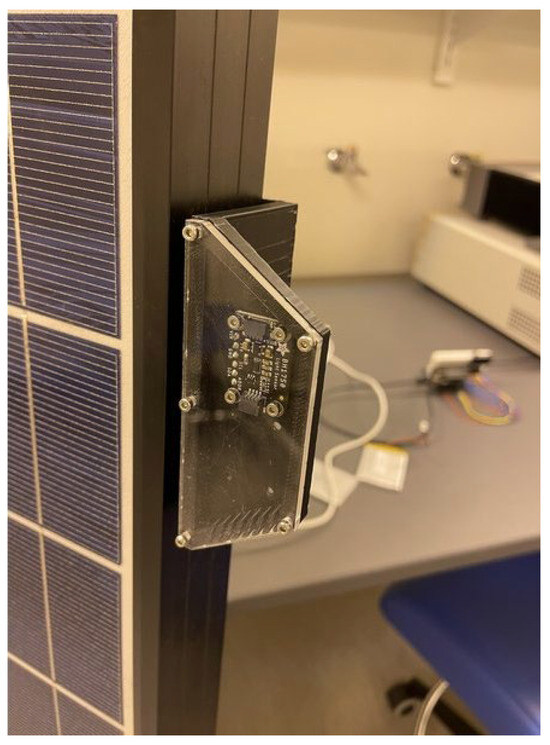
Figure 6.
The sensing enclosure connected to the PV panel.
Upon finalizing the design, the CAD model was exported into a stereolithography (STL) file format compatible with 3D printing software. This file was processed using slicing software, where various print parameters were carefully configured. These parameters included infill density, which determines the internal structure and strength of the print; support structures, which prevent deformation during printing of overhanging features; and layer height, which affects both the print resolution and overall build time. For the actual material, polylactic acid (PLA) filament was selected due to its favorable properties, including sufficient mechanical strength, resistance to moderate thermal fluctuations, environmental stability, and ease of post-processing.
The use of 3D printing technology provided an efficient and iterative approach to prototyping, allowing us to rapidly identify and correct any design flaws or dimensional inaccuracies in a timely manner, thereby minimizing delays and material waste. Following the printing stage, additional post-processing steps were performed, which included sealing the housing as shown in Figure 6, to further enhance protection against moisture and particulate ingress. The final product is an enclosure that ensures secure protection for the embedded sensors and simplifies the integration of the entire system with other hardware.
4. Discussion
Figure 7 presents detailed measurements of the system’s voltage readings recorded continuously from 8 a.m. through 5 p.m. At the start of the day, the voltage measurement begins at 0 V, indicating no power generation during the early morning hours before sufficient sunlight is available. As the morning progresses, around 9:30 a.m., the voltage output begins to rise sharply, reaching approximately 16 V. This increase corresponds to the rising intensity of sunlight as the sun climbs higher in the sky. Following this initial increase, the voltage stabilizes and maintains a fairly consistent level around 20 V for the remainder of the daylight period until approximately 4 p.m., when solar intensity starts to decline. After 4 p.m., as the sunlight diminishes further, the voltage output steadily decreases, eventually returning to 0 V, signaling the end of power generation for the day. Similarly, the current measurements, as displayed in Figure 8, follow a corresponding pattern. Initially, the current begins at a baseline value of approximately 0.3 A in the early morning when minimal light is present. As the available solar energy increases, the current output rises to about 1 A, where it remains relatively stable and consistent throughout the prime daylight hours. This steady current continues until approximately 4 p.m., after which it gradually declines to around 0.8 A as the sun begins to set and light intensity decreases. In Figure 9, the output power of the system is also illustrated, showing that power generation commences around 9:30 a.m., aligning with the earlier increases observed in voltage and current. The power output stabilizes at an approximate value of 20 W during peak sunlight hours and maintains this level consistently until approximately 4 p.m. before declining as solar input decreases.
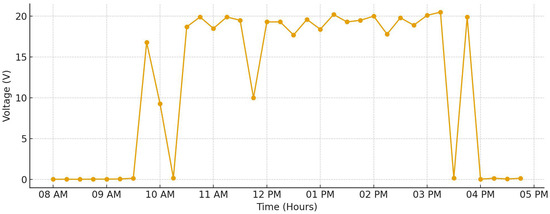
Figure 7.
The system’s voltage reading over nine hours.
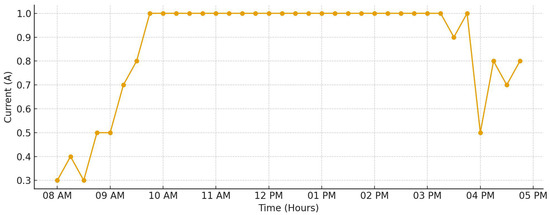
Figure 8.
The system’s current readings over nine hours.
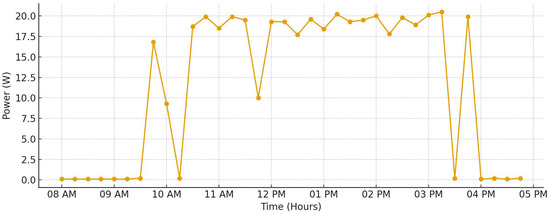
Figure 9.
The system’s output power readings over nine hours.
Figure 10 displays the illumination levels measured in lux throughout the day. Starting at 8 a.m., the lux readings are initially around 0.75 × 10⁴ lux, reflecting the low light levels of early morning. As the sun rises, the lux values increase steadily, reaching approximately 2.75 × 10⁴ lux by mid-morning, where they plateau and remain constant through most of the day until around 3:30 p.m. After this period, a gradual decline is observed, with lux readings falling to approximately 1.75 × 104 lux by 5 p.m. as daylight wanes. Furthermore, Figure 11 documents the temperature variations throughout the monitoring period. The recorded temperatures fluctuate between 24 °C in the early morning and peak values around 32 °C during the hottest part of the afternoon, reflecting natural ambient temperature changes driven by solar heating throughout the day. Finally, Figure 12 includes an image of the system’s display screen, which visually presents all real-time data measurements in an easily accessible format. This interface allows homeowners to conveniently monitor and assess the ongoing operational status and performance health of their photovoltaic (PV) system throughout the day, ensuring effective oversight and early detection of any irregularities.
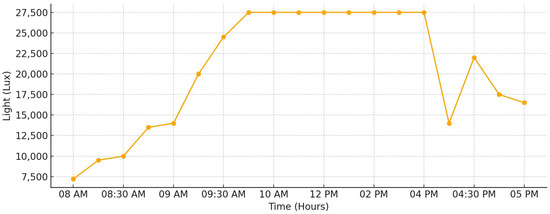
Figure 10.
The lux readings over nine hours.
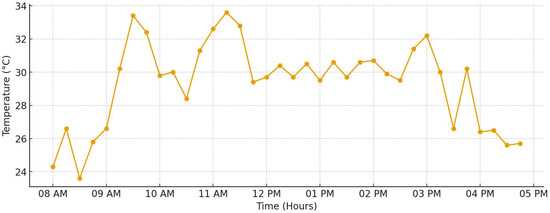
Figure 11.
The system’s temperature readings over nine hours.
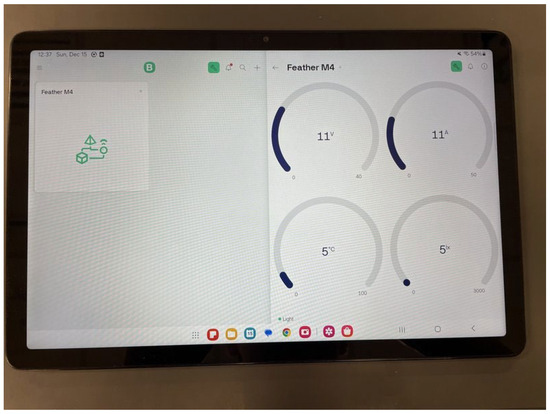
Figure 12.
The layout of screen display.
5. Conclusions
In this work, we have demonstrated the design, development, and successful implementation of a low-cost photovoltaic (PV) sensing and monitoring system capable of supporting homeowners in maintaining the operational health and efficiency of their solar installations. As the adoption of solar PV continues to grow worldwide, especially within the residential sector, ensuring optimal performance through real-time monitoring becomes increasingly important for both maximizing energy yield and protecting long-term investments. Our results confirm that the system reliably captures critical environmental and electrical parameters—including voltage, current, power output, temperature, and illumination—while providing users with a clear and accessible interface for real-time status updates. Through iterative testing and calibration, the system exhibited stable performance, demonstrating its viability for practical residential use. Overall, the project offers a promising, affordable solution for individual users contributing to the global renewable energy transition. The primary advantages of our device include its low cost, modular design, and use of readily available microcontroller-based components, which make it both accessible and scalable for residential applications. The integration of real-time sensing of voltage, current, irradiance, and temperature, coupled with the ability to process and visualize data locally, ensures practical usability for end-users without requiring specialized technical expertise. However, some limitations should also be acknowledged, such as the potential for accuracy fluctuations in low-cost sensors, the dependence on reliable wireless connectivity for seamless data transmission, and challenges related to system durability under prolonged outdoor exposure. In conclusion, the implemented system successfully demonstrates that a low-cost, real-time PV monitoring device can provide reliable insights into residential photovoltaic performance.
Author Contributions
Conceptualization, A.K.; methodology, A.K.; software, C.J.; validation, A.K., C.J. and A.A.; formal analysis, C.J.; investigation, C.J.; resources, A.K.; data curation, C.J.; writing—original draft preparation, C.J.; writing—review and editing, A.K.; visualization, C.J.; supervision, A.K.; project administration, A.K.; funding acquisition, A.K. All authors have read and agreed to the published version of the manuscript.
Funding
This research received no external funding.
Data Availability Statements
The original contributions presented in this study are included in the article. Further inquiries can be directed to the corresponding author.
Conflicts of Interest
The authors declare no conflict of interest.
References
- International Energy Agency. World Energy Outlook 2021; IEA: Paris, France, 2021; Available online: https://www.iea.org/reports/world-energy-outlook-2021 (accessed on 18 February 2025).
- REN21. Renewables Global Status Report 2021; REN21: Paris, France, 2021; Available online: https://www.ren21.net/reports/global-status-report/ (accessed on 18 February 2025).
- Intergovernmental Panel on Climate Change. Global Warming of 1.5 °C: An IPCC Special Report; IPCC: Geneva, Switzerland, 2018; Available online: https://www.ipcc.ch/sr15/ (accessed on 18 February 2025).
- United Nations Environment Programme. Emissions Gap Report 2021; UNEP: Nairobi, Kenya, 2021; Available online: https://www.unep.org/resources/emissions-gap-report-2021 (accessed on 18 February 2025).
- International Renewable Energy Agency (IRENA). Renewable Power Generation Costs in 2020; IRENA: Abu Dhabi, United Arab Emirates, 2020. [Google Scholar]
- Solar Energy Industries Association. U.S. Solar Market Insight 2020 Q4; SEIA: Washington, DC, USA, 2020; Available online: https://www.seia.org/us-solar-market-insight (accessed on 18 February 2025).
- Mellit, A.; Kalogirou, S.A. Artificial intelligence techniques for photovoltaic applications: A review. Renew. Sustain. Energy Rev. 2011, 15, 2714–2733. [Google Scholar] [CrossRef]
- Woyte, A.; Nijs, J.; Belmans, R. Partial shadowing of photovoltaic arrays with different system configurations: Literature review and field test results. Sol. Energy 2003, 74, 217–233. [Google Scholar] [CrossRef]
- Ekins-Daukes, N.J. Photovoltaic solar energy: Conversion, storage and applications. Nat. Rev. Phys. 2019, 1, 480–489. [Google Scholar]
- Asdrubali, F.; Grignaffini, F.; Rotili, S.; Cotana, S. A review of smart monitoring systems for PV plants. Int. J. Photoenergy 2019, 2019, 1–17. [Google Scholar]
- Green, M.A.; Dunlop, E.D.; Hohl-Ebinger, J.; Yoshita, M.; Kopidakis, N.; Hao, X. Solar cell efficiency tables (Version 58). Prog. Photovolt. Res. Appl. 2021, 29, 657–667. [Google Scholar] [CrossRef]
- Marion, B.; Adelstein, J.; Boyle, K.; Hayden, H.; Hammond, B.; Fletcher, T.; Canada, B.; Narang, D.; Kimber, A.; Mitchell, L.; et al. Performance parameters for grid-connected PV systems. In Proceedings of the Conference Record of the 31st IEEE Photovoltaic Specialists Conference, Lake Buena Vista, FL, USA, 3–7 January 2005; pp. 1601–1606. [Google Scholar]
- Louwen, A.; van Sark, W.; Schropp, R.; Turkenburg, W. A cost roadmap for PV module technology. Prog. Photovolt. Res. Appl. 2016, 24, 904–913. [Google Scholar]
- Markvart, T. Solar Electricity, 2nd ed.; John Wiley & Sons: Chichester, UK, 2000. [Google Scholar]
- Makrides, G.; Zinsser, B.; Norton, M.; Georghiou, G.E. Solar energy yield predictions and cost assessments of photovoltaic systems. Renew. Energy 2010, 35, 1297–1304. [Google Scholar]
- Yang, Y.; Tian, H.; Wang, H.; Blaabjerg, F. A review of maximum power point tracking in photovoltaic systems under partial shading conditions. Renew. Sustain. Energy Rev. 2015, 41, 893–905. [Google Scholar]
- Kanchev, H.; Lu, D.; Colas, F.; Lazarov, V.; Francois, B. Energy management and operational planning of a microgrid with a PV-based active generator for smart grid applications. IEEE Trans. Ind. Electron. 2011, 58, 4583–4592. [Google Scholar] [CrossRef]
- Kutkut, N.; Divan, D.M.; Novotny, D.W.; Balog, R. Method for Solving the Partial Shading Problem in Photovoltaic Arrays. U.S. Patent 6,262,892, 17 July 2001. [Google Scholar]
- Duffie, J.A.; Beckman, W.A. Solar Engineering of Thermal Processes, 4th ed.; Wiley: Hoboken, NJ, USA, 2013. [Google Scholar]
- Wolf, M.; Rauschenbach, H. Series resistance effects on solar cell measurements. Adv. Energy Convers. 1963, 3, 455–479. [Google Scholar] [CrossRef]
- Chouder, A.; Silvestre, S. Automatic supervision and fault detection of PV systems based on power losses analysis. Energy Convers. Manag. 2010, 51, 1929–1937. [Google Scholar] [CrossRef]
- Pavan, M.; Mellit, A. Performance prediction of grid-connected photovoltaic systems using artificial neural networks. Energy 2011, 36, 123–132. [Google Scholar]
- Ayad, M.Y.; Hatata, A.Y.; Marei, M.I. Design and implementation of smart monitoring system for standalone PV plant. IEEE Access 2019, 7, 139073–139086. [Google Scholar]
- Khatib, T.; Mohamed, A.; Sopian, K. A review of solar energy modeling techniques. Renew. Sustain. Energy Rev. 2012, 16, 2864–2869. [Google Scholar] [CrossRef]
- Eltamaly, A.; Alolah, A.; Al-Shehri, A. Modeling and simulation of grid-connected hybrid PV-wind power system. Int. J. Electr. Power Energy Syst. 2014, 62, 89–98. [Google Scholar]
- Iqbal, M. An Introduction to Solar Radiation; Academic Press: Toronto, ON, Canada, 1983. [Google Scholar]
- Messenger, R.; Ventre, J. Photovoltaic Systems Engineering, 3rd ed.; CRC Press: Boca Raton, FL, USA, 2010. [Google Scholar]
- Salmi, T.; Bouzguenda, M.; Gastli, A.; Masmoudi, A. Matlab/Simulink based modeling of solar photovoltaic cell. Int. J. Renew. Energy Res. 2012, 2, 213–218. [Google Scholar]
- Paredes-Parra, J.M.; Mateo-Aroca, A.; Molina-García, A.; García-Sánchez, A.J. PV module monitoring system based on low-cost solutions: Wireless Raspberry application and assessment. Energies 2018, 11, 3051. [Google Scholar] [CrossRef]
- Cheragee, S.H.; Hassan, N.; Ahammed, S.; Islam, A.Z.M.T. A study of IoT based real-time solar power remote monitoring system. Int. J. Ambient. Syst. Appl. 2021, 9, 27–36. [Google Scholar]
- Adhya, S.; Saha, D.; Das, A.; Jana, J.; Saha, H. An IoT based smart solar photovoltaic remote monitoring and control unit. In Proceedings of the 2016 2nd International Conference on Control, Instrumentation, Energy & Communication (CIEC), Kolkata, India, 28–30 January 2016; pp. 432–436. [Google Scholar] [CrossRef]
- Demir, B.E. A New Low-Cost IoT Based Monitoring System Design for Stand-Alone Solar Photovoltaic Plant and Power Estimation. Preprints.org 2023. [CrossRef]
- Akhtar, M.N.; Khan, M.T.A.; Siddiqui, M.F.N.; Ahmad, S. Low-cost Arduino-based data logger for on-grid photovoltaic system monitoring. Eur. J. Electr. Comput. Eng. 2024, 8, 7–12. [Google Scholar]
- Little, M.; Blanchard, R. Remote Monitoring Unit for Solar Home Systems: A Field Trial; Conference Contribution; Loughborough University: Loughborough, UK, 2023. [Google Scholar]
Disclaimer/Publisher’s Note: The statements, opinions and data contained in all publications are solely those of the individual author(s) and contributor(s) and not of MDPI and/or the editor(s). MDPI and/or the editor(s) disclaim responsibility for any injury to people or property resulting from any ideas, methods, instructions or products referred to in the content. |
© 2025 by the authors. Licensee MDPI, Basel, Switzerland. This article is an open access article distributed under the terms and conditions of the Creative Commons Attribution (CC BY) license (https://creativecommons.org/licenses/by/4.0/).