Article

Effects of Scale Regularization in Fraud Detection Graphs

by
Janggun Jeon
,
Junho Ahn
and
Namgi Kim
*
Graduate School, Kyonggi University, Suwon 16227, Republic of Korea
*
Author to whom correspondence should be addressed.
Electronics 2025, 14(18), 3660; https://doi.org/10.3390/electronics14183660
Submission received: 1 August 2025 / Revised: 6 September 2025 / Accepted: 12 September 2025 / Published: 16 September 2025

Abstract

With the growth of e-commerce platforms, the number of fraud reviews has rapidly increased, making fraud detection for platform data critically important. To detect fraud reviews in platform data, recent approaches have leveraged graph neural networks that model users as nodes in a heterogeneous multi-relational graph structure. This approach represents platform users as nodes in a graph, and the relationships among users who share commonalities in their reviews or products as edges, in order to identify fraudulent reviewers. However, existing graph-based fraud detection methods may suffer from the unstable training of the classifier networks that process embedding vectors. In this paper, we identify that this issue arises from the excessive deviation and scale expansion caused by some of the aggregated values from adjacent nodes in conventional node embeddings, and we propose a scale regularization method to mitigate this. To verify the effectiveness of the proposed method, we conduct validation on the Amazon-Fraud dataset, which is a multi-relational graph dataset constructed from review data of Amazon E-Commerce. The experimental results show that the proposed scale regularization achieves superior performance compared to previous verified graph fraud detection models.

1. Introduction

A traditional fraud detection task refers to a machine learning task that identifies or predicts manipulated information or deceptive behavior, primarily in areas such as banking, public administration, insurance, and taxation [1]. However, as e-commerce platforms that are provided based on internet services have grown, various cases of damage have rapidly increased, and new fraud detection methods suitable for responding to them are now required [1,2]. Among them, fraud detection against malicious fraud types such as fraudulent reviews is treated as a major challenge [3].
Fraud detection methods using conventional data mining techniques primarily rely on statistical analysis based on domain knowledge and computer science-based approaches to learn and predict the patterns of malicious data [1]. However, this approach has several limitations in environments such as e-commerce platforms. First, data related to reviews often include variable-length textual information, making it difficult for data mining techniques to be effective. In addition, the fact that the core attributes often included vary by product also makes the consistent application of data mining difficult.
There exist algorithms applicable to non-fixed-size textual information for detecting fraudulent reviews. These methods learn the textual patterns of general reviews and detect abnormal text keywords. However, if attackers bypass the system’s detection by using spelling patterns involving special characters or numbers, then text analysis for fraudulent reviewer detection has limitations [4,5]. For example, a fraudulent review containing the phrase “Click this link to win money” can be easily filtered. However, if a word like “to” is replaced with “2” or a word like “money” is replaced with a symbol or term implying money, the fraudulent reviewer could be recognized as a regular user.
As a new approach that has a different direction from the previously reviewed fraud detection techniques, an analysis method that models relationships between users on e-commerce platforms in the form of a graph structure has attracted attention [2,6,7,8,9]. Due to the nature of user authentication-based services, data generated on online platforms involve interactions across multiple attributes or behaviors of different users, and this can be effectively represented using a graph modeling approach.
In this approach, platform users are modeled as nodes, and attributes such as the number of written reviews, star ratings, and textual similarity with other reviews can also be included. Such graph representations can be analyzed using fraud detection models based on graph neural networks. However, graph neural network algorithms that analyze whether a node in the graph representation is classified as a malicious node may experience performance degradation depending on the range of the embedding vector values during the node embedding process. Therefore, in this paper, we newly propose a scale regularization method that can be applied to the operation process of graph neural networks in graph-based fraud detection models. To validate the effectiveness of the proposed method, we conduct experiments to evaluate performance using the Amazon-Fraud dataset, which is constructed as a multi-relational graph representation of user data from the Amazon E-Commerce platform.

2. Related Works

Various approaches in machine learning-based fraud detection techniques have been developed. Representative attempts include association rule, decision tree, clustering, one-class classification [10,11], neural networks, and ensemble approaches. Among them, fraud detection based on neural networks has recently been reported as having the highest detection performance, and graph neural networks are particularly evaluated as an effective approach in e-commerce platforms [2].
Fraud detection algorithms using graph neural networks model the review patterns and structural relationships of users on e-commerce platforms as graph representations and detect frauds. Review data generated on e-commerce platforms are important because they reveal heterogeneous multiple relationships between nodes in a graph structure when representing multi-relation interactions between users as a graph representation. This characteristic makes it difficult to directly apply general graph neural network models for fraud detection task.
Previously reported graph fraud detection models include CARE-GNN [2], PC-GNN [7], RioGNN [6], RLC-GNN [8], and GTAN [9]. These models commonly incorporate a mechanism of graph adaptive filtering, in which graph edges are dynamically pruned during training. CARE-GNN was the earliest to be reported, and this model is a node classification model that learns contextual information between nodes in a relational graph to detect malicious nodes for fraud detection. CARE-GNN was the first to attempt predicting the neighbor selection threshold for edge filtering through reinforcement learning. However, the reward function is overly sensitive, leading to instability in the scale range of embedding vectors. Subsequently, to address the imbalance in the number of malicious labels in graph data for CARE-GNN, PC-GNN was proposed. This model maintains performance even under label imbalance by using propagation and collaboration mechanisms. RioGNN was proposed to improve CARE-GNN’s graph filtering, allowing a clearer representation of relationships between adjacent nodes. RioGNN allows independent thresholding and weight adjustment for edges within each subgraph, which leads to higher performance. However, as the number of thresholds to be inferred through reinforcement learning increases, the instability of node embeddings becomes more pronounced. RLC-GNN was introduced to address the negative impact caused by deeper layers in node aggregation within CARE-GNN. GTAN presents a novel method for detecting malicious attacker nodes using a semi-supervised learning approach, and the model is designed to consider non-static graph representations.
In this paper, we analyze the causes of commonly observed instability problems in similar graph filtering-based node embeddings used by CARE-GNN, RioGNN, and RLC-GNN. To solve this problem, we propose a scale regularization method that can be applied to node embeddings for graph fraud detection.

3. Graph Fraud Detection

3.1. Heterogeneous Graph Structure for Fraud Detection

Before explaining the new node embedding method including the proposed scale regularization in this paper, we first describe heterogeneous graphs [12,13,14,15] with multiple relations, which are different from general graph structures.
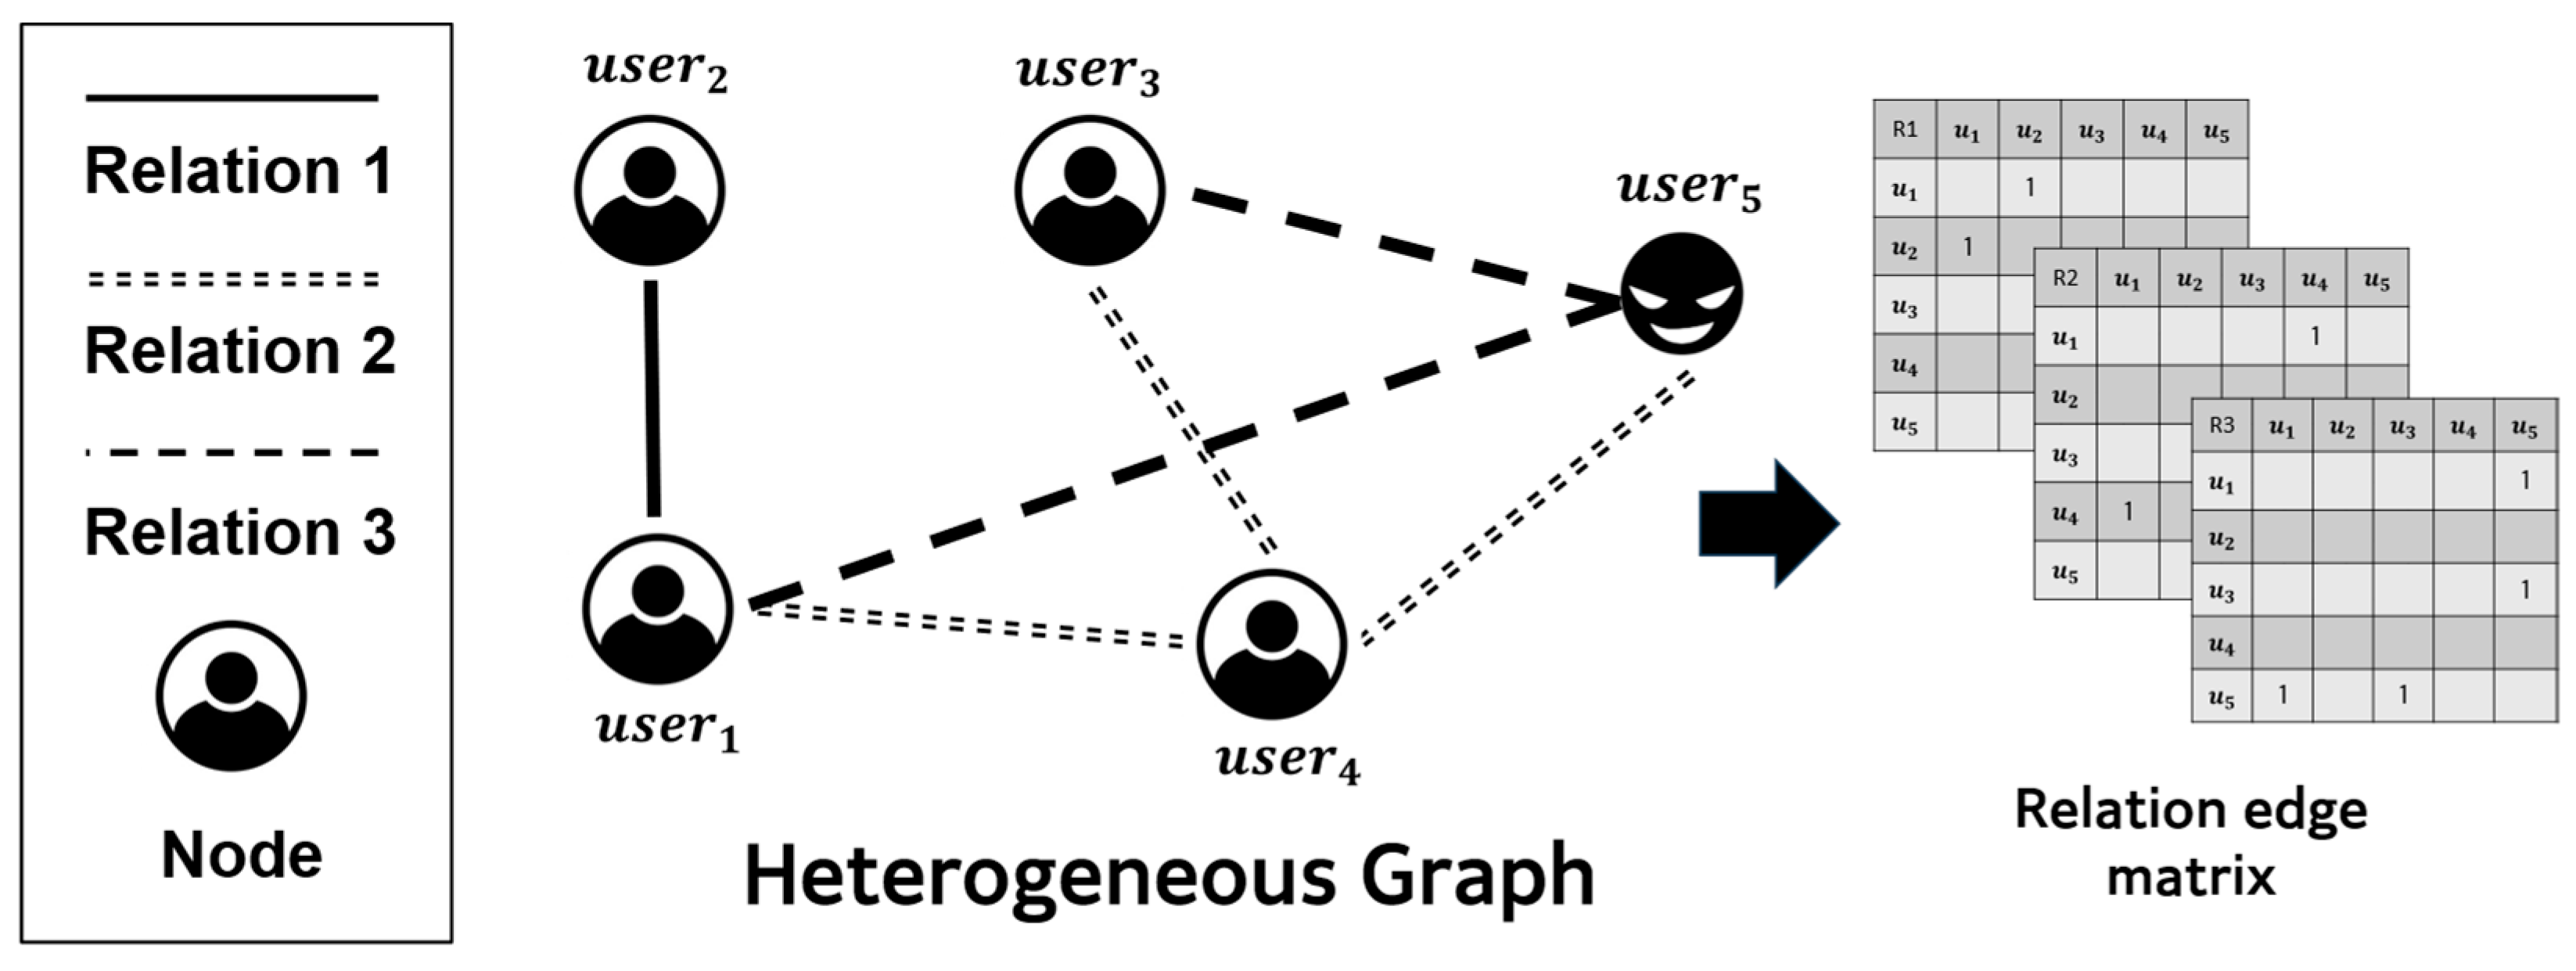
This heterogeneous graph is more similar to real-world systems than a general graph structure, and thus, it is a more suitable type of graph structure for graph fraud detection applications. The heterogeneous graph consists of multiple subgraphs, where nodes correspond to platform users to be analyzed, and edges are relational edges that represent interactions between users based on their behavior. Here, a subgraph groups together user nodes that exhibit similar behavior patterns, such as reviewing the same product or assigning the same rating. In the entire heterogeneous graph, the type of relational edge between two nodes varies depending on which subgraph the edge belongs to, and there may exist multiple types of relational edges between two nodes. The reason for representing behavior-based user interactions in such a heterogeneous graph structure is that a single-type graph system cannot sufficiently describe the interactions among user nodes. When various interactions between nodes are represented as single-type edges, the semantic differences between interactions are not distinguished, and the strengths of graph modeling approaches based on diverse node relations become ambiguous. An example can be explained through Figure 1. In Figure 1, u s e r 5 corresponds to a malicious node. When applying a graph neural network algorithm that aggregates information on neighboring nodes to u s e r 5 and adjacent nodes on the graph, there is a risk that these nodes will be identified as malicious nodes, and there is also a risk that malicious nodes will be recognized as normal user nodes like their neighboring normal nodes [2,6].

3.2. Proposal for Graph Fraud Detection

In this paper, we identify problems occurring in node embeddings of existing CARE-GNN, RioGNN, and RLC-GNN models, and in this section, we present the graph fraud detection process introducing scale regularization to address those issues. Figure 2 shows the overall structure of the graph fraud detection system described in this paper. First, the node embedding module embeds each node attribute vector u i of the heterogeneous graph, which contains user attribute information and node edge connection information, into embedding vector e i . Next, the embedding vector is stabilized in terms of its range of values through the proposed scale regularization method. To determine whether the node represented by scale-regularized embedding vector e i is a malicious node, a binary classifier is used to determine whether the node is fraudulent. In this process, the parameters of the node embedding module and the classifier are trained, and the node attribute vectors of the heterogeneous graph used in training are stored in the system codebook. When processing the node attributes of a heterogeneous graph that has not been trained in the inference step, the proposed graph fraud detection system quantizes them into the closest vector among the stored node attributes in the codebook.
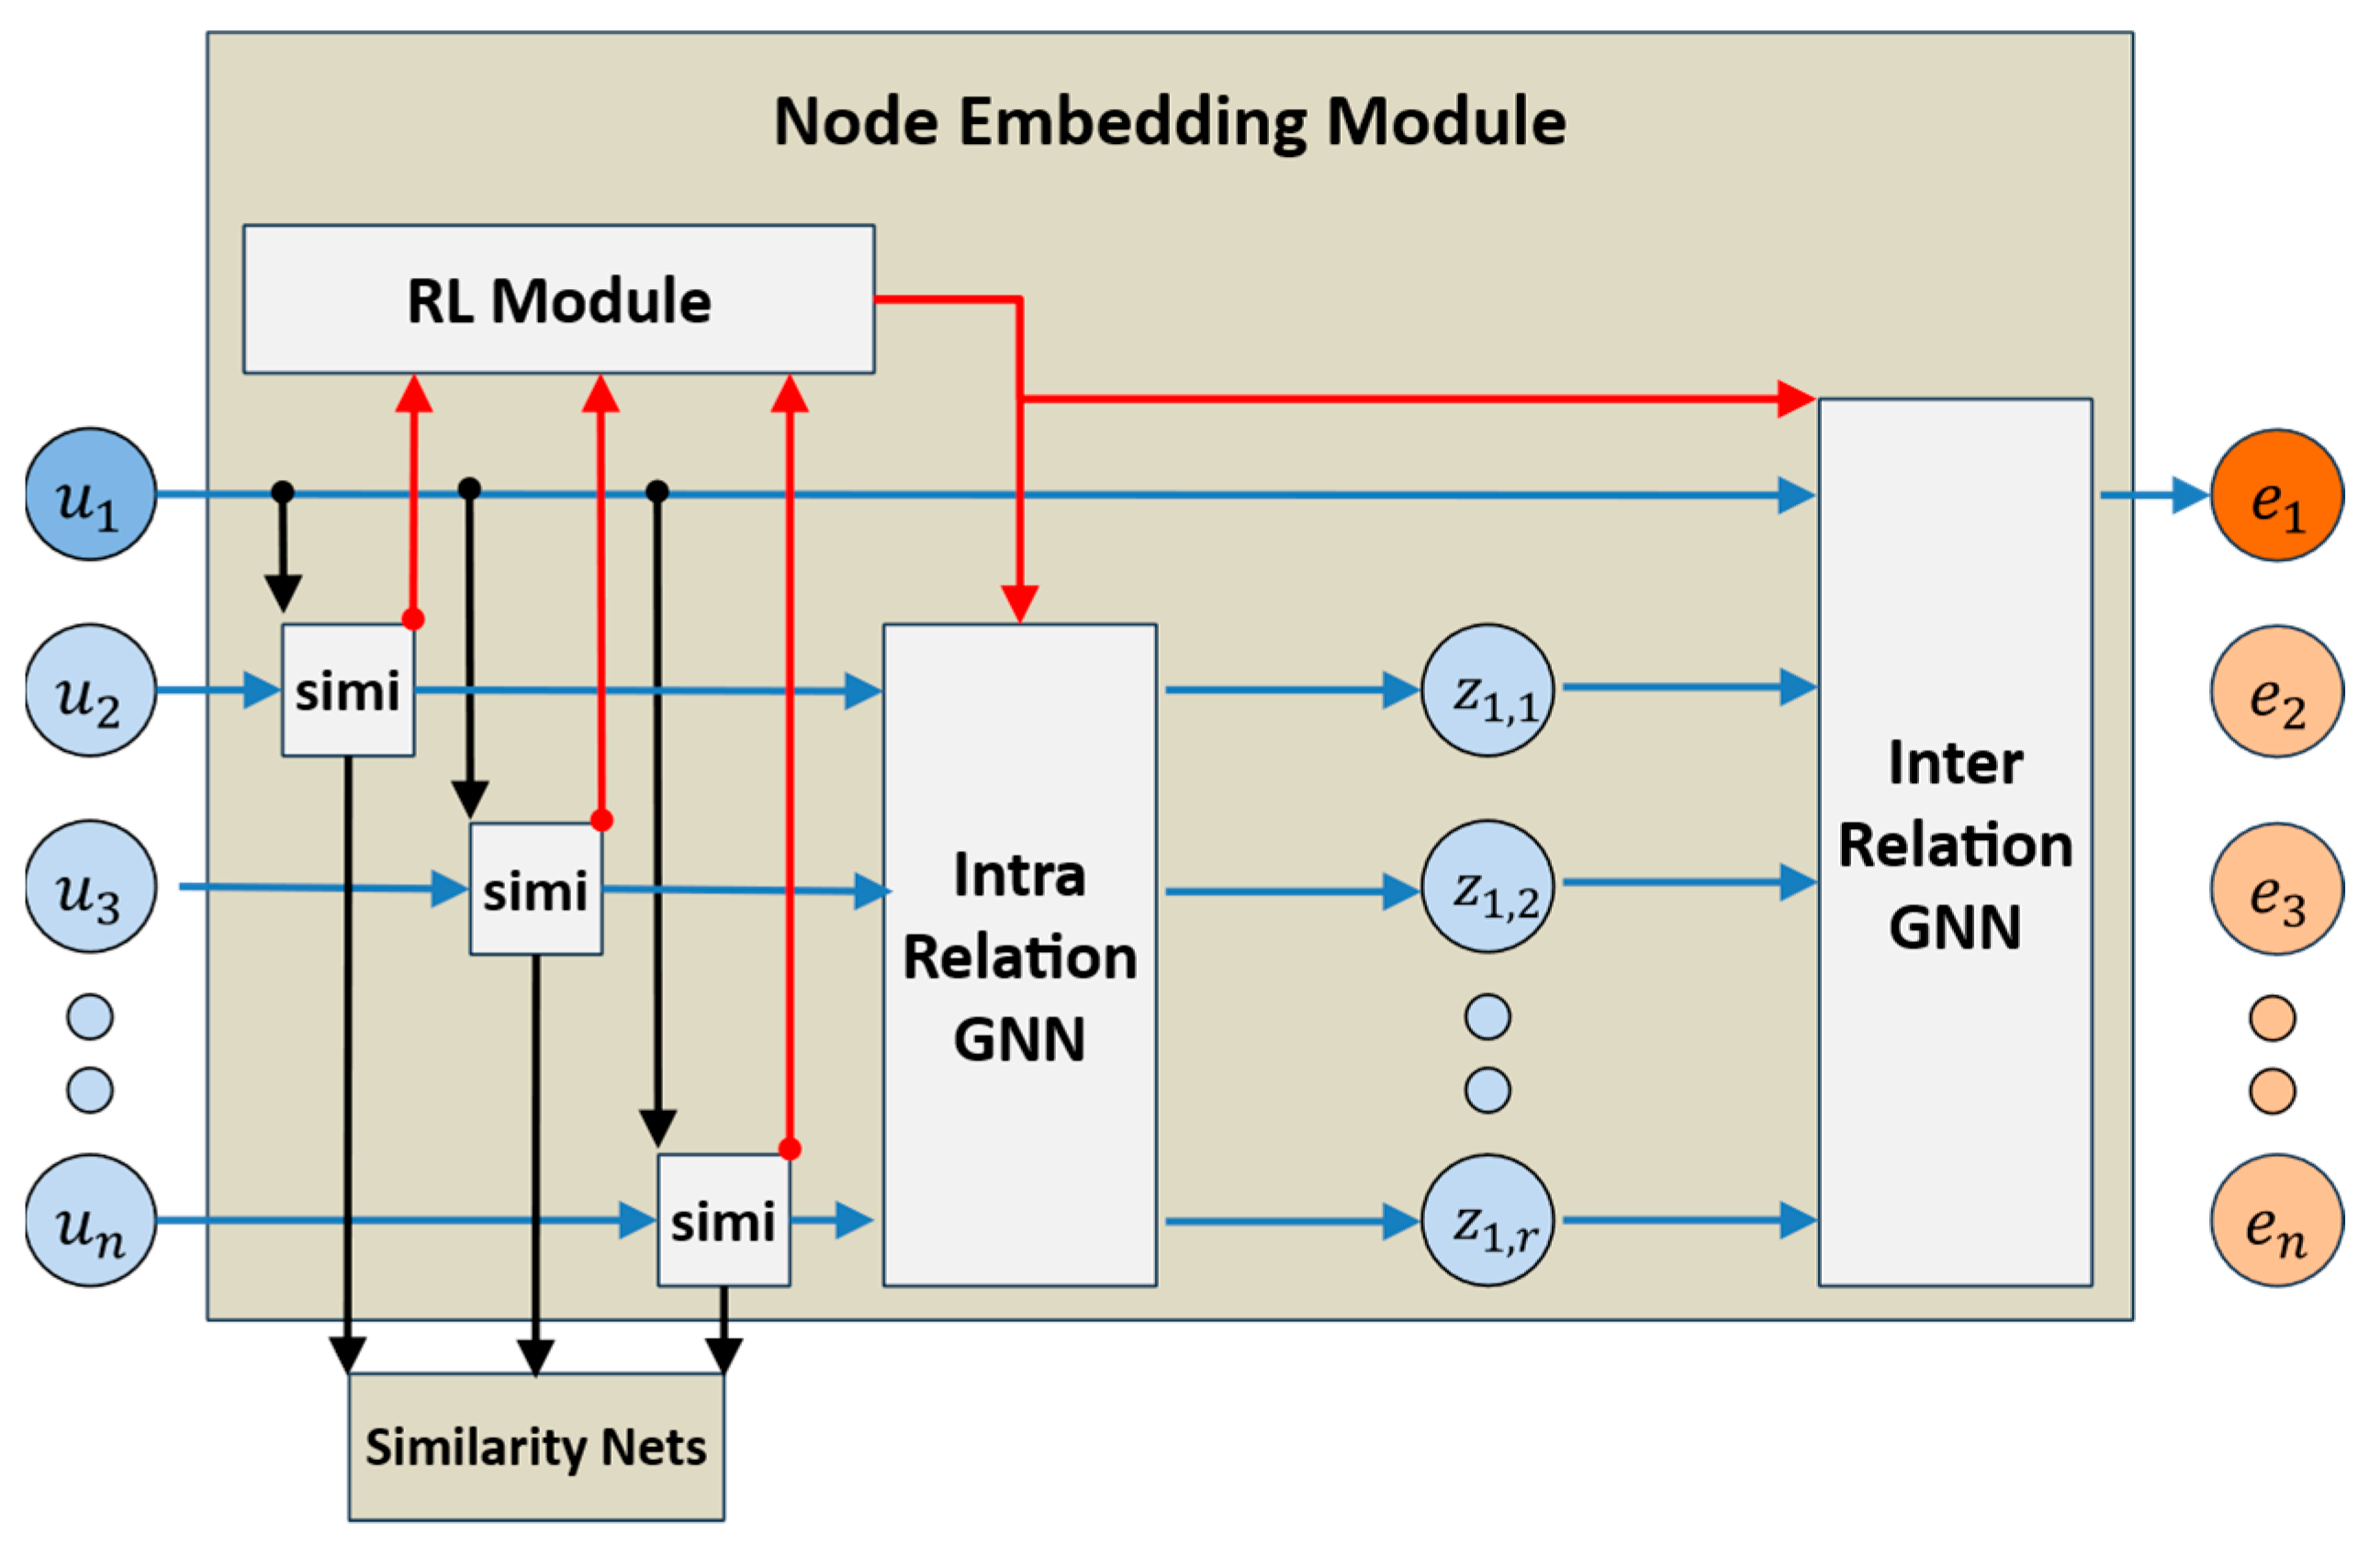
The operational mechanism of the node embedding stage, which is the core of the problem to be addressed here, is shown in detail in Figure 3.

3.2.1. Node Embedding Module

When embedding each individual node, the graph fraud detection system applies a graph neural network algorithm that aggregates latent vectors from adjacent nodes in the heterogeneous graph. However, in the case of heterogeneous graphs with multiple relations, there exists a risk that attributes on the aforementioned malicious nodes can be aggregated [2,6]. So, the node embedding module internally includes an RL module (Reinforcement Learning Module, R L M ) to counter this.
Mask Threshold Selection
The node embedding module performs node masking [16,17,18,19,20] through the R L M to selectively aggregate information only from similar neighbors, as shown in Figure 4.
  R L M = R L T r | r = 1 R R L T r , = { R L r ( d ) } | d = 1 D r R               r = 1
As shown in Equation (1), the R L M performs adaptive reinforcement learning [6] to obtain the optimal filtering threshold, p r , for node masking in each relation of the multi-relation graph.
  p r ( d ) R L r ( d ) p r ( d 1 ) W r d 2 ,   p r d 1 + W r d 2    
For each relational graph, a reinforcement learning tree, R L T r , is constructed with dynamic depth D r and per-depth width W r d . The recursive process for constructing R L T r is described in Equation (2).
  w h e r e   e p o c h > 2   a n d   D i s c r e   R L   a g e n t                     p r ( d ) ( i ) p r d i 1 = 0 e p o c h                               i = e p o c h 1                         w h e r e   e p o c h > 2   a n d   C o n t i n u o u s   R L   a g e n t                           p r ( d ) ( i ) p r d i 1 < W r d e p o c h                               i = e p o c h 1
p r ( d ) is the masking ratio parameter of neighbor nodes discovered at tree depth d , and it is recursively learned until the termination condition shown in Equation (3) is satisfied at D r and then becomes the final filtering threshold, p r . The value p r provided by the R L M is utilized in the intra-relation GNN process and inter-relation GNN process, as shown in Figure 3.
Neural Similarity Measure
To perform node masking through R L M , similarity measurement between nodes must be conducted in advance. A neural network is used to predict whether each node is normal (1) or malicious (0), and similarity is obtained based on the difference. In this process, the predicted label is derived solely based on the attributes of node vectors, regardless of the relations between neighboring nodes. And although the neural similarity network is trained, it is not included in the classification results at the inference stage.
  L s i m i l a r i t y = i     N d log ( σ F C N ( u i ) )                   log ( 1 σ F C N ( u i ) )   ,   i f   y i = = 1 ,   i f   y i = = 0
Equation (4) defines the loss function of the neural similarity network. σ is an activation function that converts the F C N layer output into a similarity value between 0 and 1. The similarity between nodes is obtained and utilized in the previously mentioned R L M .
Neighbor Node Aggregation
Intra-relation GNN, for each relational graph nodes u r , computes the latent representation z i , r for node u i with respect to the r -th relation through a graph algorithm over its masked neighbors u n e . The computation principle in intra-relation GNN for u i is given by Equation (5). When node attribute vector u i is transformed to a later representation, linear transformation matrix W r for dimension reduction is used as a parameter in the computation. Here, G N N r and G N N r denote graph algorithms that perform weighted aggregation of neighboring nodes.
  z i , r = R e L U G N N r u i ,   u r G N N r u i ,   u r = (   W r   ·   u n e   : n e { N r u i     m a s k ( u r ) } )
Inter-relation GNN obtains z i by weighted aggregating z i , r with the attention weight a r obtained using the attention mechanism, and this z i is combined with the GNN output weighted by aggregating p r based on the relation-specific node latent representation, z i , r , in a residual way to obtain the node embedding vector, e i . The principle for inter-relation GNN computation is described in Equation (6).
      z i = r R a r   ·   z i , r     e i = R e L U z i     G N N a l l z i ,   z r G N N a l l z i ,   z r = ( {   p r   ·   z i , r } R               r = 1 )
When aggregating the node embedding latent representations per relation, relation-specific p r is used as the weight in a weighted sum way.

3.2.2. Scale Regularization

Node embedding is an essential process for graph fraud detection in heterogeneous graph structures with multiple relations. However, due to node masking, the deviation in the aggregation sum of neighboring nodes for each node can become excessively large. In particular, during the early epoch stage when the parameters of the R L M are not yet sufficiently trained, the classifier networks may be forced to learn embedding vectors with inconsistent value ranges. This paper identifies this as a cause of training instability and proposes a scale regularization method to address it.
  E   = e 1 ,   e 2 ,   ,   e i ,   ,   e n                         , E     R n × d e i = e i 1 ,   e i 2 ,   ,   e i j ,   ,   e i d             , E     R n × d   a g f a c t o r = i = 1 n j = 1 d e i j ,   e i j     R 1                                             r f f a c t o r     R 1                                           , h y p e r   p a r a m e t e r             s c f a c t o r = r f f a c t o r a g f a c t o r                                            
When computing embedding vectors, the range of each vector can vary depending on the weighted sum of latent representations added to each individual node vector. According to this, if the absolute value of deviations among embedding vectors excessively increases or suddenly changes, the learning effectiveness of classifier networks may degrade. To mitigate this variation, scale regularization aims to normalize both the range and the mean of L1 norms of embedding vectors. To achieve this, as shown in Equation (7), we compute the aggregation factor a g f a c t o r over the set of embedding vectors. Then, we introduce r f f a c t o r (reference factor) as a hyperparameter for comparison with the a g f a c t o r . The a g f a c t o r represents the L1 norms of the centroid formed by n embedding vectors within the clusters in the overall embedding space. Since it is impractical to handle the L1 norms of every embedding vector individually, we instead compare the L1 norms of the cluster centroid with the r f f a c t o r . Based on this comparison, we derive the s c f a c t o r , which serves as a coefficient or factor that enables the scale regularization of all embedding vectors.
Specifically, in the scale regularization, the mean of L1 norm of embedding vectors is normalized based on the r f f a c t o r , stabilizing the range of vector values. As shown in Equation (7), we calculate the scale factor s c f a c t o r using both r f f a c t o r and a g f a c t o r .
E = E   ·   s c f a c t o r ,   E     R n × d
Across the entire set of embedding vectors, a scalar multiplication is performed using the s c f a c t o r , as shown in Equation (8), to standardize the mean of the L1 norm. Figure 5 provides a detailed illustration of how the s c f a c t o r is applied to each embedding vector in the scale regularization process.
  L c l a s s i f i c a t i o n = i     N d log ( σ F C N ( e i ) )                   log ( 1 σ F C N ( e i ) )   ,   i f   y i = = 1 ,   i f   y i = = 0
As a result, the final embedding vector set, E , is obtained by applying scale regularization to the original embedding vector set, E , as defined in Equation (8).
  y i = σ F C N ( e i   ·   ( s c f a c t o r ) )
F r a u d S c o r e :   1 y i ^ N o r m a l S c o r e :   y i ^                          
Once the final node embedding vectors are obtained through the scale regularization algorithm, node labels are predicted and trained using a node classification network with the loss function defined similarly to Equation (9). In this process, predicted labels are derived considering the relations between neighboring nodes. Finally, the output of the graph fraud detection inference is represented as shown in Equation (10).

4. Experiments

To verify the effectiveness of the proposed scale regularization method, we conducted experiments using the Amazon-Fraud multi-relational graph dataset constructed from review data on the Amazon E-Commerce platform. The reason for using the Amazon-Fraud dataset is that it has been widely employed as a benchmark in prior graph fraud detection studies, allowing direct comparison with related works. Amazon-Fraud is a graph dataset that analyzes review data including variable-length texts from Amazon E-Commerce, representing platform users as nodes and the relations between users based on shared review characteristics as relation edges. In this like, Amazon-Fraud contains multiple relational edges; it represents heterogeneous graphs well, which are the domain of our study. In this graph representation, each node represents user attributes as multivariate vectors.
Table 1 presents the three types of relational structures in the Amazon-Fraud dataset. U-P-U in Table 1 represents the relation between users who have reviewed at least one common product. U-S-U in Table 1 represents the relation between users who gave at least one common rating within one week. U-V-U in Table 1 represents the relation between users whose review text similarity falls within the top 5% among all users. In addition to the complete graph constructed from the three relations, Amazon-Fraud also includes individual graphs for each relation.
The experiment compares the node classification performance with the scale regularization model and existing graph fraud detection models such as CARE-GNN, PC-GNN, RioGNN, and GTAN. The scale regularization method was applied to the RioGNN model, which we refer to as RioGNN-sr, and compared with other models. In addition, we observed that RioGNN-sr shows a more robust performance trend than RioGNN, even under varying embedding dimensions. Then, to confirm whether the proposed method mitigates the sharp variation in the L1 norm distribution of embedding vectors, we visualized the change in the L1 norm per epoch.
In this context, AUROC was selected as the primary evaluation metric, since it is widely regarded as the most appropriate indicator for evaluating improvements in graph fraud detection tasks. Unlike metrics that focus exclusively on either fraudulent or normal users, AUROC jointly reflects the model’s ability to assign higher scores to fraudulent nodes while maintaining consistent predictions for legitimate users. Therefore, rather than isolating performance variations from one perspective alone, AUROC provides sufficient and comprehensive evidence of how effectively the proposed scale regularization enhances the discrimination capacity of graph adaptive filtering methods.
Table 2 presents both the AUROC performance reported in the existing literature, along with the results of experiments directly reproducing the corresponding identical models in this paper. In the comparative experiments, the proposed scale regularization applied to RioGNN (RioGNN-sr) achieves the best AUROC score of 98.11% among all models. Compared to the base architecture RioGNN, this method shows a performance improvement of 2.55%. In addition, this is an improvement of 0.61% compared to GTAN, which previously showed the best performance in the related literature, and a 1.12% higher result compared to the GTAN reproduced in our experiment.
Figure 6 shows the results of a comparative experiment in which scale regularization was applied to the node embedding module while changing the embedding dimension size for the directly reproduced RioGNN architecture. For each condition, 30 repetitions were performed, and it can be observed that RioGNN-sr showed relatively superior performance compared to the reproduced RioGNN in the experiment shown in Figure 6. In addition, this confirms that the proposed scale regularization method demonstrates high robustness to hyperparameter changes such as embedding dimension.
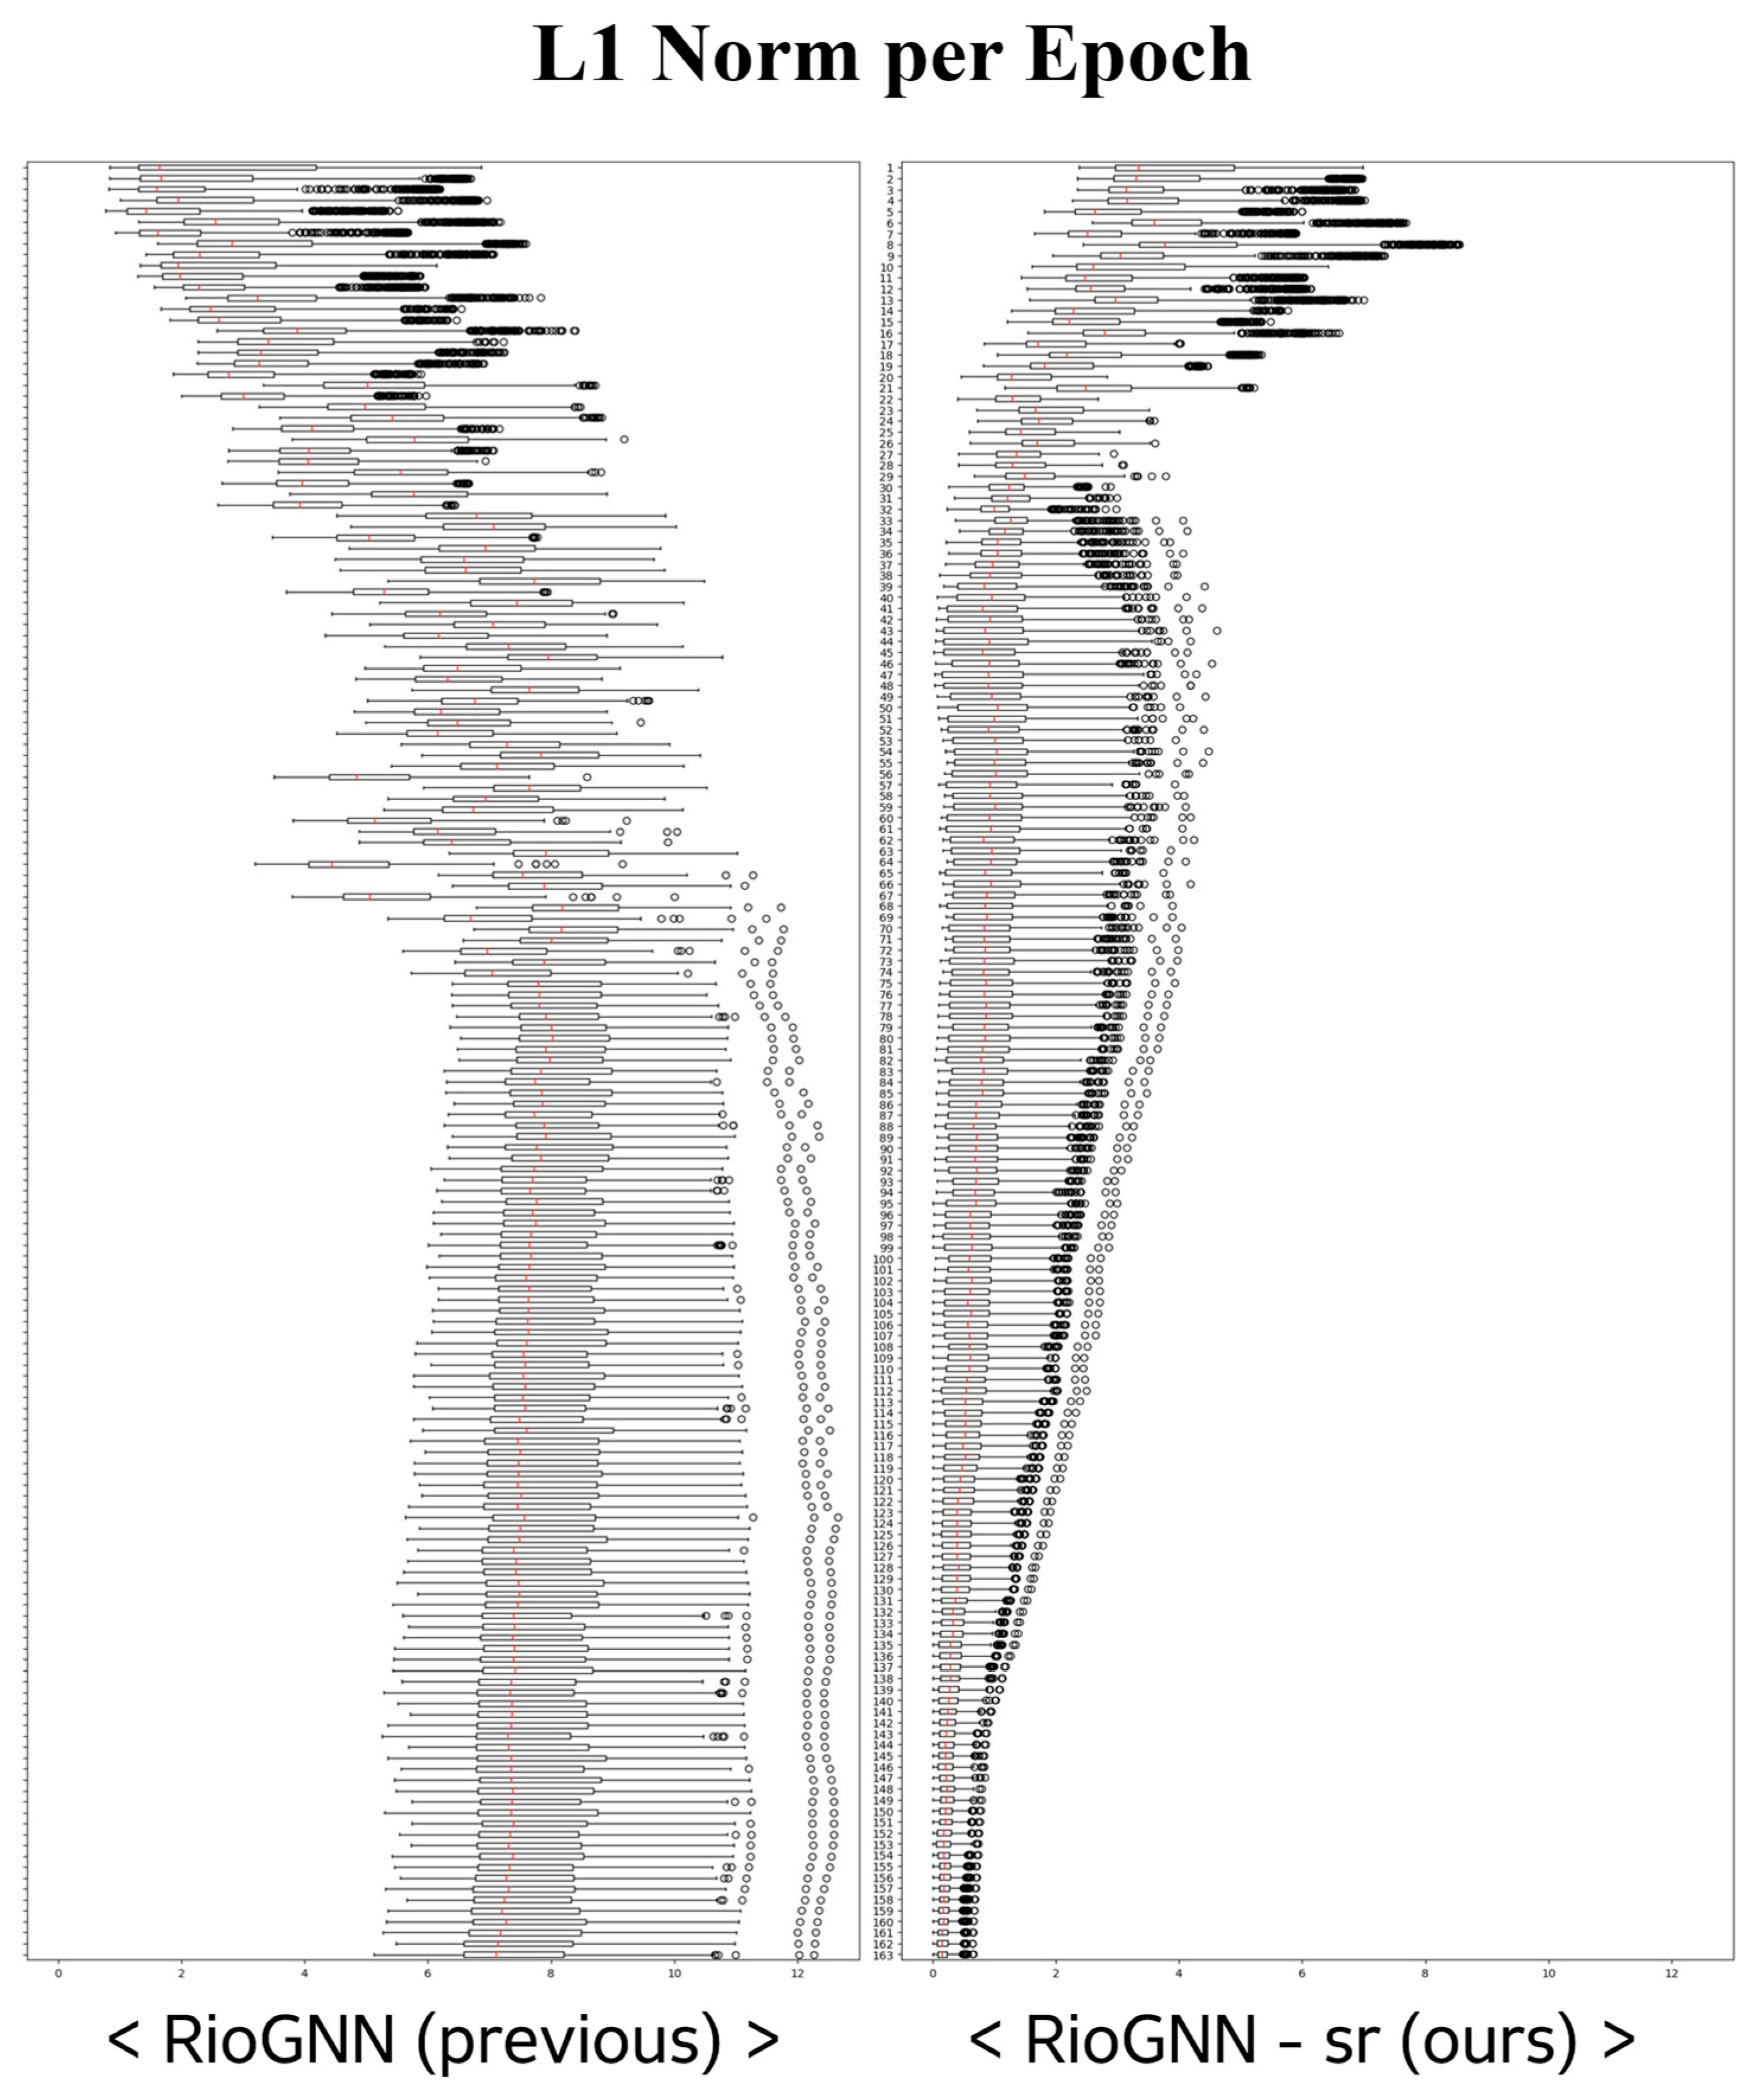
Figure 7 visualizes the change in distribution of the L1 norm values of embedding vectors according to epochs between the proposed RioGNN-sr and the original RioGNN. At this time, for a fair comparison, RioGNN-sr was based on the distribution of the embedding vector, e i , not the normalized vector, e i . In the case of RioGNN, during approximately half of the total training epochs, on average, L1 norm distribution tended to increase more irregularly compared to RioGNN-sr. On the other hand, in the case of RioGNN-sr, during the first 1/4 of the training epochs, the distribution slightly decreased irregularly, but its variance converged continuously and stably afterward. As mentioned earlier, considering that when the magnitude or deviation of the embedding vectors becomes excessively large or changes irregularly, it may negatively affect the classifier networks, it can be seen that the distribution of RioGNN-sr is better. When the scale regularization method proposed in this paper is applied to node embedding, this visualization above shows that the method contributes to improved performance.
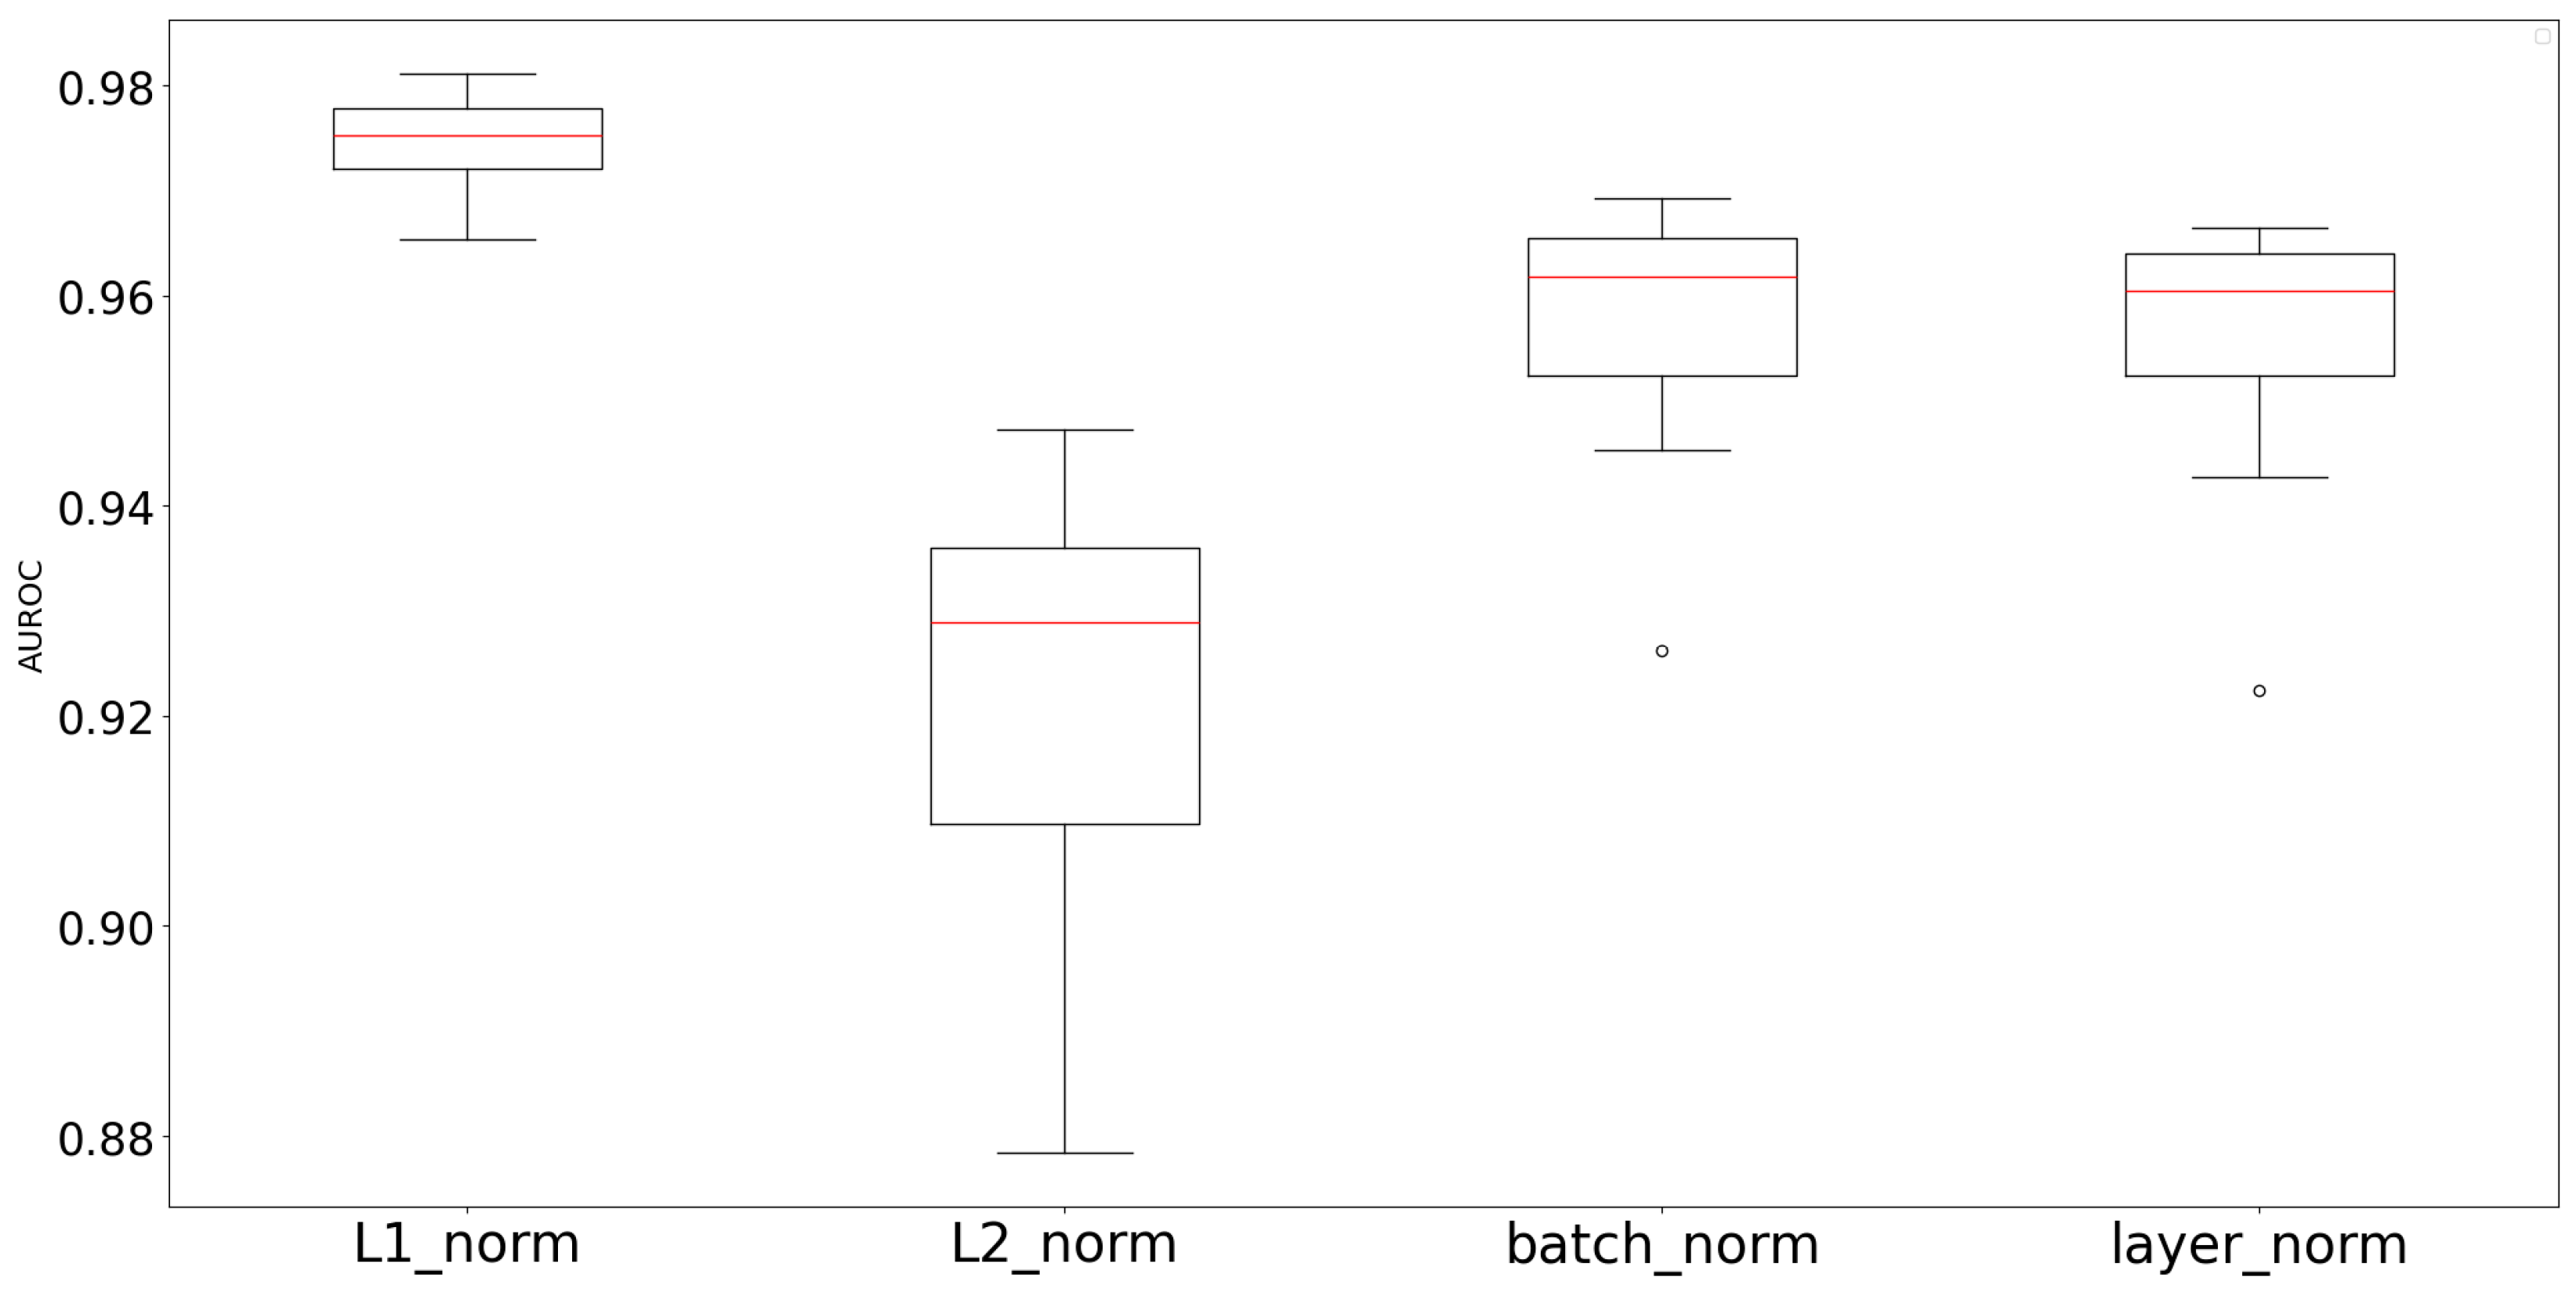
In addition, we conducted comparative experiments to investigate the effects of other normalization methods beyond the scale regularization based on the mean of the L1 norm of embedding vectors. As shown in Figure 8, the tick label “L1 norm” represents the vanilla version of RioGNN-sr, whereas the tick label “L2 norm” denotes the experiment where embedding vectors were normalized using the mean of the L2 norm in the scale regularization operation. Figure 8 demonstrates that the proposed L1 norm-based scale regularization achieves the best performance.
In particular, this highlights the limitations of batch normalization and layer normalization, which affect individual vector instances or attributes separately. By contrast, the proposed L1 norm-based scale regularization reduces excessive absolute deviations among embedding vectors while preserving their relative distances, thereby enhancing stability without distorting structure in the embedding space distribution.

Limitations and Discussion

In this section, we examine both the strengths and the limitations of the proposed approach and further discuss possible works. A key strength of scale regularization lies in its ability to mitigate the shortcomings of graph adaptive filtering strategies, which are commonly observed in existing graph fraud detection models. In this sense, scale regularization contributes in a more generalizable manner to stabilizing node embeddings and is relatively easy to integrate into various models.
u i = u i 1 ,   u i 2 ,   ,   u i j ,   ,   u i d             , u i     R d   k = i = 1 n j = 1 d u i j ,   k     R 1
But the introduction of the r f f a c t o r inevitably adds a dependency on this additional hyperparameter. To investigate its influence on model performance, we attempted several trials of rc-factor value variation based on parameter k defined in Equation (11). When substituting k value into the r f f a c t o r , the results reported in Table 2 and Figure 6 show that favorable performance can be achieved. Figure 9 presents experimental results where the r f f a c t o r was varied around k to evaluate its concrete effects across models. As observed in Figure 9, the r f f a c t o r newly introduced in scale regularization exhibits relatively low hyperparameter robustness. Therefore, similar to how the k value was derived in Equation (11), additional ways to derive the r f f a c t o r value can be considered.

5. Conclusions

This paper analyzes an effective graph fraud detection model based on heterogeneous multi-relational graph representations for fraudulent reviewer detection and investigates a method to classify malicious nodes. A conventional GNN-based fraud detection process performs node masking during the node embedding, which may result in irregular fluctuations or excessive increases in the embedding vector value distribution. This interferes with the convergence of the mean and variance of the embedding vector distribution during training and negatively affects classifier network training. To stabilize this embedding vector distribution during the node embedding process, this paper proposed scale regularization. Through scale regularization, which standardizes the mean of the embedding vector L1 norms, this paper reduced the excessive deviation of the aggregated sum of adjacent node vector values that occurs during the GNN computation process. As a result, RioGNN-sr—which was applied for scale regularization—outperformed previously studied graph fraud detection models. In the future, we plan to research the applicability of the scale regularization technique to other parameter-thresholding-based algorithms that are also based on reinforcement learning mechanisms, and we also plan to apply it to other fraud node classification datasets in our subsequent studies.

Author Contributions

Conceptualization, J.J.; Methodology, J.J. and N.K.; Software, J.J.; Validation, J.J.; Formal Analysis, N.K.; Investigation, J.J.; Resources, J.J.; Data Curation, J.J.; Writing—Original Draft, J.J.; Writing—Review and Editing, J.J., J.A. and N.K.; Visualization, J.J.; Supervision, N.K.; Project Administration, J.J. and N.K.; Funding Acquisition, N.K. All authors have read and agreed to the published version of the manuscript.

Funding

This research was supported by the Basic Research Program through the NRF (National Research Foundation) of Korea funded by the Ministry of Education (RS-2020-NR049579) and the 2025 Kyonggi University Graduate School Researcher Scholarship. This research was also supported by the MSIT (Ministry of Science and ICT), Korea, under the ICAN (ICT Challenge and Advanced Network of HRD) support program (IITP-2024-00436954) supervised by the IITP (Institute for Information & Communications Technology Planning & Evaluation).

Data Availability Statement

The datasets presented in this study are available in this article. Requests to access the datasets should be directed to the authors of the study.

Acknowledgments

The authors extend their heartfelt appreciation to their advisors for their invaluable insights, continuous support, and guidance, all of which played a crucial role in the successful completion of this study.

Conflicts of Interest

The authors declare no conflicts of interest.

Abbreviations

GNNGraph neural network
RLMReinforcement learning module
ag-factorAggregation factor
rf-factorReference factor
sc-factorScale factor

References

  1. Khedmati, M.; Erfani, M.; GhasemiGol, M. Applying support vector data description for fraud detection. arXiv 2020, arXiv:2006.00618. [Google Scholar] [CrossRef]
  2. Dou, Y.; Liu, Z.; Sun, L.; Deng, Y.; Peng, H.; Yu, P.S. Enhancing graph neural network-based fraud detectors against camouflaged fraudsters. In Proceedings of the 29th ACM International Conference on Information & Knowledge Management, Online, 19–23 October 2020; pp. 315–324. [Google Scholar] [CrossRef]
  3. Middae, V.L.; Appachikumar, A.K.; Lakhamraju, M.V.; Yerra, S. AI-powered Fraud Detection in Enterprise Logistics and Financial Transactions: A Hybrid ERP-integrated Approach. Comput. Fraud Secur. 2024, 2024, 468–476. [Google Scholar]
  4. Li, A.; Qin, Z.; Liu, R.; Yang, Y.; Li, D. Spam review detection with graph convolutional networks. In Proceedings of the 28th ACM International Conference on Information and Knowledge Management, Beijing, China, 3–7 November 2019; pp. 2703–2711. [Google Scholar] [CrossRef]
  5. Weber, M.; Domeniconi, G.; Chen, J.; Weidele, D.K.I.; Bellei, C.; Robinson, T.; Leiserson, C.E. Anti-money laundering in bitcoin: Experimenting with graph convolutional networks for financial forensics. arXiv 2019, arXiv:1908.02591. [Google Scholar] [CrossRef]
  6. Peng, H.; Zhang, R.; Dou, Y.; Yang, R.; Zhang, J.; Yu, P.S. Reinforced neighborhood selection guided multi-relational graph neural networks. ACM Trans. Inf. Syst. 2021, 40, 1–46. [Google Scholar] [CrossRef]
  7. Liu, Y.; Ao, X.; Qin, Z.; Chi, J.; Feng, J.; Yang, H.; He, Q. Pick and choose: A GNN-based imbalanced learning approach for fraud detection. In Proceedings of the Web Conference 2021, Online, 19–23 April 2021; pp. 3168–3177. [Google Scholar] [CrossRef]
  8. Zeng, Y.; Tang, J. Rlc-gnn: An improved deep architecture for spatial-based graph neural network with application to fraud detection. Appl. Sci. 2021, 11, 5656. [Google Scholar] [CrossRef]
  9. Xiang, S.; Zhu, M.; Cheng, D.; Li, E.; Zhao, R.; Ouyang, Y.; Chen, L.; Zheng, Y. Semi-supervised credit card fraud detection via attribute-driven graph representation. In Proceedings of the AAAI Conference on Artificial Intelligence, Washington, DC, USA, 29 January 2023; Volume 37, pp. 14557–14565. [Google Scholar] [CrossRef]
  10. Schölkopf, B.; Williamson, R.; Smola, A.; Shawe-Taylor, J.; Platt, J. Support vector method for novelty detection. In Advances in Neural Information Processing Systems; MIT Press: Cambridge, MA, USA, 1999; Volume 12. [Google Scholar]
  11. Tax, D.M.; Duin, R.P. Support vector data description. Mach. Learn. 2004, 54, 45–66. [Google Scholar] [CrossRef]
  12. Malik, D.P.; Soni, T.; Sharma, T.; Dongre, R.; Shrimali, S. Leveraging Graph Embeddings to Detect Fake Vendors in E-Commerce Supply Networks. Int. J. Sci. Eng. Technol. 2025, 13, 3. [Google Scholar] [CrossRef]
  13. Wu, H.; Wang, J. GNN-Driven Detection of Anomalous Transactions in E-Commerce Systems. Sci. Technol. Eng. Math. 2025, 2, 13–20. [Google Scholar] [CrossRef]
  14. Shao, Z.; Wang, X.; Ji, E.; Chen, S.; Wang, J. GNN-EADD: Graph Neural Network-based E-commerce Anomaly Detection via Dual-stage Learning. IEEE Access 2025, 13, 8963–8976. [Google Scholar] [CrossRef]
  15. Agarwal, P.; Srivastava, M.; Singh, V.; Rosenberg, C. Modeling user behavior with interaction networks for spam detection. In Proceedings of the 45th International ACM SIGIR Conference on Research and Development in Information Retrieval, Madrid, Spain, 11–15 July 2022; pp. 2437–2442. [Google Scholar] [CrossRef]
  16. Yang, J.; Cai, J.; Zhong, L.; Pi, Y.; Wang, S. Deep Masked Graph Node Clustering. IEEE Trans. Comput. Soc. Syst. 2024, 11, 7257–7270. [Google Scholar] [CrossRef]
  17. Luo, Y.; Li, S.; Sui, Y.; Wu, J.; Wu, J.; Wang, X. Masked Graph Modeling with Multi-View Contrast. In Proceedings of the 2024 IEEE 40th International Conference on Data Engineering (ICDE), Utrecht, The Netherlands, 13–16 May 2024; pp. 2584–8597. [Google Scholar] [CrossRef]
  18. Li, H.; Wang, X.; Zhang, Z.; Zhu, W. Out-of-distribution generalization on graphs: A survey. arXiv 2022, arXiv:2202.07987. [Google Scholar] [CrossRef] [PubMed]
  19. Mishra, P.; Piktus, A.; Goossen, G.; Silvestri, F. Node masking: Making graph neural networks generalize and scale better. arXiv 2020, arXiv:2001.07524. [Google Scholar] [CrossRef]
  20. Chen, Z.; Wu, Z.; Sadikaj, Y.; Plant, C.; Dai, H.-N.; Wang, S.; Cheung, Y.-M.; Guo, W. Adedgedrop: Adversarial edge dropping for robust graph neural networks. IEEE Trans. Knowl. Data Eng. 2025, 37, 4948–4961. [Google Scholar] [CrossRef]
Figure 1. An example of a fraud review that is difficult for the system to detect when harmful advertising text meaning ‘Click this link to win money.’ is hidden through special characters in the E- Commerce review contents.
Electronics 14 03660 g001
Figure 2. After node embedding, the proposed overall graph fraud detection process is implemented to stabilize the range of node embedding vector values.
Electronics 14 03660 g002
Figure 3. Internal structure of node embedding module. Similarity measurement neural network, RL module, intra-relation GNN, and inter-relation GNN interact in that order.
Electronics 14 03660 g003
Figure 4. Description of the RLM operation process and visualization of node masking.
Electronics 14 03660 g004
Figure 5. The specific computational process of scale regularization.
Electronics 14 03660 g005
Figure 6. Tendency toward performance improvement according to changes in embedding dimension in the additionally conducted, directly reproduced RioGNN architecture.
Electronics 14 03660 g006
Figure 7. Distribution change according to epoch between node embedding vectors that performed Euclidean regularization and node embedding vectors that performed only the node embedding module that maintains the size of the dimension.
Electronics 14 03660 g007
Figure 8. Comparative experiments to determine the impact of normalization on the models.
Electronics 14 03660 g008
Figure 9. Comparative experiments to determine the impact of the rc-factor on the models.
Electronics 14 03660 g009
Table 1. Graph construction information for the Amazon-Fraud dataset.
DatasetsNodesRelationEdges
Amazon-Fraud11,944U-P-U175,608
U-S-U3,566,479
U-V-U1,036,737
ALL4,398,392
Table 2. Comparative experimental results between existing methods and Euclidean regularization on the Amazon-Fraud dataset.
Previous Experiments
ModelCARE-GNNPC-GNNGTANRioGNN
AUROC89.73%95.86%97.50%96.19%
Ours experiments
ModelCARE-GNNPC-GNNGTANRioGNN-sr
AUROC87.83%96.66%96.99%98.11%
Disclaimer/Publisher’s Note: The statements, opinions and data contained in all publications are solely those of the individual author(s) and contributor(s) and not of MDPI and/or the editor(s). MDPI and/or the editor(s) disclaim responsibility for any injury to people or property resulting from any ideas, methods, instructions or products referred to in the content.