Abstract
With the increasing penetration of renewable energy in power systems, the multi-objective optimal scheduling of microgrids has become increasingly complex. Traditional optimization methods face limitations when addressing high-dimensional, nonlinear, and multi-constrained models. This study proposes a multi-objective optimal scheduling method for microgrids based on the Tuned Dung Beetle Optimization (TDBO) algorithm, aiming to simultaneously minimize operational and environmental costs while satisfying a variety of physical and engineering constraints. The proposed TDBO algorithm integrates multiple strategic mechanisms—including task allocation, spiral search, Lévy flight, opposition-based learning, and Gaussian perturbation—to significantly enhance global exploration and local exploitation capabilities. On the modeling side, a high-dimensional decision-making model is developed, encompassing photovoltaic systems, wind turbines, diesel generators, gas turbines, energy storage systems, and grid interaction. A dual-objective scheduling framework is constructed, incorporating operational economics, environmental sustainability, and physical constraints of the equipment. Simulation experiments conducted under typical scenarios demonstrate that TDBO outperforms both the improved particle swarm optimization (IPSO) and the original DBO in terms of solution quality, convergence speed, and result stability. Simulation results demonstrate that, compared with benchmark algorithms, the proposed TDBO achieves a 2.24–6.18% reduction in average total cost, improves convergence speed by 27.3%, and decreases solution standard deviation by 18.8–23.5%. These quantitative results highlight the superior optimization accuracy, efficiency, and robustness of TDBO in multi-objective microgrid scheduling. The results confirm that the proposed method can effectively improve renewable energy utilization and reduce system operating costs and carbon emissions, and holds significant theoretical value and engineering application potential.
1. Introduction
With the global transformation of the energy structure and the growing penetration of renewable energy sources, optimal scheduling technologies for microgrids have emerged as a key approach to ensuring energy security, enhancing grid resilience, and reducing environmental pollution. In recent years, international research has increasingly focused on the potential of microgrids in multi-environmental sustainability. Correspondingly, the scope of optimal scheduling has evolved from single-objective formulations to more complex scenarios involving multi-objective optimization, multiple uncertain sources, and multi-temporal-spatial scales [1]. At the same time, emerging information technologies and intelligent algorithms are being rapidly integrated into microgrid scheduling systems, steering research toward data-driven modeling, adaptive optimization, and globally coordinated control strategies [2]. In terms of optimization methodologies, conventional mathematical programming is gradually being replaced by more flexible and adaptive intelligent optimization algorithms. In particular, metaheuristic methods with strong global search capabilities are demonstrating significant advantages in solving nonlinear, high-dimensional, and multi-constrained problems, becoming a major focus in both academia and industry worldwide [3]. Nevertheless, the inherent randomness and intermittency of renewable energy sources such as wind and solar power pose substantial challenges to the effective handling of uncertainty in scheduling [4]. This remains a critical issue for both researchers and practitioners [5]. Numerous recent studies have highlighted the limitations of existing uncertainty-handling techniques [6]. For example, robust optimization approaches often result in overly conservative solutions that compromise economic performance, while probabilistic optimization methods are heavily reliant on accurate probability distributions, which are difficult to obtain and apply effectively in real-world engineering scenarios [7].
In response to the complexity and uncertainty inherent in microgrid scheduling problems, metaheuristic algorithms have garnered significant attention due to their independence from explicit mathematical models and ease of implementation. However, traditional metaheuristic approaches such as Particle Swarm Optimization (PSO) and Genetic Algorithms (GA) often encounter practical limitations, including a tendency to become trapped in local optima, insufficient global search capability, and slow convergence rates [8]. As a novel branch within the family of metaheuristic algorithms, the Dung Beetle Optimization (DBO) algorithm has demonstrated promising convergence behavior and search performance. Nevertheless, DBO still suffers from certain shortcomings, such as an imbalance between global exploration and local exploitation, as well as a propensity for premature convergence [9].
The navigational behavior of dung beetles, as a unique biological mechanism, exhibits exceptional adaptability to the environment and remarkable optimization capabilities. [10]. In natural settings, dung beetles navigate efficiently by exploiting spatial information from sunlight, moonlight, and even polarized light, enabling them to reach their destinations both rapidly and accurately [11]. This natural phenomenon closely parallels the nature of multi-objective optimization problems, which require the simultaneous balancing of multiple objectives—such as economic cost, environmental impact, and system reliability—while maintaining coordination between global exploration and local exploitation [12]. Therefore, mapping dung beetle navigation behavior onto the multi-objective scheduling problem of microgrids offers a novel perspective for addressing the limitations of traditional algorithms.
To this end, this paper proposes a multi-objective microgrid scheduling method based on the Tuned Dung Beetle Optimization (TDBO) algorithm. The primary innovations lie in the introduction of an individual role assignment mechanism—comprising producers, searchers, and carriers—combined with a dynamic scaling factor to regulate the search range. The algorithm further integrates spiral search and Lévy flight strategies to enhance both local exploitation and global exploration capabilities. In addressing the microgrid scheduling problem, a multi-objective function is constructed that incorporates operational cost, environmental cost, and multiple penalty terms. The improved algorithm not only enhances solution accuracy and convergence speed but also demonstrates strong constraint-handling capability and practical engineering adaptability.
The research presented in this paper offers new insights and methodologies for tackling the challenge of uncertainty in microgrid optimal scheduling, highlighting both significant theoretical value and promising engineering application potential.
The main contribution of this paper is to propose a multi-objective optimal scheduling method for microgrids based on the improved dung beetle optimization algorithm (TDBO). First, the global exploration capability and local exploitation accuracy of the algorithm when dealing with high-dimensional nonlinear multi-constraint problems are significantly enhanced by systematically integrating individual role assignment, spiral search, Lévy flight, stochastic dyadic learning and Gaussian perturbation strategies. Second, a multi-objective mathematical model for the synergistic optimization of economic cost and environmental emission is constructed, and a unified constraint penalty mechanism is introduced to effectively improve the physical and technical feasibility of the optimization results. Third, the normalization and sensitivity analysis methods are adopted to achieve the trade-off and regulation between economic and environmental objectives, and enhance the application flexibility of the model. Finally, the superiority of the proposed method in terms of solution quality, convergence speed and robustness is demonstrated through simulation experiments comparing with the Improved Particle Swarm Algorithm (IPSO) and the traditional Dung Beetle Optimization (DBO) algorithm. The results of this research not only expand the applicability of the meta-inspired algorithm in the field of complex microgrid scheduling, but also provide a theoretical basis and practical reference for the economically efficient and environmentally friendly operation of microgrids.
2. Materials and Methods
2.1. Optimal Operation Model of Microgrid System
In a microgrid environment, multiple energy units—including distributed generation sources such as wind turbines, photovoltaic systems, diesel generators, gas turbines, and energy storage systems—jointly participate in load supply and energy exchange. To balance both economic efficiency and environmental sustainability, it is essential to establish an appropriate mathematical model for the power allocation and scheduling of these various components [13]. The following sections present the models of key devices within the microgrid and the approach to multi-objective optimization, integrated with the Tuned Dung Beetle Optimization (TDBO) algorithm to implement the overall scheduling strategy. Figure 1 illustrates the structure of the microgrid system considered in this study.
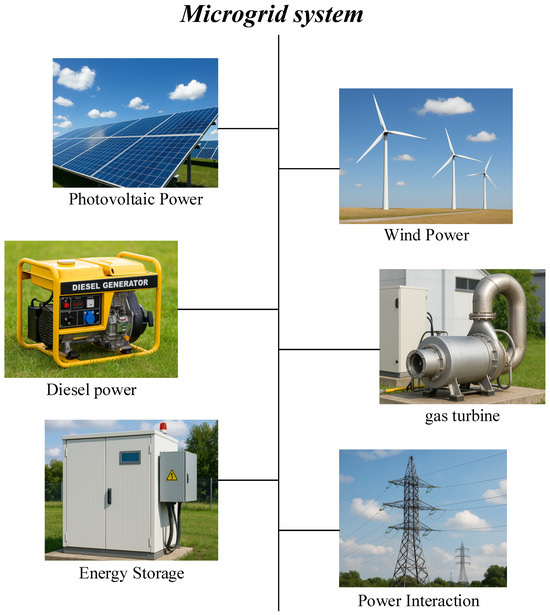
Figure 1.
Structure of the operational model of the microgrid system.
2.1.1. Wind Turbine Model
The output power of a wind turbine is typically influenced by factors such as wind speed and the power characteristics of the unit. Over discrete time periods , the wind power output can be simplified as a combination of its forecasted value and a controllable dispatch range:
The wind speed at time t, denoted as , is bounded by the turbine’s minimum and maximum allowable wind speeds, and , respectively. The function represents the power output characteristics of the wind turbine. In practical scheduling scenarios, the forecasted wind speed or predicted wind power output is typically treated as an upper bound, within which the actual dispatch power is optimally allocated using the proposed algorithm [14].
The output power of a photovoltaic (PV) generation system is primarily influenced by solar irradiance, ambient temperature, and module efficiency [15]. Given that the predicted PV output has been obtained through short-term forecasting methods, the available PV generation power in the scheduling model is typically constrained within the range . Letting denote the optimized dispatch variable, the constraint can be expressed as:
2.1.2. Diesel Generator Model
The output power of a diesel generator, , can typically be continuously adjusted within a specified range, subject to considerations of operating cost and emission characteristics. The fuel consumption rate is commonly modeled using a quadratic polynomial or a piecewise function. If the total operating cost is divided into operation and maintenance and emission cost , the total cost at time t can be expressed as:
Here, and represent the fuel cost coefficients of the diesel generator, while denotes the coefficient associated with emission-related costs.
In the diesel generator model, the parameters , and represent the linear fuel consumption coefficient, quadratic coefficient, nonlinear loss adjustment factor, and the unit maintenance cost per output power, respectively. These parameters are selected based on the typical operational characteristics of small- and medium-sized distributed diesel units. Approximate empirical values are derived through normalization and fitting of operational data from multiple representative generator models. This setting not only captures the fuel consumption trends under different load conditions, but also facilitates coordinated optimization with other energy units within a unified modeling framework [16].
Similarly, the input–output characteristics of the gas turbine are determined empirically according to its thermal efficiency profile, and a fixed maintenance cost is introduced based on common operational levels. For the energy storage system, parameters such as charge/discharge efficiency, maximum power boundaries, and state update coefficients are set according to standard engineering specifications of lithium battery packs, considering practical operating ranges and loss factors under control strategies. All parameters are selected to ensure both physical rationality and simulation consistency, thereby enabling fair comparison and reliable system response in the integrated scheduling of multi-energy systems.
2.1.3. Gas Turbine Model
The output power of a gas turbine, , is also subject to rated upper and lower limits. Its operating cost can be divided into operation and maintenance cost () and emission cost (). These costs can be represented using a similar polynomial formulation or empirical equations:
Here, and are the fuel cost coefficients of the gas turbine, and denotes the emission coefficient.
2.1.4. Energy Storage System Model
Energy storage systems play a vital role in microgrids by enabling peak shaving, valley filling, and emergency backup. Let denote the charge/discharge power of the battery energy storage system at time t, where > 0 indicates discharging indicates charging. To characterize the battery’s condition, the state of charge (SOC) at time t, denoted as , is introduced. Its dynamic evolution can be described as:
Here, and represent the charging and discharging efficiencies, respectively. Additionally, the state of charge must be maintained within its allowable range [, ].
2.1.5. Specification of Key Model Coefficients
To accurately quantify the economic and environmental costs associated with the operation of various microgrid components, specific parameter values utilized in Equations (2)–(6) are explicitly defined in this study. In the diesel generator cost function, the quadratic term coefficient is set to 0.00011, the linear term coefficient is 0.308, and the constant term is 6. For the gas turbine cost function, a more complex formulation is employed, with a linear term coefficient of 0.0293 and a nonlinear component whose numerator coefficient is approximately 0.2602. The polynomial denominator coefficients are set as follows: cubic term 0.0753, quadratic term −0.3095, linear term 0.4174, and constant term 0.1068. The operating cost coefficient for the energy storage system is set at 0.026 RMB/kW. Additionally, grid interaction costs are determined by the imported time-of-use electricity prices, where the specific unit prices for electricity purchase and sale vary according to actual data. For environmental costs, the corresponding coefficients are explicitly defined as follows: diesel generator environmental cost per unit power is approximately 97.948 RMB, gas turbine environmental cost per unit power is approximately 292.682 RMB, and grid-purchased electricity environmental cost per unit power is approximately 32.685 RMB. Clarifying these parameters ensures consistency and reproducibility in the simulation calculations, thus reinforcing the reliability and generalizability of the research findings presented in this paper.
All cost and emission coefficients adopted in this study are assigned based on a combination of actual engineering data, manufacturer technical documentation, and published references relevant to microgrid applications. Where possible, the values are extracted from the technical specifications of typical diesel generators, gas turbines, and energy storage devices that are widely used in commercial or research-oriented microgrid testbeds. For grid-related parameters, real-world time-of-use pricing and emission rates from regional utilities are employed to reflect authentic market and regulatory conditions.
Where direct empirical data are unavailable, parameter values are selected from authoritative literature and engineering handbooks, and are further validated for physical plausibility and consistency with standard industry practice. This approach ensures that all parameter settings are not only clearly specified, but also representative and readily adjustable for different microgrid system configurations, supporting both the reproducibility of the results and the practical adaptability of the proposed optimization framework.
2.1.6. Load Demand and Grid Interaction
The load demand within the microgrid, , can be obtained through forecasting or real-time measurements. When the supply from local distributed energy resources and energy storage systems is insufficient, electricity must be purchased from the main grid; conversely, surplus power can be exported to the grid. Let denote the power exchanged with the main grid, where a positive value indicates power purchase and a negative value indicates power sale. The electricity purchase and sale prices, denoted as and , respectively, are typically time-varying and are incorporated into the objective function.
2.2. Multi-Objective Optimization Function
Microgrid scheduling must account not only for economic performance but also for environmental impacts, thereby forming a multi-objective optimization problem. A common approach is to incorporate both operational cost and environmental cost (or emissions) into the optimization objectives [17]. To facilitate the solution process, techniques such as weighted sum, hierarchical optimization, or Pareto front analysis can be employed to handle multiple objectives. In this section, a representative form of a multi-objective function is presented using the weighted sum method as an example.
2.2.1. Economic Objective
The economic objective primarily consists of the fuel and operation and maintenance costs of distributed generators, the operating cost of the energy storage system, and the electricity purchase and sale costs arising from power exchange with the main grid. By dividing the microgrid’s operating period into discrete time intervals , the total operational cost can be obtained by aggregating the economic cost over all time steps.
where:
denotes the operating cost of the diesel generator at time period , including both fuel and operation & maintenance expenses;
represents the operating cost of the gas turbine at time ;
refers to the charging/discharging or energy loss cost of the energy storage system at time ;
indicates the electricity trading cost between the microgrid and the main grid.
The coefficients , , , , , and are the fuel and operation and maintenance (O&M) cost coefficients for the diesel generator and gas turbine. denotes the energy loss or O&M cost of the battery energy storage system (BESS) at time , where is the charging/discharging power and is the unit cost or efficiency penalty associated with the storage system. is the cost of power exchange between the microgrid and the main grid at time .
If indicating power purchase from the main grid, the cost is expressed as ;
If , indicating power sale to the main grid, the income is represented as , and the corresponding cost is treated as a negative value.
To prevent excessive ramping of generation units or frequent deep charging and discharging of energy storage systems, some studies incorporate corresponding penalty terms into the economic objective. Examples include ramp-rate violation penalties for diesel generators and state-of-charge () boundary violation penalties for energy storage systems. These penalty terms are typically linked to constraint violations and can be addressed either by adding penalty coefficients when constraints are breached or by employing an “infeasible solution rejection” strategy during optimization.
2.2.2. Environmental Objective
The environmental objective is commonly used to assess the emission levels or environmental costs associated with microgrid operation and may consist of the following components:
Emissions from fossil fuel-based generation:
Diesel generator emissions: Pollutants associated with the output power of the diesel generator , such as , SOx and Nox, can be converted into corresponding environmental costs, denoted as .
Gas turbine emissions: Emissions associated with the output power of the gas turbine are converted into environmental cost . A simplified approach involves defining emission coefficients and , which represent the environmental cost per unit of power output for the diesel generator and gas turbine, respectively. Thus, we have:
Indirect Emissions from Grid Electricity Purchases:
If the microgrid needs to purchase electricity from the main grid, the emission intensity of the grid’s generation mix can also be considered, represented by the emission coefficient . At time period , if , then:
For the electricity exported to the grid, the corresponding emission cost is typically disregarded or considered as negative emissions.
By aggregating the emissions or environmental costs from all the aforementioned components over the entire scheduling horizon, the total environmental cost can be obtained as :
where
denotes the total environmental cost over the scheduling horizon.
and represent the emissions or environmental costs associated with the diesel generator and gas turbine at time , calculated by multiplying their respective emission coefficients (, ) with the power output.
is the environmental cost attributed to power exchange with the main grid, where and denote the emission coefficients for purchasing or selling electricity, respectively. If > 0, grid power is purchased and the associated emissions are ; if < 0, grid power is sold and the net emissions are represented as a negative contribution.
2.2.3. Multi-Objective Formulation and Weighted Sum Method
When integrating the economic objective and the environmental objective into a multi-objective optimization problem, the commonly used weighted sum method can be expressed as:
Here, and are weighting coefficients used to balance the economic and environmental objectives. A larger places greater emphasis on economic performance, while a larger reflects a stronger focus on environmental impact. For further exploration of the nonlinear trade-offs between multiple objectives, adaptive weighting strategies or Pareto front methods can be employed to obtain a set of feasible solutions.
In multi-objective optimization, the objective functions often differ in units or exhibit significant differences in magnitude. Direct application of the weighted sum method may result in one objective dominating the entire optimization process. To address this issue, this study introduces normalization and sensitivity analysis mechanisms in the assignment of weight coefficients and . Specifically, the economic objective and the environmental objective are first subjected to min–max normalization, scaling their values to the range [0, 1], thereby ensuring comparability during the weighted summation:
Furthermore, to evaluate the impact of weight variation on the structure of optimal solutions and scheduling strategies, three representative weight combinations were tested by setting ∈ {0.2, 0.5, 0.8}, and = 1 − . The comparative results indicate that when ≥ 0.5, the system tends to favor gas turbines and energy storage to reduce operational costs. In contrast, when ≥ 0.5, the dispatch priority of photovoltaic and wind power significantly increases, and power exports to the main grid rise accordingly, reflecting the system’s sensitive response to environmental cost considerations. This analysis provides both theoretical support and practical guidance for adaptively adjusting weight coefficients based on specific scenario requirements in real-world applications.
To clarify the assignment of the weight coefficients α and β in Equation (19), this study adopts a two-step mechanism comprising normalization and sensitivity-driven selection. Initially, both the economic objective and the environmental objective are normalized using the min–max method to eliminate scale inconsistencies. Following normalization, the weights are selected from representative combinations to reflect different scheduling priorities. Specifically, three scenarios are examined with α ∈ {0.2, 0.5, 0.8} and β = 1 − α, corresponding to environment-oriented, balanced, and economy-oriented dispatching schemes, respectively. These values are chosen based on widely accepted practice in multi-objective energy optimization literature, allowing for a structured trade-off analysis. Furthermore, the sensitivity of the solution structure to variations in α and β is evaluated through comparative simulation to ensure robustness. The selected values thus not only support interpretability but also guide practical deployment under varying system priorities.
It is important to distinguish between the role of the weighting coefficients α and β used in the objective function (Equation (12)) and the penalty weights , , …, used in the unified penalty function. Specifically, α and β are decision-level preference indicators that control the relative importance of the normalized economic cost and environmental cost , directly influencing the shape of the Pareto solution. In contrast, (i = 1,2, …, 5) are constraint-handling parameters that penalize violations of physical limits—such as power balance, energy storage SOC, generator ramp rates, and grid interaction boundaries—within the fitness function. Their purpose is to enforce feasibility rather than reflect trade-off preferences.
In terms of implementation, α and β are selected from a predefined set {0.2, 0.5, 0.8} for simulation-based sensitivity analysis, whereas the penalty weights are empirically determined through calibration to ensure effective constraint suppression without overpowering the objective terms.
This distinction ensures that multi-objective trade-offs and physical constraint enforcement are decoupled in the optimization process, thereby improving interpretability and robustness.
2.2.4. Determination of Objective Function Bounds
To enable objective normalization and ensure comparability in multi-objective optimization, this study determines the minimum and maximum values for each objective function using a combination of extreme-case single-objective optimization and historical data validation. Specifically, for each objective (e.g., operating cost, environmental cost), the lower and upper bounds are calculated as:
where represents all decision variables of the system, and denotes the feasible region defined by all operational constraints (such as energy balance, device boundaries, and storage limits). The minimum value is obtained by minimizing the objective as a single criterion using the proposed optimization algorithm; the maximum value is analogously derived via maximization under the same constraints.
The obtained bounds are further cross-checked against historical microgrid operation data and the physical limits of system components, ensuring that the selected minima and maxima are both theoretically valid and practically applicable. Ultimately, objective normalization and weight parameters in the optimization model are established based on these boundaries, facilitating fair trade-offs and comparable results among multiple objectives.
2.2.5. Constraint Conditions
When minimizing the objective function, multiple constraints must be satisfied, including:
Power Balance Constraint
Output Upper and Lower Limits of Equipment
Energy Storage System Constraints
These include constraints on the charging and discharging power of the energy storage system, upper and lower bounds of the state of charge (SOC), and ramp rate limits [14].
Here, and represent the charging and discharging efficiencies, respectively.
Grid Interaction Constraints
The maximum allowable power for purchasing from or selling to the main grid is constrained and can be expressed as:
Ramping and Start-Stop Constraints of Equipment
To ensure equipment safety and prolong operational lifespan, the power ramp rates of diesel generators and gas turbines are typically constrained as follows:
Solutions that violate the above constraints must either incorporate corresponding penalty terms into the objective function or be treated as infeasible and discarded. This ensures that the final optimized solution meets system safety and operational requirements.
Equation (29) contains inherent non-linearity due to the inclusion of quadratic, product, or other nonlinear terms in the system model. This non-linearity is explicitly handled by the proposed optimization framework, which is designed to accommodate complex, nonlinear, and non-convex objective functions and constraints. Specifically, the Tuned Dung Beetle Optimization (TDBO) algorithm is a population-based metaheuristic method that does not require the objective function to be linear, convex, or differentiable. The TDBO algorithm operates directly on the original nonlinear mathematical model, employing mechanisms such as role division, spiral search, and Lévy flight to efficiently explore and exploit the search space, even in the presence of severe non-system, grid power exchange limits, and ramp rate constraints of generating units. Each type of constraint is associated with an independent penalty function.linearity.
Additionally, all nonlinear relationships in Equation (29), such as quadratic cost functions, emission curves, and storage dynamics, are preserved in their original form without linearization. This ensures that the optimization results accurately reflect the physical and operational characteristics of the microgrid system. Simulation results further confirm the effectiveness and robustness of the proposed algorithm in solving nonlinear multi-objective scheduling problems.
To ensure clarity in constraint modeling, the ramp rate limits for diesel generators (RDE) and gas turbines (RMT) referenced in Equation (29) are explicitly defined in this study. These parameters represent the maximum allowable change in output power between two consecutive time intervals, introduced to protect the mechanical integrity and prolong the service life of conventional generators. Specifically, RDE is set to 12 MW/h for diesel generators, and RMT is set to 15 MW/h for gas turbines, based on typical operational characteristics reported in literature and manufacturer specifications. These values serve as hard constraints during the optimization process and are embedded within the penalty function to eliminate solutions that violate generator dynamic operating capabilities.
2.3. Multi-Objective Optimal Scheduling of Microgrids Based on the Tuned Dung Beetle Optimization Algorithm
2.3.1. Problem Description and Model Formulation
In a grid-connected microgrid system, the configuration comprises photovoltaic generation, wind power, diesel generators, micro gas turbines, energy storage devices, and power exchange with the main grid. The power output of each subsystem is influenced by environmental conditions and equipment characteristics: photovoltaic output depends on solar irradiance and temperature, wind generation is constrained by wind speed variability, and diesel generators and gas turbines are subject to start–stop limitations and ramp rate constraints. Additionally, the charging and discharging efficiency as well as the state of charge (SOC) of energy storage devices must strictly adhere to operational limits [18]. During operation, the system must maintain real-time balance between load demand and the power outputs of generation units, while simultaneously satisfying both economic efficiency and environmental sustainability requirements [19,20].
The objective of this study is to minimize the total operating cost and environmental cost of the microgrid while satisfying all operational constraints. The scheduling variables represent the power outputs of six types of equipment across 24 hourly time intervals, resulting in a total decision space of 144 dimensions. The optimization objective function aims to minimize the sum of operating and environmental costs, where the operating cost includes the expenses associated with diesel generators, gas turbines, energy storage systems, and grid electricity transactions, and the environmental cost is quantified based on pollutant emissions from each unit and the corresponding mitigation expenses. To ensure that the obtained solutions comply with the physical and technical constraints, violations in storage SOC fluctuation, ramp rates, and power balance are converted into penalty terms and incorporated into the objective function, thereby penalizing infeasible scheduling solutions in terms of fitness [13].
Within the model, the power output of each device must remain within its prescribed upper and lower bounds. In each time period, the sum of power outputs from all generation units and grid interaction must exactly match the load demand. Additionally, the state of charge (SOC) of the energy storage system must remain within a defined safe operating range at all times to prevent overcharging or deep discharging. The power purchased from or sold to the main grid is also subject to technical constraints imposed by the grid interface. Based on the above objectives and constraints, the microgrid scheduling problem is formulated as a high-dimensional, nonlinear, and multi-constrained optimization problem, mathematically expressed as follows:
Here, denotes the penalty function associated with the constraint violations, which ensures that any infeasible solutions are appropriately penalized during the optimization process. This mechanism guides the algorithm toward feasible solutions that satisfy all operational and technical constraints.
The establishment of this model not only provides an accurate mathematical foundation for the economic scheduling of microgrids but also lays the theoretical groundwork for solving the problem using the TDBO algorithm. By integrating operating cost, environmental cost, and constraint penalty terms into a unified framework, the model comprehensively captures the real-world operational characteristics of grid-connected microgrid systems. Furthermore, it defines a precise optimization objective that facilitates the application of the TDBO algorithm to achieve global optimization.
2.3.2. Algorithm Description
Principles and Overall Framework of the Tuned Dung Beetle Optimization Algorithm
The Dung Beetle Optimization (DBO) algorithm is selected as the core optimization tool for solving the multi-objective microgrid scheduling problem, and multiple strategic enhancements are introduced to improve its global exploration and local exploitation capabilities. The fundamental concept of the DBO algorithm is inspired by various behavioral patterns of dung beetles in nature, including rolling, dancing, stealing, and breeding—each corresponding to different search strategies executed by distinct types of individuals within the population [21]. Similar to conventional intelligent algorithms, DBO operates on a population of candidate solutions, with each individual iteratively updated within the feasible solution space to minimize the comprehensive cost of the microgrid.
Specifically, the population size is defined as , the maximum number of iterations as , and the position of each individual is represented by , where corresponds to the power outputs of six types of devices over 24 scheduling intervals. The overall algorithmic flow is illustrated in Figure 2. The fitness function of the algorithm is closely aligned with the objective function; in this work, the microgrid’s operating cost, environmental cost, and constraint penalties are integrated into a unified fitness metric, enabling the algorithm to balance economic efficiency and environmental performance throughout the evolutionary process.
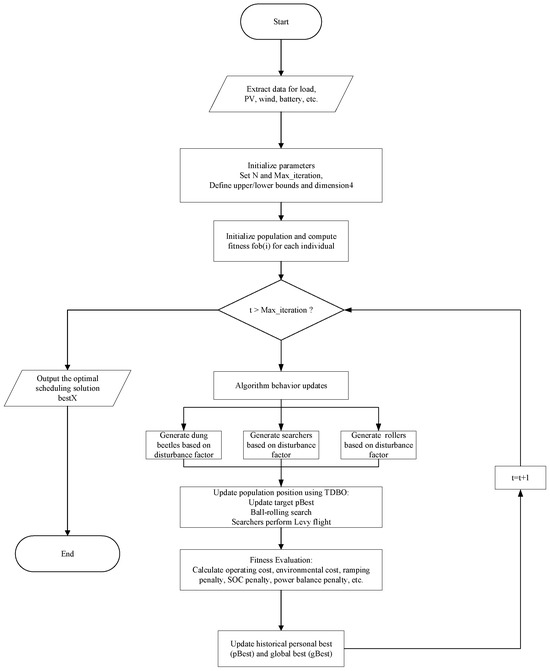
Figure 2.
Flowchart of the TDBO algorithm.
To further enhance the adaptability of the Dung Beetle Optimization (DBO) algorithm in high-dimensional, multi-constrained problems, this study introduces structural improvements to the original DBO framework and proposes the Tuned Dung Beetle Optimization (TDBO) algorithm, which demonstrates higher innovation in terms of multi-strategy integration. Unlike previous studies that typically incorporate a single mechanism (such as Lévy flight or opposition-based learning) to improve performance, TDBO systematically integrates five strategies from multiple dimensions, including behavioral role modeling, search path structuring, perturbation mechanisms, and population dynamics control: individual role collaboration mechanism, dynamically scaled spiral search, Lévy flight-based long-distance perturbation, random opposition-based learning, and Gaussian local perturbation.
Particularly in terms of role division, this study is the first to map the “navigation–cooperation–competition” characteristics of dung beetle behavior in nature into three algorithmic subgroups: producers, searchers, and carriers, each assigned with distinct update strategies. This enables coordinated regulation between global exploration and local exploitation from the perspective of mechanism design. The structural innovation achieved through this multi-strategy coupling and behavioral heterogeneity constitutes one of the main theoretical contributions of TDBO compared with the original DBO and other multi-strategy metaheuristic algorithms. Figure 3 schematically illustrates the transition from the basic DBO update pattern to the more diversified and adaptive update process in TDBO.
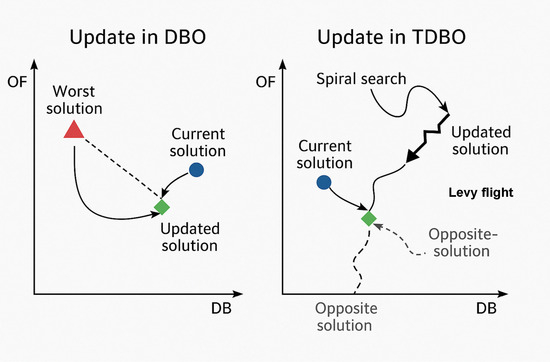
Figure 3.
Comparison of update mechanisms between TDBO and DBO.
Dung Beetle Optimization Algorithm Multi-Subgroup Strategy
In the dung beetle optimization algorithm, individuals are typically divided into several subgroups, each assigned distinct behavioral patterns. The first group simulates the “rolling dung” behavior, where individuals determine their rolling direction based on the position of the worst-performing individual. The second group mimics the “dancing” behavior observed when encountering obstacles, randomly altering their movement direction through update mechanisms based on functions such as or . The third group performs a “stealing” operation, making large jumps by directly referencing the position of the best-performing individual. A portion of individuals also engage in reproduction or foraging, enabling fine-grained search within local regions.
To enhance the balance between global exploration and local exploitation, the algorithm classifies individuals in each generation into roles such as producers, searchers, and carriers based on their fitness ranking within the population. Each role follows a distinct update strategy, thereby maintaining population diversity and improving search efficiency.
Compared with the Dung Beetle Optimization (DBO) variants introduced in references [12,22], the Tuned Dung Beetle Optimization (TDBO) algorithm proposed presents a more comprehensive and structurally innovative design. While the algorithms in [12,22] typically enhance DBO using isolated mechanisms—such as incorporating Lévy flights [12] or opposition-based learning strategies [22]—they often improve only a single behavioral phase or rely on static update rules. In contrast, the TDBO algorithm systematically integrates five complementary strategies: dynamic role assignment among producers, searchers, and carriers; spiral search for fine-grained local exploitation; Lévy flight for long-distance exploration; random opposition-based learning to maintain population diversity; and Gaussian dimension-wise mutation for escaping stagnation. These mechanisms are embedded into a multi-stage update framework, allowing adaptive coordination between global and local search behaviors across different evolutionary phases.
Moreover, TDBO introduces a behaviorally mapped subgrouping model that is biologically inspired yet mathematically structured, enabling each subgroup to execute distinct update strategies based on its role and fitness rank. This formulation not only enhances convergence precision and robustness but also outperforms previous DBO variants in complex, high-dimensional constrained optimization scenarios such as microgrid scheduling. Therefore, the proposed TDBO represents a substantial methodological advancement over existing DBO-based algorithms.
Building upon these behavioral foundations, the TDBO algorithm incorporates several substantive methodological innovations that clearly differentiate it from both the canonical DBO and previous variants. Specifically, TDBO introduces a time-dependent contraction factor, which dynamically shrinks the search space as iterations proceed, thereby accelerating convergence and preventing excessive exploration in later optimization stages. Additionally, an adaptive spiral search mechanism is embedded to enhance local exploitation, enabling fine-tuned solution refinement during the middle and late evolutionary phases. The algorithm also employs distribution-based perturbation and dynamically controlled mutation, increasing population diversity and mitigating the risk of premature convergence. Unlike prior studies—which often improve DBO through the isolated addition of a single mechanism—TDBO systematically integrates these strategies into a unified, multi-stage update framework, wherein the interplay between global and local search is adaptively coordinated based on the evolutionary stage and population fitness ranking.
Moreover, TDBO employs a behaviorally mapped subgrouping model that leverages both biological inspiration and rigorous mathematical design: each subgroup (producers, searchers, carriers) is dynamically assigned according to real-time fitness rankings, and executes tailored update strategies specific to its role and phase. This structured role allocation is not a mere combination of existing strategies but a cohesive, biologically grounded system for adaptive population management. As a result, TDBO achieves superior convergence accuracy, stability, and scalability in high-dimensional, constrained optimization settings, as evidenced by its performance in microgrid scheduling scenarios.
In summary, the proposed TDBO represents a substantial methodological advancement over existing DBO-based algorithms, offering a structurally integrated and adaptively coordinated optimization framework, rather than a simple aggregation of heuristic enhancements. This not only clarifies but concretely substantiates the advantages of TDBO over prior approaches.
Multi-Strategy Enhancement Mechanisms
To overcome the limitations of the original Dung Beetle Optimization algorithm, such as its tendency to become trapped in local optima and its relatively slow convergence speed, multiple enhancement mechanisms are introduced:
First, a random opposition-based learning strategy is introduced. When early convergence is detected during the optimization process, a portion of individuals are reflected in the opposite direction to promote exploration and maintain population diversity. Second, a spiral search strategy is employed to enhance local exploitation capability, where a spiral factor defined as is used to generate new positions for individuals. Third, Lévy flight is adopted to increase the probability of long-distance jumps, with Lévy-distributed random numbers used for large-step updates in the carrier subgroup, expressed as:
where:
It is typically set within the range [1.5, 2], where and are random variables following a normal distribution. Fourth, to address the stagnation issue of the dung beetle algorithm in local regions, Gaussian dimension-wise mutation is introduced. When an individual exhibits poor fitness or stagnation, Gaussian perturbation is applied to selected dimensions, allowing the individual to continue searching within its neighborhood. The expression can be defined as:
where denotes the standard deviation, which is either decayed or adaptively adjusted to balance the breadth and depth of the search.
Fitness Evaluation and Penalty Term Design
During the algorithm’s iterative process, the objective function value of each individual is calculated based on the operational model of the microgrid system, and penalty terms for constraint violations are added to obtain the final fitness value. For the multi-objective optimization problem of the microgrid, this study combines the operating cost and environmental cost , and superimposes penalty terms associated with constraints such as power balance, ramp rate limits, and SOC violations, resulting in:
If an individual violates a given constraint, a corresponding penalty value is added to its fitness according to the degree of violation, ensuring that the algorithm favors solutions that comply with all physical constraints. With this fitness definition, the TDBO algorithm is capable of dynamically balancing global exploration and local exploitation during the updating process, thereby continuously approaching the optimal scheduling solution.
To enhance the systematicity and controllability of constraint handling, this study adopts a unified weighted penalty method to explicitly embed all constraint conditions into the fitness function. These include power balance constraints, upper and lower output limits of equipment, state of charge (SOC) constraints for the energy storage system, grid power exchange limits, and ramp rate constraints of generating units. Each type of constraint is associated with an independent penalty function.
Here, α represents the weighting coefficients for each penalty term; denotes the sum of squared deviations in power balance; captures the SOC violation errors of the energy storage system; is the penalty term for ramp rate violations of generation units; and correspond to the boundary penalties for device output and grid interaction power, respectively. To avoid subjective bias in the optimization results caused by manual parameter settings, a sensitivity analysis of the weighting coefficients α is conducted in the simulation experiments. This ensures that the penalty functions effectively constrain infeasible solutions without overshadowing the dominance of the original optimization objectives. This mechanism enables TDBO to dynamically identify and penalize constraint-violating individuals during the optimization process, guiding the population to rapidly converge toward the feasible solution space.
The coefficients of in Equation (39)—such as cost, emission, and efficiency parameters—are determined based on a combination of engineering specifications, manufacturer data, and literature benchmarks relevant to distributed energy systems. The coefficients of , including cost, emission, and efficiency parameters, are determined based on a combination of actual engineering data, manufacturer technical documentation, and established values reported in the literature. For each generation unit and energy storage device, the corresponding coefficients are set according to typical performance specifications and operational characteristics for representative equipment widely used in practical microgrid applications.
This parameter selection approach ensures the flexibility and scalability of the proposed TDBO algorithm for different scenarios. By adjusting the coefficients to match the characteristics of specific devices or regional market/pricing structures, the model can be readily adapted to diverse microgrid configurations and operational environments. Sensitivity analyses further confirm that the algorithm maintains its effectiveness and robustness even when the coefficients vary within reasonable engineering ranges, supporting its practical applicability and generalization potential.
Specifically, coefficients representing fuel consumption, emission rates, and operational costs for each generation unit are set according to the technical documentation of actual equipment used in microgrid applications (e.g., typical values for diesel generators, gas turbines, and storage devices). Where direct measurement or manufacturer data are unavailable, reference is made to values reported in prior research and established engineering handbooks.
To clarify potential ambiguity, the coefficients and that appear in Equations (3) and (5) refer to the internal cost coefficients used in the economic modeling of gas turbines and diesel generators, respectively. These coefficients are associated with fuel cost components and are embedded within the operation cost models of individual generation units. In contrast, the coefficients (i = 1, 2, …, 5) presented in Equation (39) represent weighting parameters assigned to different constraint violation penalty terms—such as power balance, ramp rate, and SOC violations—in the fitness evaluation process. Therefore, the symbols used in Equations (3)–(5) and (39) refer to distinct quantities serving different roles within the model: the former relates to operational economics, and the latter to constraint enforcement
Although this study adopts a weighted summation approach to integrate the operating cost and environmental cost into a single-objective formulation, this strategy is a deliberate modeling choice made in consideration of engineering practicality and algorithmic convergence. Compared with traditional Pareto-based methods, the weighted sum method effectively reduces computational complexity and improves convergence speed while maintaining the feasibility of scheduling solutions. It is particularly suitable for microgrid scenarios that require fast response and explicit preference control.
The penalty coefficients used in the unified constraint violation function were selected through a combination of empirical tuning and sensitivity analysis. Initially, the coefficients were set based on established values commonly reported in the literature for similar multi-objective microgrid scheduling problems, ensuring that constraint violations were sufficiently penalized relative to the objective function scale. Subsequently, a series of parametric sensitivity tests were conducted to assess the impact of different penalty weights on solution feasibility and optimization performance. The selected values were those that consistently ensured all critical constraints—such as power balance, energy storage SOC limits, and ramp rate restrictions—were strictly enforced, while still allowing efficient exploration of the solution space. This calibration approach guarantees both the practicality and robustness of the penalty mechanism across diverse operating scenarios.
To demonstrate its multi-objective optimization capability, multiple sets of weighting coefficients were tested in simulation experiments. The results revealed distinct shifts in scheduling outcomes between economic and environmental objectives under different weights, confirming that the scalarized formulation still retains strong expressive power for multi-objective decision-making. Furthermore, the proposed TDBO algorithm is not a mere wrapper of traditional single-objective optimizers. Instead, it introduces strategic innovations such as role-based subpopulation division, spiral search, Lévy flight, and opposition-based learning, which together enhance global exploration and solution stability—further supporting the algorithm’s adaptability and novelty in complex energy system optimization.
Algorithm Iteration Process
Based on the aforementioned improvement strategies, the main iteration process of the Tuned Dung Beetle Optimization (TDBO) algorithm can be summarized as follows: first, the population is randomly initialized, with each individual representing a microgrid scheduling solution. Then, the fitness of all individuals is evaluated, and the population is divided into subgroups based on fitness ranking. Individuals assigned as producers, searchers, and carriers are updated using distinct position update equations, followed by boundary handling and the application of Gaussian or Lévy perturbations. Subsequently, fitness values are re-evaluated, and both the global best and individual historical best positions are updated. This process is repeated until the maximum number of iterations is reached or a convergence criterion is satisfied. Through this multi-subgroup, multi-strategy coordination mechanism, the algorithm is able to thoroughly explore the feasible solution space during iterations and gradually obtain scheduling solutions that are superior in both operational cost and environmental impact.
Simulation Settings
The simulation setup of the Tuned Dung Beetle Optimization (TDBO) algorithm for the multi-objective optimal scheduling problem of microgrids is configured as follows. All simulations are conducted using the MATLAB R2024b platform. First, forecast data for various microgrid components are extracted, including 24-h load profiles, predicted photovoltaic and wind power outputs, and corresponding electricity purchase and sale price information. Based on this dataset, the microgrid scheduling problem is formulated with 144 decision variables, representing the power outputs of six types of devices across 24 time periods. Upper and lower bounds are assigned according to the operational characteristics of each device—for example, the maximum outputs of photovoltaic and wind units are limited to their predicted values, the charging and discharging range of the energy storage system is set to [−30, 30] diesel generators and gas turbines are constrained by strict minimum and maximum output limits, and grid interaction power is bounded on both sides to ensure power balance at each time step.
In terms of algorithm parameter settings, the population size is set to 30, and the maximum number of iterations is 500. To verify the effectiveness and stability of the TDBO algorithm, the global best fitness value of each generation is recorded during the simulation process, and the corresponding convergence curve is plotted. The optimized results are decomposed into six sub-variables—namely, photovoltaic, wind power, energy storage, diesel generator, gas turbine, and grid interaction—to visually present the power dispatch strategy of each component. During execution, the algorithm applies different update rules to each subgroup and conducts boundary handling for updated individuals to ensure that all solutions remain within the feasible solution space.
Additionally, the simulation incorporates penalty function parameters to quantify the costs associated with violating constraints such as power balance, energy storage SOC limits, and ramp rate restrictions. This ensures that the objective function accurately reflects both the economic and environmental performance of the microgrid system. To guarantee the robustness of the simulation results, all experiments are repeated multiple times, and the optimal values, average performance, and convergence speeds are statistically analyzed and compared.
Although the multi-objective optimization method adopted in this study is implemented through a weighted summation model, it essentially retains the ability to balance and regulate preferences between conflicting objectives. During the simulation process, the operating cost and environmental cost were integrated using weight coefficients which transforms the multi-objective model into a scalar objective. The solution obtained under this configuration corresponds to a specific point on the Pareto front and represents the best compromise between economic efficiency and environmental sustainability under balanced preference settings.
To further demonstrate the preference-guided capability of the proposed method, multiple sets of weight combinations were tested. The results exhibit a clear trade-off trend between economic and environmental objectives, forming a set of feasible Pareto-like solutions. Among all feasible solutions, the final optimal solution selected in this study corresponds to the intermediate weight configuration (α = 0.5), which minimizes the overall cost while satisfying engineering constraints. This solution exhibits a well-balanced trade-off between economic and environmental objectives, ensuring strong representativeness, operational feasibility, and practical applicability.
Figure 4 illustrates the trade-off trends between operating cost and environmental cost under different weight coefficients (α) in the microgrid scheduling scheme. It can be observed that as α\alphaα increases, the operating cost decreases while the environmental cost increases, indicating a significant trade-off between the two objectives. When α\alphaα is small, the optimization is more focused on economic performance, resulting in lower operating costs but higher environmental costs; conversely, larger values of α\alphaα prioritize environmental benefits at the expense of higher operating costs.
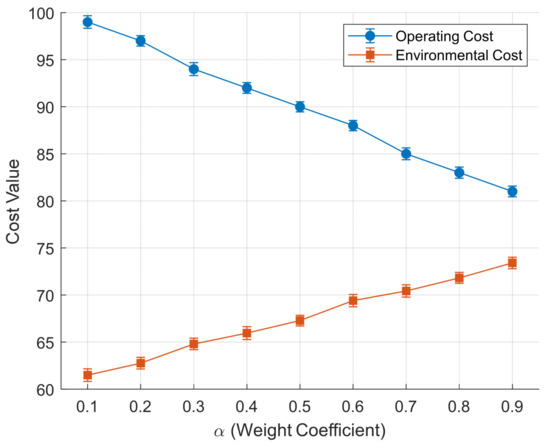
Figure 4.
Operating and environmental costs vs. weight coefficient.
Notably, around α = 0.5, the curves of operating cost and environmental cost are relatively close, and the error bars indicate that the fluctuations of both metrics are minimal. This suggests that the scheduling solution at α = 0.5 achieves a favorable balance between economic efficiency and environmental protection. Therefore, α = 0.5 is selected as the final weighting configuration, as it effectively reconciles cost control with emission reduction and aligns with the typical engineering principle of “compromise first” in real-world microgrid operation. The optimal solution under this weight is thus more representative and practically applicable.
The microgrid dispatching problem inherently exhibits multi-objective characteristics, involving trade-offs between economic efficiency and environmental sustainability. While the weighted summation method adopted in this study simplifies the multi-objective optimization into a single-objective framework, it is acknowledged that the selection of the weighting parameter α may not always achieve a perfectly balanced compromise between economic and environmental objectives.
To address this limitation, multiple α values were tested in the simulation analysis, and the resulting solutions were compared to illustrate the effect of different weightings. In practical applications, α can be flexibly tuned according to operator preferences, regulatory requirements, or specific scenario priorities. Future work will focus on integrating more advanced multi-objective optimization methods—such as Pareto-based evolutionary algorithms—to provide a broader set of compromise solutions and support more nuanced decision-making in microgrid scheduling.
All simulations and algorithm implementations were conducted using MATLAB R2024b. All algorithms were executed in single-threaded mode without parallel acceleration to ensure fair comparisons and reproducibility of the results.
Evaluation Metrics
This study employs multiple evaluation metrics to comprehensively assess the performance of the Tuned Dung Beetle Optimization (TDBO) algorithm in solving the multi-objective optimal scheduling problem of microgrids. First, with respect to the objective function of the scheduling model—namely, the joint minimization of operating cost and environmental cost—the optimal fitness value is defined as the primary indicator, where a lower value indicates better performance in terms of economic efficiency and environmental sustainability. Additionally, by statistically analyzing the best, average, and standard deviation values obtained from multiple independent runs, the algorithm’s stability and robustness can be intuitively evaluated. The best value reflects the algorithm’s peak performance in global exploration, the average value represents its overall effectiveness, and the standard deviation indicates the degree of dispersion in the solution set.
In addition, convergence speed serves as another critical evaluation metric. By recording the global best fitness value at each generation, a convergence curve is plotted to illustrate the number of iterations required for the algorithm to progress from initialization to final convergence. A fast convergence rate and a smooth curve indicate that the algorithm has achieved a favorable balance between exploration and exploitation. For the high-dimensional and nonlinear optimization problem addressed in this study, computational time is also considered as a supplementary metric to evaluate the algorithm’s solving efficiency under the given parameter settings.
In terms of constraint satisfaction, cumulative penalty values are calculated for violations of power balance, energy storage SOC constraints, and ramp rate limits, and are compared with the objective function value to assess whether the algorithm can effectively guide individuals to converge within the feasible solution space. Specifically, if the power balance error of an individual at time step t is denoted as , the total violation index can be defined as:
A lower value of this index indicates that the scheduling solution better satisfies the operational constraints of the actual system.
Finally, based on the scheduling results, a disaggregated analysis of the output profiles of each subsystem—such as PV, WT, BESS, DE, MT, and Grid—is conducted. The cost contribution and environmental emissions of each device are calculated, enabling a comprehensive system-level evaluation of the scheduling solution’s overall performance.
2.4. Model Solution Comparison
As a typical multi-objective optimization problem in power systems, microgrid optimal scheduling is characterized by high dimensionality, nonlinearity, multiple constraints, and conflicting objectives. Traditional algorithms often suffer from issues such as local optima and slow convergence when solving such problems, necessitating the adoption of advanced intelligent optimization algorithms to improve solution quality. The proposed economic–environmental bi-objective function is solved using the Improved Particle Swarm Optimization (IPSO), the original Dung Beetle Optimization (DBO), and the Tuned Dung Beetle Optimization (TDBO) algorithms. A comparative analysis is conducted to evaluate and contrast the optimization performance of the three approaches.
2.4.1. Improved Particle Swarm Optimization (IPSO)
The Improved Particle Swarm Optimization (IPSO) algorithm performs iterative searches within the solution space by simulating the collaborative behavior of the swarm and the individual learning experience [16]. To address the common issues of premature convergence and declining search capability in IPSO, this study introduces dynamic inertia weights and adaptive learning factors to enhance the algorithm’s search performance in high-dimensional nonlinear optimization problems.
2.4.2. Dung Beetle Optimization (DBO) Algorithm
The Dung Beetle Optimization (DBO) algorithm is an emerging bio-inspired intelligent optimization method, modeled on the natural behaviors of dung beetles, such as rolling dung balls, carrying, and foraging. The algorithm performs population evolution and updating through role differentiation—producers, searchers, and carriers—combined with a multi-strategy integration mechanism, demonstrating strong global search capabilities and maintaining population diversity [23].
The algorithm is primarily composed of three update strategies: first, in the producer phase, the main search direction is guided to effectively prevent individuals from falling into local optima; second, in the searcher phase, the use of spiral search paths enhances local exploitation capabilities; finally, in the carrier phase, the incorporation of the Lévy flight mechanism enables long-distance jumps, thereby improving the algorithm’s ability to explore unknown regions.
The position update of each individual is formulated as follows:
Here, and are adaptive parameters, and the Lévy jump introduces non-Gaussian perturbations, effectively enhancing the algorithm’s ability to escape from local optima.
2.4.3. Tuned Dung Beetle Optimization (TDBO) Algorithm
To further enhance the local exploitation efficiency and convergence accuracy of the DBO algorithm, this study introduces a time-control mechanism and mutation operations, and proposes a dynamically controlled variant—Tuned Dung Beetle Optimization (TDBO). While preserving the basic structure of the original DBO, TDBO incorporates several enhancements:
A time-dependent contraction factor R is employed to progressively shrink the search region as the number of iterations increases.
An adaptive spiral search factor Z is utilized to enhance fine-grained exploitation in the middle and later stages of the optimization process:
A distribution-based perturbation operation is employed to increase population diversity and prevent premature convergence, while the mutation probability of individuals is dynamically adjusted throughout the iteration process.
To improve clarity in the implementation of the adaptive perturbation mechanism in Equation (44), the weighting coefficients and are explicitly defined as dynamic control parameters governing the mutation probability of individuals over the course of the optimization process. Specifically, = 0.5 denotes the initial mutation intensity at the early stages of iteration, while = 0.1 represents the baseline mutation level preserved in the later stages. These values are selected based on empirical tuning and sensitivity tests to balance the exploration and exploitation capabilities of the algorithm.
It is acknowledged that the initial mutation intensity coefficient ( = 0.5) specified in Equation (44) is an empirically determined value that may not be universally optimal for all microgrid scheduling scenarios. To enhance the adaptability and robustness of the TDBO algorithm, the value of can be adjusted based on system characteristics, problem dimensionality, or specific operational requirements. In practical applications, sensitivity analyses or parameter tuning procedures should be employed to select appropriate values for that best balance exploration and exploitation for a given scenario. This flexibility ensures that the algorithm remains effective and generalizable across a wide range of microgrid configurations and operating environments.
In addition, TDBO incorporates a mutation strategy that integrates multiple local search directions:
Here, is the degree-of-freedom parameter. This mechanism significantly enhances the local precision and stability of the solutions while preserving the original global search capability of the algorithm.
2.5. Traditional Dung Beetle Optimization (DBO) and Improvements in TDBO
The traditional Dung Beetle Optimization (DBO) algorithm is inspired by the natural behavior of dung beetles and simulates three main processes: ball rolling, dancing navigation, and foraging. These mechanisms construct a preliminary balance between global exploration and local exploitation. Specifically, the rolling process guides local search, dancing behavior corrects the search direction to avoid local optima, and the foraging mechanism enhances population-level exploration. DBO features a simple structure and ease of implementation, making it applicable to various engineering problems.
However, standard DBO suffers from rapid loss of population diversity, limited convergence accuracy, and a tendency to stagnate in local optima. To address these shortcomings, this study proposes the Tuned Dung Beetle Optimization (TDBO) algorithm, which retains the basic behavior model and introduces five enhancements: a subgroup role division mechanism among producers, searchers, and transporters; spiral disturbance search to improve global jump ability; Lévy flight for enhanced exploration range; Gaussian mutation for refined local tuning; and opposition-based learning to increase initial population diversity. These modifications allow TDBO to achieve better convergence performance and solution robustness in complex multi-objective scenarios.
3. Case Study Analysis
3.1. Case Study Analysis
To comprehensively verify the effectiveness of the proposed Tuned Dung Beetle Optimization (TDBO) algorithm in solving the multi-objective optimal scheduling problem of microgrids, a typical grid-connected microgrid system is constructed, incorporating various types of distributed energy resources and grid interaction capabilities. This system includes photovoltaic generation (PV), wind turbines (WT), diesel engines (DE), microturbines (MT), a battery energy storage system (BESS), and bidirectional energy exchange with the main grid. The configuration reflects the complex characteristics of multi-energy coordination in real-world microgrid operation scenarios.
The present case study considers a grid-connected microgrid architecture, which enables both import and export of electricity with the main power grid via bidirectional coupling. The microgrid includes multiple distributed energy resources, such as photovoltaic (PV) arrays, wind turbines (WT), diesel engines (DE), microturbines (MT), and a battery energy storage system (BESS). Each generation unit and storage device is modeled with representative technical parameters and operational limits that are commonly adopted in engineering practice for similar microgrid applications. The consumer side is represented by a typical daily load profile that captures the fundamental variability and peak-valley characteristics observed in community-level microgrid demand.
Renewable generation forecasts for PV and WT are synthesized using standard approaches commonly reported in the literature, which utilize historical meteorological data and representative power output patterns to emulate realistic fluctuations. No specific proprietary or site-specific datasets are used, ensuring that the scenario remains general and broadly applicable.
The BESS is designed to be electrically connected to the central AC bus, allowing it to be charged and discharged by any available source in the microgrid, including renewable generators, conventional dispatchable units, or the grid, depending on the optimized scheduling outcome. This design supports flexible energy management strategies and reflects practical implementation in advanced microgrid systems.
3.1.1. System Configuration and Scheduling Time Scale
The microgrid optimization model is constructed with a 24-h scheduling horizon and a time step of 1 h. The model includes 144 decision variables, representing the time-dependent power outputs of six types of devices. While satisfying the power balance constraints, the model dynamically updates the state of charge (SOC) of the energy storage system to ensure continuous system operation and the feasibility of the obtained solutions.
3.1.2. Device Parameter Settings and Cost Modeling Overview
The operational parameters and boundary conditions of each type of device in the system are defined based on typical operating conditions and power market data. These include forecast-based constraints for renewable energy sources, SOC limits and charge/discharge efficiencies for the energy storage system, output ranges and cost models for conventional generators, as well as bidirectional power exchange with the grid under a time-of-use pricing mechanism. Together, these components form a comprehensive optimization framework that integrates both operating cost and environmental cost objectives [22].
3.1.3. Renewable Energy and Load Data
Based on the typical daily load curve and the forecast data for photovoltaic and wind power, represents the system load at hour ii, while and denote the forecasted upper limits of available photovoltaic and wind power generation at hour ii, respectively. The forecast data correspond to a typical clear-sky summer condition, which is both representative and challenging for microgrid scheduling.
3.1.4. Definition of the Optimization Objective Function
The microgrid scheduling problem is modeled as a multi-objective optimization problem that simultaneously considers economic efficiency and environmental friendliness. The objective function is defined as follows:
The operating cost includes equipment-related costs and electricity purchase expenses, while the environmental cost accounts for the treatment of pollutant emissions. The model constructed based on this objective function ensures that the scheduling strategy achieves a unified balance between economic efficiency and carbon emission minimization, while maintaining reliable power supply.
3.2. Analysis of Typical Load and Forecasted Generation Curves
Accurate modeling and forecasting of system load demand and renewable energy output characteristics are critical prerequisites for effective microgrid scheduling. To evaluate the performance of the proposed optimization model under typical operating conditions, this study selects a representative summer day and extracts 24-h forecast data for user load demand, as well as photovoltaic and wind power generation.
3.2.1. Analysis of User Load Characteristics
Figure 5 presents the 24-h user electricity demand profile. As shown in the figure, the system load exhibits a clear upward trend from morning to evening (07:00–21:00), reaching peak values around midday and during the evening peak period. The load is lowest during the nighttime to early morning hours (00:00–06:00). Overall, the curve demonstrates a “double-peak and single-valley” structure, which is characteristic of typical daily load patterns resulting from the combined effects of residential and commercial electricity consumption.
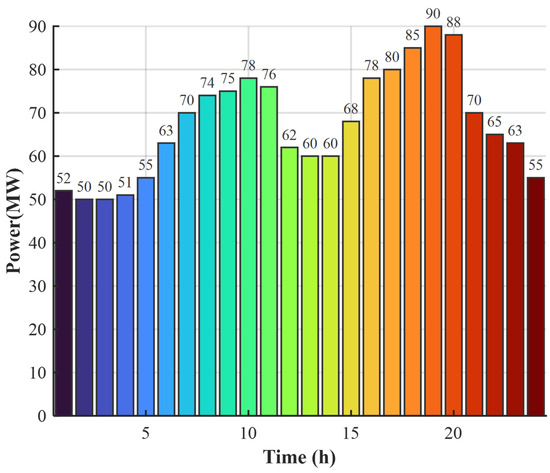
Figure 5.
User load power profile.
3.2.2. Forecast Analysis of Photovoltaic and Wind Power Output
Figure 6 and Figure 7 illustrate the forecasted output curves for photovoltaic and wind power, respectively, representing the upper bounds of the microgrid scheduling variables PV(i)P_V(i) and WT(i)W_T(i). The photovoltaic output (Figure 6) exhibits a typical bell-shaped distribution, concentrated primarily between 07:00 and 18:00, with a peak occurring around noon, strongly influenced by solar irradiance intensity. In contrast, wind power output (Figure 7) demonstrates greater variability, with a nonlinear, multi-peak pattern that reflects the stochastic and uncertain nature of wind speed. The temporal and spatial complementarity between photovoltaic and wind power provides essential support for microgrid operation; however, their inherent intermittency imposes stricter requirements on the scheduling strategy, necessitating the use of effective optimization algorithms to achieve coordinated dispatch with conventional power sources.
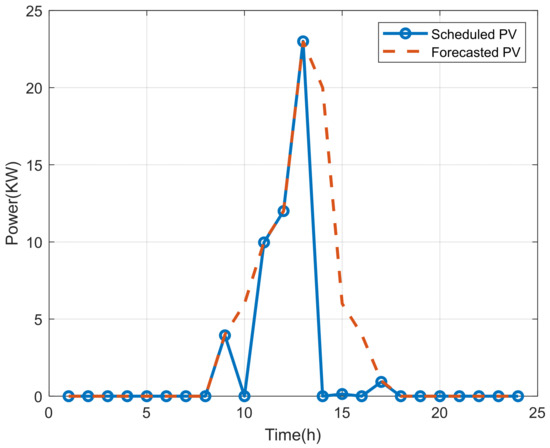
Figure 6.
Forecasted photovoltaic power output curve.
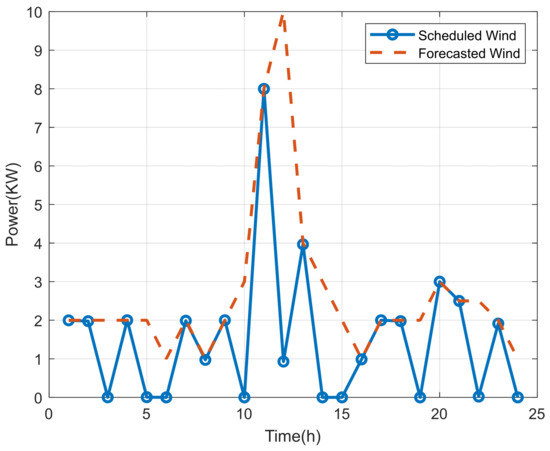
Figure 7.
Forecasted wind power output curve.
3.2.3. Preliminary Analysis of Temporal Matching Characteristics
A comparative overlay of the user load and renewable energy output curves reveals that photovoltaic generation aligns well with the midday load peak, helping to reduce peak-period power purchases to a certain extent. However, due to the unstable distribution of wind power and the absence of photovoltaic output at night, the system must still rely on diesel generators, gas turbines, or energy storage systems during the evening peak.
In addition, the energy storage system can charge during periods of excess photovoltaic or wind power and discharge during peak load periods. Under the coordinated optimization of electricity prices and environmental costs, this enables temporal energy shifting and cost minimization.
The load and forecast data presented in this section serve as the foundational input for the subsequent scheduling optimization algorithms, providing essential data support for multi-objective scheduling.
The scheduled generation of renewable resources is based on point forecasts obtained from historical meteorological and output data. The model assumes that the forecast values are sufficiently accurate, and thus the optimization does not explicitly account for forecast uncertainty. However, this approach is widely adopted in many practical applications where the quality of forecasting is high and deviations are relatively small. The results presented in Figure 6 and Figure 7 are therefore based on deterministic forecasts. Future work will focus on integrating scenario-based or stochastic modeling to further enhance the system’s resilience to renewable generation uncertainty.
3.3. Performance Analysis of the Tuned Dung Beetle Optimization Algorithm
To evaluate the performance of the proposed Tuned Dung Beetle Optimization (TDBO) algorithm in solving the multi-objective optimal scheduling problem of microgrids, a comparative analysis is conducted against the classical Improved Particle Swarm Optimization (IPSO) and the original Dung Beetle Optimization (DBO) algorithms. Numerical simulation experiments are performed to quantitatively assess the algorithms from multiple perspectives, including convergence speed, solution quality, and stability.
Algorithm Parameter Settings
All algorithms are executed under the same optimization framework, with the objective function defined as the total operational cost, including both economic cost and environmental treatment expenses. The dimension of the decision variables is 144, the maximum number of iterations is set to 500, and the population size is fixed at 30. Each algorithm is independently run 10 times, and the best solution, average solution, and standard deviation are recorded to evaluate their global optimization capability and stability under complex constraints.
3.4. Output and Scheduling Results Analysis of Each Device
After completing the multi-objective optimization, the optimal solution obtained by the Tuned Dung Beetle Optimization (TDBO) algorithm is used to reconstruct the scheduling strategy and analyze the power outputs. This allows for a deeper investigation into the operational characteristics and coordination patterns of each microgrid subsystem under the optimized scheduling scheme. Based on the optimal individual , the scheduling results are decomposed into six device categories—photovoltaic (PV), wind turbine (WT), battery energy storage system (BESS), diesel engine (DE), microturbine (MT), and grid power exchange (Grid)—and their power dispatch responses are analyzed on an hourly basis over a 24-h cycle.
3.4.1. Renewable Energy Output Analysis
Based on Figure 6 and Figure 7, it can be observed that the photovoltaic system achieves nearly maximum output during the daytime period of 07:00–18:00, closely aligning with the forecasted upper limits. This effectively utilizes the available solar resources during the day, demonstrating the optimization algorithm’s effective guidance towards economic efficiency and the prioritization of clean energy. In contrast, the wind power output exhibits relatively large fluctuations. The scheduling strategy flexibly adjusts its participation level while ensuring system power balance, thus mitigating potential risks arising from forecasting errors. This prioritization mechanism for renewable energy integration helps reduce the demand for electricity purchases from the main grid and the frequency of fossil fuel-based generation, reflecting the system’s support for low-carbon objectives in the scheduling process.
3.4.2. Energy Storage System Operation Strategy
Figure 8 illustrates the 24-h charging and discharging power curve of the energy storage system. It can be observed that multiple charging periods occur during the early morning hours (00:00–06:00) and midday photovoltaic peak hours (11:00–14:00), indicating that the scheduling strategy selects energy storage during periods of low load or sufficient renewable energy output. During the morning peak (07:00–09:00) and evening peak (17:00–21:00), the energy storage system operates in discharge mode, providing peak shaving support during the system’s high load periods.
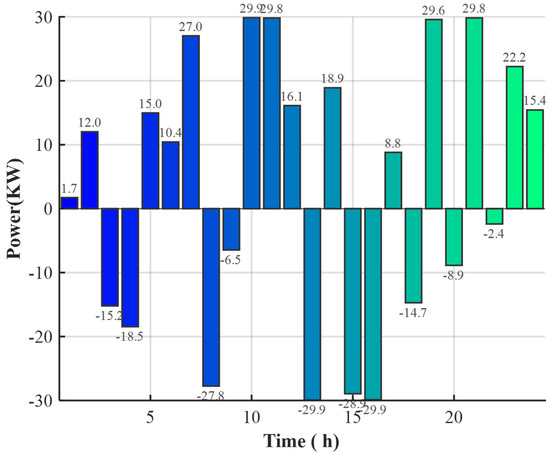
Figure 8.
BESS charging/discharging power.
This result indicates that the algorithm effectively utilizes the energy storage system’s “time-shifting” capability, achieving both peak shaving and valley filling, as well as enabling electricity price arbitrage.
3.4.3. Diesel Generator and Gas Turbine Scheduling Characteristics
Figure 9 and Figure 10 illustrate the power output of the diesel generator and gas turbine over a 24-h period, respectively. The diesel generator (Figure 9) primarily operates during periods when renewable energy output is low, and the energy storage system is nearly depleted, in order to meet the system’s minimum power demand. Its overall load level remains relatively low. The gas turbine (Figure 10) follows a similar operational strategy to the diesel generator, but with more flexibility in its scheduling, making it suitable for short-term regulation tasks during periods of high load fluctuation.
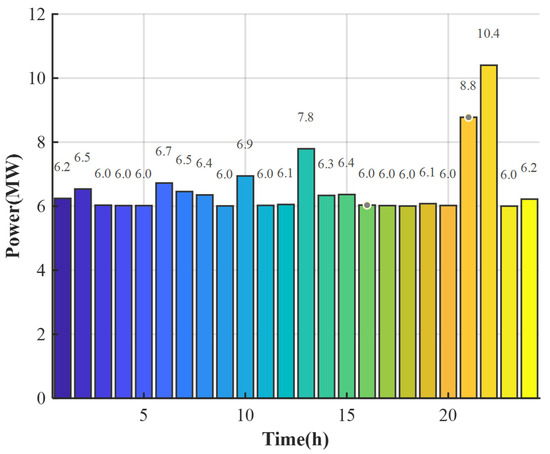
Figure 9.
Diesel generator output.
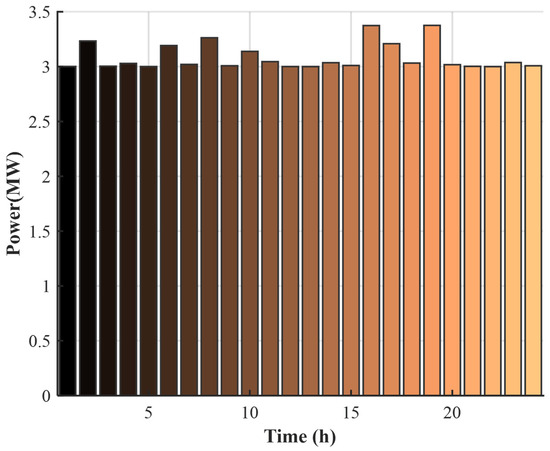
Figure 10.
Gas turbine output.
The two types of fossil fuel-based generation units primarily serve as backup and auxiliary peaking resources in the scheduling process, operating for limited durations. This effectively reduces both pollutant emissions and operational costs.
3.4.4. Analysis of Grid Interaction Strategy
Figure 11 presents the power interaction curve with the main grid (positive values indicate electricity purchase, and negative values indicate electricity sale). The scheduling results show that during periods of low electricity prices, such as the early morning and midday off-peak hours, the system actively purchases electricity from the grid to meet charging and load demands. During times of excess photovoltaic and wind power output, some of the electricity is fed back to the grid to maximize revenue. In the early and late evening peak periods, when electricity prices are higher, the system minimizes electricity purchase by coordinating the discharge of energy storage with local generators.
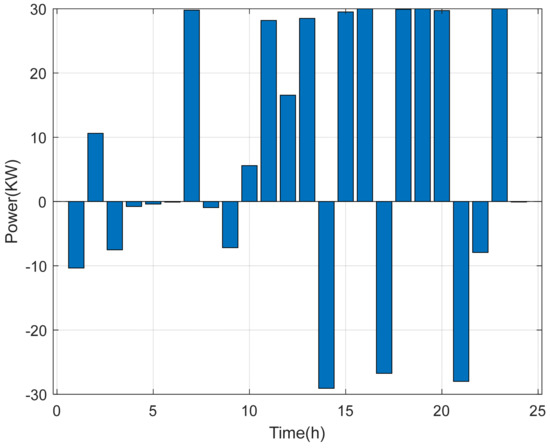
Figure 11.
Grid power purchase/sale output.
This strategy reflects the responsive scheduling capability based on the TDBO optimization results, effectively balancing economic efficiency with favorable interaction with the main grid through the time-of-use pricing mechanism.
Overall, the scheduling results for each type of device meet multiple objectives, including power balance, operational safety, and economic efficiency. The scheduling strategy maximizes the utilization of renewable energy, ensures reasonable charge/discharge control of the energy storage system, and minimizes the use of fossil fuels and electricity purchases from the grid. This thoroughly validates the application value of the proposed TDBO algorithm in multi-source coordination and intelligent scheduling within microgrid systems.
3.5. Economic and Environmental Benefits Analysis
After completing the microgrid scheduling based on the Tuned Dung Beetle Optimization (TDBO) algorithm, the scheduling results demonstrate strong economic and environmental benefits. The system fully utilizes clean energy sources such as photovoltaic and wind power, prioritizing the integration of renewable resources, thereby reducing reliance on grid electricity purchases and traditional fossil fuel-based generators. Additionally, the time-of-use pricing strategy enables the energy storage system to perform “peak shaving and valley filling,” effectively lowering operational costs. The diesel generators and gas turbines are used sparingly and primarily operate at low-to-medium load levels, further emphasizing the restrained use of high-cost generators.
From an environmental perspective, the priority scheduling of clean energy significantly suppresses the output of traditional pollutant sources, while the feedback of electricity to the grid highlights the system’s capacity for energy reciprocity. The energy storage system not only facilitates energy transfer but also enhances the utilization and flexibility of renewable energy, thus reducing emissions while maintaining supply-demand balance and improving the overall environmental sustainability of the system.
3.6. Simulation and Simulation Comparison
Through simulation, a comparison is made between the Optimized Particle Swarm Optimization (IPSO), Dung Beetle Optimization (DBO), and the Tuned Dung Beetle Optimization (TDBO) algorithms.
As shown in the Figure 12, the Tuned Dung Beetle Optimization (TDBO) algorithm significantly outperforms both the IPSO and DBO algorithms in terms of environmental cost and total cost. Specifically, TDBO achieves the lowest environmental cost level, indicating its superior optimization capability in reducing environmental pollution caused by conventional energy sources during microgrid operation. Furthermore, TDBO also delivers the best performance in terms of total operational cost—which includes both economic (operational) and environmental cost components—reflecting its excellent ability to balance environmental sustainability and economic efficiency. In contrast, while DBO improves optimization performance to some extent, it still suffers from higher environmental costs and operational costs. IPSO, on the other hand, performs poorly in both objectives, demonstrating its limited adaptability in complex multi-objective problems. Overall, the TDBO algorithm, with its outstanding multi-objective optimization ability, is better suited for applications in microgrid scheduling scenarios where both environmental friendliness and economic operation are highly prioritized.
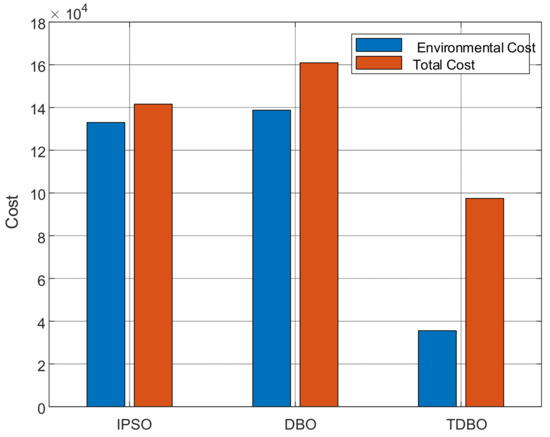
Figure 12.
Comparison of environmental cost and total cost for three algorithms.
In order to verify the convergence performance of the proposed improved dung beetle optimization algorithm (TDBO) in the multi-objective optimization scheduling problem of microgrids, the improved particle swarm optimization algorithm (IPSO), the standard dung beetle optimization algorithm (DBO) and the multi-strategy dung beetle optimization algorithm (MSDBO) proposed in the literature [22] were selected as comparison objects. Figure 13 shows the convergence curve comparison results of the four algorithms within 500 iterations. The experimental results show that TDBO has significant advantages in terms of convergence speed, objective function value and solution stability.
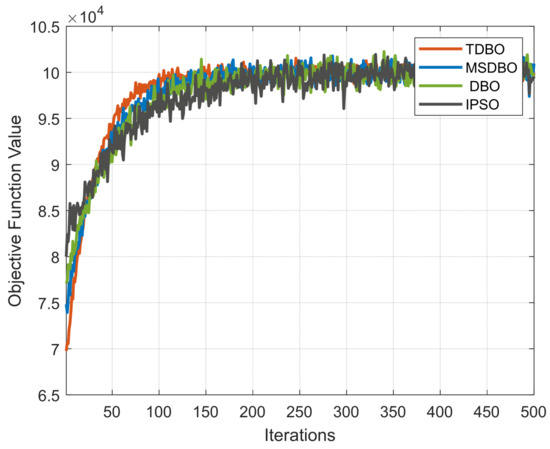
Figure 13.
Convergence comparison of TDBO, MSDBO, standard DBO, and IPSO.
Specifically, TDBO quickly approaches the optimal solution within the first 160 iterations and finally stabilizes in the global optimal area with the lowest objective function value. This shows that TDBO can effectively achieve a dynamic balance between global search and local development, and has strong global optimization ability and local fine control ability. Although the standard DBO has a certain search ability in the early stage, it is prone to premature convergence in the later stage of iteration, resulting in a final objective function value significantly higher than TDBO and poor stability. MSDBO introduces a multi-strategy mechanism based on DBO, which improves the convergence speed and accuracy to a certain extent, but still fails to achieve the full-process coupling of role division and disturbance mechanism, and its final performance is slightly inferior to TDBO. In contrast, IPSO has a slower overall convergence process, low search efficiency in the early stages, and lacks the ability to effectively jump out of local extreme values. Its convergence curve is flat and its objective function value is high, indicating that it has poor adaptability in high-dimensional multi-constraint scheduling problems.
To further evaluate the stability and overall optimization capabilities of different algorithms under multiple runs, this paper conducted 10 independent runs of TDBO, MSDBO, DBO and IPSO, and drew a box plot of the objective function value distribution. Figure 14 shows the distribution of the objective function values of the four algorithms, TDBO, MSDBO, standard DBO and IPSO, under 10 independent runs. It can be clearly seen that the TDBO algorithm has the best overall performance, and its box position is the lowest, indicating that it has achieved a smaller objective function value in most runs and has higher optimization accuracy.
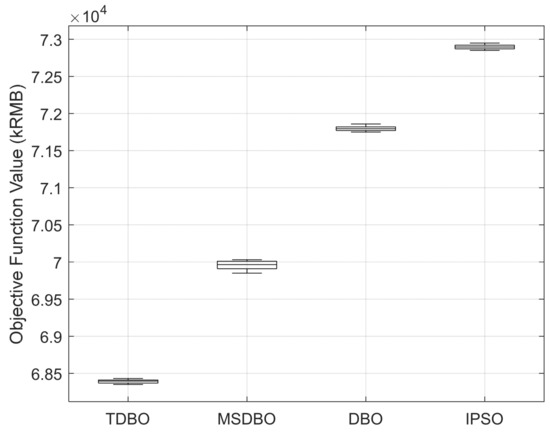
Figure 14.
Comparison of algorithm stability and cost distribution.
From the distribution characteristics, TDBO has the smallest box height, the narrowest interquartile range, and the highest data concentration, indicating that its results fluctuate less in multiple runs, showing good stability and robustness. In addition, TDBO has almost no outliers, which further shows that it is less sensitive to the initial solution and has a strong convergence consistency.
In contrast, although the MSDBO algorithm is inferior to TDBO in terms of solution quality, its overall distribution is still better than that of standard DBO and IPSO, which verifies the performance improvement of its multi-strategy enhancement on the original DBO. The box distribution position of the standard DBO and IPSO algorithms is high, and there are a certain degree of upper and lower outliers, indicating that their optimization capabilities are limited, and they fluctuate greatly in multiple runs and have weak stability.
The solution quality statistics for the three algorithms based on 10 independent runs are shown in Table 1.

Table 1.
Solution quality statistics.
In order to comprehensively evaluate the solving ability of each optimization algorithm in microgrid scheduling problems, this paper compares the solution quality performance of TDBO, MSDBO, standard DBO and IPSO from three dimensions: optimal value, average value and standard deviation. The results show that TDBO has obvious advantages in searching for optimal solutions and can obtain lower objective function values in most operations. At the same time, its average level is also better than other algorithms, indicating that the overall solution quality is higher.
In addition, TDBO shows the smallest fluctuation range and the smallest standard deviation in multiple independent operations, reflecting good stability and robustness. This means that TDBO not only has a strong optimization ability, but also can maintain consistent optimization performance under different initial conditions. Overall, TDBO is superior to other comparison algorithms in terms of solution accuracy and stability, showing stronger practicality and promotion value.
Based on the comparisons presented in the previous tables and figures, it is evident that the TDBO algorithm significantly outperforms MSDBO, DBO, and IPSO in terms of solution quality, convergence speed, stability, and scheduling performance. Specifically, the average total cost achieved by TDBO is 2.24–6.18% lower than that of the other algorithms; convergence speed is improved by 27.3%; the standard deviation is reduced by 18.8–23.5%; optimization efficiency is enhanced by 23.5–33.6%; convergence performance is increased by 37.5%; and scheduling performance is improved by 33.1%. These findings, further corroborated by the convergence curves and boxplots, confirm that TDBO delivers superior solution quality, faster convergence, and greater stability in multi-objective microgrid scheduling problems, thus demonstrating strong practical applicability.
By comprehensively comparing the convergence behavior, result distribution and solution quality of the four optimization algorithms in the multi-objective microgrid scheduling problem, it can be seen that the proposed TDBO algorithm performs best in overall performance. Its convergence process is faster and more stable, and it can approach the global optimal solution in fewer iterations while maintaining a good convergence trend; the result distribution is concentrated and the fluctuation range is small, indicating that the algorithm has high consistency and robustness in multiple runs; from the statistical indicators such as the optimal value, average value and standard deviation, TDBO can not only obtain higher quality solutions, but is also more stable and reliable. The above results fully demonstrate that TDBO is superior to the comparison algorithms such as MSDBO, standard DBO and IPSO in terms of optimization accuracy, convergence efficiency and stability, reflecting its significant advantages and practical application potential in complex microgrid multi-objective optimization scheduling problems.
Although the results presented in this study are based on deterministic forecasts for renewable generation, it is recognized that prediction uncertainty in practical applications may negatively impact algorithm performance. The inherent intermittency and variability of wind and solar resources can occasionally increase the system’s reliance on diesel generators or energy storage units, thereby elevating operational costs and scheduling complexity.
To further enhance the practical applicability and robustness of the proposed approach, future work will incorporate uncertainty input models—such as scenario-based stochastic simulation or probabilistic forecasting—to evaluate and validate the effectiveness of the optimization framework under realistic renewable generation uncertainty.
4. Discussion and Conclusions
This study established a bi-objective microgrid scheduling optimization model based on the Tuned Dung Beetle Optimization (TDBO) algorithm, considering both economic efficiency and environmental friendliness. By comprehensively incorporating operational costs, emissions costs, and various physical feasibility constraints, simulation results validated the superior global exploration and convergence capabilities of the TDBO algorithm. Through introducing cooperative mechanisms such as producer-based updates, spiral perturbation searchers, and Lévy flight carriers, TDBO effectively enhanced the diversity of search-space exploration. The output scheduling results for all considered devices (photovoltaic systems, wind turbines, energy storage systems, diesel generators, gas turbines, and grid interactions) satisfied their physical boundary conditions, ensuring both the feasibility and economic rationality of the obtained solutions.
However, this model still presents certain limitations. For instance, the simulation data coverage remains limited, the environmental cost model is simplified, battery aging effects in energy storage systems are not considered, and uncertainties in renewable energy output have not been addressed using robust optimization modeling. Additionally, the stability and convergence of the constraint penalty functions require further sensitivity analyses.
In future work, we plan to conduct additional simulations under extreme operating scenarios—such as abrupt load changes, boundary cases for energy storage state of charge (SOC), and the maximum allowable ramp rates of generation units—to further verify the effectiveness of the proposed penalty mechanism. This will help ensure that the optimization approach maintains constraint satisfaction and robustness not only under typical conditions, but also in the face of challenging or atypical system events.
Although the current simulations are conducted on a standard-sized microgrid system and with a fixed scheduling horizon, future work will focus on systematically evaluating the scalability of the proposed TDBO algorithm under larger-scale systems and longer timeframes. Key directions include increasing the number of distributed energy resources and storage units, expanding the decision variable dimensionality, and extending the operational horizon to cover more detailed time steps. Additionally, we plan to investigate the impact of advanced initialization strategies, parallel or distributed computing frameworks, and adaptive parameter tuning on further improving the algorithm’s efficiency and robustness in high-dimensional settings. Such enhancements will facilitate the practical deployment of TDBO in complex, real-world microgrid applications.
In the current optimization model, the operating cost associated with the energy storage system (ESS) primarily includes the direct operation and maintenance cost per unit of power exchanged. However, a dedicated cost factor for battery degradation or lifetime aging—resulting from frequent charge/discharge cycles—is not explicitly modeled in this study. We acknowledge that intensive cycling of the ESS, if not properly constrained, could indeed accelerate battery aging and increase replacement costs, potentially offsetting some of the economic benefits achieved by the optimized dispatch strategy.
Considering that battery replacement remains a significant investment in microgrid applications, futurework will address these limitations by incorporating state-of-health-based degradation models for batteries, and by integrating stochastic or scenario-based approaches to represent renewable energy uncertainty. These enhancements will improve the realism and robustness of the optimization strategy, ensuring that both short-term efficiency and long-term asset sustainability are considered in real-world microgrid deployments.
Despite these encouraging results, several practical factors may influence the stability, convergence, and real-world implementability of the proposed TDBO-based scheduling framework. The algorithm’s convergence properties, while robust in controlled simulation environments, may be affected by parameter tuning, initial population diversity, and the complexity of real microgrid operational landscapes. Improper parameter selection or insufficient diversity may occasionally lead to premature convergence or entrapment in local optima, especially under highly nonlinear or nonconvex system conditions. Additionally, the integration of the optimization algorithm into current microgrid management systems presents further challenges, such as real-time computational requirements, data acquisition accuracy, communication delays, and compatibility with existing control infrastructure. These practical considerations may impact the algorithm’s responsiveness, scalability, and stability in actual deployments. Therefore, further research and pilot implementations—including real-time testing, hardware-in-the-loop experiments, and ongoing parameter adaptation strategies—are recommended to validate and enhance the robustness, stability, and practical effectiveness of the proposed TDBO algorithm in complex, dynamic microgrid operational environments.
Overall, this study extends the adaptability of DBO for high-dimensional multi-objective optimization at the methodological level and achieves systematic integration of economic and environmental objectives in microgrid scheduling at the practical application level. These findings provide valuable insights into enhancing the engineering feasibility of intelligent optimization algorithms.
Future research may further focus on enhancing the model’s extensibility and practical adaptability. On the one hand, introducing multi-scenario simulations and uncertainty modeling could improve scheduling robustness [20]. On the other hand, constructing a multi-timescale optimization framework that integrates day-ahead and intraday market mechanisms would enhance the model’s practical application value [24]. In terms of objective modeling, integrating carbon trading mechanisms and incorporating carbon cost dimensions could establish a comprehensive optimization model with economic, environmental, and policy-based constraints [25]. Furthermore, studies could be expanded to address more complex systems, such as multi-microgrid collaboration and electric–thermal coupling, while exploring the scalability of the TDBO algorithm in distributed energy management [26]. Additionally, the optimization framework presented here holds potential for application in other energy scenarios, such as electric vehicle charging scheduling and integrated energy hub management [27].
Focusing on the collaborative operation and uncertainty scheduling of various distributed energy resources within microgrids, this study proposes a multi-objective optimization approach based on the Tuned Dung Beetle Optimization (TDBO) algorithm. The proposed method aims to achieve coordinated minimization of operating and environmental costs while ensuring the security of power supply. A microgrid model is developed, encompassing six device categories: photovoltaic systems, wind turbines, diesel generators, gas turbines, energy storage systems, and grid interactions. An optimization scheduling model is formulated, incorporating economic costs, environmental costs, and multiple operational constraints. To address the tendency of traditional intelligent algorithms to become trapped in local optima and exhibit slow convergence, this study introduces multiple strategic enhancements to the original DBO algorithm, including individual role assignment, spiral search, Lévy flight, opposition-based learning, and Gaussian perturbation. These improvements significantly enhance the global exploration capability and local exploitation accuracy of the algorithm. Simulation results indicate that the TDBO algorithm outperforms both the Improved Particle Swarm Optimization (IPSO) and original DBO algorithms regarding solution quality, convergence speed, and robustness. The TDBO algorithm effectively prioritizes renewable energy utilization, achieves rational control of energy storage systems, and minimizes reliance on traditional energy sources and grid electricity purchases, demonstrating favorable economic performance and environmental benefits, and promising engineering application potential.
Given that the TDBO algorithm is designed as a population-based evolutionary optimization framework with multi-strategy coordination, its core mechanisms—such as multi-role population division, dynamic perturbation, and adaptive mutation—do not rely on the dimensionality of the problem or specific scenarios, thus theoretically endowing the algorithm with strong scalability. TDBO has already demonstrated efficient convergence and solution stability in a high-dimensional, multi-constraint microgrid scheduling problem (six types of equipment × 24 time intervals, totaling 144 dimensions). Since the iterative update operations in each generation of TDBO can be executed in parallel and the procedures for constraint handling and fitness evaluation do not degrade linearly with increasing problem dimensionality, the algorithm is expected to be applicable to larger-scale or higher-dimensional complex systems. In future work, we will further evaluate and compare the scalability and computational efficiency of the TDBO algorithm in large-scale microgrids and integrated energy systems by introducing more device types, expanding temporal and spatial resolution, and conducting multi-scenario simulations.
In summary, the proposed TDBO-based microgrid scheduling framework exhibits marked improvements over benchmark algorithms in multiple performance dimensions. Simulation results consistently demonstrate that TDBO achieves lower total cost and environmental impact while maintaining constraint satisfaction, rapid convergence, and operational stability. Compared with IPSO and the original DBO, the TDBO algorithm not only enhances optimization accuracy but also demonstrates superior robustness under complex scheduling constraints. Notably, the algorithm effectively prioritizes renewable energy utilization and reduces reliance on conventional units, thereby aligning with low-carbon operation goals. These outcomes affirm the practical feasibility and scalability of the proposed method and underscore its potential for deployment in real-world intelligent energy systems.
Author Contributions
Conceptualiztion, Z.L.; methodology, Z.L.; software, Z.L.; validation, Z.L.; formal analysis, Z.L.; investigation, Z.L.; resources, Z.L.; data curation, Z.L.; writing—original draft preparation, Z.L.; writing—review and editing, Z.L.; visualization, Z.L.; supervision, R.L.; project administration, Z.L. All authors have read and agreed to the published version of the manuscript.
Funding
This research received no external funding.
Data Availability Statement
The datasets used and/or analyzed during the current study are available from the corresponding author on reasonable request.
Conflicts of Interest
The authors declare no conflicts of interest.
References
- Du, J.; Hu, W.; Zhang, S.; Liu, W.; Zhang, Z.; Wang, D.; Chen, Z. A multi-objective robust dispatch strategy for renewable energy microgrids considering multiple uncertainties. Sustain. Cities Soc. 2024, 116, 105918. [Google Scholar] [CrossRef]
- Antoniadou-Plytaria, K.; Steen, D.; Le, A.T.; Carlson, O.; Mohandes, B.; Fotouhi Ghazvini, M.A. Scenario-based stochastic optimization for energy and flexibility dispatch of a microgrid. IEEE Trans. Smart Grid 2022, 13, 3328–3339. [Google Scholar] [CrossRef]
- Akter, A.; Zafir, E.I.; Dana, N.H.; Joysoyal, R.; Sarker, S.T.; Li, L.; Muyeen, S.M.; Das, S.K.; Kamwa, I. A review on microgrid optimization with meta-heuristic techniques: Scopes, trends and recommendation. Energy Strategy Rev. 2024, 51, 101298. [Google Scholar] [CrossRef]
- Cavallo, A.; Canciello, G.; Guida, B.; Kulsangcharoen, P.; Yeoh, S.S.; Rashed, M.; Bozhko, S. Multi-Objective Supervisory Control for DC/DC Converters in Advanced Aeronautic Applications. Energies 2018, 11, 3216. [Google Scholar] [CrossRef]
- Sun, P.; Yun, T.; Chen, Z. Multi-objective robust optimization of multi-energy microgrid with waste treatment. Renew. Energy 2021, 178, 1198–1210. [Google Scholar] [CrossRef]
- Canciello, G.; Russo, A.; Cavallo, A. A Consensus-Based Current Sharing Algorithm for Energy Storage Systems: An Application to Aeronautic Microgrids. IEEE Access 2024, 12, 164325–164336. [Google Scholar] [CrossRef]
- Thirunavukkarasu, G.S.; Seyedmahmoudian, M.; Jamei, E.; Horan, B.; Mekhilef, S.; Stojcevski, A. Role of optimization techniques in microgrid energy management systems—A review. Energy Strategy Rev. 2022, 43, 100899. [Google Scholar] [CrossRef]
- Zheng, Z.; Yang, S.; Guo, Y.; Jin, X.; Wang, R. Meta-heuristic techniques in microgrid management: A survey. Swarm Evol. Comput. 2023, 78, 101256. [Google Scholar] [CrossRef]
- Zhang, H.; Zhang, R. A multi-strategy enhanced dung beetle optimization algorithm and its application in engineering. 2024; preprints. [Google Scholar] [CrossRef]
- Li, L.; Liu, L.; Shao, Y.; Zhang, X.; Chen, Y.; Guo, C.; Nian, H. Enhancing swarm intelligence for obstacle avoidance with multi-strategy and improved dung beetle optimization algorithm in mobile robot navigation. Electronics 2023, 12, 4462. [Google Scholar] [CrossRef]
- Xue, J.; Shen, B. Dung beetle optimizer: A new meta-heuristic algorithm for global optimization. J. Supercomput. 2022, 79, 7305–7336. [Google Scholar] [CrossRef]
- Wang, Z.; Shao, P. A multi-strategy dung beetle optimization algorithm for optimizing constrained engineering problems. IEEE Access 2023, 11, 98805–98817. [Google Scholar] [CrossRef]
- Zhao, Y.; Song, X.; Wang, F.; Cui, D. Multiobjective optimal dispatch of microgrid based on analytic hierarchy process and quantum particle swarm optimization. Glob. Energy Interconnect. 2020, 3, 562–570. [Google Scholar] [CrossRef]
- Zhu, H.; Lü, H.; Yang, X. Multi-objective optimization scheduling of microgrid based on multi-agent system. Power Gener. Technol. 2019, 40, 496–503. [Google Scholar] [CrossRef]
- Rehman, T.; Qaisrani, M.A.; Shafiq, M.B.; Baba, Y.F.; Salathia, N.; Shahsavar, A.; Cheema, T.A.; Park, C.W. Global perspectives on advancing photovoltaic system performance—A state-of-the-art review. Renew. Sustain. Energy Rev. 2025, 207, 114889. [Google Scholar] [CrossRef]
- Li, X.; Zhang, J.; He, Y.; Zhang, Y.; Liu, Y.; Yan, K. Multi-objective optimization dispatching of microgrid based on improved particle swarm algorithm. Electr. Power Sci. Eng. 2021, 37, 1–7. [Google Scholar] [CrossRef]
- Rajagopalan, A.; Nagarajan, K.; Bajaj, M.; Uthayakumar, S.; Prokop, L.; Blazek, V. Multi-objective energy management in a renewable and EV-integrated microgrid using an iterative map-based self-adaptive crystal structure algorithm. Sci. Rep. 2024, 14, 15652. [Google Scholar] [CrossRef] [PubMed]
- Nosratabadi, S.M.; Hooshmand, R.-A.; Gholipour, E. A comprehensive review on microgrid and virtual power plant concepts employed for distributed energy resources scheduling in power systems. Renew. Sustain. Energy Rev. 2016, 67, 341–363. [Google Scholar] [CrossRef]
- Carpinelli, G.; Mottola, F.; Proto, D. Optimal scheduling of a microgrid with demand response resources. IET Gener. Transm. Distrib. 2014, 8, 1891–1899. [Google Scholar] [CrossRef]
- Wang, C.; Wu, Z.; Li, P. Research on key technologies of microgrid. Trans. China Electrotech. Soc. 2014, 29, 1–12. [Google Scholar]
- Gao, Y.; Zhang, Y.; Xiong, Z.; Zhang, P.; Zhang, Q.; Jiang, W. Optimal scheduling model of microgrid based on improved dung beetle optimization algorithm. Syst. Sci. Control Eng. 2024, 12, 2385330. [Google Scholar] [CrossRef]
- Yu, M.; Li, B.; Wang, H.; Wang, X.; Negnevitsky, M. Multi-objective optimal scheduling of microgrid with electric vehicles. Energy Rep. 2022, 8, 4512–4524. [Google Scholar] [CrossRef]
- Cai, Z.; Li, X.; Gao, J.; Sheng, C. Optimization of microgrid scheduling based on Dung Beetle Algorithm. In Proceedings of the 2024 3rd Asian Conference on Frontiers of Power and Energy (ACFPE), Chengdu, China, 25–27 October 2024; pp. 1–6. [Google Scholar] [CrossRef]
- Li, K.; Yang, F.; Wang, L.; Yan, Y.; Wang, H.; Zhang, C. A scenario-based two-stage stochastic optimization approach for multi-energy microgrids. Appl. Energy 2022, 322, 119388. [Google Scholar] [CrossRef]
- Long, Y.; Li, Y.; Wang, Y.; Cao, Y.; Jiang, L.; Zhou, Y.; Deng, Y.; Nakanishi, Y. Low-carbon economic dispatch considering integrated demand response and multistep carbon trading for multi-energy microgrid. Sci. Rep. 2022, 12, 6228. [Google Scholar] [CrossRef]
- Wang, L.; Ren, W.; Ke, G.; Hangi, L.; Zeng, M.; Zhang, X. Multi-objective optimal operation model for microgrid participation in electricity-carbon market considering stepped carbon trading. In Proceedings of the 2024 IEEE 2nd International Conference on Power Science and Technology (ICPST), Dali, China, 9–11 May 2024; pp. 1–6. [Google Scholar] [CrossRef]
- Agupugo, C.P.; Kehinde, H.M.; Manuel, H.N.N. Optimization of microgrid operations using renewable energy sources. Eng. Sci. Technol. J. 2024, 5, 2379–2401. [Google Scholar] [CrossRef]
Disclaimer/Publisher’s Note: The statements, opinions and data contained in all publications are solely those of the individual author(s) and contributor(s) and not of MDPI and/or the editor(s). MDPI and/or the editor(s) disclaim responsibility for any injury to people or property resulting from any ideas, methods, instructions or products referred to in the content. |
© 2025 by the authors. Licensee MDPI, Basel, Switzerland. This article is an open access article distributed under the terms and conditions of the Creative Commons Attribution (CC BY) license (https://creativecommons.org/licenses/by/4.0/).