Abstract
Smart logistics systems generate massive amounts of data, such as images and videos, requiring real-time processing in edge clusters. However, the edge cluster systems face performance bottlenecks in reception and forwarding high-concurrency data streams from numerous smart terminals, resulting in degraded processing efficiency. To address this issue, a novel high-performance data stream model called CBPS-DPDK is proposed. CBPS-DPDK integrates the DPDK framework from Intel corporations with a content-based publish/subscribe model enhanced by semantic filtering. This model adopts a three-tier optimization architecture. First, the user-space data plane is restructured using DPDK to avoid kernel context switch overhead via zero-copy and polling. Second, semantic enhancement is introduced into the publish/subscribe model to reduce the coupling between data producers and consumers through subscription matching and priority queuing. Finally, a hierarchical load balancing strategy ensures reliable data transmission under high concurrency. Experimental results show that CBPS-DPDK significantly outperforms two baselines—OSKT (kernel-based data forwarding) and DPDK-only (DPDK). Relative to the OSKT baseline, DPDK-only achieves improvements of 37.5% in latency, 11.1% in throughput, and 9.1% in VMAF; CBPS-DPDK further increases these to 51.8%, 18.3%, and 11.2%, respectively. In addition, compared with the traditional publish–subscribe system NATS, CBPS-DPDK maintains lower delay, higher throughput, and more balanced CPU and memory utilization under saturated workloads, demonstrating its effectiveness for real-time, high-concurrency edge scenarios.
1. Introduction
1.1. Overview
Smart logistics leverages emerging technologies such as the Internet of Things (IoT), Artificial Intelligence (AI), big data, and blockchain. These technologies enable digitalization, networking and intelligent management in the logistics process. Typical scenarios include dynamic path planning and automated sorting. These scenarios require AI models to perform millisecond-level inference on massive volumes of text, image and video data streams. The inference enhances the efficiency of the “transportation–warehousing–distribution” chain. Traditional cloud data centers offer abundant computational resources. However, the physical distance from logistics sites leads to high return-path latency. The latency limits real-time processing capabilities. To address this issue, the industry has gradually shifted computation toward the edge, establishing edge-intelligent computing frameworks. As shown in Figure 1, terminal data is first preprocessed by nearby edge servers before being sent to back-end nodes for deep analysis. The first row of servers in Figure 1 represents data stream reception and forwarding servers, which receive data from intelligent terminals and forward it to other servers. The second row represents data stream processing servers, which handle computation and analysis tasks. This work focuses on scheduling and forwarding, which are completed with minimal latency after data streams reach the forwarding server. To keep the focus on the receive–forward layer, transmission from terminals to the access network and its wireless variation are not modeled. Random wide-area network effects (packet loss, jitter, reordering), failure recovery, and sensitivity to MTU or jumbo frames are not considered. All experiments are conducted in a stable local area network to isolate and evaluate the contribution of this layer to end-to-end performance. This “computation offloading to the edge” strategy effectively reduces latency and alleviates backbone network load [1,2,3,4,5].
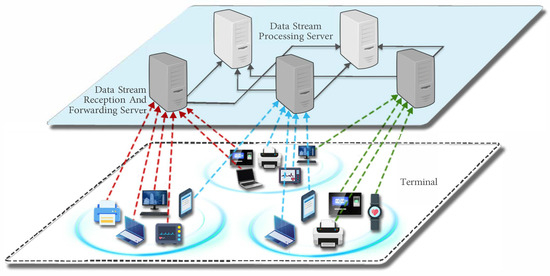
Figure 1.
Data reception and forwarding within edge clusters in smart logistics.
However, the rapid growth in terminal scale has introduced new bottlenecks. During peak periods in logistics parks, hundreds or even thousands of video streams and real-time sensor data streams flood into the edge cluster. The ingress bandwidth may exceed 10 Gb/s. The kernel protocol stack then becomes the performance bottleneck. Frequent context switching and memory copying cause this problem. Bursty traffic patterns often lead to queuing congestion and uncontrolled latency. Therefore, there is an urgent need for an edge-oriented reception and forwarding mechanism. The mechanism should support high concurrency. It should fully unleash NIC throughput in user space. It should also support content-aware filtering and dynamic load balancing. Such a mechanism can provide stable and efficient data forwarding. It can also support subsequent AI inference tasks [6,7,8].
1.2. Key Challenges
Edge computing offers computation capabilities closer to the data source. It supports real-time processing of large-scale data streams in smart logistics applications. This approach significantly reduces transmission latency. However, it still faces three key challenges in practical deployment.
- High system latency caused by large-scale concurrent data streams access and forwarding. Edge nodes in smart logistics parks must concurrently receive and forward massive volumes of video, image, and sensor data streams. Traditional kernel-based packet reception mechanisms involve substantial overhead from context switching and memory copying. This overhead results in severe throughput degradation. It also increases transmission latency during data access and forwarding.
- Poor scalability due to tight coupling between data streams reception and forwarding in edge computing clusters. In current edge clusters, specific nodes typically handle both data streams reception and forwarding. These two functions have a tightly coupled relationship. This design severely limits the scalability of data streams management in edge environments.
- Mismatch between static data forwarding strategies and dynamic application-layer demands. Existing edge-side forwarding paths often use static matching of destination addresses or port numbers. They lack semantic-level recognition and filtering based on application-layer business logic. As a result, different service flows cannot be flexibly categorized and handled on demand. In scenarios with concurrent multi-service traffic and dynamic load variation, this static mechanism often leads to ineffective forwarding. It causes resource waste and imbalanced load distribution among nodes. It ultimately weakens system stability and scalability.
Therefore, complex smart logistics scenarios require a new architecture. The architecture must ensure service quality and processing capability. It should integrate high-speed forwarding, semantic matching, and dynamic load balancing.
1.3. Our Contributions
To address the aforementioned challenges, this paper proposes a high-performance data streams reception and forwarding system called CBPS-DPDK, which integrates the Data Plane Development Kit (DPDK) [9] with a content-aware publish/subscribe model. The main contributions of this work are as follows:
- A novel three-layer distributed system architecture CBPS-DPDK is designed, which effectively combines the high-speed packet processing framework DPDK from Intel (Santa Clara, CA, USA) with a publish/subscribe model that governs data reception and forwarding logic. This architecture enhances data transmission efficiency in data plane of edge networks by enabling high-throughput user-space packet reception and semantic-aware message forwarding, thereby supporting the efficient forwarding of massive, heterogeneous data streams in smart logistics scenarios.
- A content-aware publish/subscribe model is introduced into CBPS-DPDK. It decouples data streams reception from forwarding. This improves system scalability and reliability. The system distributes publishing and subscribing modules across different layers. It enables asynchronous communication. In this way, the roles of data producers and consumers are separated. Producers are devices or processes that generate data streams, such as IoT terminals or video sources. Consumers are processing nodes or applications that receive and use these streams. This design increases deployment flexibility and scalability under complex network topologies, making it well-suited for smart logistics environments with continuously growing numbers of terminal nodes.
- This work proposes a semantic-aware scheduling mechanism to meet dynamic application demands. The system extracts key attributes from message content. It performs reverse-index-based matching to support interest-driven dynamic forwarding. This mechanism enables fine-grained flow classification and scheduling based on business logic. It also uses a dual-feedback strategy. The strategy combines global load evaluation with local queuing latency. It ensures high throughput and system stability under dynamic traffic conditions. It supports concurrent processing of multiple service flows.
The remainder of this paper is organized as follows: Section 2 reviews related work on transmission optimization in edge computing. Section 3 presents the proposed CBPS-DPDK method in detail. Section 4 describes the experimental setup and evaluates system performance in terms of latency, throughput, and video quality. Section 5 concludes the paper and discusses potential directions for future research.
2. Related Work
2.1. Machine Learning-Based Transmission Optimization
Reinforcement learning and multi-agent systems are widely used to improve routing, power control, and task offloading in edge networks. Li et al. [10] proposed a multi-objective reinforcement learning method. It balances latency, energy, and reliability via dynamic routing and rate control. However, its performance suffers from large state spaces in dense networks. Liu J et al. [11] introduced the Edge CPN framework with semantic-aware task encoding and multi-agent deep reinforcement learning. It improves transmission efficiency but lacks stability in dynamic and heterogeneous environments. Peng et al. [12] combined Q-learning with non-cooperative game theory to optimize power control and path selection. The method reduces latency but requires many iterations and has limited adaptability to dynamic topologies. Wang et al. [13] applied DDPG for joint scheduling of wireless and edge computing resources. It improves network slicing efficiency but relies heavily on training data and is computationally expensive for online use.
2.2. System Model-Based Optimization Methods
System model-based methods focus on optimizing transmission through analytical modeling across storage, access, and communication layers. Liu P et al. [14] proposed hierarchical storage and attribute-based scheduling for wireless monitoring data. It lowers uplink latency but scales poorly with more nodes. Liu Y et al. [15] developed a joint model for task offloading, AP selection, and resource allocation. It handles device heterogeneity but is too computationally heavy for real-time tasks. Kim et al. [16] jointly optimized MIMO signal design and subchannel allocation to enhance throughput and energy efficiency. However, its robustness under interference and multipath fading is limited. Zhang et al. [17] used spectral graph theory to estimate network throughput and jointly optimized IRS phase shifts and relay resource allocation. The approach is novel but computationally intensive.
2.3. DPDK-Based Acceleration Techniques
DPDK enables high-speed packet processing by shifting operations to user space, reducing kernel overhead. Bhattacharyya et al. [18] deployed DPDK in a 5G network to enhance throughput and reduce latency. Narappa et al. [19] designed Z-Stack, a DPDK-based zero-copy TCP/IP stack, achieving fast packet handling and better responsiveness. Anastasio et al. [20] implemented a DPDK platform for deterministic and low-latency real-time communication. Ren et al. [21] proposed PacketUsher, a DPDK-based packet I/O engine that improves processing speed in compute-intensive scenarios. Ullah et al. [22] improved IPsec performance with a DPDK-based data plane, enhancing throughput in high-speed encrypted traffic. Despite these advances, DPDK is still underexplored in edge data streams reception and forwarding. There is considerable potential for integration with edge computing systems.
2.4. Towards Collaborative Optimization of DPDK and Edge Computing
The combination of DPDK and edge computing is expected to provide high throughput, low latency, and efficient packet processing. This creates favorable conditions for scalable real-time communication in edge computing environments. Building on this integration, this work introduces a DPDK-based system enhanced with content-aware publish/subscribe model. The goal is to support efficient, high-concurrency data flow between intelligent terminals and edge computing nodes in smart logistics.
3. Method
3.1. System Overview
This method addresses the challenges of high concurrency and low latency in smart logistics edge environments. It adopts a three-layer architecture. The layers are data plane optimization, semantic processing, and dynamic scheduling. The system integrates four functional modules: traffic scheduler, publisher, message center, and subscriber. Each module is mapped to a specific layer. The modules work together to enable efficient and adaptive data stream management. Table 1 lists the basic symbols used in this work.

Table 1.
Symbol definitions used in this paper.
The data plane optimization layer is responsible for high-speed data ingestion. It incorporates the publisher module. The module includes the network packet aggregator, data controller, and message publisher. These components aggregate packets from smart terminals. They extract essential features and convert the data into structured messages. The system uses zero-copy and polling techniques based on DPDK. These techniques avoid operating system kernel switching overhead. They significantly improve packet processing efficiency.
The semantic processing layer performs message classification, filtering, and decoupling. It is supported by the message center, which comprises the message controller, message/subscriber matcher, message sender, subscriber controller, and user-mode forwarder. These messages from the publisher are buffered, semantically matched through a reverse indexing mechanism, and routed accordingly. This layer enables scalable and content-aware message distribution. It also reduces the coupling between data sources and receivers.
The dynamic scheduling layer ensures stable performance under varying workloads. It involves the traffic scheduler. It also involves parts of the message center and subscriber modules. The scheduler monitors resource usage, latency, and throughput in real time. Based on these measurements, it profiles each edge node. It then applies a load-balancing algorithm to allocate new terminal requests. The subscriber controller maintains subscription states. The subscriber module supports subscription requests and localized data handling.
This layered architecture forms an end-to-end data processing pipeline. Data streams from smart terminals are acquired, semantically processed, and adaptively scheduled for forwarding across the edge cluster based on system conditions. The coordination among different layers ensures that the system meets the performance, scalability, and flexibility requirements of smart logistics edge applications. Figure 2 illustrates the system architecture.
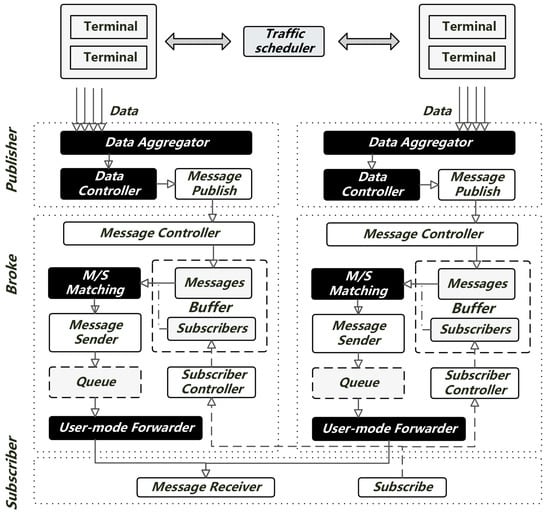
Figure 2.
Real-time data streams access and forwarding architecture.
3.2. Data Stream Publish/Subscribe Model
Smart-logistics deployments comprise numerous terminal devices that continuously emit real-time data streams. Formally, the system is represented as the quadruple , where is the set of smart terminals, the set of data streams, the set of edge nodes, and the set of compute nodes, with m denoting the number of edge nodes. Each streams produced by is written as , where denotes the extracted feature vector and the raw payload.
Data streams travel from terminal to edge node and onward to compute node , forming the path . At , each stream has its feature vector normalized to . The pair is packaged as a message and all such messages constitute the set . Edge nodes forward only those that satisfy the filtering rules of a given compute node . Hence, the system must absorb high-concurrency traffic under limited edge resources. It must also maintain reliability through effective load balancing when traffic is uneven.
To address these challenges, this work proposes the CBPS-DPDK method, which combines DPDK kernel-bypass forwarding with a content-based publish/subscribe (CBPS) mechanism. DPDK supplies zero-copy, polling-driven I/O in the data plane, while CBPS performs semantic matching and asynchronous routing. The method consists of two tightly coupled components. First, a publish/subscribe module (Algorithm 1) realizes high-throughput content matching. Second, a dual-feedback load-balancing mechanism monitors resource utilization from both global and local aspects and adapts traffic weights accordingly. We describe these components.
Publishers extract to create messages ; subscribers register matching strategies that form . Each message adopts the binary form ; the matching routine is detailed in Algorithm 1. For every , the system evaluates
and forwards to each subscriber that returns true.
| Algorithm 1 Message/subscriber matching algorithm. |
|
To keep Algorithm 1 stable under bursty workloads, a novel lightweight dual-feedback load-balancing mechanism is introduced. At the global layer, the mechanism periodically adjusts traffic weights across all edge nodes to smooth long-term load. At the local layer, each node reacts to instantaneous queuing latency and fine-tunes its weight, allowing fast suppression of emerging hot spots. The overall scheduling workflow is summarized in Algorithm 2.
| Algorithm 2 Dual-feedback load-balancing mechanism. |
|
Leveraging a multi-metric weight-adjustment strategy [23], this mechanism models each edge node as an [24] queue and tunes traffic weights via coordinated global and local feedback loops.
Let denote the aggregated input traffic and the combined processing capacity of all edge nodes, where is node ’s throughput upper bound.
For node , let the current input rate be , the instantaneous throughput be , the queue depth be , and the one-way latency be . The scheduler periodically computes
where and are system thresholds and . After exponential smoothing , a monotone mapping yields capacities and the weights
ensure and converge toward when .
For the local layer, each node batches messages and is therefore modeled as an single-server queue. Let be the basic processing time per message, the extra matching/forwarding overhead, and the batch window. The mean service time is
With arrival rate , the Pollaczek–Khinchin result for queues gives [24]
The total latency is then approximated by
Deviation is mapped to a local capacity ; updated weights
blend global and local feedback and preserve stability even under extreme concurrency.
By combining user-space high-speed forwarding, content-based message matching, and a concise dual-feedback scheduler, CBPS-DPDK ingests and routes heterogeneous high-concurrency data streams, balances multi-indicator loads, and maintains low latency in edge environments.
3.3. Evaluation Metrics
The performance of the proposed CBPS-DPDK system is evaluated from three perspectives: end-to-end latency, transmission bitrate, and video transmission quality.
End-to-end latency measures the total latency experienced by each data packet from generation to reception. It comprises three components: transmission latency , processing latency , and queuing latency , with the total latency given by
denotes transmission latency, the interval required for data to traverse the network link; is processing latency, the time taken for data to be processed within the reception-and-forwarding system; represents queuing latency, the duration data remains in the queue awaiting processing within the reception and forwarding system. This metric is measured by timestamping packets at the sender and receiver. Packet sizes are varied from 64 Bytes to 1024 Bytes to observe latency performance under different data granularities. The coefficient of variation of latency, defined as the ratio of the standard deviation to the mean, is calculated to assess stability.
Transmission bitrate reflects the ability to sustain high-throughput data forwarding. It is defined as the total number of bits transmitted over a time interval:
Let be the transmission bit rate, is the number of bits sent in duration T. This metric is averaged over a one-hour continuous transmission test to ensure statistical reliability. The coefficient of variation of bitrate is calculated to evaluate temporal consistency.
The transmission quality of data stream reception and forwarding is an important system evaluation metric. In this work, video streams are selected as the experimental object. The proposed system is used to receive and forward video stream data. The video quality is evaluated at the reception end. If the transmission quality of the data streams is high, the quality of the received video is also high. If the transmission quality is poor, issues may occur. The issues include packet loss, frame errors, or latency. These problems reduce the quality of the received video. Therefore, the video quality at the reception end can be used to evaluate the transmission quality of the data stream. In this work, the Video Multimethod Assessment Fusion (VMAF) [25] method is adopted. VMAF is a video quality evaluation metric designed by Netflix. It assesses the playback quality of videos through multiple evaluation methods, including structural similarity and perceptual quality metrics. The score range of video quality is [0, 100]. A higher score indicates better video quality. In this system, the subscriber is the video playback process. After the subscriber receives all sub-video streams of the same topic, the complete video streams is played. The VMAF method is then used to evaluate its quality. Better video stream quality indicates better data transmission quality.
4. Result and Experiments
4.1. Experimental Settings
The testbed consists of nine commodity servers linked by a non-blocking 10 Gbps switch. These servers form one producer layer, one edge-forwarding cluster, and one subscriber layer. Their physical interconnection and roles are shown in Figure 3. Four servers are used to generate high-concurrency data streams. Three servers form the edge forwarding cluster. Two servers act as subscribers. They reconstruct complete videos from forwarded sub-streams.
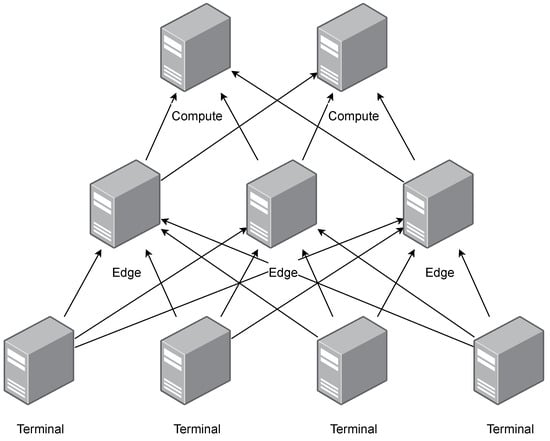
Figure 3.
Experimental testbed topology with 9 servers (4 producers, 3 edge forwarders, 2 subscribers) connected via a 10 Gbps switch.
Nine hosts equipped with 10 Gigabit network cards are configured as servers. Four servers simulate the generation of large-scale concurrent data streams. These streams consist of video segments with random sizes. Three servers form the edge forwarding cluster to forward data streams. Two servers act as subscribers to simulate the subscription process. The detailed server specifications are listed in Table 2.

Table 2.
Server configuration information.
A large raw-video dataset is segmented into variable-size small data streams. Each producer host runs multiple processes. Each process emulates an IoT terminal and randomly selects small data streams to transmit. Edge nodes receive, preprocess, and forward the streams. Subscriber hosts reconstruct complete videos from forwarded sub-streams. Videos are played using lightweight software to emulate downstream processing.
Three forwarding methods are evaluated: (i) the kernel-based data forwarding method (OSKT); (ii) the DPDK-only data forwarding method; (iii) the proposed content-based publish/subscribe model built on DPDK (CBPS-DPDK). For CBPS-DPDK, the load-balancing weights are fixed to , , , , and .
Each method is executed three times under identical hardware conditions. Each run generates millions of packets. This ensures statistically stable averages. Metrics are collected as follows. End-to-end latency is obtained by timestamping each packet at sender and receiver for lengths 64–1024 Byte. The global mean is taken. Throughput is measured over 5–60 s windows, averaged per second, and reported in Gbps. Perceptual video quality is assessed with Netflix VMAF. Frame scores are averaged into a single value.
Performance gain is calculated separately against OSKT and DPDK-only for latency, throughput, and VMAF, as shown in Formula (9).
In this work, percentage improvement is obtained using a macro-average method. For each measurement point i, the relative change between CBPS-DPDK and the baseline is first calculated. For latency (lower is better),
where and denote the end-to-end latency of the baseline method and the proposed CBPS-DPDK method, respectively, for the ith sample. The variable represents the relative latency reduction for that sample.
For throughput and VMAF (where a higher value indicates better performance), the relative gain is defined as
where and are the metric values (throughput in Gbps or VMAF score) of the baseline and the proposed method, respectively, for the ith sample.
The overall performance improvement is obtained by computing the arithmetic mean of all or values across N samples:
where equals for latency or for throughput and VMAF. This averaging method assigns equal weight to each sample and mitigates bias arising from uneven sample distributions.
4.2. Results and Discussion
This section evaluates the performance of the system in transmitting video stream data under controlled conditions. A multi-process approach is used to simulate the transmission of segmented video streams from numerous concurrent smart terminals. Each subscriber process receives multiple segments of the same video stream. These segments are reconstructed into a complete video. Three metrics are used: system latency, transmission bitrate, and transmission quality. System latency reflects the time between data generation and reception. Lower latency improves system efficiency and computational response speed. Transmission bitrate measures data throughput. It is a key indicator for high-concurrency transmission. Transmission quality is evaluated based on the quality of video streams received by subscribers. Higher playback quality indicates better data stream transfer quality. System latency includes transmission latency, processing latency, and queuing latency, as defined in Formula (7).
To test performance under different packet sizes, the packet length is increased from 64 Byte to 1024 Byte, totaling 10 GB of data. Figure 4 shows the latency results. Table 3 lists the mean latency and variance for each method and packet size.
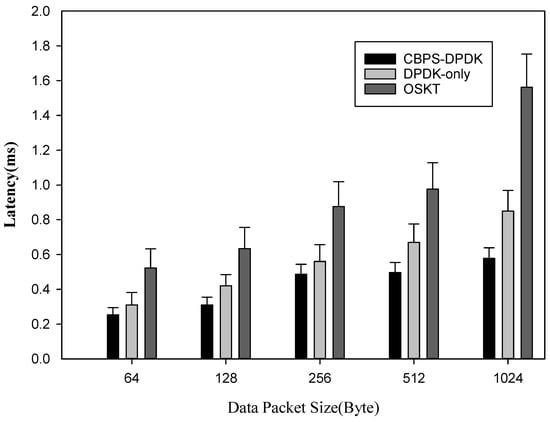
Figure 4.
End-to-end latency vs. packet size for OSKT, DPDK-only, and CBPS-DPDK.

Table 3.
Mean latency and variance under different packet sizes.
As shown in Figure 4, DPDK-Only achieves lower latency than OSKT across all packet sizes. The proposed CBPS-DPDK method achieves the lowest latency overall. Table 3 further confirms that CBPS-DPDK maintains both low latency and stable performance.
Figure 5 compares the composition of system latency for the CBPS-DPDK and DPDK-only methods. In both cases, the proportion of data transmission latency remains relatively close. However, there is a clear difference in the proportion of queuing latency: CBPS-DPDK consistently maintains a lower queuing latency ratio, whereas DPDK-only without the publish/subscribe model exhibits a noticeably higher ratio. This difference results from the content-based publish/subscribe model in CBPS-DPDK, which reduces queue buildup through load-aware message routing and balanced task distribution. These results indicate that integrating the publish/subscribe model with DPDK can effectively shorten queuing latency and enhance overall latency stability, particularly under high-concurrency workloads.
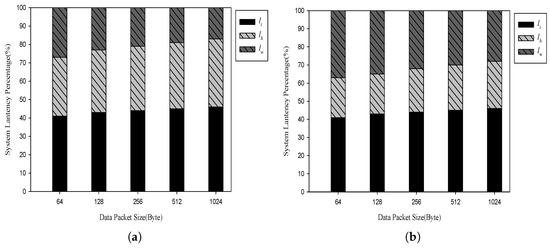
Figure 5.
Latency composition (transmission, processing, queuing) under different packet sizes for (a) CBPS-DPDK and (b) DPDK-only.
The transmission bitrate is defined in Formula (8), where higher values indicate better throughput performance. An automated test script was used to simulate continuous video stream data and the transmission bitrate of the three methods was measured over a one-hour period. As shown in Figure 6, the OSKT baseline achieved a maximum throughput of about 4.5 Gbps, which is significantly lower than the other two methods. The DPDK-only method improved performance but still did not reach the level of CBPS-DPDK. The proposed CBPS-DPDK method achieved throughput ranging from 5.2 Gbps to 8.17 Gbps, which is 15.4% higher than OSKT and 8.8% higher than DPDK-only. This result demonstrates that combining DPDK with a content-aware publish/subscribe model can significantly improve throughput under continuous high-concurrency video transmission.
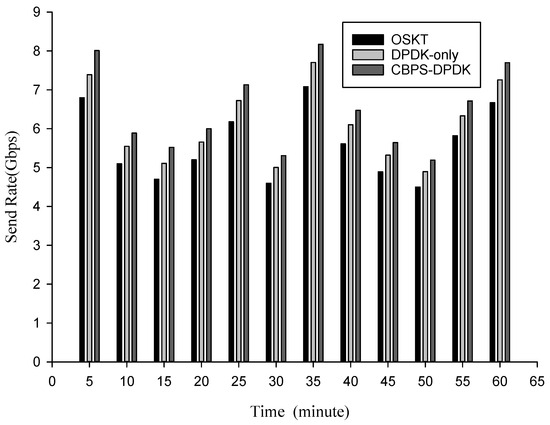
Figure 6.
Throughput over a 60-min continuous run for OSKT, DPDK-only, and CBPS-DPDK.
As shown in Figure 7, the VMAF scores at the subscriber nodes were calculated using the Netflix VMAF evaluation tool. The evaluation covered 180 min of continuous video playback for each method. The CBPS-DPDK method achieved VMAF scores in the range of [88, 92], the DPDK-only baseline achieved scores in the range of [83, 87], and the traditional OSKT method produced scores in the range of [74, 82]. On average, CBPS-DPDK improved by 13.7% over DPDK-only and by a larger margin over OSKT. The score curve of CBPS-DPDK remained stable throughout the 180 min period, while the baselines exhibited more fluctuations, particularly under bursty traffic. This performance advantage is attributed to the content-aware publish/subscribe model, which reduces packet loss, frame disorder, and retransmissions by enabling precise load balancing and efficient stream forwarding. These results confirm that CBPS-DPDK not only improves average perceptual video quality but also maintains stability under sustained high-concurrency transmission.
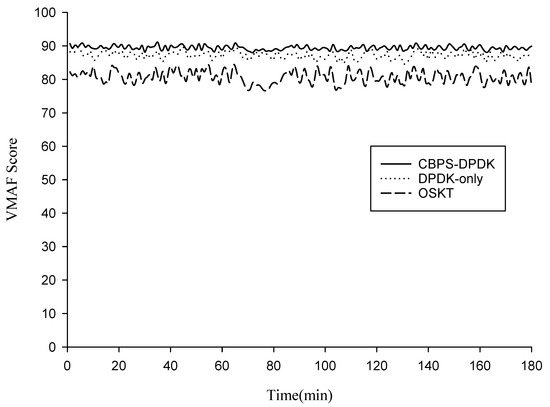
Figure 7.
Subscriber-side video quality over 180 min measured by VMAF (0–100) for OSKT, DPDK-only, and CBPS-DPDK.
As shown in Table 4, CBPS-DPDK delivers the best latency performance, with an average of 0.425 ms, representing a significant reduction compared to DPDK-only (0.562 ms) and OSKT (0.914 ms). Its latency coefficient of variation (32.17%) is also markedly lower than those of DPDK-only (37.57%) and OSKT (44.31%), indicating superior stability and enhanced end-to-end latency control under varying packet loads.

Table 4.
Transmission performance and latency fluctuation statistics.
In terms of throughput, CBPS-DPDK achieves an average of 6.48 Gbps, exceeding DPDK-only (6.09 Gbps) and OSKT (5.60 Gbps). Although its throughput coefficient of variation (16.38%) is slightly higher than that of DPDK-only (16.24%) and OSKT (16.25%), the difference is minimal, reflecting robust performance stability under high-load conditions. In addition, to further evaluate system performance in the publish/subscribe scenario, experiments were conducted on CBPS-DPDK and NATS with a dataset size of 200,000 MB, as shown in Figure 8. At this scale, system resources were nearly saturated, which better reflected the differences between the two methods. The results show that in terms of throughput, the normalized value of CBPS-DPDK was 0.641, while that of NATS was 0.434. Throughput was normalized with an upper limit of 10 Gbps, corresponding to actual values of 6.41 Gbps and 4.34 Gbps, with the former being about 48% higher than the latter. In terms of latency, the mean value of CBPS-DPDK was 0.578 ms, while that of NATS was 1.421 ms, which is only 40.7% of the latter, showing a difference of nearly 2.5 times. For CPU utilization, CBPS-DPDK reached 0.562 (i.e., 56.2%), whereas NATS reached 0.821 (i.e., 82.1%), showing a reduction of about 31.6%. For memory usage, the normalized value of CBPS-DPDK was 0.763, corresponding to about 12.2 GB, while that of NATS was 0.781, or about 12.5 GB. These results indicate that CBPS-DPDK demonstrates clear advantages in throughput and latency, while also achieving higher resource efficiency in CPU and memory usage.
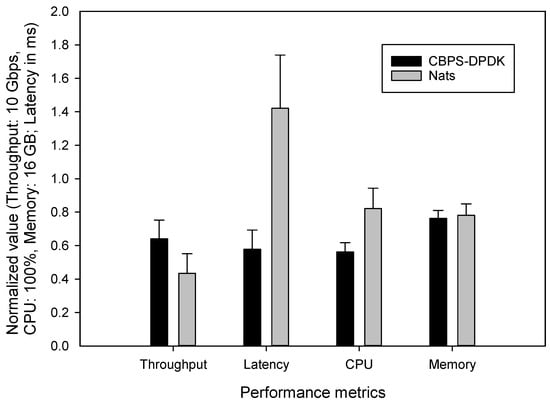
Figure 8.
Comparison of throughput, latency, CPU utilization, and memory usage between CBPS-DPDK and NATS. Throughput, CPU, and memory are shown as normalized values with baselines of 10 Gbps, 100%, and 16 GB, respectively. For example, a CPU value of 0.562 indicates that the CPU usage is 56.2%. Latency is presented in absolute values (ms).
Table 5 summarizes the performance improvements of DPDK-only and CBPS-DPDK over the baseline OSKT. It can be observed that compared with OSKT, DPDK-only achieves a 37.5% improvement in latency, an 11.1% improvement in throughput, and a 9.1% improvement in VMAF. In contrast, CBPS-DPDK achieves a 51.8% improvement in latency, an 18.3% improvement in throughput, and an 11.2% improvement in VMAF. These results indicate that although DPDK-only has partially alleviated the kernel bottleneck, CBPS-DPDK, with the integration of the content-aware publish/subscribe model, achieves greater improvements in both efficiency and video quality.

Table 5.
Relative performance improvement over OSKT. Positive values indicate improvement.
Overall, the comparative evaluation highlights the superior performance of CBPS-DPDK across multiple dimensions. As summarized in Table 5, relative to OSKT, DPDK-only reduces latency by 37.5%, while improving throughput and video quality by 11.1% and 9.1%, respectively. These results confirm that transferring packet processing to user space partially alleviates the kernel bottleneck. However, CBPS-DPDK achieves even greater improvements, reducing latency by 51.8%, increasing throughput by 18.3%, and enhancing video quality by 11.2% compared with OSKT. This demonstrates that the integration of the content-aware publish/subscribe model with DPDK not only amplifies performance gains but also ensures higher service quality.
In addition, a qualitative comparison with NATS further underscores the scalability and efficiency of CBPS-DPDK. While NATS remains effective as a lightweight messaging system, it exhibits higher latency and greater resource consumption under saturated workloads. By contrast, CBPS-DPDK maintains lower delay, higher throughput, and more balanced resource utilization, thereby demonstrating superior suitability for latency-sensitive and bandwidth-intensive edge computing scenarios.
5. Conclusions
In smart logistics applications, numerous smart terminals transmit data to edge computing clusters for real-time processing. Large-scale concurrent data stream access and forwarding have become a performance bottleneck in such environments. This work addresses the problem by integrating Data Plane Development Kit (DPDK) technology with a content-based publish/subscribe model (CBPS-DPDK). At the technical level, DPDK bypasses the operating system kernel to improve data plane transmission performance in edge networks. At the architectural level, the publish/subscribe model decouples data reception nodes from computing nodes. This enables accurate data stream distribution and improves scalability. Experimental results show that CBPS-DPDK significantly outperforms OSKT and DPDK-only in end-to-end latency, throughput, and video quality. Relative to the OSKT baseline, DPDK-only achieves improvements of 37.5% in latency, 11.1% in throughput, and 9.1% in VMAF; CBPS-DPDK further increases these to 51.8%, 18.3%, and 11.2%, respectively. These results confirm the effectiveness of content-aware forwarding in reducing packet loss, frame disorder, and retransmissions. In addition, compared with the traditional publish–subscribe system NATS, CBPS-DPDK maintains lower delay, higher throughput, and more balanced CPU and memory utilization under saturated workloads, highlighting its suitability for latency-sensitive and bandwidth-intensive edge scenarios. Despite these gains, once kernel context switches and copy overheads are removed, the residual bottleneck shifts to user-space semantic matching and batching. Under near-saturation loads, these costs amplify queueing delay and can become the dominant contributor to end-to-end latency. Overall, CBPS-DPDK achieves high concurrency, low latency, and high quality in an edge computing environment through DPDK acceleration and content-aware push.
This work is subject to several limitations. The evaluation is conducted in a controlled LAN with always-available nodes; stochastic WAN effects (jitter, congestion, loss, reordering) as well as link/node failures and recovery behavior are not modeled. MTU-related phenomena are not investigated: experiments focus on sub-MTU payloads (64–1024 Byte) under a fixed-MTU configuration, so path-MTU constraints and the IP fragmentation/reassembly overhead they induce remain unquantified. The semantic filtering stage entails payload inspection; consequently, end-to-end confidentiality, integrity, authentication, and access-control mechanisms are not addressed. In addition, the workload centers on campus-scale video streaming; other traffic patterns, heterogeneous access technologies and hardware, and detailed resource/energy profiles are beyond the present scope.
Future work will evaluate MTU and packetization strategies—including 1500 B and jumbo-frame (9000 Byte) configurations—and quantify their impact on CPU cost and tail latency under path-MTU heterogeneity; integrate privacy-preserving semantic filtering and assess the associated performance–security trade-offs; introduce impairment/failure injection with dynamic load redistribution and self-healing scheduling; and extend the evaluation to mixed workloads and diverse platforms with fine-grained energy/resource instrumentation.
Author Contributions
Conceptualization, Y.W. and Z.Y.; methodology, Y.W.; software, Y.W.; validation, Y.W., Z.Y. and X.Y.; formal analysis, X.Y.; investigation, Z.Y.; resources, X.Y.; data curation, Y.W.; writing—original draft preparation, X.Y.; writing—review and editing, H.W.; visualization, Y.W.; supervision, Z.Y.; project administration, Z.Y.;funding acquisition, X.Y. All authors have read and agreed to the published version of the manuscript.
Funding
This research was funded by “The Shandong Provincial Natural Science Foundation of China (ZR2023MF090)”.
Data Availability Statement
The original contributions presented in this study are included in the article. Further inquiries can be directed to the corresponding authors.
Conflicts of Interest
The authors declare no conflicts of interest.
Abbreviations
The following abbreviations are used in this manuscript:
| DPDK | Data Plane Development Kit |
| CBPS | Content-Based Publish/Subscribe |
| CBPS-DPDK | Content-Based Publish/Subscribe based on DPDK |
| IPSec | Internet Protocol Security |
| VMAF | Video Multimethod Assessment Fusion |
| OSKT | Operating System Kernel-based Transmission |
References
- Merenda, M.; Porcaro, C.; Iero, D. Edge machine learning for ai-enabled iot devices: A review. Sensors 2020, 20, 2533. [Google Scholar] [CrossRef] [PubMed]
- Mach, P.; Becvar, Z. Mobile edge computing: A survey on architecture and computation offloading. IEEE Commun. Surv. Tutor. 2017, 19, 1628–1656. [Google Scholar] [CrossRef]
- Abbas, N.; Zhang, Y.; Taherkordi, A.; Skeie, T. Mobile edge computing: A survey. IEEE Internet Things J. 2017, 5, 450–465. [Google Scholar] [CrossRef]
- Jiang, K.; Sun, C.; Zhou, H.; Li, X.; Dong, M.; Leung, V.C. Intelligence-empowered mobile edge computing: Framework, issues, implementation, and outlook. IEEE Netw. 2021, 35, 74–82. [Google Scholar] [CrossRef]
- Qiu, T.; Chi, J.; Zhou, X.; Ning, Z.; Atiquzzaman, M.; Wu, D.O. Edge computing in industrial internet of things: Architecture, advances and challenges. IEEE Commun. Surv. Tutor. 2020, 22, 2462–2488. [Google Scholar] [CrossRef]
- Almeida, A.; Brás, S.; Sargento, S.; Pinto, F.C. Time series big data: A survey on data stream frameworks, analysis and algorithms. J. Big Data 2023, 10, 83. [Google Scholar] [CrossRef] [PubMed]
- Wang, X.; Jia, W. Optimizing Edge AI: A Comprehensive Survey on Data, Model, and System Strategies. arXiv 2025, arXiv:2501.03265. [Google Scholar] [CrossRef]
- Pooyandeh, M.; Sohn, I. Edge network optimization based on ai techniques: A survey. Electronics 2021, 10, 2830. [Google Scholar] [CrossRef]
- DPDK: Data Plane Development Kit. Available online: https://www.dpdk.org (accessed on 15 July 2025).
- Li, X.; Liu, H.; Wang, H. Data transmission optimization in edge computing using multi-objective reinforcement learning. J. Supercomput. 2024, 80, 21179–21206. [Google Scholar] [CrossRef]
- Liu, J.; Lu, Y.; Wu, H.; Ai, B.; Jamalipour, A.; Zhang, Y. Joint Task Coding and Transfer Optimization for Edge Computing Power Networks. IEEE Trans. Netw. Sci. Eng. 2025, 12, 2783–2796. [Google Scholar] [CrossRef]
- Peng, Y.; Jolfaei, A.; Hua, Q.; Shang, W.L.; Yu, K. Real-time transmission optimization for edge computing in industrial cyber-physical systems. IEEE Trans. Ind. Inform. 2022, 18, 9292–9301. [Google Scholar]
- Wang, Z.; Wei, Y.; Yu, F.R.; Han, Z. Utility optimization for resource allocation in edge network slicing using DRL. In Proceedings of the GLOBECOM 2020-2020 IEEE Global Communications Conference, Taipei, Taiwan, 7–11 December 2020; pp. 1–6. [Google Scholar]
- Liu, P.; Lyu, S.; Ma, S.; Wang, W. Optimization algorithm of wireless surveillance data transmission task based on edge computing. Comput. Commun. 2021, 178, 14–25. [Google Scholar] [CrossRef]
- Liu, Y.; Mao, Y.; Liu, Z.; Ye, F.; Yang, Y. Joint task offloading and resource allocation in heterogeneous edge environments. IEEE Trans. Mob. Comput. 2023, 23, 7318–7334. [Google Scholar] [CrossRef]
- Kim, J.; Kim, T.; Hashemi, M.; Brinton, C.G.; Love, D.J. Joint optimization of signal design and resource allocation in wireless D2D edge computing. In Proceedings of the IEEE INFOCOM 2020-IEEE Conference on Computer Communications, Toronto, ON, Canada, 6–9 July 2020; pp. 2086–2095. [Google Scholar]
- Zhang, H.; He, X.; Wu, Q.; Dai, H. Spectral graph theory based resource allocation for IRS-assisted multi-hop edge computing. In Proceedings of the IEEE INFOCOM 2021-IEEE Conference on Computer Communications Workshops (INFOCOM WKSHPS), Vancouver, BC, Canada, 10–13 May 2021; pp. 1–6. [Google Scholar]
- Bhattacharyya, A.; Ramanathan, S.; Fumagalli, A.; Kondepu, K. An end-to-end DPDK-integrated open-source 5G standalone Radio Access Network: A proof of concept. Comput. Netw. 2024, 250, 110533. [Google Scholar] [CrossRef]
- Narappa, A.B.; Parola, F.; Qi, S.; Ramakrishnan, K. Z-Stack: A High-Performance DPDK-Based Zero-Copy TCP/IP Protocol Stack. In Proceedings of the 2024 IEEE 30th International Symposium on Local and Metropolitan Area Networks (LANMAN), Boston, MA, USA, 10–11 July 2024; pp. 100–105. [Google Scholar]
- Anastasio, L.; Bogani, A.; Cappelli, M.; Di Gennaro, S.; Gaio, G.; Lonza, M. Integration of DPDK for Real-Time Communication in the Elettra Synchrotron Orbit Feedback Control System: Jitter and Latency Optimization. IEEE Trans. Ind. Inform. 2025, 21, 5104–5114. [Google Scholar] [CrossRef]
- Ren, Q.; Zhou, L.; Xu, Z.; Zhang, Y.; Zhang, L. PacketUsher: Exploiting DPDK to accelerate compute-intensive packet processing. Comput. Commun. 2020, 161, 324–333. [Google Scholar] [CrossRef]
- Ullah, S.; Choi, J.; Oh, H. IPsec for high speed network links: Performance analysis and enhancements. Future Gener. Comput. Syst. 2020, 107, 112–125. [Google Scholar] [CrossRef]
- Chen, W.; Zhu, Y.; Liu, J.; Chen, Y. Enhancing mobile edge computing with efficient load balancing using load estimation in ultra-dense network. Sensors 2021, 21, 3135. [Google Scholar] [CrossRef]
- Shortle, J.F.; Thompson, J.M.; Gross, D.; Harris, C.M. Fundamentals of Queueing Theory; John Wiley & Sons: Hoboken, NJ, USA, 2018. [Google Scholar]
- VMAF: The Journey Continues. Available online: https://netflixtechblog.com/vmaf-the-journey-continues-44b51ee9ed12 (accessed on 15 July 2025).
Disclaimer/Publisher’s Note: The statements, opinions and data contained in all publications are solely those of the individual author(s) and contributor(s) and not of MDPI and/or the editor(s). MDPI and/or the editor(s) disclaim responsibility for any injury to people or property resulting from any ideas, methods, instructions or products referred to in the content. |
© 2025 by the authors. Licensee MDPI, Basel, Switzerland. This article is an open access article distributed under the terms and conditions of the Creative Commons Attribution (CC BY) license (https://creativecommons.org/licenses/by/4.0/).