Article

Voltage Control for Active Distribution Networks Considering Coordination of EV Charging Stations

1
State Grid Sichuan Electric Power Company, Chengdu 610065, China
2
College of Electrical Engineering, Sichuan University, Chengdu 610065, China
*
Author to whom correspondence should be addressed.
Electronics 2025, 14(18), 3591; https://doi.org/10.3390/electronics14183591
Submission received: 12 August 2025 / Revised: 4 September 2025 / Accepted: 5 September 2025 / Published: 10 September 2025

Abstract

Modern distribution networks are increasingly affected by the widespread adoption of photovoltaic (PV) generation and electric vehicles (EVs). The variability of PV output and the fluctuating demand of EVs may cause voltage violations that threaten the safe operation of active distribution networks (ADNs). This paper proposes a voltage control strategy for ADNs to address the voltage violation problem by utilizing the control flexibility of EV charging stations (EVCSs). In the proposed strategy, a state-driven margin algorithm is first employed to generate training data comprising response capability (RC) of EVs and state parameters, which are used to train a multi-layer perceptron (MLP) model for real-time estimation of EVCS response capability. To account for uncertainties in EV departure times, a relevance vector machine (RVM) model is applied to refine the estimated RC of EVCSs. Then, based on the estimated RC of EVCSs, a second-order cone programming (SOCP)-based voltage regulation problem is formulated to obtain the optimal dispatch signal of EVCSs. Finally, a broadcast control scheme is adopted to distribute the dispatch signal across individual charging piles and the energy storage system (ESS) within each EVCS to realize the voltage regulation. Simulation results on the IEEE 34-bus feeder validate the effectiveness and advantages of the proposed approach.

1. Introduction

Driven by global climate goals, the transition away from fossil fuels has accelerated the deployment of renewable energy sources (RESs) [1,2]. However, the growing number of RESs, particularly photovoltaic (PV) systems, introduces significant challenges for voltage regulation in active distribution networks (ADNs), due to their intermittent power generation [3,4]. On the other hand, owing to the eco-friendly property, the number of electric vehicles (EVs) is rapidly increasing nowadays. However, the unscheduled charging of EVs can result in abrupt load change, further aggravating voltage fluctuations within ADNs [5]. As the main power source of EVs, the EV charging station (EVCS) has the potential to provide operational flexibility to the ADN by utilizing vehicle-to-grid (V2G) technology [6,7]. In this paper, EV charging stations (EVCSs) will be utilized to provide the voltage control support for ADNs.
The accurate assessment of the aggregate power adjustment capability, i.e., response capability (RC) of EVCS, is a vital prerequisite for its participation in voltage regulation, as it defines the available range of charging and discharging power that the station can provide at a given time [8,9,10]. Overestimation of the RC may hide the potential risk of inadequacy and jeopardize system security. Underestimation of the RC will waste demand response resources provided by EVs and may incur a higher cost. However, the accurate RC evaluation of EVCS is usually difficult, due to the dynamic and uncertain nature of EV states [11,12].
Extensive studies have explored the evaluation of EV’s response capability. For example, authors in [13] introduce a smart charge/discharge scheduling algorithm to optimize grid load by peak shaving and valley filling. In [14], evolutionary game theory is employed to simulate EV aggregator behavior, modeling RC with consideration of user autonomy. In [15], a stochastic model predictive control framework is developed to estimate the aggregate RC of a fleet of EVs treated as a virtual battery. However, the RC evaluation methods of EVs in [13,14,15] have the following limitations: (1) only the power constraint within a single time interval is considered, which, however, is not sufficient because it does not account for the changes in the EV charging station’s response capability over time, leading to inaccurate RC evaluation; (2) only the RC of a single time period is evaluated, ignoring the impact of EV charging/discharging states and SOC evolution on the RC in subsequent time periods.
To address these limitations, recent studies have proposed a continuous-time RC evaluation model. For instance, Ref. [16] evaluates the response capability of EVs in the context of multiple timescales by considering both day-ahead and intra-day response capabilities. This method models the response capability based on predictions of EV states, such as the SOC and charging/discharging status. The authors in [12] introduce a user-aware approach to multi-timescale RC evaluation by integrating EV state dynamics and user willingness. However, both studies neglect the driver response uncertainty, which may lead to inaccurate or overconfident estimates of available flexibility. In [17], the authors propose a joint chance-constrained programming framework to optimize EV aggregator dispatch potential under driver response uncertainty. However, it overlooks the cost differences among charging piles within the EVCS, potentially leading to inefficient power allocation and increased operating costs. The lack of internal coordination further limits the economic efficiency of regulation.
Besides the RC assessment, another challenge for EVCS’s participation in voltage regulation is the efficient allocation of a power adjustment signal among numerous charging piles within the EVCS. In the literature, there have been several methods proposed for power tracking of EVCSs. For example, in [18], a hierarchical control framework for coordinated EV charging is proposed, based on real-time data exchange between central controllers and aggregators. In [19], a centralized routing and charging scheduling strategy was developed to manage power distribution across multiple EV charging stations. However, all these methods are conducted in a centralized manner, whose successful application relies on high-quality communication infrastructure, which is costly and lacks scalability when the number of charging piles is huge.
To address these issues, we develop and test a voltage control strategy for ADNs considering coordination of EVCSs. In the proposed approach, we begin by training a multi-layer perceptron (MLP) model using real-time EV state data to establish the relationship between EV status and response margins, enabling rapid estimation of the RC of EVCSs. To handle uncertainties in EV departure times, a relevance vector machine (RVM) model is applied to modify the MLP-predicted RC, providing confidence-bounded adjustment limits for dispatch optimization. These bounds are incorporated as constraints in a second-order cone programming (SOCP)-based voltage control model to compute optimal power adjustment signals for EVCSs. Finally, a broadcast control mechanism is employed to efficiently distribute the dispatch signal across charging piles and the energy storage system (ESS) within each EVCS.
The main contributions of this paper are summarized as follows:
(1)
Different from existing methods that evaluate RC in a single time interval (e.g., [13,14,15]), the proposed RC assessment method enables adaptive, minute-level power adjustment by predicting the RC of EVCS in real time by using an MLP-trained model.
(2)
Compared to the temporal RC evaluation model in [12,16], which neglects uncertain EV departure behavior, the proposed RC evaluation method integrates an RVM-based probabilistic model to capture these uncertainties. By leveraging real-time EV state features and external factors such as holiday schedules, it provides confidence-bounded RC estimates, delivering a more reliable evaluation of EVCS flexibility.
(3)
Compared with the centralized power allocation methods in [18,19], which require high-quality communication infrastructure, a broadcast control scheme is adopted to allocate power adjustment signals among charging piles and the ESS within each EVCS, reducing operational costs and enhancing allocation efficiency through decentralized dispatch.
The remainder of this paper is organized as follows. Section 2 describes the system model. Section 3 presents the proposed control strategy. Section 4 presents various case studies based on the IEEE 34-bus test feeder. Section 5 provides the conclusion.

2. System Model

In this section, we present the distribution network (DN) model that will be used to formulate the voltage control problem.
A radial DN architecture is considered, which includes N b buses (set B = b 1 , , b N ) and N b 1 line segments (set I B × B ). Bus b 1 serves as the substation bus, and its voltage is assumed to be of reference voltage v 0 . The voltage amplitude of any bus b i is represented by V i , and p i , q i are used to represent the active and reactive injected power of bus b i . For each line segment i , j , the resistance and reactance are denoted as r i j and x i j , respectively. Likewise, P i j and Q i j represent the active and reactive power flowing from bus b i to bus b j . Based on the aforementioned definitions, the DistFlow equations introduced in [20] are utilized to represent the power flow within the DN for each line ( i , j ) I :
P i j k B j P j k = p j + r i j P i j 2 + Q i j 2 V i 2 Q i j k B j Q j k = q j + x i j P i j 2 + Q i j 2 V i 2 V i 2 V j 2 = 2 ( r i j P i j + x i j Q i j ) ( r i j 2 + x i j 2 ) P i j 2 + Q i j 2 V i 2
In (1), B j represents all descendant neighbors of bus b j ; P i j 2 + Q i j 2 / V i 2 represents the square of the line current amplitude.

3. Proposed Control Strategy

3.1. Overview

In this section, the proposed voltage control strategy considering the coordination of EVCSs is presented in detail. As illustrated in Figure 1, the overall control process consists of three stages, described as follows:
(1)
Stage I: RC estimation of EVCS: the RC of EVCSs is estimated in real time by using an MLP-trained model. To incorporate the uncertain impact of unscheduled EV departures, an RVM model refines the MLP-predicted RC, yielding confidence-bounded adjustment limits for subsequent dispatch optimization.
(2)
Stage II: Dispatch signal calculation of EVCSs for voltage regulation: based on the final RC estimated in Stage I, the distribution system operator (DSO) formulates a voltage regulation problem to calculate the optimal power adjustment signals for EVCSs, where the control problem is relaxed as a convex program by employing the SOCP technique.
(3)
Stage III: Power adjustment allocation within EVCS: after receiving the optimal dispatch signal obtained in Stage II, a broadcast control scheme is employed within each EVCS to allocate the dispatch signal across individual charging piles and the ESS, minimizing control costs while adhering to internal power adjustment constraints.

3.2. Stage I: RC Estimation of EVCSs

3.2.1. Controllable Region of a Single EV

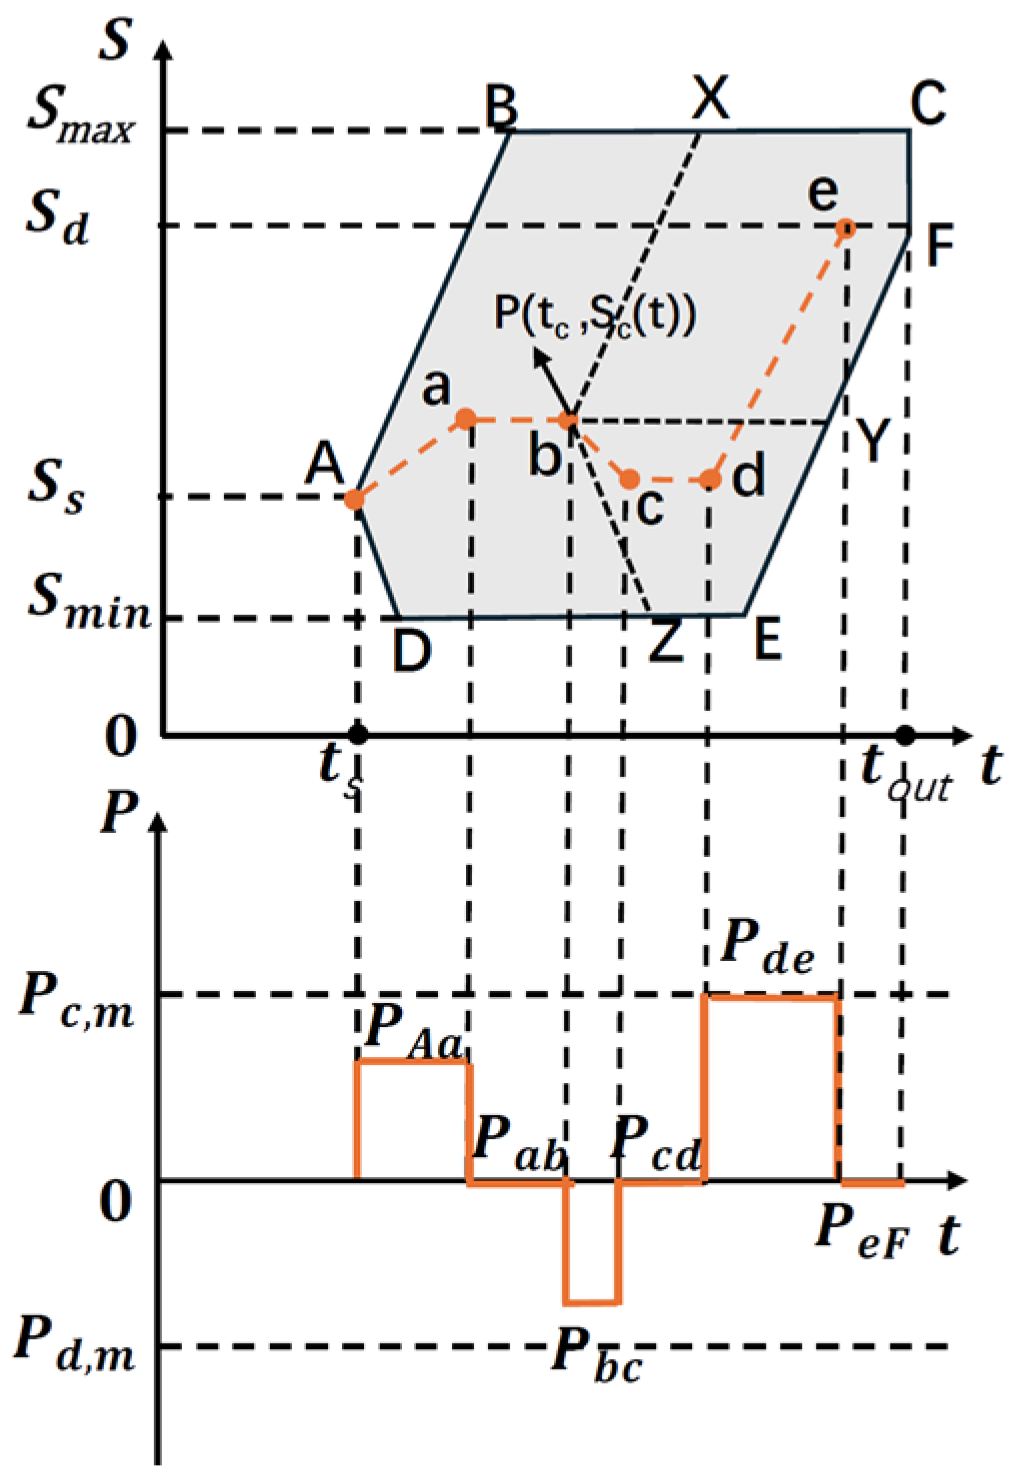
Based on [21], the maximum controllable charging and discharging region of a single EV can be defined as follows, which is also illustrated by the shaded area in Figure 2. When an EV connects to the EVCS, it reports its expected departure time and required energy to the EVCS. In Figure 2, point A represents that EV connected to the EVCS at time t s , with initial SOC being S s . The upper boundary A-B-C indicates that EV starts charging at rated charging power P c , m , immediately after being plugged into the EVCS, and EV converts to idle state when the SOC value reaches its maximum S max . If EV discharges at the rated discharge power P d , m immediately after being plugged into the EVCS, EV converts to idle state when the SOC value reduces to S min , which corresponds to the lower boundary A-D-E. It should be noted that the SOC of all EVs must reach the minimum required battery power demand S d when leaving the EVCS at time t o u t , which corresponds to the boundary E-F where the EV is forced to charge before departure.
The entire charging and discharging process of EV is described by the operation point P t c , S c t , which moves continuously within the maximum controllable charging and discharging region, over time. The trajectory of this movement corresponds to the participation of the EV in the response during the time period t s , t o u t . Taking point P for an example, the EV is charged at P c , m at t c , and the difference value of the corresponding abscissa of the dashed line PX denotes the sustainable response time of charging at P c , m . Similarly, the dashed lines PY and PZ represent the sustainable idle time and discharging time at the operating point P, respectively.

3.2.2. State-Driven Charging and Discharging Margin Estimation

To quantify the RC of individual EVs, a state-driven charging and discharging margin estimation algorithm is developed, where key parameters, i.e., the EV’s SOC, vehicle operational state (VOS), battery capacity, required energy demand, maximum charging/discharging power, and remaining parking time, are considered.
At each time step, EVs connected to the charging station are first categorized into two groups: charging-only EVs and regulation-capable EVs. The classification is determined based on the relationship between required charging time t n e e d and the remaining parking time t n . Specifically, when t n e e d t n , the EV is considered charging-only. Otherwise, i.e., t n e e d < t n , the EV is deemed capable of providing flexible power adjustment, where t n e e d is the time required to charge from S c to S d . For regulation-capable EVs, three fundamental operational states are defined: charging, idle, and discharging. As illustrated in Figure 3, transitions among these states are divided into four modes: charging to idle, idle to discharging, discharging to idle, and idle to charging. Δt denotes the sampling time period. Specifically, transitions from charging to idle and from idle to discharging contribute to power injection by reducing load or supplying power through V2G technology. Conversely, transitions from discharging to idle and from idle to charging support power consumption by decreasing power injection or increasing load consumption.
To illustrate these transitions more concretely, as shown in Figure 2, when the EV is at point P in the idle state, if it switches to charging, it will charge at P c , m until its energy level curve intersects either CF or BC at point X. The duration of charging at P c , m is referred to as the charging margin δ c (CM). If the EV is discharging, it will switch to the idle state and remain until its power line intersects EF or CF at point Y. The duration spent in the idle state is also referred to as δ c . Similarly, when transitioning from the charging state to the idle state, the time spent in the idle state is referred to as the discharging margin δ d (DM). If the EV switches from the idle state to discharging, it will discharge at P d , m until its power line intersects DE or EF at point Z, and the duration spent discharging is referred to as δ d . The process of calculating the CM and DM by using the state-driven method is as follows:
The analytical expressions for these calculations are derived by first defining the boundary equations of the maximum controllable region, as given in (2):
E F : S ( t ) = S d + P c , m ( t t o u t ) C F : t = t o u t B C : S ( t ) = S max D E : S ( t ) = S min
The mathematical expression describing the charging process at operating point P is formulated as (3):
S ( t ) = S c + P c , m ( t t c )
The mathematical expression describing the discharging process at operating point P is formulated as (4):
S ( t ) = S c P d , m ( t t c )
when t n e e d t n , δ c = 0 and δ d = 0 . When t n e e d < t n , if S min S s ( t c ) S d , we have
δ c ( t c ) = 0 , δ d ( t c ) = t n t n e e d                          s t a t e ( t c ) = 1 δ c ( t c ) = t n e e d , δ d ( t c ) = min ( t D E , t E F , d ) t c     s t a t e ( t c ) = 2 δ c ( t c ) = t E F , l t c , δ d ( t c ) = 0                            s t a t e ( t c ) = 3
and if S d S s ( t c ) S max , we have
δ c ( t c ) = 0 , δ d ( t c ) = t n                                 s t a t e ( t c ) = 1 δ c ( t c ) = 0 , δ d ( t c ) = min ( t E F , d , t o u t ) t c     s t a t e ( t c ) = 2 δ c ( t c ) = t o u t t c , δ d ( t c ) = 0                        s t a t e ( t c ) = 3
where s t a t e ( t ) = 1 , 2 , 3 indicates that the EV’s state at time t c is charging, idle, and discharging, respectively. t D E and t E F , d represent the time when the power line intersects boundaries DE and EF, respectively, subsequent to the EV’s transition from the idle state to the discharging state. Similarly, t E F , l denotes the time when the power line intersects boundary EF, subsequent to the EV’s transition from the discharging state back to the idle state.
The intersection point between the charging line of the EV under different state transitions and the boundary of the maximum controllable area is analytically derived and expressed as (7).
t D E = t c + S c S min / P d , m t E F , d = S c S d + P c , m t o u t + P d , m t c P d , m + P c , m t E F , l = S c S d + P c , m t o u t / P c , m
Note that these margins, together with other dynamic parameters, are accumulated and updated at each time step to form a dataset comprising time-stamped EV operating states, along with the corresponding CM and DM values. Although the charging and discharging margins can be derived analytically, repeated calculations for large EV populations would be computationally intensive. Therefore, in this paper, a trained MLP model is employed to directly predict CM and DM from EV state parameters, which reduces computational burden and enables minute-level prediction for high time-resolution applications.

3.2.3. MLP-Based RC Prediction

Based on the dataset generated by the state-driven margin algorithm, an MLP model is trained to rapidly predict EV charging and discharging margins from real-time EV states.
The model input features include 10 dimensions related to real-time vehicle status and battery parameters, selected based on the key variables used in the state-driven margin algorithm in Section 3.2.2:
x = S c , s t a t e , S max , S min , S d , P c , m , P d , m , t o u t T
where the VOS ( s t a t e ) is converted into a three-dimensional vector by one-hot encoding (charging/idle/discharging correspond to [1,0,0], [0,1,0], and [0,0,1], respectively). Then, Z-score normalization is performed on continuous numerical variables:
x n o r m ( i ) = x ( i ) μ i σ i , i = 1 , 2 , , 10
where μ i , σ i is the mean and standard deviation of each feature, and the VOS has been converted to discrete categorical variables by one-hot coding without the need for standardization.
The network consists of an input layer, two fully connected hidden layers, and an output layer. The input layer receives a 10-dimensional feature vector. The first hidden layer includes 64 neurons with ReLU activation to extract high-order nonlinear features, followed by a second hidden layer with 32 neurons to further condense the feature representation. The layer sizes are determined through preliminary experiments to balance prediction accuracy and computational efficiency. The output layer performs direct regression to predict the EV charging and discharging margins. The network formulation is given as (10):
h 1 = ReLU ( W 1 x n o r m + b 1 ) , W 1 64 × 10 , b 1 64 h 2 = ReLU ( W 2 h 1 + b 2 ) , W 2 64 × 10 , b 2 32 y ^ = W 3 h 2 + b 3 , W 3 2 × 32 , b 3 2
where x n o r m 10 is the normalized input vector, and W 1 64 × 10 and b 1 64 are the weight matrix and bias vector of the first hidden layer; W 2 32 × 64 and b 2 32 are the second hidden layer parameters, W 3 2 × 32 and b 3 2 are output layer parameters, and y ^ = δ ^ c , δ ^ d is the predicted CM and DM.
The loss function is designed as a weighted combination of mean square error (MSE) and a physical constraint penalty term, as shown in (11):
L t o t a l = L M S E + λ L p h y s
where L t o t a l represents the total loss function, L M S E is the MSE term, and L p h y s is the physical constraint term. λ is a fixed weighting coefficient. The MSE term is used to minimize the deviation between the predicted and true values, and is given by
L M S E = 1 N i = 1 N δ ^ c , i δ c , i 2 + δ ^ d , i δ d , i 2
where N denotes the number of training samples.
The physical constraint term ensures that the model output adheres to physical laws by penalizing predictions where the margin exceeds the remaining time. Specifically, this penalty term is designed to restrict the predicted margins from surpassing the remaining available time for charging or discharging, as shown in (13):
i = 1 N max 0 , δ ^ c , i t n , i + max 0 , δ ^ d , i t n , i
The optimization process adopts the Adam algorithm with an initial learning rate of 0.01. All other hyperparameters are set to their default values. The optimization update rule is given by
θ t + 1 = θ t η m ^ t v ^ t + ε
where θ t represents the model parameter at the t-th iteration. m ^ t and v ^ t are the first and second moment estimates (mean and uncentered variance) after bias correction, respectively.
The MLP model enables efficient training and supports dynamic updates of EV charging and discharging margins, with high temporal resolution.

3.2.4. Evaluation of RC of EVCSs

Based on the MLP-predicted charging and discharging margins, the RC of the EVCS is evaluated in a time-discrete manner. At each time step t, the aggregated RC boundaries of the EVCS are computed by summing the RC of all individual EVs and the ESS. Specifically, the upper boundary (capacity to supply power to the grid) is calculated by aggregating the discharging capabilities of EVs whose predicted DM exceeds Δ t , along with the discharge capacity of the ESS:
P u p M L P ( t ) = i N d P d , i E V 1 δ d ( i ) > Δ t + P d E S S
where P d , i E V represents the target discharging power of vehicle i, N d is the total number of EVs capable of discharging, and 1 δ d ( i ) > Δ t is an indicator function that is 1 if the discharging margin δ d ( i ) exceeds Δ t , and 0 otherwise. P d E S S is the discharge power that the energy storage system can provide. Similarly, the lower boundary (capacity to absorb power from the grid) is given by (16):
P d o w n M L P ( t ) = i N c P c , i E V 1 δ c ( i ) > Δ t + P c E S S
where P c , i E V represents the target charging power of vehicle i, and N c represents the number of EVs capable of charging. P c E S S is the charging power from the ESS. These computed power boundaries are then reported to the DSO, which generates a power adjustment signal P g r i d ( t ) within the calculated boundaries:
P u p M L P ( t ) P g r i d ( t ) P d o w n M L P ( t )
Upon receiving the dispatch signal, EVs that meet the required conditions are selected to participate in the power response. After executing the response action, the SOC, VOS, and remaining parking time of each EV are updated accordingly. These updated parameters are then used to recalculate the CM and DM for the next evaluation period. The EVCS continuously updates and reports its available response capability boundaries to the DSO, based on the real-time distribution of EV states. The SOC update process for each EV can be expressed as (18):
S i , t + 1 = S ( i , t ) + Δ t δ c ( i , t )   or S i , t + 1 = S ( i , t ) Δ t δ d ( i , t )

3.2.5. RVM Uncertainty Modeling

The variability of EV user behavior introduces uncertainties that can compromise the reliability of RC evaluation of EVCS [21]. However, the MLP model provides only deterministic RC estimates, and does not account for events such as unscheduled vehicle departures. To improve the robustness of EVCS RC evaluation, an RVM model is employed to capture uncertainties associated with EV departure behavior by learning the statistical patterns of EV operational states and holiday effects.
The input features used for RVM training include the number of EVs in different operational states (charging, idle, and discharging), the proportion of EVs that fulfill their charging requirements, and binary indicators representing holidays. In particular, holiday effects are captured by binary variables derived from the national holiday calendar (0 for working days and 1 for holidays). The charging fulfillment proportion is defined as the ratio of EVs that successfully reach their required SOC before departure to the total number of EVs connected during each sampling interval. These features are incorporated into the RVM input vector to better capture behavioral uncertainty in EV availability. The regression model of the RVM is formulated as
y i = w T ϕ x i + ς i ,   ς N ( 0 , σ 2 )
where y i represents the target output for the i-th sample, corresponding to the deviation between the actual boundary and the MLP-predicted boundary. ϕ x i is the feature mapping of input x i , constructed using a radial basis function (RBF) kernel. w is the weight vector that quantifies the influence of input features on the output, and ς denotes the Gaussian noise term representing measurement errors. During training, the RVM estimates w by maximizing the posterior probability, based on the training dataset. The primary goal is to achieve a sparse representation by identifying the most relevant features. The RBF kernel measures the similarity between input feature vectors and is defined as
K ( x i , x j ) = exp ( k = 1 d ( x i k x j k ) 2 ) / ( 2 l 2 )
where l denotes the kernel bandwidth, x i k and x j k are the values of the k-th feature in feature vectors x i and x j , respectively, and d is the dimension of the feature vector, which includes features such as the number of EVs, charging demand, and power prediction errors. The training process aims to estimate the weight vector w for each sample point by minimizing the prediction error. This is achieved by optimizing the following objective function:
min i = 1 N y i w T ϕ ( x i ) 2 + v i = 1 N α i 1
where α i are the hyperparameters, and ν is the regularization parameter that controls the complexity of the model. This objective function seeks to minimize the error between the predicted and actual values, while balancing the model’s complexity.
After training, the RVM model can be used to predict new input samples.
y * = i = 1 N α i K ( x * , x i ) w i
where y * is the predicted value, and K ( x * , x i ) represents the feature mapping of the new input sample x * via the kernel function. The correlation between training data points is captured by the covariance matrix K.
K = K ( x 1 , x 1 ) K ( x 1 , x 2 ) K ( x 1 , x N ) K ( x 2 , x 1 ) K ( x 2 , x 2 ) K ( x 2 , x N ) K ( x N , x 1 ) K ( x N , x 2 ) K ( x N , x N )
where each element K ( x i , x j ) is the similarity calculated by (20). The prediction variance, reflecting the uncertainty of the model’s output, is given by (24):
τ p r e 2 ( x * ) = τ n 2 k T K 1 k
where τ p r e 2 ( x * ) is the variance for the new sample, and τ n 2 is the noise variance, which is assumed to be constant. k = K ( x * , x 1 ) K ( x * , x 2 )   K ( x * , x N ) T is the similarity vector between the new sample x * and all training samples. Once the prediction variance is obtained, the confidence interval can be calculated according to the following formula (25):
CI = y * z α / 2 τ p r e ( x * ) , y * + z α / 2 τ p r e ( x * )
where z α / 2 is the critical value of the standard normal distribution, determined by the desired confidence level α (e.g., for a 95% confidence interval, z α / 2 1.96 ).
Finally, the power boundary value predicted by the MLP model is adjusted, based on the predicted error confidence interval:
P u p f i n a l = P u p M L P y u p * z α / 2 τ p r e u p P d o w n f i n a l = P d o w n M L P y d o w n * z α / 2 τ p r e d o w n
where P u p f i n a l and P d o w n f i n a l represent the final power-up and power-down boundaries for EVCS, respectively.

3.3. Stage II: Dispatch Signal Calculation of EVCSs for Voltage Regulation

Based on the system model described in Section 2 and the adjustable power boundaries reported by each EVCS, a centralized optimization problem is formulated to compute the optimal power adjustment signals for voltage regulation in ADNs equipped with EVCSs. Following the SOCP relaxation of the DistFlow model, the control problem is structured as a convex program to ensure computational efficiency while accurately capturing distribution network characteristics. The objective is to minimize the total active power adjustment of the EVCSs while maintaining bus voltages within acceptable operational limits. The resulting optimization problem is formulated as follows:
min p s 1 2 p s 2 2
subject to
v i min v i v i max , i B
P i j k B j P j k = p j + r i j P i j 2 + Q i j 2 V i 2
Q i j k B j Q j k = q j + x i j P i j 2 + Q i j 2 V i 2
V i 2 V j 2 = 2 ( r i j P i j + x i j Q i j ) ( r i j 2 + x i j 2 ) P i j 2 + Q i j 2 V i 2
2 P ij   2 Q i j   v i l i j T 2 v i + l i j ,   ( i , j ) I
p d o w n f i n a l p s p u p f i n a l
v 0 = 1 ( p . u . )
where p s defines the vector of active power adjustments of EVCSs. Constraint (28) represents the voltage magnitude limits at each bus, where the squared voltage magnitude is defined as v i = V i 2 , and the substation voltage is fixed at v 0 = 1 ( p . u . ) for reference. l i j denotes the squared current magnitude on line ( i , j ) , defined as l i j = ( P i j 2 + Q i j 2 ) / v i . Constraints (29)–(32) collectively represent the DistFlow-based power flow model within the SOCP framework [22]. As shown in [22], the SOCP relaxation of the DistFlow model is exact for radial networks; i.e., there is no relaxation gap. In particular, (32) is a standard second-order cone relaxation derived from the original nonconvex equality P i j 2 + Q i j 2 = v i l i j . Constraint (33) defines the adjustable power boundaries reported by each EVCS, where p u p f i n a l and p d o w n f i n a l represent the upper- and lower-power change limits of EVCSs.

3.4. Stage III: Power Adjustment Allocation Within EVCSs

By solving the voltage control problem formulated in Section 3.3, the optimal power adjustment signal for each EVCS can be obtained. This subsection describes the broadcast control-based scheme for distributing power adjustment signals among multiple charging piles and the ESS within each EVCS.

3.4.1. Optimization Problem Formulation

Based on the received power adjustment signal P r e f , the EVCS distributes the adjustment among N controllable EV charging piles and one ESS. Each charging pile adjusts its own power output based solely on the broadcast signal and its internal state, without requiring direct communication among piles [23].
Quadratic cost functions have been applied to model the operational costs of DERs [24,25,26]. In this paper, they are employed for EV charging piles and the ESS, to simplify the formulation and ensure the convexity and tractability of the dispatch optimization problem. The cost coefficients are taken from [24]. The objective is to minimize the total operational cost of the EVCS while satisfying the overall power balance constraint. For each charging pile i, the cost function is defined as
J i P i = a i P i 2 + b i P i
where a i and b i are cost coefficients, and P i is the power of the charging pile i. Similarly, the ESS cost function is modeled as
J E S S ( P E S S ) = γ 2 P E S S 2
where γ is a weighting coefficient. The optimization problem is formulated as follows:
min P i , P E S S i = 1 N J i ( P i ) + J E S S ( P E S S )
subject to
i = 1 N P i + P E S S = P r e f
P d , m P i P c , m
r c + r d = 1
P E S S = ( 1 r c ) P d e + r c P c e
P d , max e P d e 0 P c e P c , max e
η min e E max e E e ( t ) η max e E max e
E e ( t ) = E e ( t 1 ) + ρ e P c e + P d e ρ e Δ t
E e ( 0 ) = E 0 e
where (38) ensures that the total power from all charging piles and ESS equals the grid’s power adjustment signal. Reference (39) represents the charging and discharging power constraint of each EV and (40)–(45) impose energy and charge-discharge constraints for the ESS, where (40) specifically enforces mutually exclusive charging and discharging behavior: r c = 1 indicates the charging mode, while r c = 0 indicates the discharging mode. P d , max e and P c , max e represent the maximum discharging and charging power of the ESS, respectively, while P d e and P c e represent its actual discharging and charging power. η min e and η max e represent the maximum and minimum limits of charge, respectively. ρ e denotes the efficiency of ESS.

3.4.2. Broadcast Control Architecture

A broadcast control scheme is employed to solve the above optimization problem in a distributed manner. The Lagrangian function of P i and P E S S is constructed as
L P 1 , , P N , P E S S , λ = i = 1 N ( a i P i 2 + b i P i ) + γ 2 P E S S 2 λ i = 1 N P i + P E S S P r e f
where λ is the Lagrange multiplier associated with the power balance constraint. By setting the partial derivatives of L with respect to P i and P E S S to zero, the following optimality conditions are obtained:
L P i = 2 a i P i + b i λ = 0 L P E S S = γ P E S S λ = 0
Solving these, yields the following update rules:
P i ( k + 1 ) = λ ( k ) b i 2 a i P E S S ( k + 1 ) = λ ( k ) / γ
The Lagrange multiplier λ ( k + 1 ) is then updated, based on the power balance constraint:
λ ( k + 1 ) = λ ( k ) α i = 1 N P i ( k + 1 ) + P E S S ( k + 1 ) P r e f
where α is the step size.
The broadcast process begins by initializing the global power deviation signal λ ( 0 ) , which is then broadcast to all charging piles. Each charging pile then updates its power P i ( k + 1 ) and P E S S ( k + 1 ) , based on the received signal λ ( k ) . Then λ ( k + 1 ) is updated by calculating the power balance constraint, which can be approximated by measuring the power at the bus where the EVCS connects to the DN, assuming network losses are negligible. This process is repeated iteratively until the power balance error, derived from the difference between the required power adjustment and the actual power measured at the connection point, meets the convergence criterion.

4. Case Study

In this section, the IEEE 34-bus test system is introduced first, followed by simulation results that demonstrate the effectiveness of the proposed voltage control strategy.

4.1. Test System and Parameter Settings

In this study, the IEEE 34-bus system is employed as the test system, as shown in Figure 4. The parameters of node loads and branch impedances are sourced from [27]. The system operated with base values of 4.16 kV (voltage) and 1 MVA (power), and the voltage threshold for each node is set as [0.95, 1.05] p.u. Voltages beyond this range are regarded as violations, and necessitate voltage regulation.
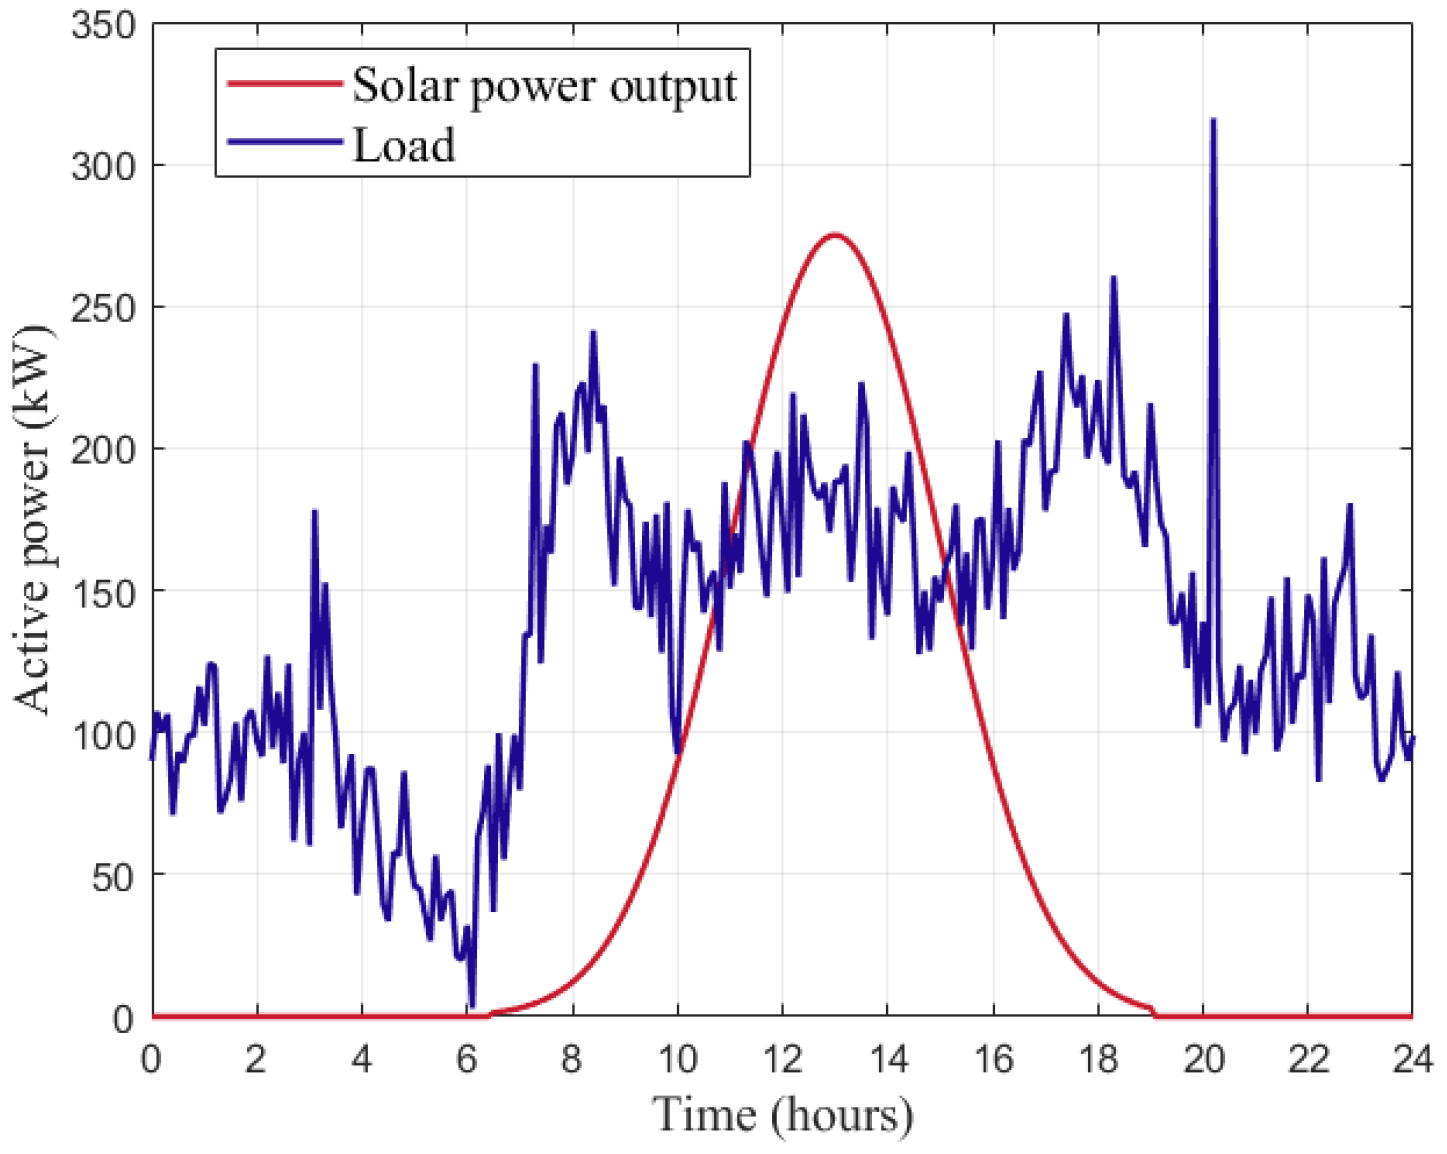
According to the data provided in [12], various types of electric vehicles (EVs) are considered in this study. Based on this distribution, 300 EVs are modeled at each EVCS. The EVCS is modeled as a load connected to buses 9 and 30, with PV generation simultaneously installed at these buses. The local load and PV generation profiles at bus 30, excluding EVCS-induced variations, are shown in Figure 5.
To characterize EV travel behaviors, EV traffic attributes are simplified based on vehicle usage types. The daily trip departure-time distribution follows, and Monte Carlo sampling is used to generate S d and S max according to probability distributions described in [12]. The main electrical parameters of the DN and station equipment are summarized in Table 1.

4.2. Simulation Results

Based on the test system described in Section 4.1, this section presents simulation results to demonstrate the effectiveness and advantage of the proposed voltage control strategy. The centralized SOCP problem in (27) is solved using the MOSEK solver. The case studies evaluate the performance of the proposed approach from different aspects, including prediction accuracy, regulation effectiveness, voltage control capability, and power allocation efficiency.
(1)
Scenario 1—MLP model accuracy test
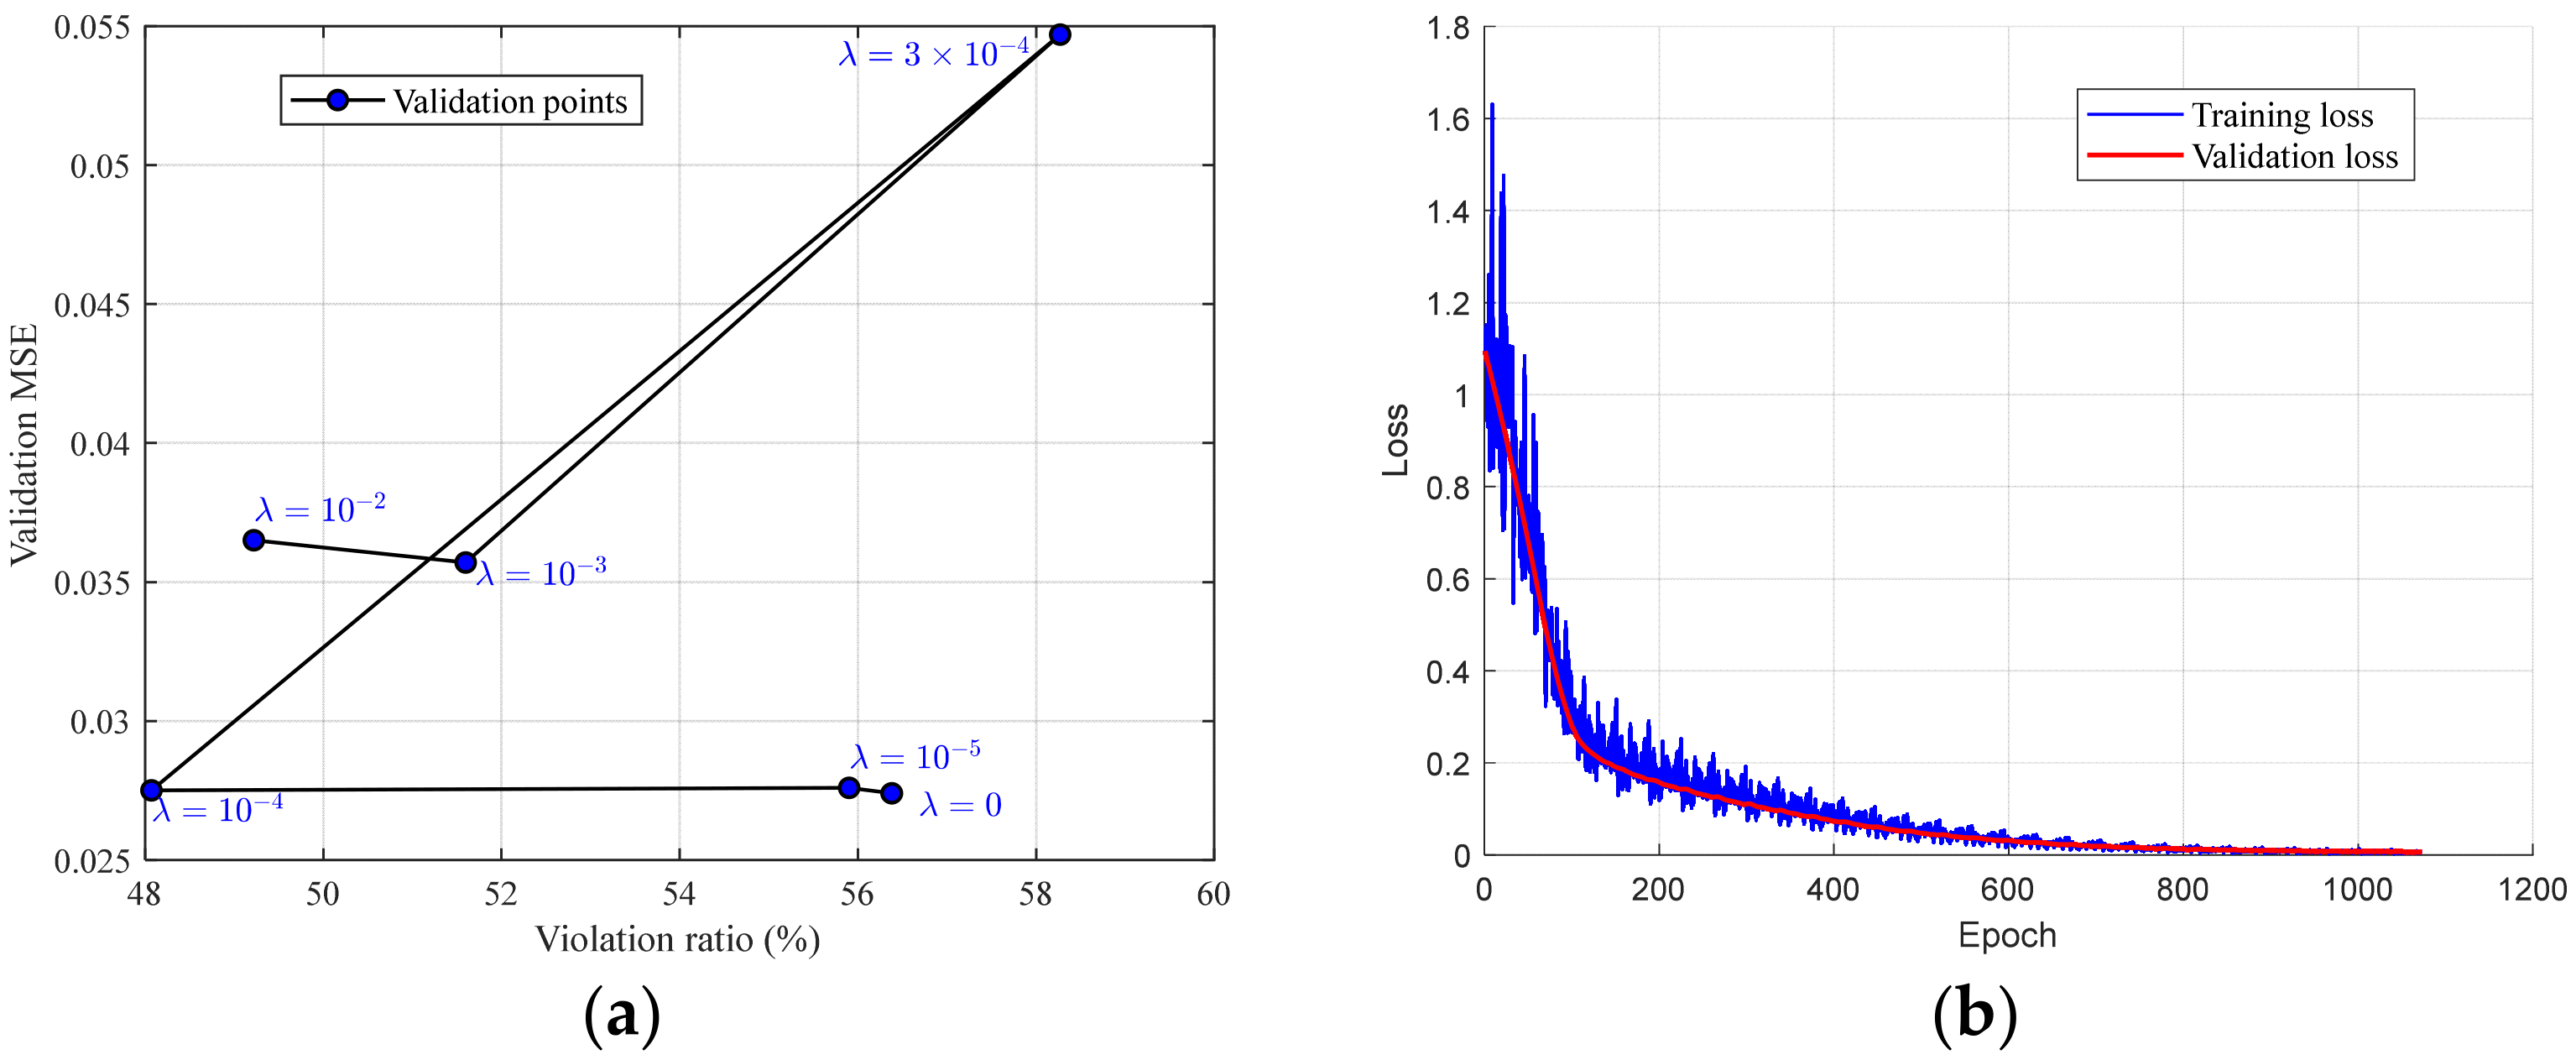
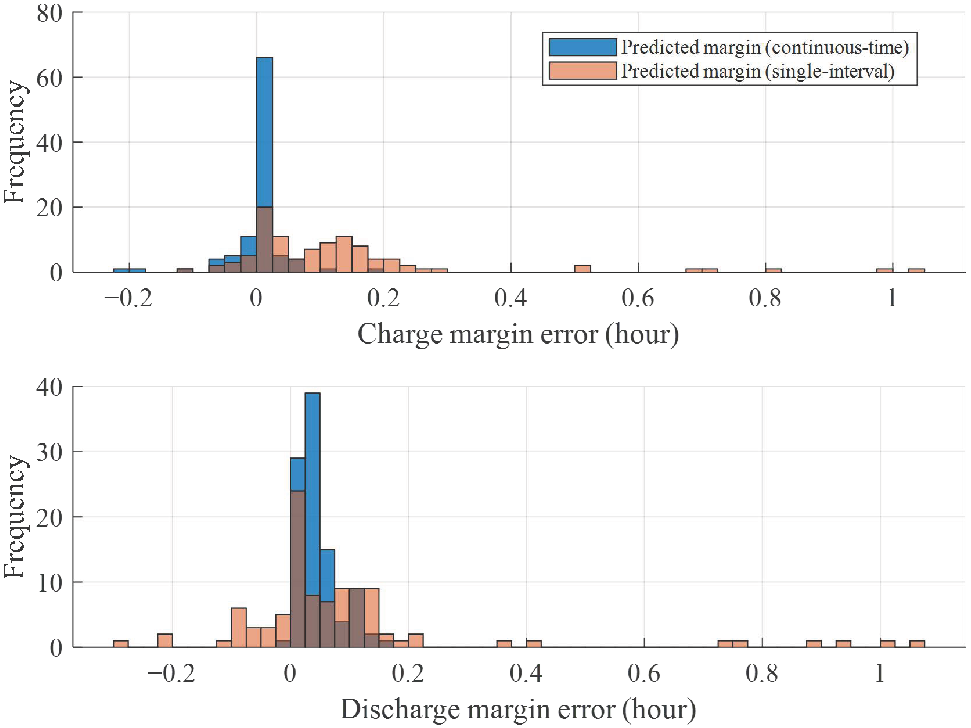
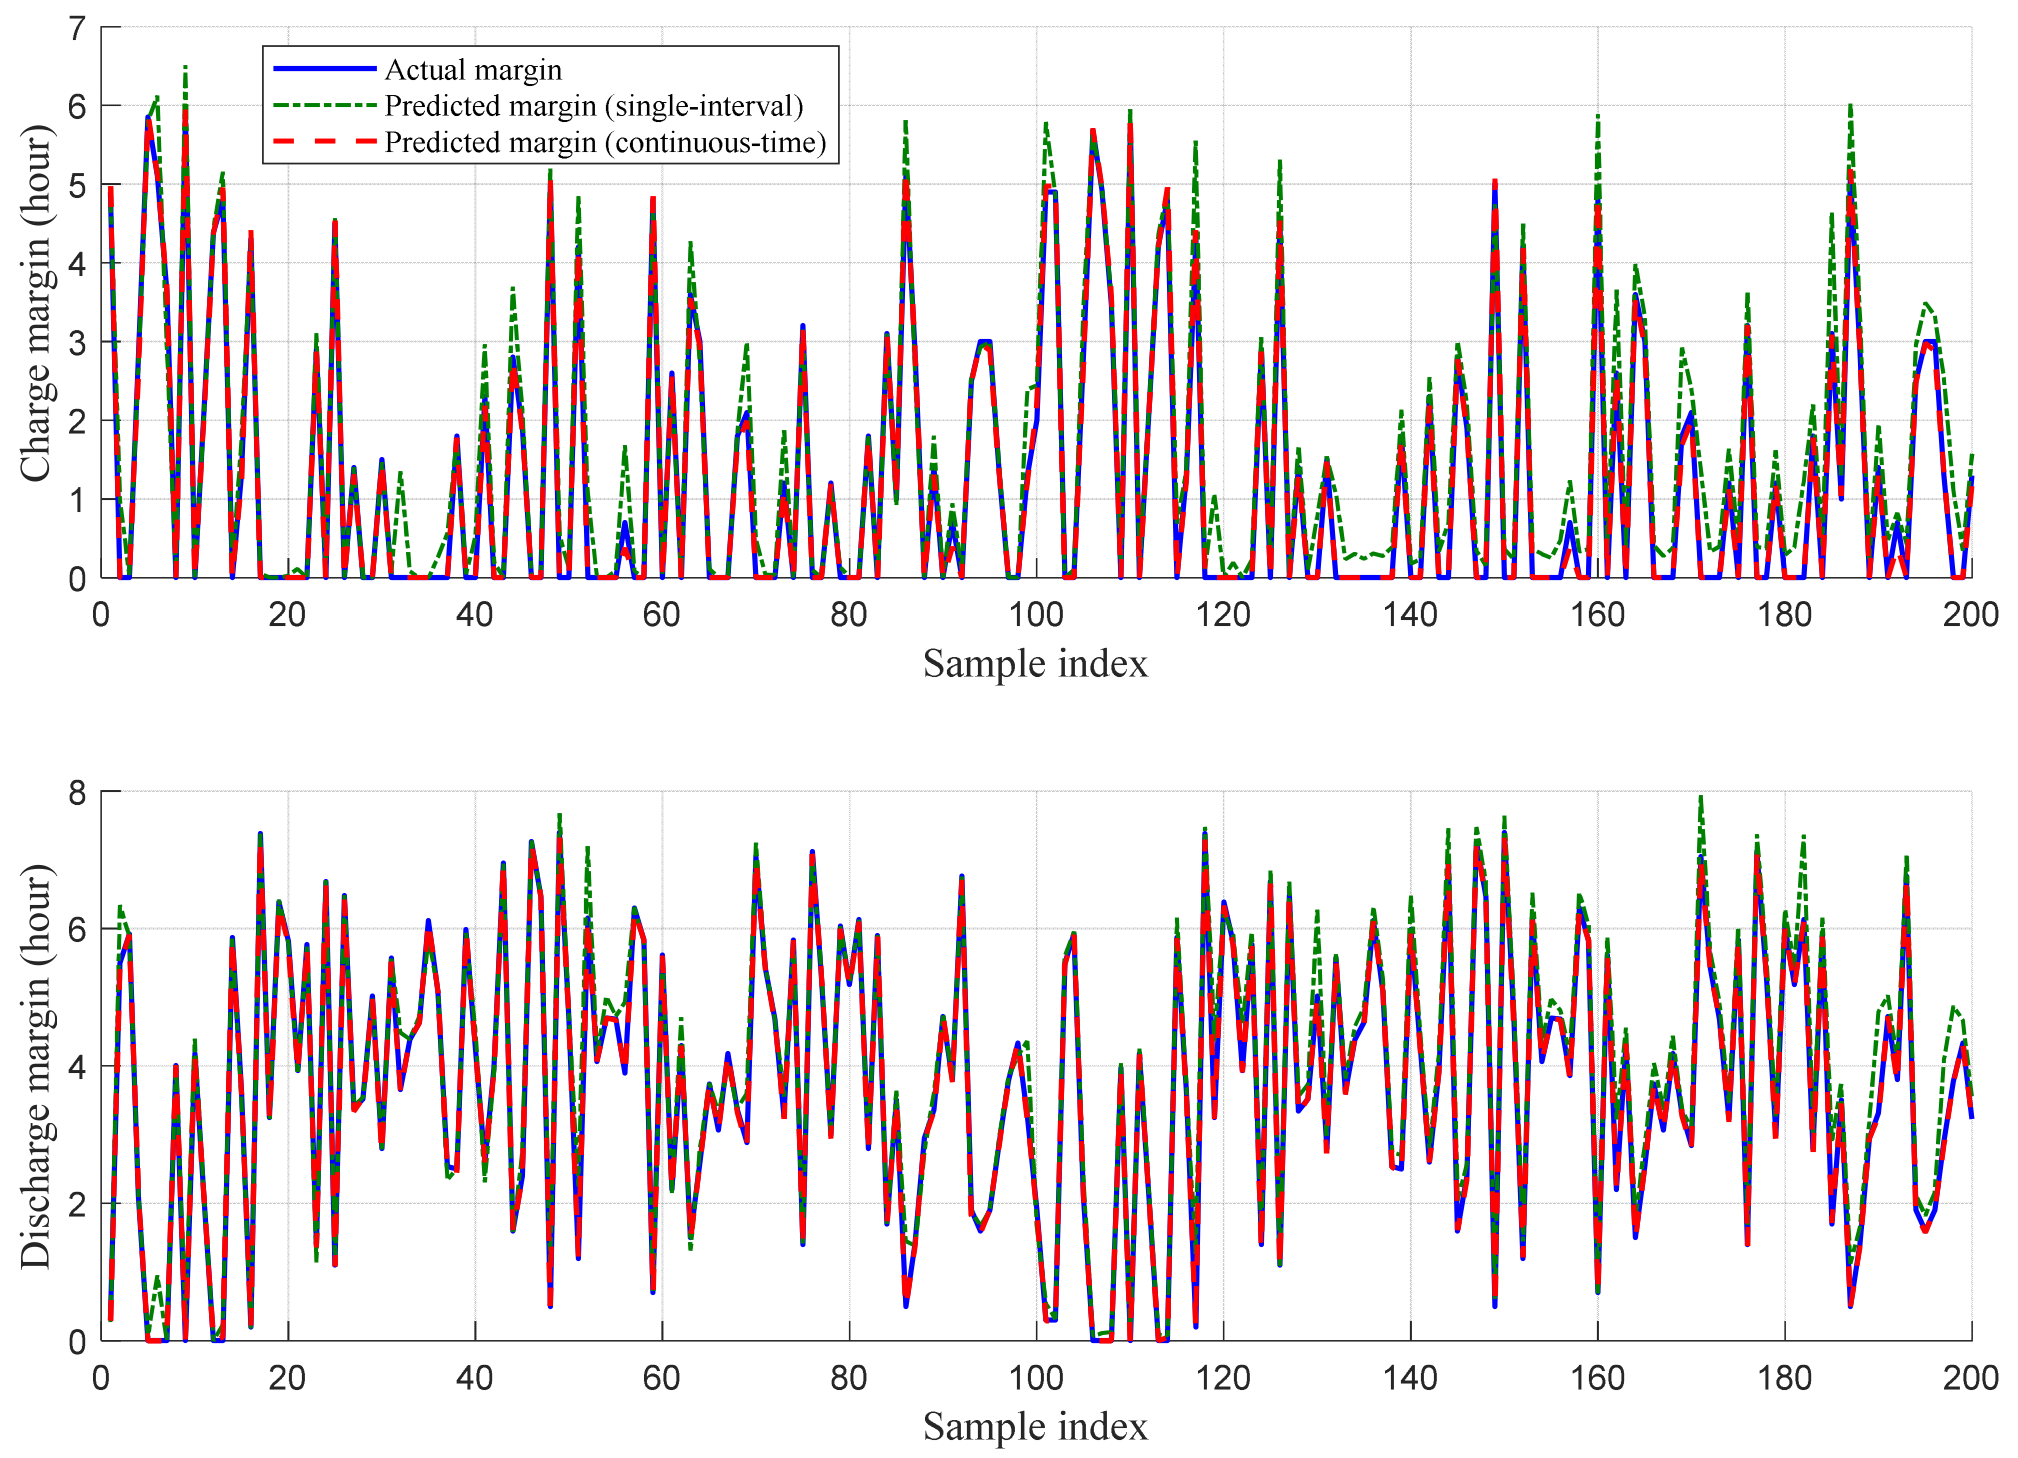
To assess the accuracy of the MLP model in predicting EV charging and discharging margins, the model is trained on a dataset containing 8000 samples generated by the state-driven margin algorithm, and tested on 200 newly generated samples at 15 min intervals. The dataset is randomly split into training and testing sets, with an 8:2 ratio. The network architecture consists of two hidden layers with 64 and 32 neurons, respectively, both using ReLU activation functions. Training is performed using the Adam optimizer with an initial learning rate of 0.01, over 100 epochs with a batch size of 32. Figure 6a illustrates the trade-off between validation error and violation ratio under different λ values. Compared with λ = 0, adopting λ = 1 × 10⁻⁴ reduces the violation ratio significantly, while increasing the validation MSE only marginally, thereby achieving a favorable balance, and thus λ = 1 × 10⁻⁴ is selected. As shown in Figure 6b, both the training and validation losses converge rapidly toward zero, indicating effective model training.
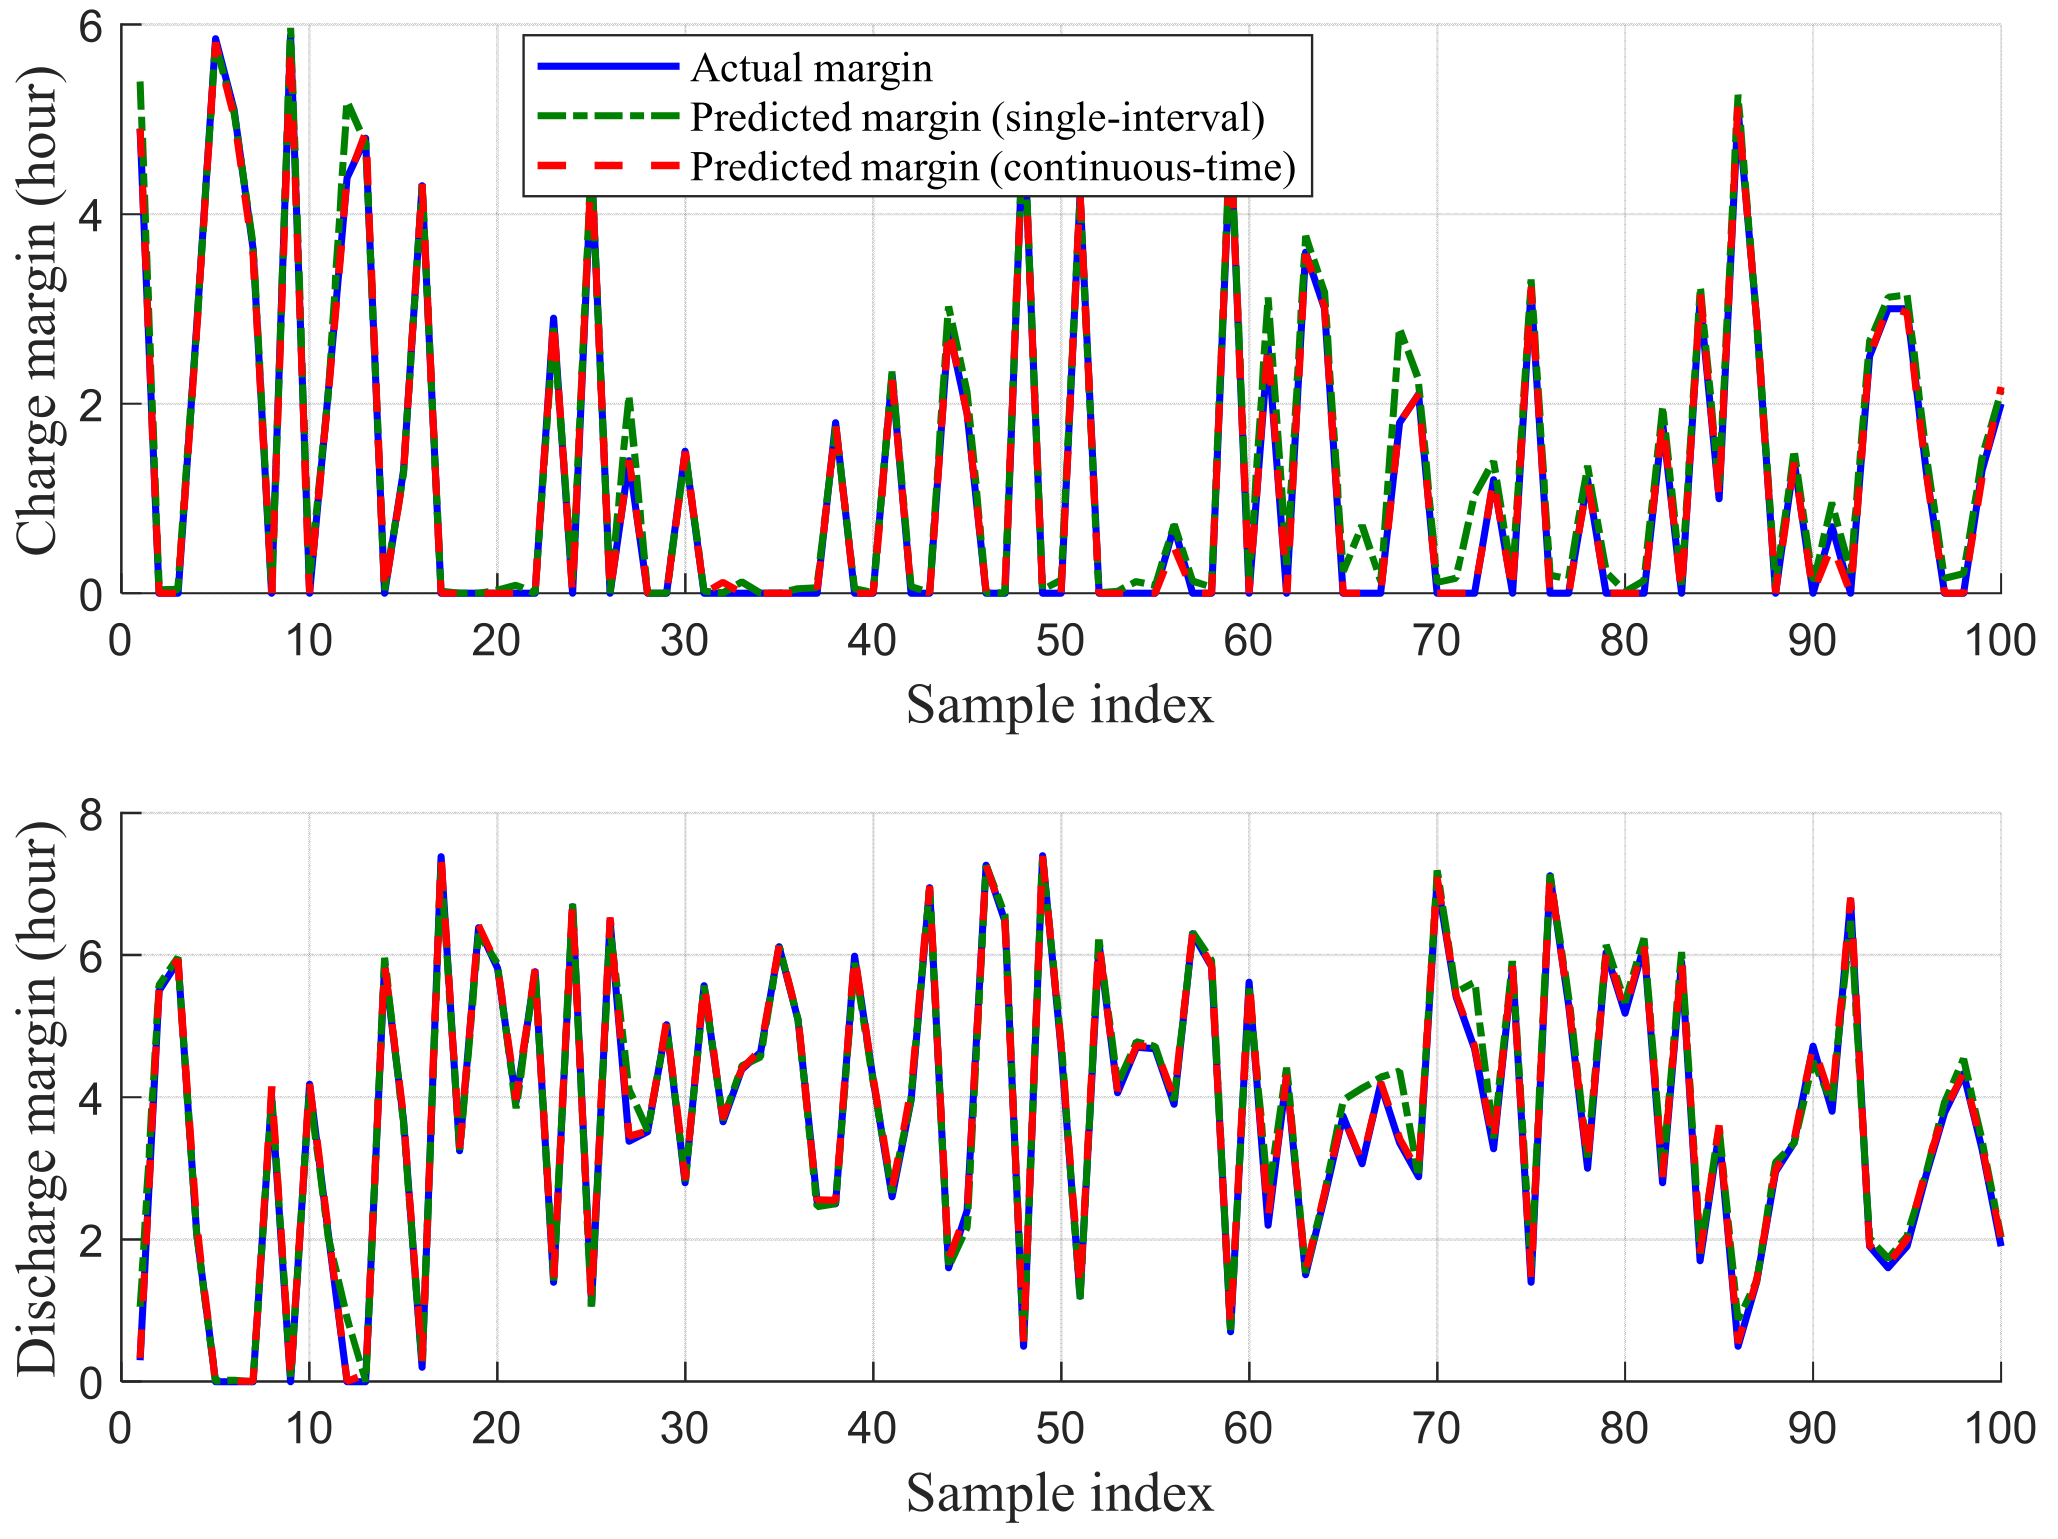
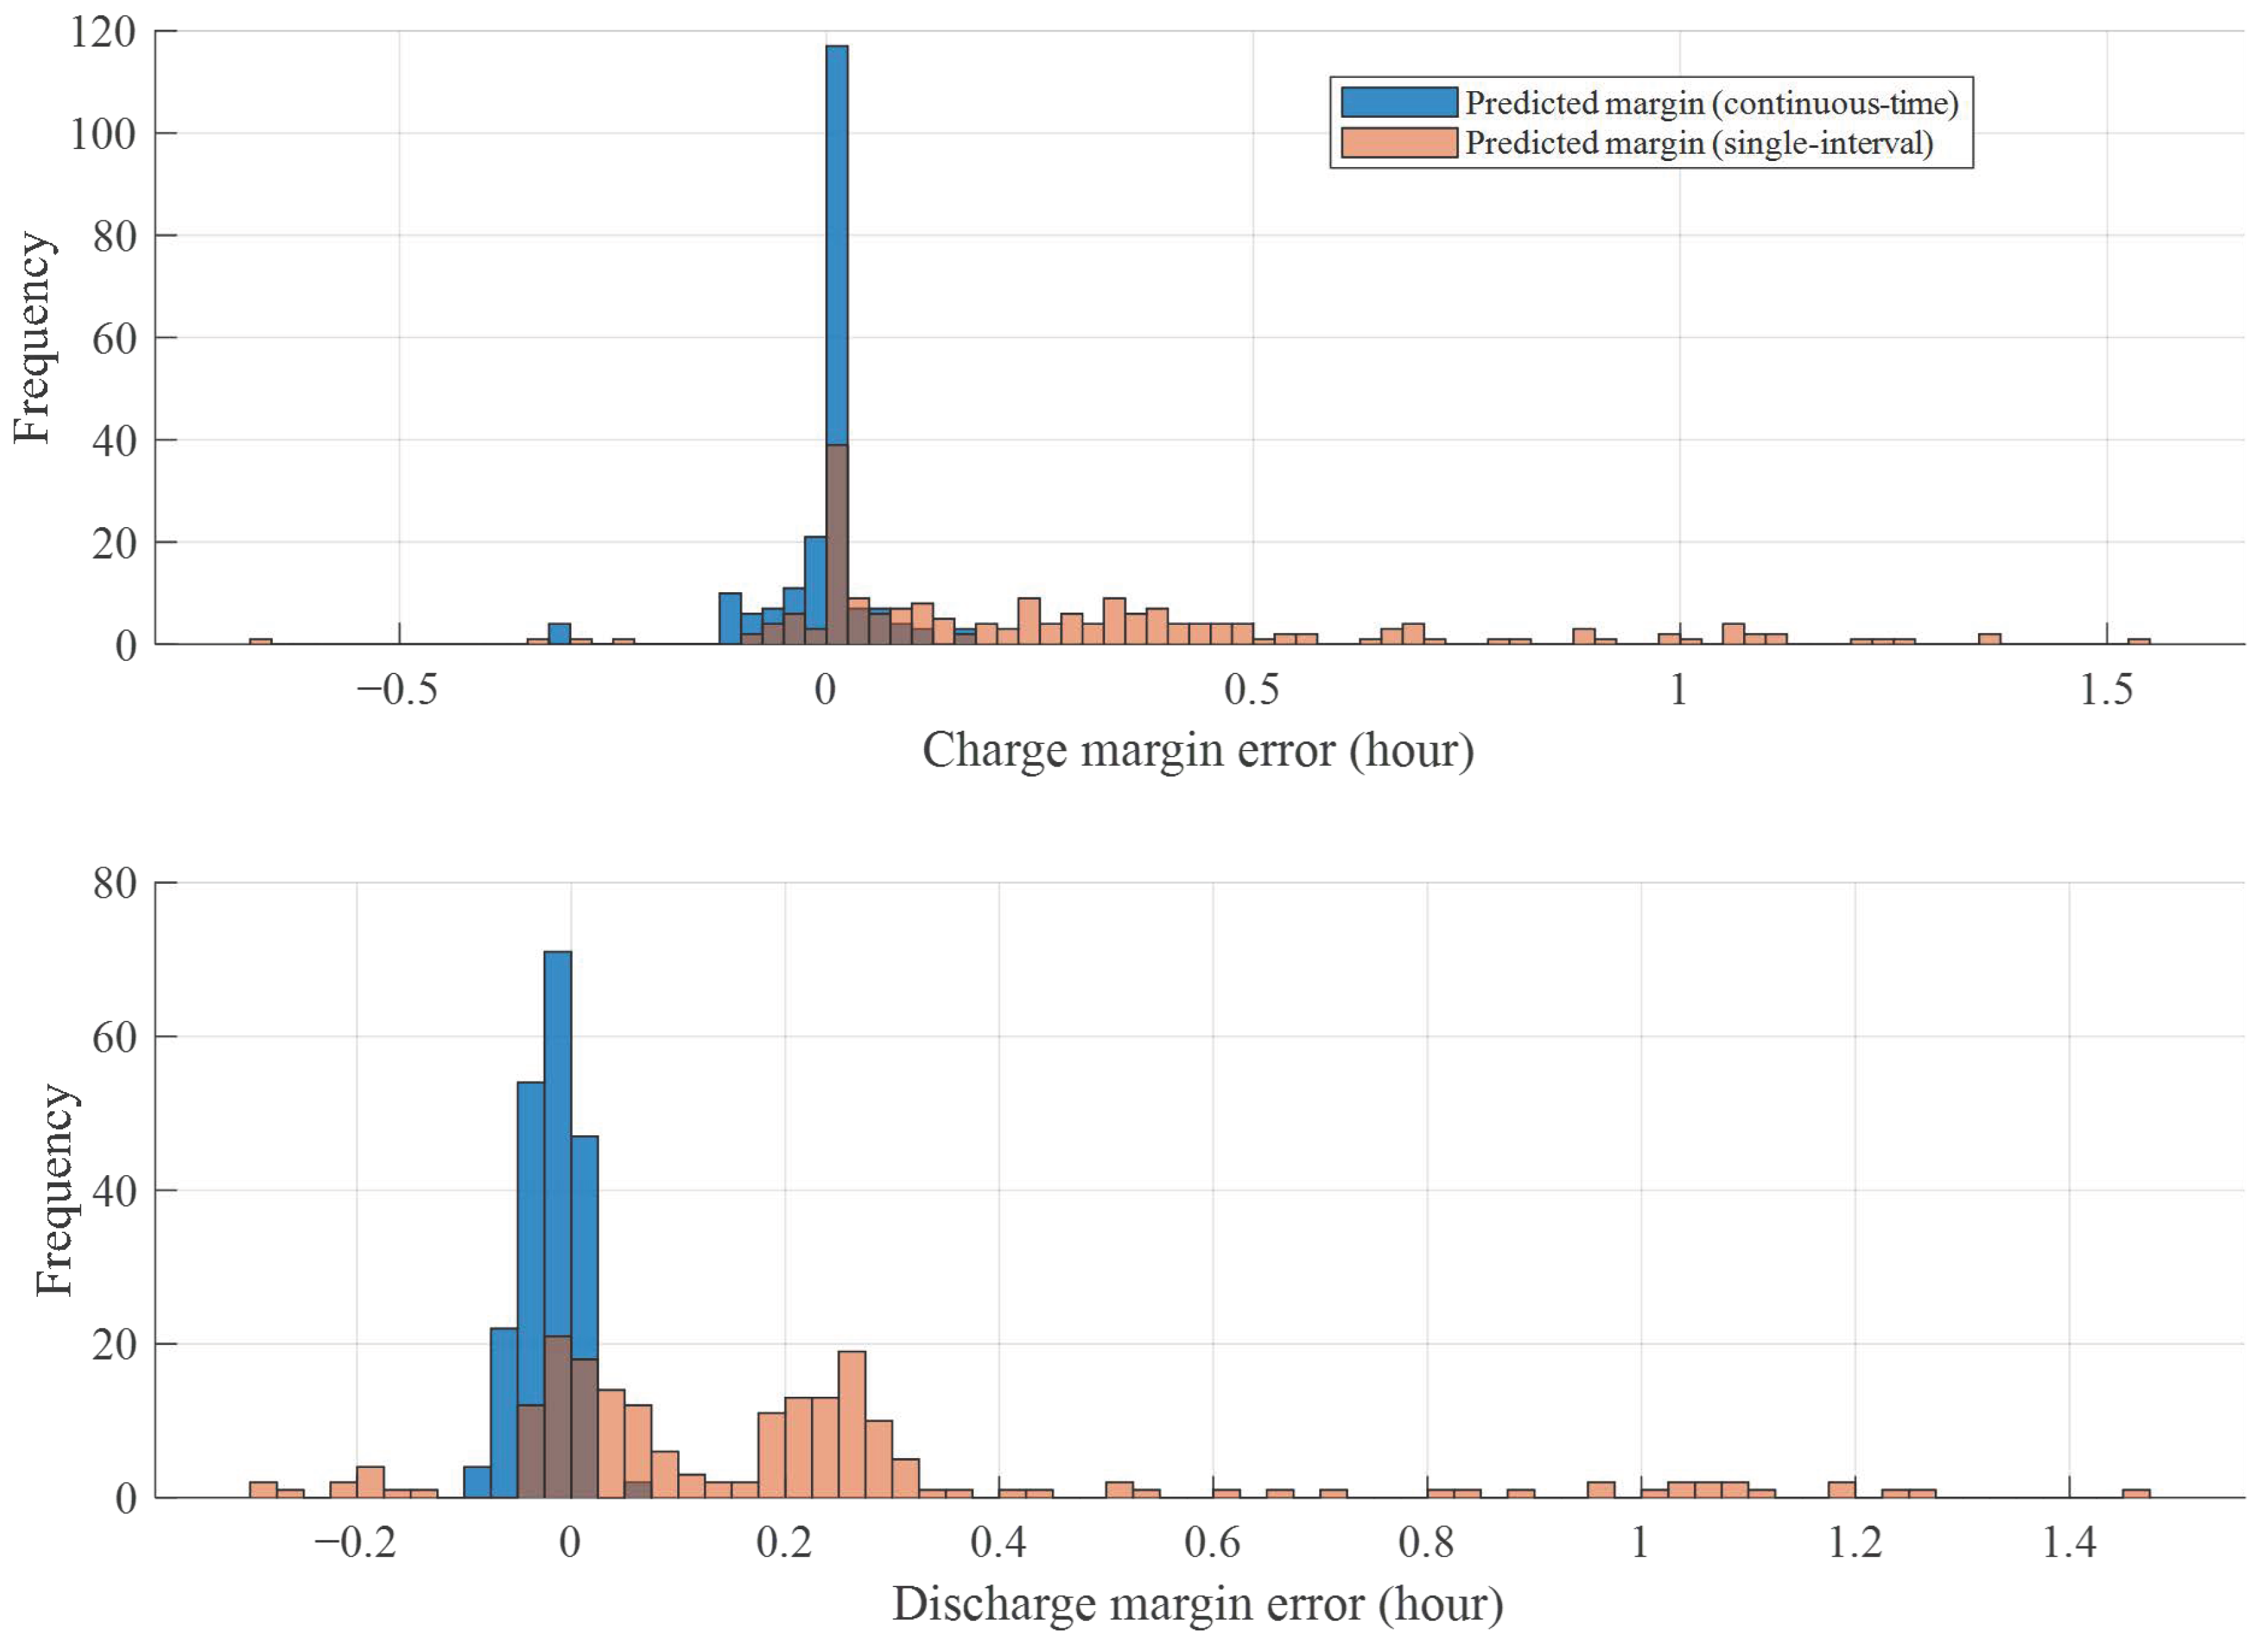
Figure 7 and Figure 8 compare the continuous-time RC evaluation predictions proposed in this paper with both the ground-truth values and a single-interval RC evaluation baseline, which conceptually corresponds to the approach in [15], which only considers single-interval power constraints. The results show that the continuous-time prediction errors are mostly concentrated within ±0.2 h, accurately capturing the nonlinear relationship between EV states and margins. In contrast, the single-interval evaluation exhibits larger dispersion and occasional systematic overestimation, indicating its limited suitability for practical scheduling. At a finer 5 min resolution (Figure 9 and Figure 10), the continuous-time RC evaluation still maintains a mean absolute error below 0.2 h, confirming its suitability for real-time grid scheduling, while the single-interval approach shows significantly larger deviations.
(2)
Scenario 2—Power adjustment-response effect test
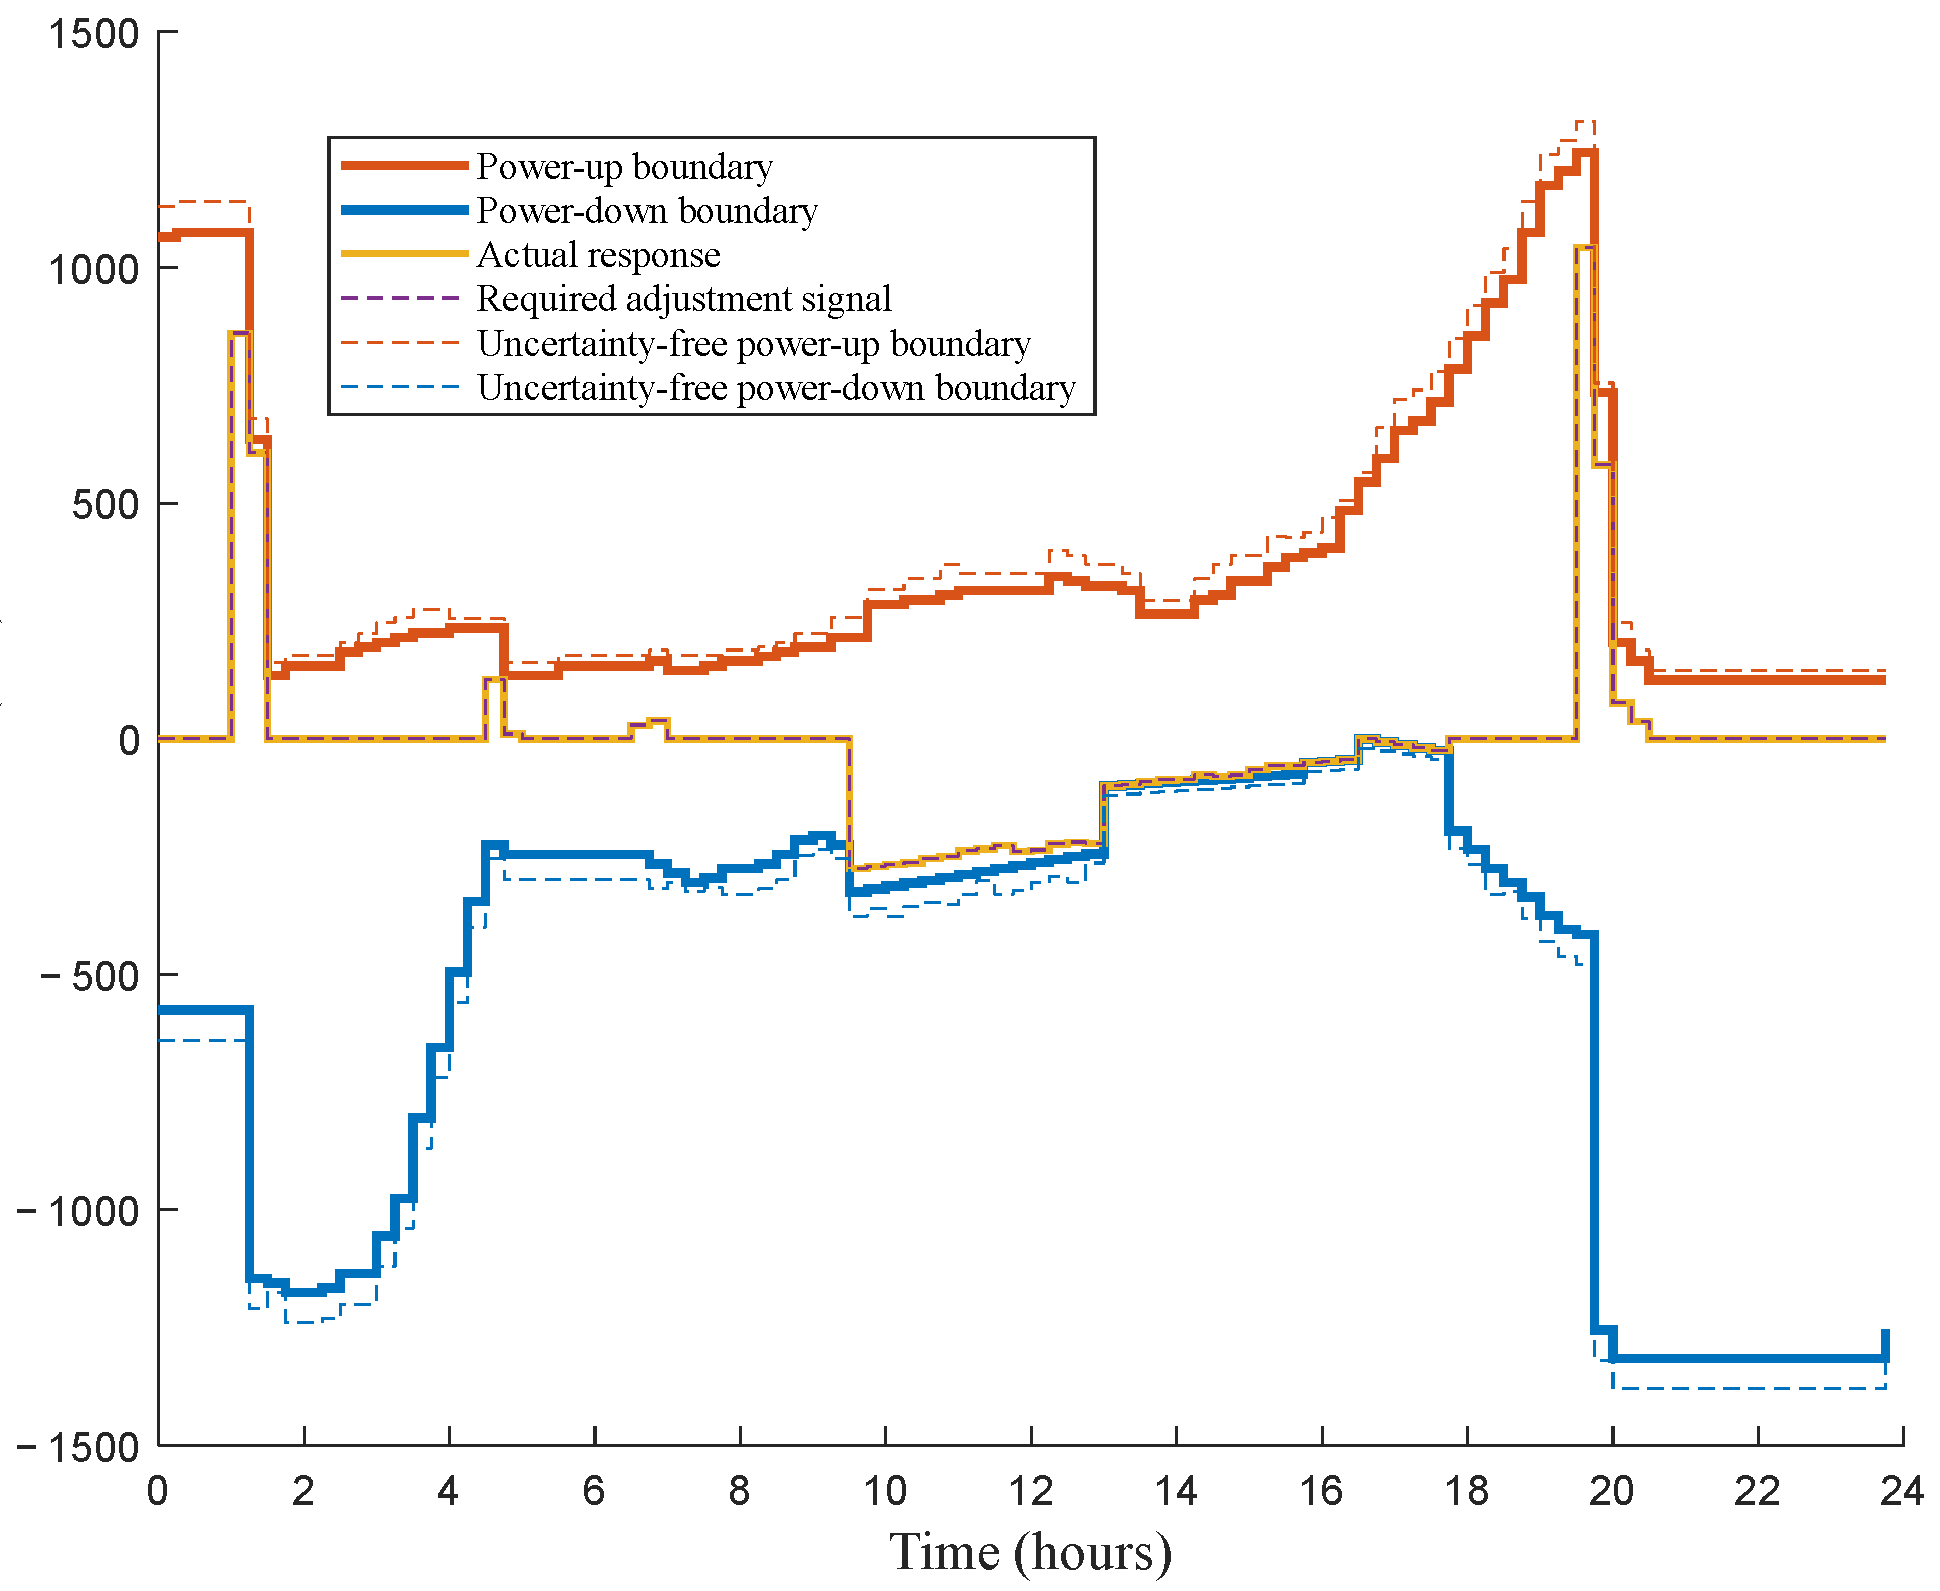
To evaluate the EVCS’s capability to track the grid’s power adjustment signals, a simulation is conducted under dynamic EV availability and uncertain departure conditions. The power adjustment boundaries are conservatively determined, considering EV departure uncertainty.
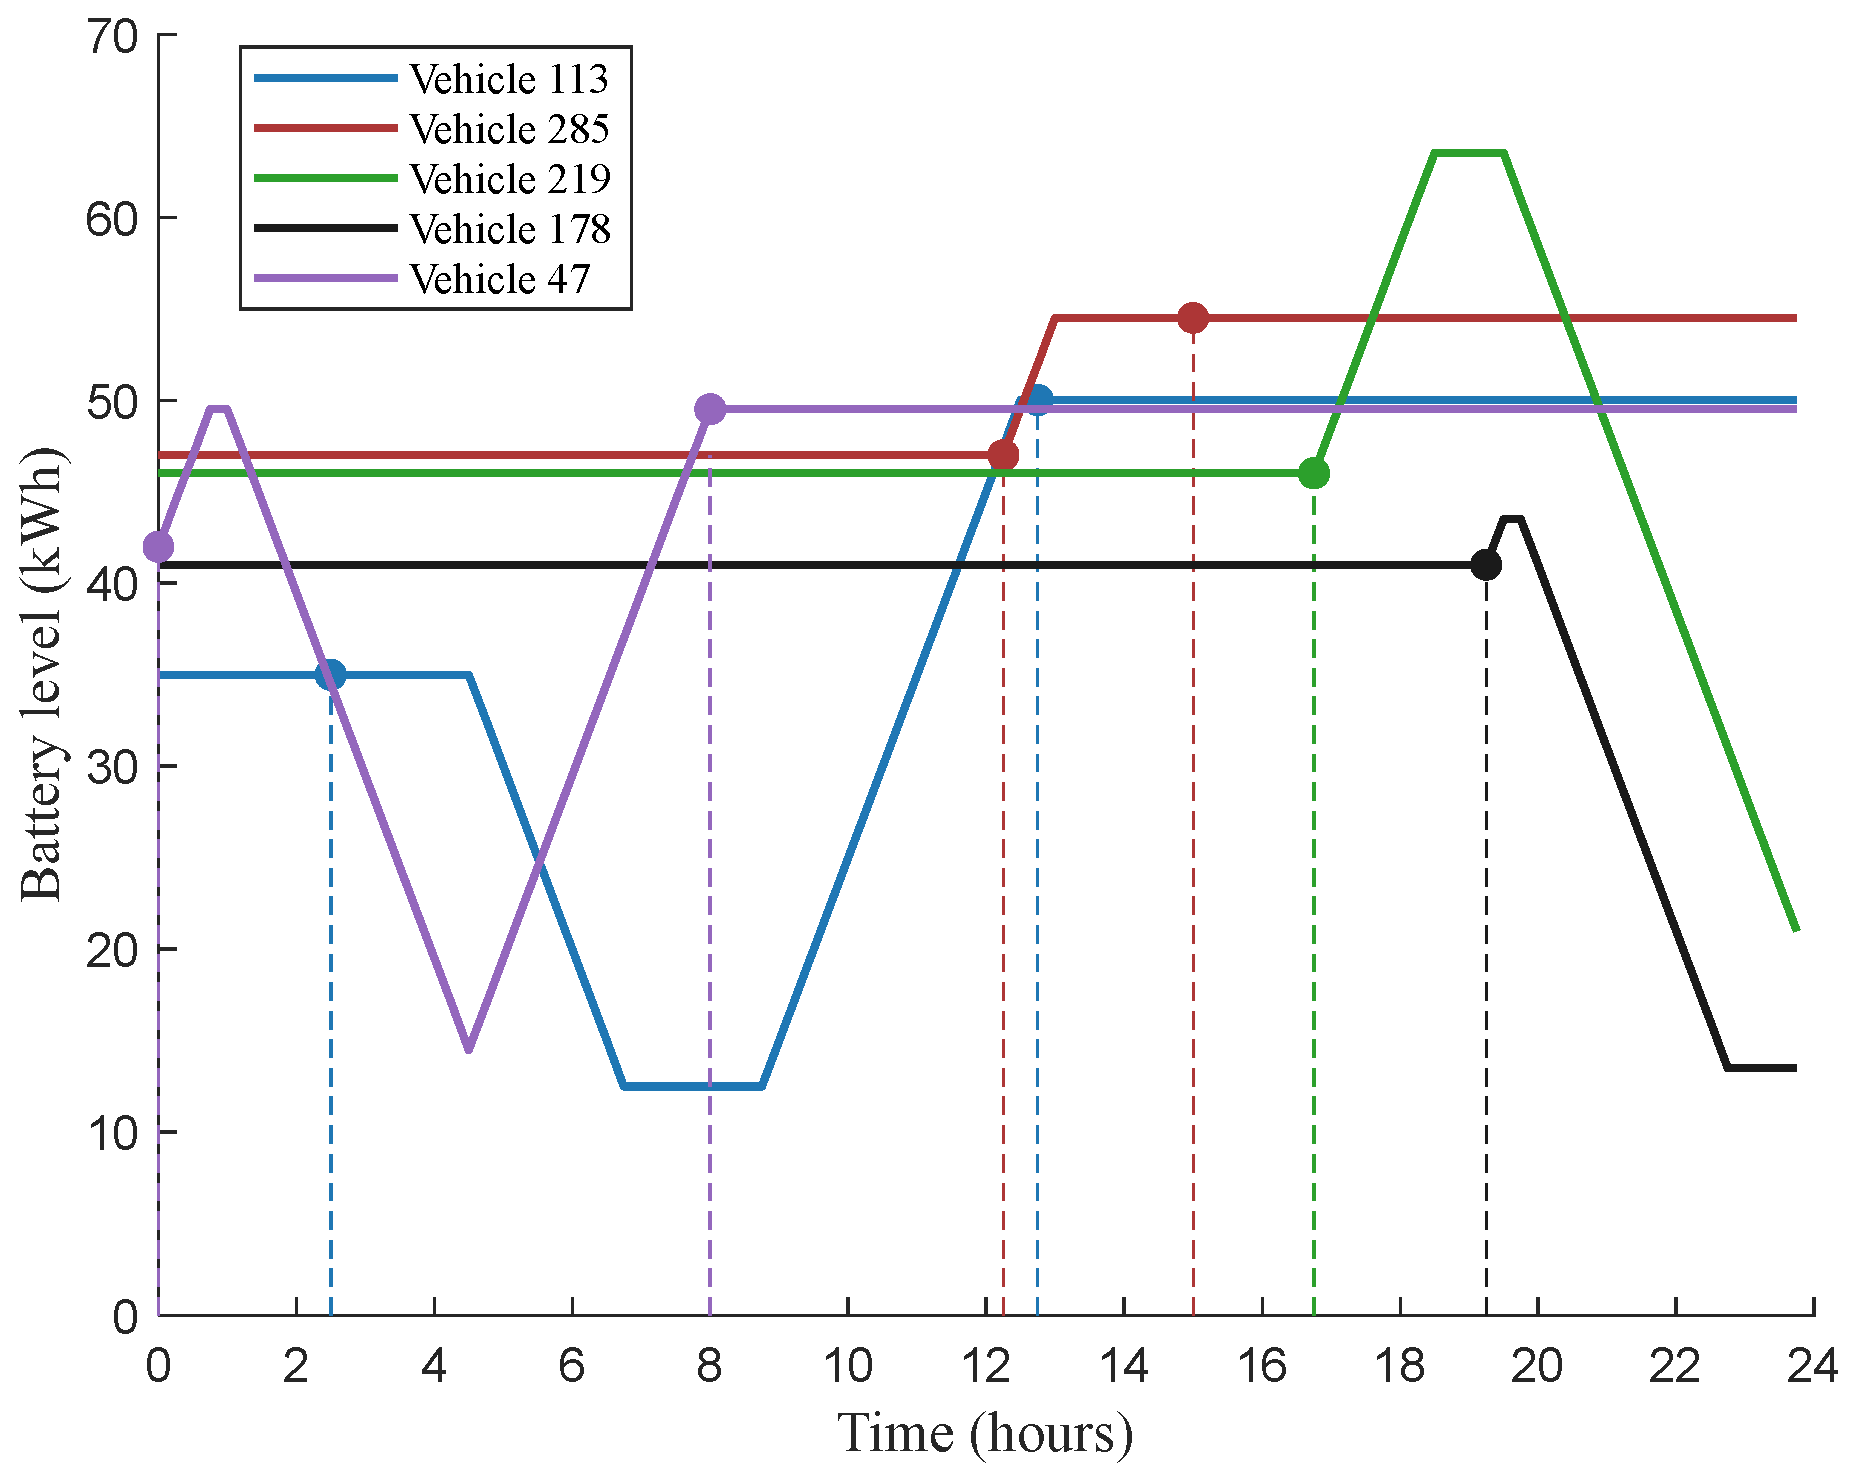
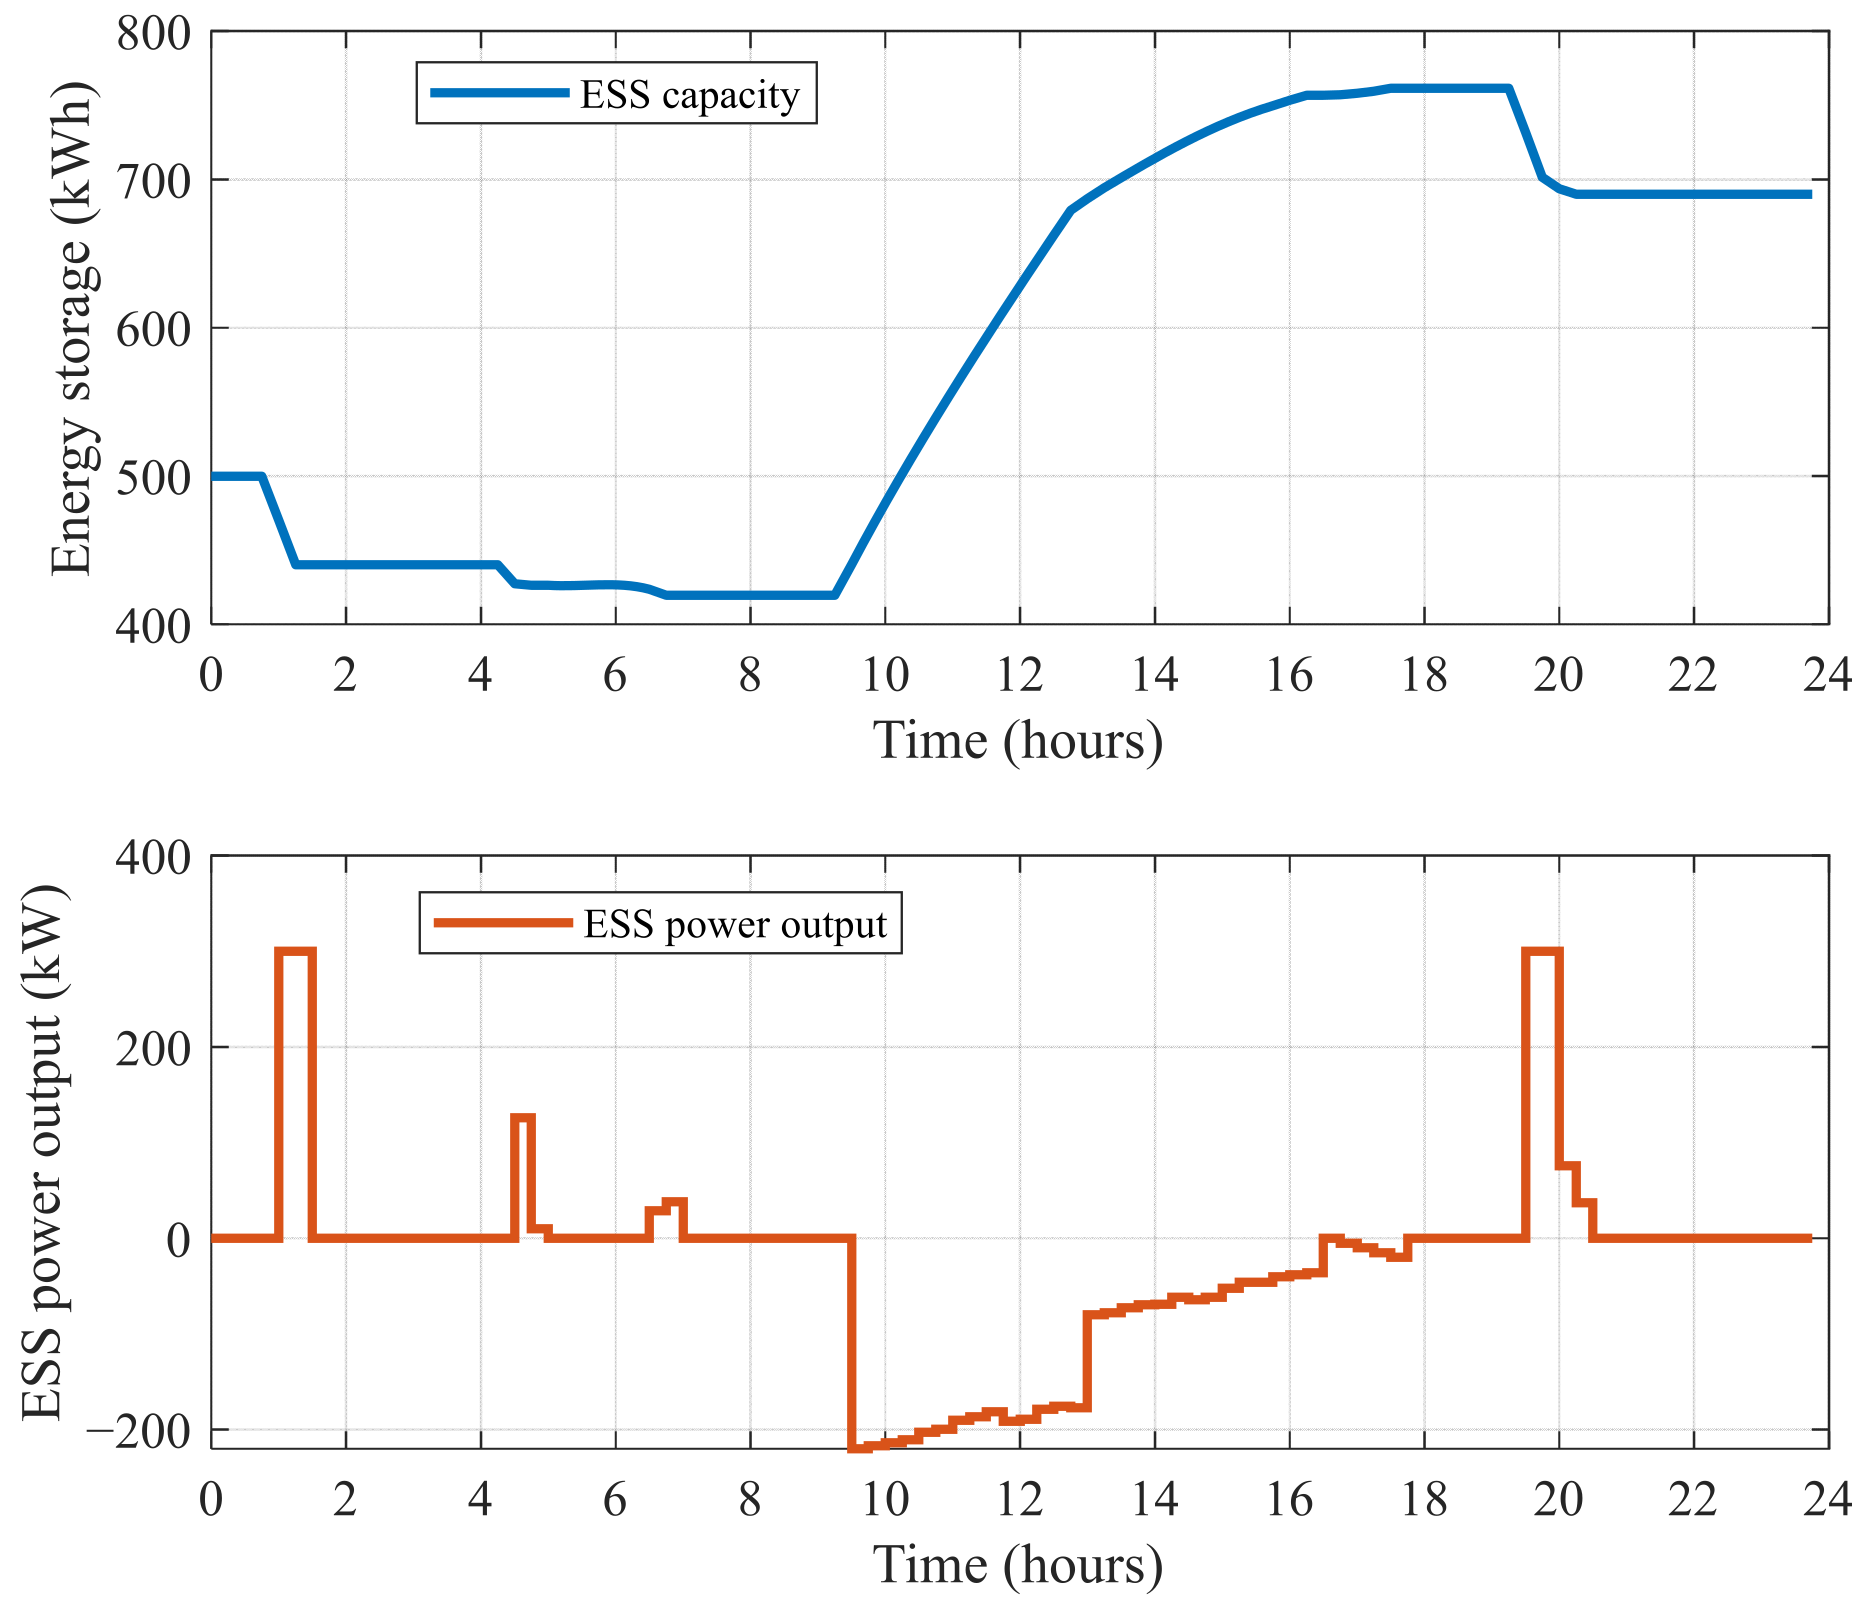
Figure 11 shows the EVCS’s power response boundaries, required adjustment signal, and actual response over a 24 h period. The solid curves represent the power-up and power-down limits, considering EV departure uncertainty, while the dashed curves correspond to boundaries without considering uncertainty. The EVCS actual response closely follows the required signal, and stays within the conservative boundaries. The available RC narrows during daytime commuting hours (08:00–18:00), due to reduced idle EV numbers, and expands at night, when more EVs are idle. Figure 12 shows the energy trajectories of five representative EVs, with markers indicating their grid connection and disconnection times. It highlights how individual EVs dynamically contribute to or withdraw from grid support, based on their stay durations. Figure 13 depicts the charging and discharging behavior of the ESS. The ESS charges during midday, when fewer EVs are available, and discharges at night to enhance grid support during higher demand periods.
(3)
Scenario 3—Voltage control effectiveness test
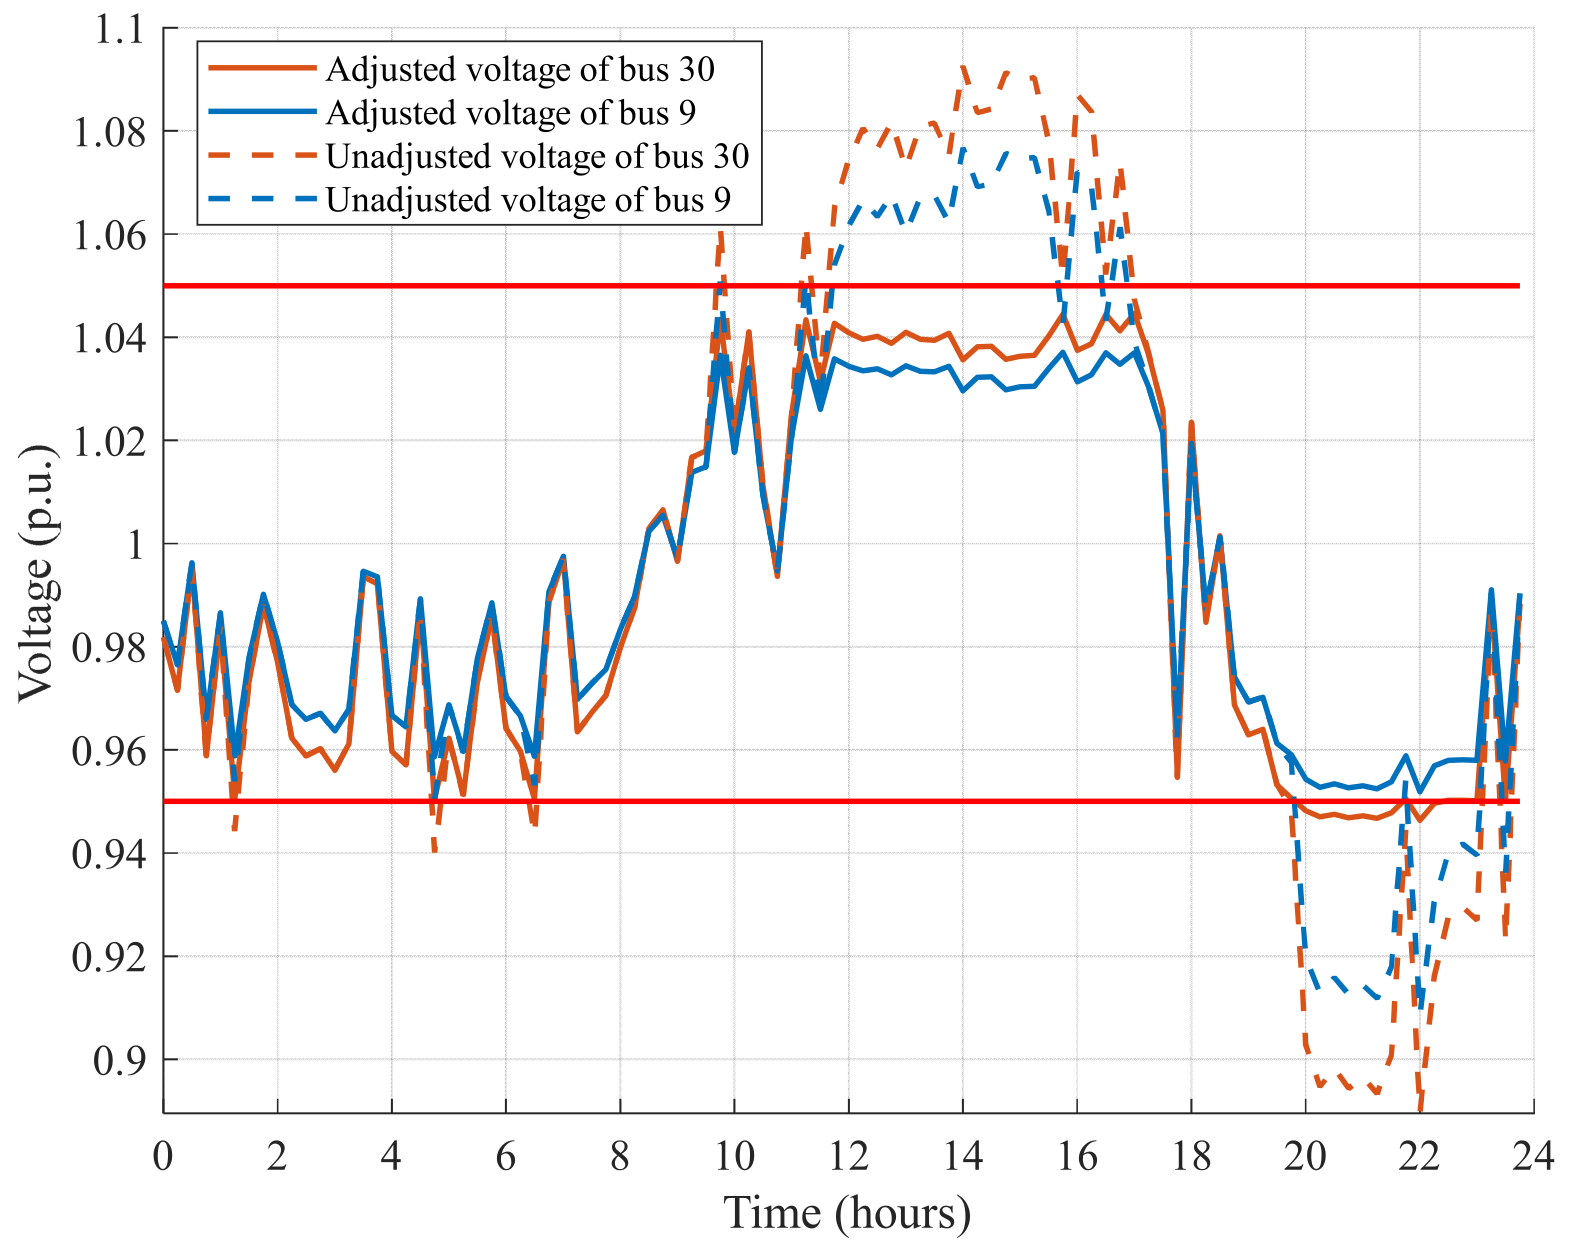
To evaluate the effectiveness of the proposed voltage control strategy, an EVCS and a PV system are installed at each of the buses 9 and 30. Figure 14 illustrates the voltage profiles at these two buses over a 24 h period. The dashed lines represent the voltages without any control measures, where midday PV overgeneration causes over-voltage violations, and evening peak load leads to under-voltage issues. The solid lines show the voltages after applying the proposed control strategy. By dynamically adjusting the charging and discharging behavior of the EVCSs, the bus voltages are effectively maintained within the permissible range of 0.95 to 1.05 p.u., demonstrating the ability of the proposed method to mitigate voltage violations. Table 2 compares the violation duration and voltage-peak reduction at buses 9 and 30 with and without applying the control strategy. As shown in the simulation results, there is a significant reduction in both the violation duration and peak voltage, further confirming the effectiveness of the control strategy.
(4)
Scenario 4—Power allocation efficiency test
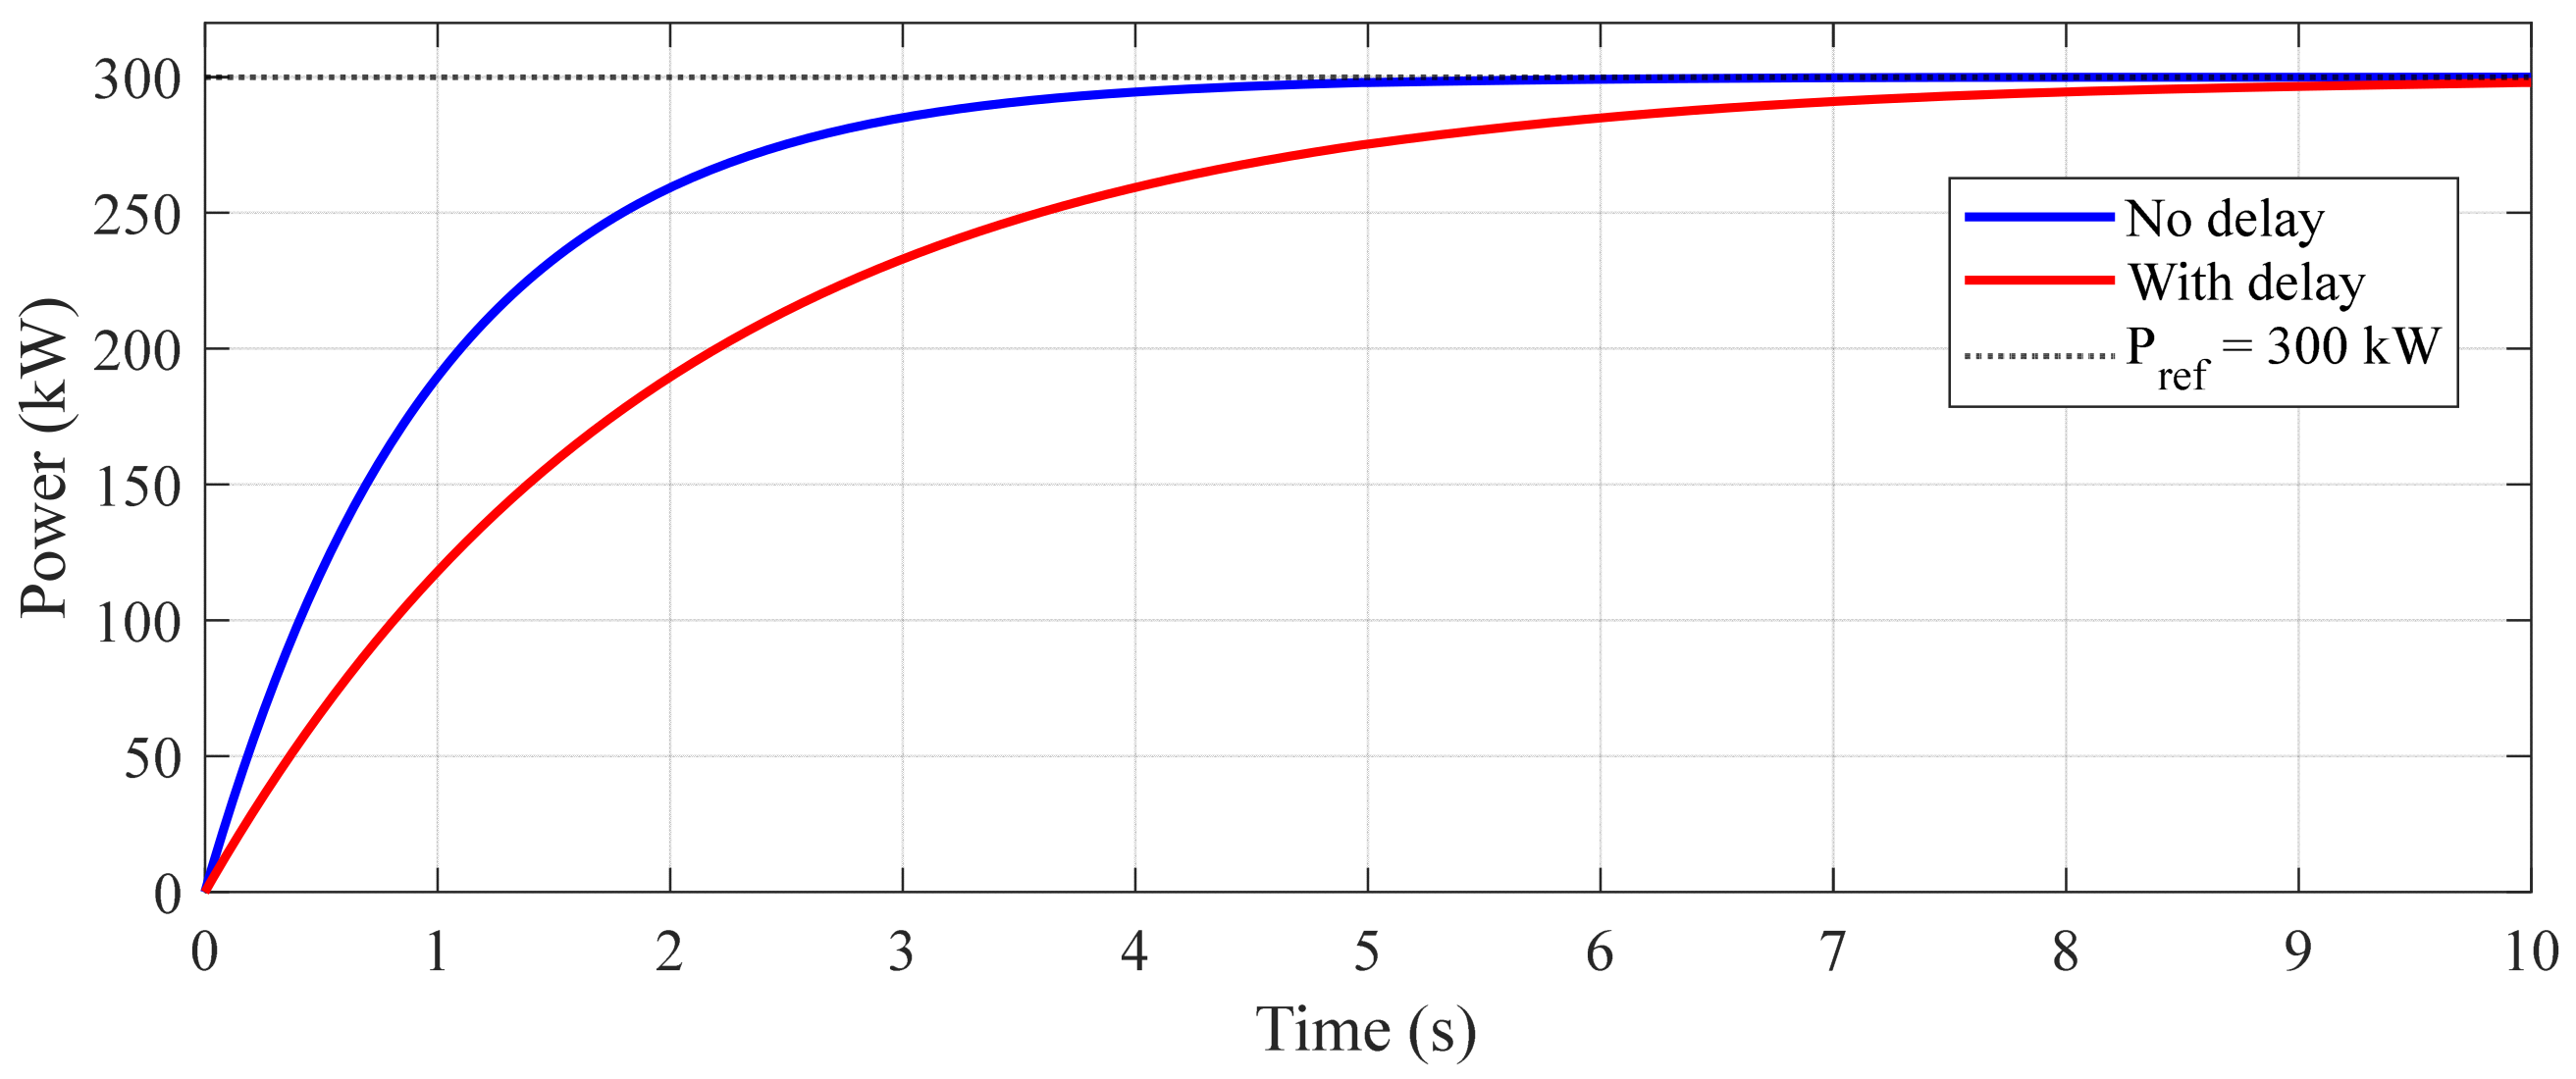
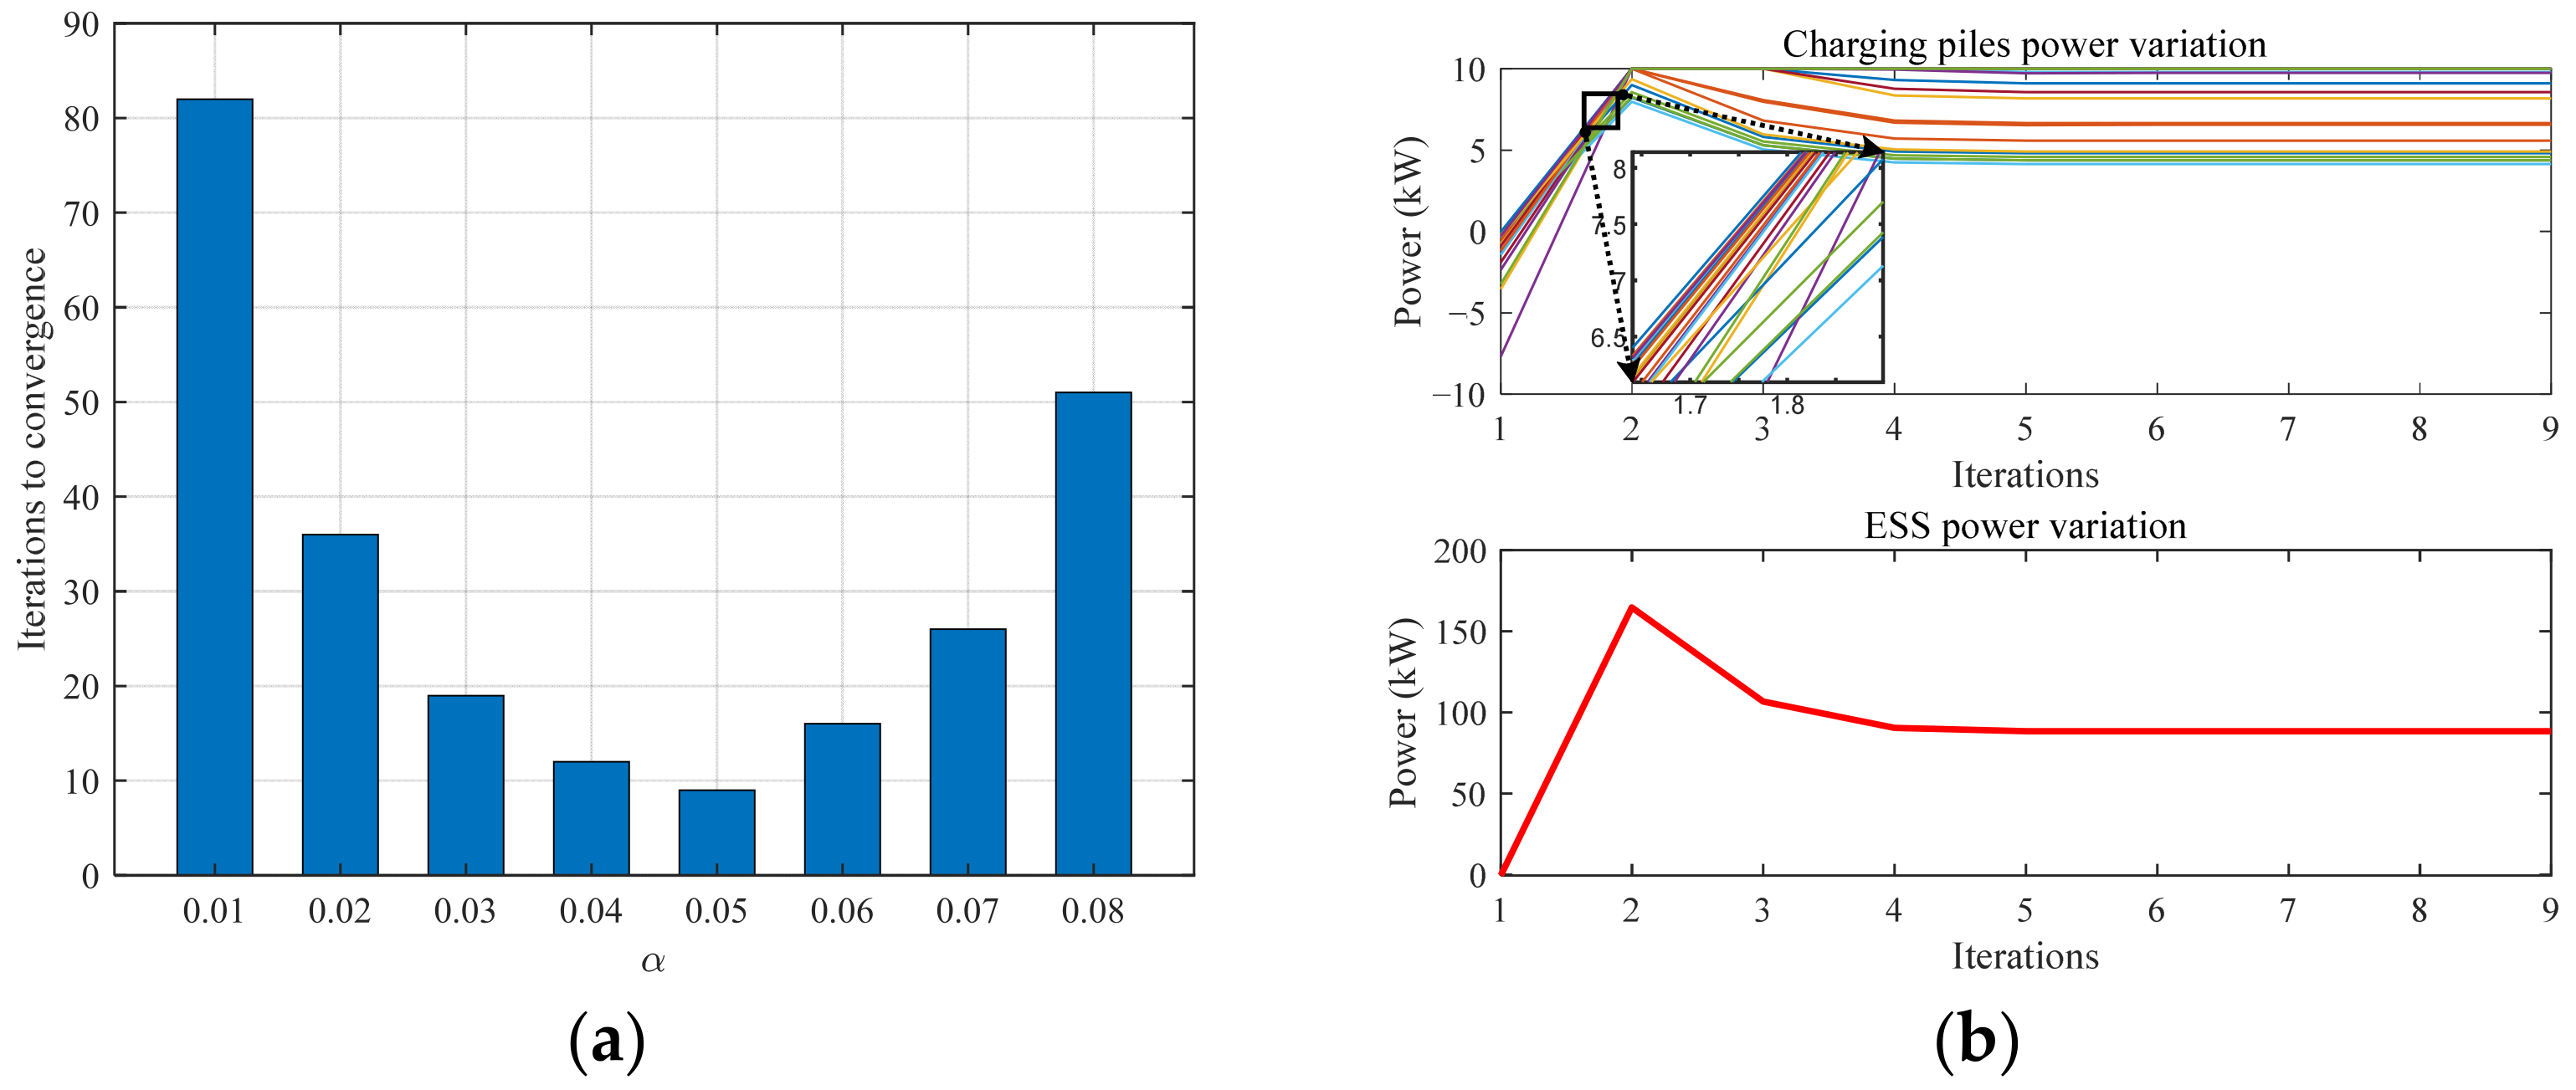
To evaluate the convergence behavior of the broadcast-based power allocation method, a 300 kW power adjustment signal is dispatched to an EVCS composed of 46 controllable charging piles and one ESS. To compare the convergence behavior with and without communication latency, we introduce a random delay distributed within [0, 0.2 s] into the broadcast signals. As illustrated in Figure 15, the presence of delay slows down the convergence process, but the control signals still eventually converge to the target. Figure 16a illustrates the sensitivity analysis under different α values. It can be observed that too-small α results in slow convergence, while too-large α leads to oscillatory behavior. By balancing convergence speed and stability, α = 0.05 is adopted as the step size.
The upper figure in Figure 16b shows the power changes of individual charging piles, while the lower figure depicts the ESS power trajectory. As observed, the power allocations of both charging piles and the ESS converge smoothly, with the majority of the adjustment completed within approximately 10 iterations under a convergence tolerance of 10−6. The results indicate that the proposed broadcast control method can achieve stable and coordinated multi-device power allocation within a small number of iterations. In addition, the broadcast scheme realizes this performance without requiring centralized coordination or intensive communication infrastructure. Compared with conventional centralized scheduling [18], which typically depends on full information exchange and a central optimizer, the proposed broadcast-based method achieves stable allocation with lightweight communication.

5. Conclusions

In this paper, a voltage control strategy tailored for ADNs is proposed. A state-driven margin algorithm and an MLP model are used to predict the RC of EVCSs in real time. To handle uncertainties from random EV departures, an RVM-based model refines the predicted boundaries with confidence intervals. These dynamic, uncertainty-aware boundaries are integrated into an SOCP-based voltage regulation framework, and a broadcast control scheme allocates dispatch signals among EVs and the ESS within each station.
Case studies on the IEEE 34-bus system demonstrate that the proposed approach does the following: (1) accurately predicts the EVCS’s available charging and discharging flexibility; (2) ensures reliable tracking of grid regulation signals, even under uncertain EV behavior; (3) effectively mitigates voltage violations; and (4) achieves efficient multi-device power allocation with few iterations. Future work will focus on extending the framework to large-scale, heterogeneous EVCS scenarios, incorporating electricity pricing signals to further enhance economic performance and grid support capabilities, and explicitly considering long-term ESS degradation effects.

Author Contributions

C.L.: methodology, writing—original draft. K.X.: conceptualization, software, writing—review and editing. W.X.: investigation, supervision, writing—review and editing. F.S.: data curation. X.H.: formal analysis. Z.T.: data curation. All authors have read and agreed to the published version of the manuscript.

Funding

This work was supported by the Science and Technology Project of State Grid Sichuan Electric Power Company “Research on Edge Operation Control Strategies and Optimal Allocation Technologies for Integrated Photovoltaic-Storage-Charging Systems in Distribution Network Transformer Areas” (No. 521996240007).

Data Availability Statement

The original contributions presented in this study are included in the article. Further inquiries can be directed to the corresponding author.

Acknowledgments

The authors would like to acknowledge the support provided by the State Grid Sichuan Electric Power Company.

Conflicts of Interest

Authors Chang Liu, Ke Xu, Weiting Xu, Fan Shao and Xingqi He were employed by the company State Grid Sichuan Electric Power Company. The remaining author declares that the research was conducted in the absence of any commercial or financial relationships that could be construed as a potential conflict of interest.

References

  1. Wang, S.; Bi, S.; Zhang, Y.J.A.; Huang, J. Electrical vehicle charging station profit maximization: Admission, pricing, and online scheduling. IEEE Trans. Sustain. Energy 2018, 9, 1722–1731. [Google Scholar] [CrossRef]
  2. Rahman, M.M.; Al-Ammar, E.A.; Das, H.S.; Ko, W. Comprehensive impact analysis of electric vehicle charging scheduling on load-duration curve. Comput. Electr. Eng. 2020, 85, 106673. [Google Scholar] [CrossRef]
  3. Chaudhari, K.; Ukil, A.; Kumar, K.N.; Manandhar, U.; Kollimalla, S.K. Hybrid optimization for economic deployment of ESS in PV-integrated EV charging stations. IEEE Trans. Ind. Inform. 2017, 14, 106–116. [Google Scholar] [CrossRef]
  4. Bletterie, B.; Kadam, S.; Bolgaryn, R.; Zegers, A. Voltage control with PV inverters in low voltage networks—In depth analysis of different concepts and parameterization criteria. IEEE Trans. Power Syst. 2016, 32, 177–185. [Google Scholar] [CrossRef]
  5. Un-Noor, F.; Padmanaban, S.; Mihet-Popa, L.; Mollah, M.N.; Hossain, E. A comprehensive study of key electric vehicle (EV) components, technologies, challenges, impacts, and future direction of development. Energies 2017, 10, 1217. [Google Scholar] [CrossRef]
  6. Huang, Z.; Fang, B.; Deng, J. Multi-objective optimization strategy for distribution network considering V2G-enabled electric vehicles in building integrated energy system. Prot. Control Mod. Power Syst. 2020, 5, 7. [Google Scholar] [CrossRef]
  7. Mojumder, M.R.H.; Ahmed Antara, F.; Hasanuzzaman, M.; Alamri, B.; Alsharef, M. Electric vehicle-to-grid (V2G) technologies: Impact on the power grid and battery. Sustainability 2022, 14, 13856. [Google Scholar] [CrossRef]
  8. Wu, J.; Xue, Y.; Xie, D.; Yue, D.; Wen, F.; Zhao, J. Evaluation and simulation analysis of reserve capability for electric vehicles. Autom. Electr. Power Syst. 2018, 42, 101–107. [Google Scholar]
  9. Zhang, H.; Hu, Z.; Xu, Z.; Song, Y. Evaluation of achievable vehicle-to-grid capacity using aggregate PEV model. IEEE Trans. Power Syst. 2016, 32, 784–794. [Google Scholar] [CrossRef]
  10. Wang, M.; Mu, Y.; Jia, H.; Wu, J.; Yu, X.; Qi, Y. Active power regulation for large-scale wind farms through an efficient power plant model of electric vehicles. Appl. Energy 2017, 185, 1673–1683. [Google Scholar] [CrossRef]
  11. Verma, A.; Asadi, A.; Yang, K.; Tyagi, S. A data-driven approach to identify households with plug-in electrical vehicles (PEVs). Appl. Energy 2015, 160, 71–79. [Google Scholar] [CrossRef]
  12. Xu, X.; Li, K.; Wang, F.; Mi, Z.; Jia, Y.; Wei, W.; Jing, Y. Evaluating multitimescale response capability of EV aggregator considering users’ willingness. IEEE Trans. Ind. Appl. 2021, 57, 3366–3376. [Google Scholar] [CrossRef]
  13. Liu, H.; Lian, H.; Ge, S. Timing response capability model of electric vehicle battery swapping station and strategy formulation of charging plan. Autom. Electron. Power Syst. 2017, 41, 91–97. [Google Scholar]
  14. Xu, X.; Mi, Z.; Zhan, Z.; Ji, L. Response capability evaluation model of electric vehicle aggregator based on evolutionary game and response anticipation. Front. Energy Res. 2023, 11, 1225327. [Google Scholar]
  15. Thran, J.; Marecek, J.; Shorten, R.N.; Green, T.C. Reserve Provision from Electric Vehicles: Aggregate Boundaries and Stochastic Model Predictive Control. IEEE Trans. Power Syst. 2025, 40, 4081–4092. [Google Scholar] [CrossRef]
  16. Zhang, Y.; Mu, Y.; Jia, H.; Wang, M.; Zhou, Y.; Xu, Z. Response capability evaluation model with multiple time scales for electric vehicle virtual power plant. Autom. Electr. Power Syst. 2019, 43, 94–103. [Google Scholar]
  17. Zhang, K.; Xu, Y.; Sun, H. Joint chance-constrained program based electric vehicles optimal dispatching strategy considering drivers’ response uncertainty. Appl. Energy 2024, 356, 122313. [Google Scholar] [CrossRef]
  18. González-Garrido, A.; González-Pérez, M.; Asensio, F.J.; Cortes-Borray, A.F.; Santos-Mugica, M.; Vicente-Figueirido, I. Hierarchical control for collaborative electric vehicle charging to alleviate network congestion and enhance EV hosting in constrained distribution networks. Renew. Energy 2024, 230, 120823. [Google Scholar] [CrossRef]
  19. Alaee, P.; Shao, J.; Bemš, J.; Guerrero, J.M. Coordinated routing optimization and charging scheduling in a multiple-charging station system: A strategic bilevel multi-objective programming. Sustain. Energy Grids Netw. 2025, 42, 101659. [Google Scholar] [CrossRef]
  20. Baran, M.; Wu, F.F. Optimal sizing of capacitors placed on a radial distribution system. IEEE Trans. Power Deliv. 2002, 4, 735–743. [Google Scholar] [CrossRef]
  21. Li, T.; Tao, S.; He, K.; Lu, M.; Xie, B.; Yang, B.; Sun, Y. V2G multi-objective dispatching optimization strategy based on user behavior model. Front. Energy Res. 2021, 9, 739527. [Google Scholar] [CrossRef]
  22. Wang, M.; Mu, Y.; Jiang, T.; Jia, H.; Li, X.; Hou, K.; Wang, T. Load curve smoothing strategy based on unified state model of different demand side resources. J. Mod. Power Syst. Clean Energy 2018, 6, 540–554. [Google Scholar] [CrossRef]
  23. Dörfler, F.; Grammatico, S. Gather-and-broadcast frequency control in power systems. Automatica 2017, 79, 296–305. [Google Scholar] [CrossRef]
  24. Chen, L.; Li, N.; Low, S.H.; Doyle, J.C. Two market models for demand response in power networks. In Proceedings of the 2010 First IEEE International Conference on Smart Grid Communications, Gaithersburg, MD, USA, 4–6 October 2010; IEEE: Piscataway, NJ, USA, 2010. [Google Scholar]
  25. Sun, B.; Huang, Z.; Tan, X.; Tsang, D.H. Optimal scheduling for electric vehicle charging with discrete charging levels in distribution grid. IEEE Trans. Smart Grid 2016, 9, 624–634. [Google Scholar] [CrossRef]
  26. Bahramirad, S.; Reder, W.; Khodaei, A. Reliability-constrained optimal sizing of energy storage system in a microgrid. IEEE Trans. Smart Grid 2012, 3, 2056–2062. [Google Scholar] [CrossRef]
  27. IEEE PES Distribution Test Feeder. IEEE PES Distribution System Analysis Subcommittee Resources. 2017. Available online: https://cmte.ieee.org/pes-testfeeders/resources/ (accessed on 8 May 2025).
Figure 1. Overview of the framework.
Electronics 14 03591 g001
Figure 2. Maximum controllable charging and discharging area of a single EV.
Electronics 14 03591 g002
Figure 3. Response process decomposition of a single EV.
Electronics 14 03591 g003
Figure 4. IEEE 34-bus test system.
Electronics 14 03591 g004
Figure 5. The PV power and active-load profile within one day.
Electronics 14 03591 g005
Figure 6. Training process and sensitivity analysis results. (a) Trade-off between validation MSE and violation ratio under different λ values; (b) convergence of training and validation losses.
Electronics 14 03591 g006
Figure 7. Comparison of true margins, multi-interval predicted margins, and single-interval predicted margins at 15 min scale.
Electronics 14 03591 g007
Figure 8. Error distributions of multi-interval and single-interval predicted margins at 15 min scale.
Electronics 14 03591 g008
Figure 9. Comparison of true margins, multi-interval predicted margins, and single-interval predicted margins at 5 min scale.
Electronics 14 03591 g009
Figure 10. Error distributions of multi-interval and single-interval predicted margins at 5 min scale.
Electronics 14 03591 g010
Figure 11. Response results of system dispatch with participation of EVCS.
Electronics 14 03591 g011
Figure 12. Selected EVs’ power change.
Electronics 14 03591 g012
Figure 13. ESS output change.
Electronics 14 03591 g013
Figure 14. Voltage-regulation effect profile. The red lines indicate the upper and lower bounds of the permissible voltage range.
Electronics 14 03591 g014
Figure 15. Convergence of broadcast-based power allocation with and without communication latency.
Electronics 14 03591 g015
Figure 16. Power allocation using broadcast control method. (a) Sensitivity analysis of convergence performance under different α values. (b) Convergence trajectories of charging piles and ESS with α = 0.05. Different colored lines denote the power changes of individual charging piles.
Electronics 14 03591 g016
Table 1. Parameter settings.
QuantityValue Comment
P p v 300kWRated power of PV
E max e 1000kWhRated capacity of ESS
P max e 275kWMaximum charging/discharging power of ESS
ρ e 0.95/0.95-Charging/discharging efficiency of ESS
[ η min e , η max e ][30%, 80%]-SOC limitation of ESS
P max e v 10kWMaximum charging/discharging power of EVs
ρ e v 0.92/0.92-Charging/discharging efficiency of EVs
S min 0.2 S max -Minimum capacity of EVs
α 0.05-The step length controlling the Lagrange-multiplier update rate
λ ( 0 ) 0.01-Initial value of Lagrange multiplier
Δ t 15 or 5minuteSampling period
Table 2. Voltage violation duration and peak reduction at buses 9 and 30.
BusViolation Duration Before Optimization (hours)Violation Duration After Optimization (hours)Voltage Peak Reduction (p.u.)
98.500.0397
3010.252.250.0480
Disclaimer/Publisher’s Note: The statements, opinions and data contained in all publications are solely those of the individual author(s) and contributor(s) and not of MDPI and/or the editor(s). MDPI and/or the editor(s) disclaim responsibility for any injury to people or property resulting from any ideas, methods, instructions or products referred to in the content.