Abstract
Electric vehicles (EVs) and thermostatically controlled loads (TCLs) are key demand-side resources for load regulation in modern power systems. However, effective load regulation faces significant challenges due to the stochastic nature of EV travel times and environmental uncertainties, such as temperature and solar irradiation fluctuations affecting TCL performance. Additionally, load rebound effects, caused by TCLs increasing power consumption to restore preset indoor temperatures after regulation, may induce secondary demand peaks, thereby offsetting regulation benefits. To address these challenges, this study aims to meet regulation requirements under such uncertainties while mitigating rebound-induced peaks. A rolling-horizon co-optimization method for EV and TCL clusters is proposed, which explicitly considers both uncertainties, load rebound effects and economic losses. First, to address the limited regulation capacity of individual EVs and TCLs, a user clustering mechanism is developed based on willingness to participate in demand response across multiple time intervals. A load rebound evaluation model for TCL clusters is developed to characterize post-regulation load variations and assess the rebound intensity. Subsequently, a load rebound-aware co-optimization model is proposed and solved within a rolling-horizon optimization approach, which performs rolling optimization within each prediction horizon to determine the participating clusters and their regulation capacities for each execution time slot under uncertainties. Simulation results demonstrate that the proposed method, compared with conventional day-ahead and robust optimization, not only meets load regulation requirements under uncertainty, but also effectively mitigates rebound-induced secondary peaks while achieving economic benefits.
1. Introduction
The “Carbon Peaking and Carbon Neutrality” strategy is a key driver accelerating the global energy transition, promoting the evolution of a modern energy system that integrates both clean renewable energy with conventional ones [1]. In recent years, the rapid growth and increasing penetration of electric vehicles (EVs) and thermostatically controlled loads (TCLs) have established them as promising demand-side flexibility resources [2]. Particularly during peak-load periods, the effective coordination of these flexible resources has emerged as an effective strategy for mitigating peak demand and enhancing grid stability [3].
Extensive research has been conducted on the participation mechanisms of demand-side resources in load regulation. These methods are generally classified into two categories: price-based incentives, such as time-of-use and peak tariffs, which incentivize flexible user behaviour, and signal-based direct control strategies. For example, Ref. [4] proposes a multi-objective optimization framework to maximize profits by balancing revenue, production costs, and the bonuses paid to aggregators. Ref. [5] proposes a random incentive-based demand response model that takes into account the uncertainty of controllable load consumers’ demand, using incentive mechanisms to guide users to actively adjust their energy consumption patterns. Ref. [6] proposed a centralized optimization approach based on heuristic algorithms, aiming to reduce peak demand and minimize energy costs. Ref. [7] provided an optimal solution for peak shaving while aiming at reducing the overall cost from a wholesale perspective. Considering potential user losses from participation, Ref. [8] developed a decomposition-based approach for allocating load regulation gap indicators. This method employs “region-to-region” and “region-to-user” interactions to allocate the indicators across multiple hierarchical levels. Ref. [9] proposed a multi-objective optimization model to balance the interests of supply and demand sides while ensuring system reliability.
When users’ electrical devices are either directly controlled or governed by pre-established load regulation contracts with the grid, optimized priority-based strategies can be used to determine participation sequences and allocate regulation capacities. Ref. [10] introduced a willingness-based priority scheme aiming to minimize total regulation costs and user energy expenditures, while ensuring fairness in electricity consumption. Similarly, Ref. [11] proposed a priority-based vehicle-to-grid optimization scheduling method, which considers the interaction with the distribution systems to minimize the load variance of the load profile.
However, the deactivation of TCLs during load regulation results in a decline in indoor temperature, particularly in winter scenarios. Upon completion of the regulation period, users typically increase appliance output to restore thermal comfort. This phenomenon, known as load rebound, has been extensively studied in the literature. Ref. [12] analyzed the impacts of load rebound using real-world data and proposed user clustering based on regulation patterns to mitigate this effect. Ref. [13] focused on grid-level impacts and introduced an energy storage-based mitigation strategy for suppressing rebound effects. Nevertheless, these studies have not explored the co-optimization of multiple flexible resources, such as EVs, which could offer complementary capabilities to further reduce rebound effects and improve regulation efficiency.
Additionally, the baseline power consumption of TCLs is largely influenced by ambient outdoor temperature and solar irradiation [14]. Uncertainties in these weather variables lead to deviations between scheduled and actual TCL regulation capacities, thereby exacerbating the challenges of load regulation. In contrast, EV regulation capacity is primarily determined by users’ departure and arrival times [15]. These uncertainties often result in lower-than-expected regulation capacity, leading to suboptimal outcomes. Rolling optimization offers a promising solution by continuously updating actual operating power to mitigate the impact of such uncertainties. In this context, Ref. [16] employed dynamic rolling optimization techniques to minimize grid operational costs. Ref. [17] proposed a rolling horizon approach for the co-optimization of end-user flexibility resources.
To address the above challenges, the goal of this study is to develop a rolling-horizon co-optimization framework for EV and TCL clusters that accounts for uncertainties and load rebound effects. The main contributions of this study are as follows:
- A load rebound evaluation model is developed to assess TCL rebound effects after load regulation and to represent TCL output behaviour within the co-optimization process, providing a basis for rebound mitigation in scheduling decisions.
- A rolling-horizon co-optimization method is proposed to coordinate the joint regulation of EV and TCL clusters in response to regulation signals. The optimization is implemented over a rolling prediction horizon with hourly updates, thereby enhancing regulation performance under uncertainties from EV travel behaviour, ambient temperature, and solar irradiation.
2. Framework of the Proposed Rolling-Horizon Co-Optimization Method
As illustrated in Figure 1, the load regulation models of EVs and TCLs are developed considering uncertainties in travel times, outdoor temperature and solar irradiation. EVs and TCLs are grouped into multiple clusters based on users’ willingness to participate and their regulation capabilities across different time periods. Each cluster communicates its available regulation capacity to the dispatch centre via an information exchange mechanism. The dispatch centre then analyzes system load conditions and evaluates the regulation capabilities of each cluster.
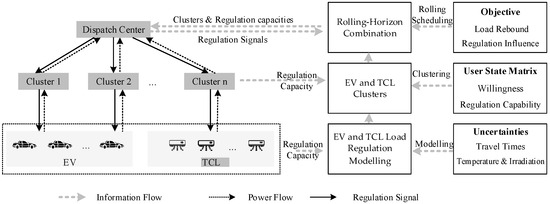
Figure 1.
Framework of the proposed rolling-horizon co-optimization method for EV and TCL clusters.
Based on this information, the dispatch centre performs real-time rolling optimization to generate load regulation signals. This optimization process accounts for various factors, including load rebound effects and regulation dynamics. Subsequently, the resulting regulation signals are then dispatched to the respective clusters. Upon receiving the signals, the clusters coordinate with internal users to implement corresponding load regulation actions, thereby fulfilling system’s regulation requirements. This study is conducted under a centralized framework. Therefore, it does not involve comparisons with distributed algorithms such as the alternating direction method of multipliers.
3. EV and TCL Regulation Modelling
3.1. EV Modelling
3.1.1. EV Load Regulation Process
The regulation characteristics of an EV during load regulation are depicted in Figure 2. The model assumes a constant charging/discharging power and incorporates known parameters, such as minimum electricity, the shaded area ‘ABCFED’ represents the feasible regulation region during regulation. This region is bounded by the operational constraints of EV charging and discharging under regulation scenarios.
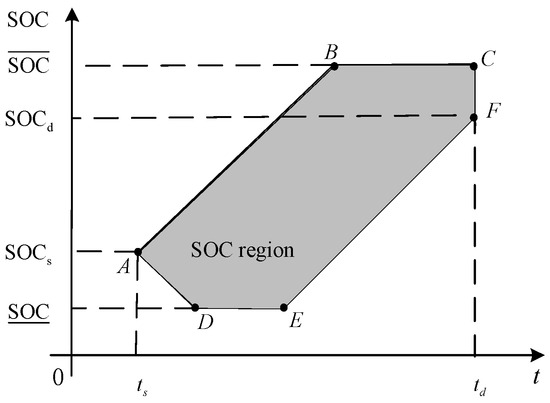
Figure 2.
Regulation characteristics of EV participating in load regulation.
Where corresponding to point A is the SOC of the EV upon connection to the grid. The segment ‘DE’ indicates the minimum allowable SOC () of the EV, while the segment ‘BC’ denotes the maximum allowable SOC (). and represent the start and end of the user’s travel period, respectively. corresponding to point F is the user’s start travel time and minimum electricity. The segment ‘CF’ illustrates the constraint of maintaining the EV’s SOC within the range [,] prior to the user’s departure.
The power flow from the grid to the EV is defined as positive, and the EV participates in load regulation within the feasible region ‘ABCFED’. Specifically:
where the charging and discharging operating power of the EV at time t is , with a maximum value is , and a minimum value is .
To determine the initial , it is necessary to analyze several EV parameters, including the SOC before the travel, the intrinsic characteristics of the EV (such as initial SOC and energy consumption), and operational parameters (such as travel time and distance), as shown below:
where represents the battery capacity, denotes the daily travel distance of the EV, and is the energy consumption per unit distance of the EV. represents the SOC value before the start of travel.
The SOC continuously changes during the charging process, as described by Equation (3). During this period, the EV power is negative and must comply with exchange power constraints. During the grid-connected period, the real-time SOC value is constrained by the EVs’ charging and discharging power limits, battery capacity and user travel demand, to ensure sufficient energy for the upcoming trip.
where denotes the time interval and represents the generalized battery capacity, as defined in Equation (4).
where and are the charging and discharging efficiencies (), respectively.
3.1.2. Output Power of EV Clusters
If the number of EVs in cluster j connected to the grid is , the power exchanged between the EV cluster and the grid at time t is described by Equation (5). The upward regulation capacity and downward regulation capacity of the EV cluster j at time t, are given by Equation (6) and Equation (7), respectively, where .
3.2. TCL Modelling
3.2.1. TCL Regulation Process
Taking the indoor temperature of TCLs as the state variable, the temperature dynamics over a single day are described by Equation (8). The basic dynamic process of the TCL is illustrated in Figure 3, where the shaded region indicates the feasible regulation range of TCL operation.
where is the room indoor temperature of user i at time t. is the outdoor temperature at the same time. ai is a constant derived from . Ri and Ci are the thermal resistance and thermal capacitance of user room i. and are upper and lower bounds of the maximum acceptable indoor temperature of user i. is the active power of the TCL of user i at time t.
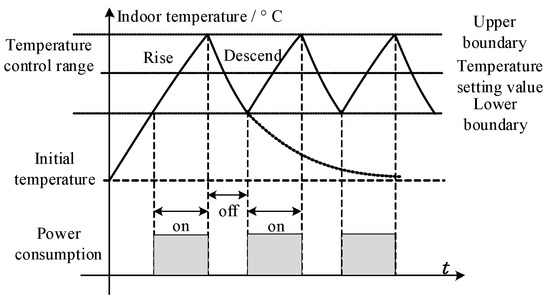
Figure 3.
Dynamic characteristics of TCL.
The upper and lower limits of the output power of the TCL, denoted as and , respectively, are defined in Equation (9).
where represents the switching state of the TCL.
3.2.2. Output Power of TCL Clusters
The regulation sequence of each TCL within the TCL cluster is illustrated in Figure 4, showing the evolution of power consumption. The numbers in the figure represent the regulation state sequence numbers of the TCL during its operating cycle. For TCLs, a positive direction indicates an increase in power consumption, while a negative direction indicates a decrease. At time t1, the lower limit of indoor temperature regulation range is reached. During the interval [t1, t2], the user activates the TCL, causing the indoor temperature to exceed the upper limit of the regulation range, thus preventing the user from participating in regulation. is the setting temperature. During [t3, t4], the user deactivates the TCL, enabling down-regulation capability, which results in a decrease in indoor temperature. The total output power of the TCL cluster, denoted as , is defined in Equation (10). The cluster’s upward and downward regulation capacities, denoted as and , are given in Equation (11) and Equation (12), respectively. represents the number of participating TCL users in cluster j.
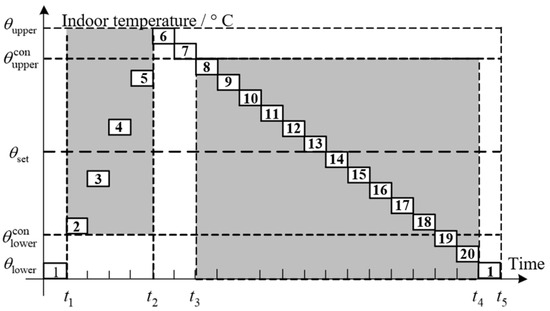
Figure 4.
Regulation characteristics of individual TCL.
3.3. Uncertainties in EV and TCL Regulation
Due to the uncertainties in user behaviour, the start and end travel times of EV users are uncertain, which directly affects the charging and discharging states of EVs across different time periods. Similarly, uncertainties in solar irradiation and outdoor temperature influence the operating power of TCLs, thereby affecting the overall regulation capacities of EV and TCL clusters.
This study considers uncertainties in the start and end travel times of EVs, as well as in solar irradiation and outdoor temperature, which affect TCLs. Based on forecasted information, the prediction errors for EV travel times, solar irradiation, and outdoor temperature are assumed to follow normal distributions. Such assumptions have been adopted in [18,19], primarily based on empirical observations that large-sample forecasting errors tend to approximate a normal distribution.
4. User State Matrix and Load Rebound Modelling
4.1. User State Matrix
In order to characterize the time-varying flexibility and participation willingness of users, a user-state matrix Ci is constructed for each user i. The matrix serves as the basis for flexible user clustering, priority-based selection, and real-time rolling optimization. By comparing the user state matrices, users with strong willingness and small rebound can be selectively given priority to participate [10]. The vector in is shown in Equation (13).
where denotes the regulation willingness of user i at time t, specifically, = 1 indicates that the user is willing to participate in load regulation at time t, while = 0 denotes non-participation. This representation reflects the practical operation mode in which participation decisions are discrete rather than continuous adjustments [20]. is the load rebound amount of user i at time t. is the baseline load of user i when they do not participate in load regulation at time t.
In this study, clustering is based on EV and TCL users’ willingness to participate in load regulation at different time intervals. The number of clusters is set to 5, which allows for the different clusters such as “high willingness throughout the day,” “high willingness in morning and evening,” “midday peak willingness,” and “low willingness”.
4.2. Load Rebound Modelling for TCL Clusters
Load rebound refers to the deviation of power consumption from the original baseline caused by TCLs increasing power to restore the preset temperature after load regulation. To prevent overload during the post-regulation recovery phase, a three-stage load rebound model is introduced. is determined by the load regulation values , as shown in Equation (14).
where , , are the rebound coefficients.
4.3. Load Regulation Influence Function
The Load regulation influence function is shown in Figure 5. For EV users, reducing charging power during the regulation period causes a shift in charging demand to other periods, resulting in increased load during non-regulation periods. For TCL users, load regulation entails reducing operational power during the regulation period. The degree of user impact increases as the magnitude of load regulation deviates further from the baseline load.
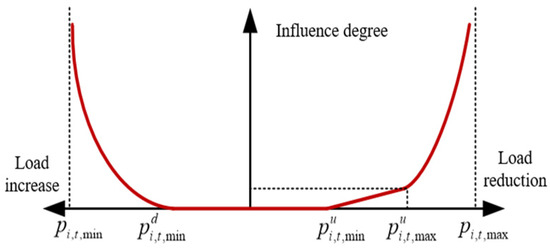
Figure 5.
Load regulation influence function.
When the load regulation amount falls within the influence regulation interval , the impact on the user’s power is negligible, and the resulting loss during this stage is defined as zero. When the load regulation amount falls within the influence regulation interval , a linear relationship exists between the user’s influence and the regulation power. When the load regulation amount falls within the range or , the impact of regulation power on the user’s power increases, with a higher regulation resulting in greater influence. An exponential function is used to characterize the relationship between user influence and the power regulation. Accordingly, the user’s load regulation influence function is defined in Equation (15).
where represents the influence on users resulting from their participation in load regulation, and , and are the influence coefficients corresponding to different segments of the load regulation influence function.
5. Rolling-Horizon Co-Optimization of Load Regulation Based on EV and TCL Clusters
5.1. Objective Function
The proposed optimization model aims to minimize the total load regulation loss, including both the operational loss associated with adjusting EV and TCLs and the impact of regulation-induced load fluctuations on the grid, while mitigating load rebound effects by explicitly modelling and minimizing rebound-induced secondary peaks from TCL clusters. These objectives are selected to balance economic efficiency and regulation requirements. The weights of different optimization objectives are denoted as , respectively, and the objective function is defined in Equation (16).
where is the revenue reduction in the grid as shown in Equation (17). is the load deviation function before and after the regulation, which aims to reduce the new load peak caused by load rebound or load redistribution, as shown in Equation (18), where and are the parameters of the load rebound function. is the set of EV users, and is the set of TCL users. N is the set of users participating in load regulation, with and .
5.2. Constraints
- (1)
- Load Regulation Amount Constraint
In each time period, load regulation of EVs is performed according to the regulation instructions within the adjustable range, ensuring that the total power remains constant over the entire scheduling horizon, as defined in Equation (19). Meanwhile, the load regulation satisfies the constraint ranges shown in Equations (20) and (21).
- (2)
- Power Balance Constraint
The total load regulation by users in each scheduling horizon must meet or exceed the total load regulation requirements at time t.
where represents the load regulation requirement at time t.
- (3)
- User Participation Regulation Time Constraint
To avoid excessive user fatigue from frequent participation, a constraint is imposed on the times of users allowed to participate in load regulation within a scheduling horizon, as shown in Equation (23).
where indicates the maximum regulation times of user i.
- (4)
- Load Limit Constraint
Equations (24) and (25) represent the power constraints for each EV and TCL user, respectively.
- (5)
- Load Ramping Constraint
The power of user i in adjacent periods should maintain a certain degree of continuity, as shown in Equation (26).
where and are downward and upward ramping rate of user i, respectively.
- (6)
- Maximum Transmission Power Constraint
To ensure the safe operation of distribution lines, the aggregated load of all users connected to the same line must not exceed its rated transmission capacity.
where is the maximum transmission capacity.
In this study, EV and TCL clusters are optimized independently within the centralized rolling-horizon framework. This design choice is motivated by the practical operation mode of aggregator-based scheduling, where each cluster’s optimization can effectively meet regulation requirements [21].
5.3. Solution Method
Since the objective function involves a piecewise function, this section presents the linearization of the proposed method. After linearization, the method is transformed into a convex form, which can be solved using commercial optimization solvers.
Let be an n-piecewise linear function defined over breakpoints . Introduce variables to represent the position of x and as follows:
The continuous variable and binary variable satisfy the following constraints:
For the user influence function proposed above, linearization constraints are added to the optimization model. The corresponding breakpoint relationship satisfies .
The continuous variable and binary variable satisfy the following constraints:
5.4. Implementation Details
The proposed co-optimization problem is solved using the commercial solver Gurobi.
A rolling horizon solution approach is utilized to solve the proposed co-optimization method, aiming to reduce the impact of uncertainties [22]. As illustrated in Figure 6, at each time slot, based on the current load regulation requirement, the user state matrix (Equation (13)) as well as the predicted TCL and EV loads of prediction time horizon, the proposed co-optimization is calculated (Equations (16)–(27)). Only the regulation requirement for the first time slot is issued to users, while the forecasts for subsequent periods inform the next round of rolling updates.

Figure 6.
Schematic diagram of rolling horizon solution process.
5.5. Load Rebound Ratio Calculation
To verify the effectiveness of the proposed method, a load rebound ratio index is introduced, which reflects the proportion of load rebound relative to the load without participation in regulation. The index is defined in Equation (34):
6. Case Studies
6.1. Parameters Setting
In this case study, 5 EV clusters and 5 TCL clusters are considered, with each cluster consisting of 100 users. A total of 1000 users participate in load regulation, and the behaviour of individual users are assumed to be independent. Similar user scales have been adopted in [23,24], demonstrating that 1000-user simulations are widely accepted for validating demand-side coordination optimization. To ensure the stability and reliability of the simulation results, each scenario was evaluated using 100 Monte Carlo trials. This repeated sampling approach accounts for stochastic variations in EV travel times, outdoor temperature, and solar irradiation, thereby producing statistically robust performance indicators for the proposed method. All simulations were conducted on a 12th Gen Intel(R) Core (TM) i7-12700H CPU with 16 GB RAM.
6.1.1. EV Parameters
The rated charging power of a single EV is set to 6.6 kW. The types of EVs are listed in Table 1, and the probability distribution of EV travel times is illustrated in Figure 7. The deviations in EV users’ start and end travel times are assumed to follow a normal distribution with a mean of 0 and a variance of 0.05. , and are determined by sampling from their respective probability distributions using the Monte Carlo method [9].

Table 1.
Types of EVs.
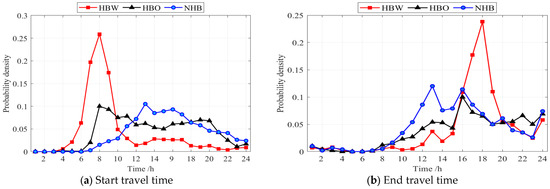
Figure 7.
Probability distribution of EVs travel time.
6.1.2. TCL Parameters
Taking the winter operation scenario as an example, the TCL is set for residential heating equipment, and the rated power follows a uniform distribution of U(6, 10). The indoor comfortable temperature setpoint is 21 °C, with an upper and lower boundary δ of ±2 °C. The building modelling methods and parameters, such as the building thermal resistance R and building heat capacity C, are taken from Ref. [25] The predicted values of outdoor temperature and irradiation, along with their upper and lower uncertainty limits, are shown in Figure 8.
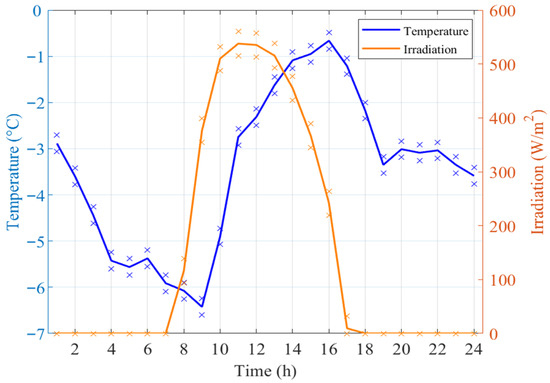
Figure 8.
Outdoor temperature and irradiation.
6.1.3. Load Regulation Parameters
The load regulations are issued at 19:00 and 20:00. The clusters are required to reduce total power by 240 kW at 19:00 and by 224 kW at 20:00. At these times, the parameters of the load regulation influence function and the load rebound function are shown in Table 2, while the load rebound coefficients fitting is shown in Appendix A.1.

Table 2.
The parameters of load regulation influence function and load rebound function.
6.2. Numerical Results Analysis
For the baseline case with 5 EV clusters and 5 TCL clusters, the rolling-horizon optimization is performed with a time step of 1 h. Based on the results of 240 optimization runs, the average solution time is 0.78 s per hour, with the longest single optimization taking 1.12 s.
6.2.1. Clusters Collaborative Regulation Analysis
The comparison of the baseline load and adjusted load is illustrated in Figure 9. Based on the received load regulation signals, the maximum power provided by the EV clusters and the TCL clusters at 19:00 are 364 kW and 250 kW, respectively. The total maximum power provided by the clusters is 614 kW, which satisfies the constraint requirement for the power lower limit.
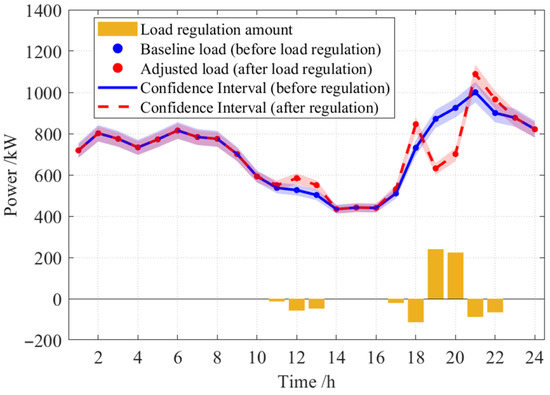
Figure 9.
Comparison of baseline load and adjusted load.
At 20:00, the maximum power provided by the EV and TCL clusters are 347 kW and 279 kW, respectively, with the total maximum power provided by both clusters being 626 kW. Since EV participation in load regulation reduced the charging load between 19:00 and 20:00, the charging demand was shifted to other time slots. Additionally, due to the rebound effect from the TCL clusters, load rebound occurs at 21:00 and 22:00, with a rebound rate of 6.53%. Among all 10 load clusters, the optimization results show that 5 EV clusters and 3 TCL clusters participate in load regulation.
6.2.2. Clusters Participate in Load Regulation Analysis
Figure 10a shows a comparison between the regulation capacities of the clusters and their actual regulation power at 19:00. EV clusters 2 and 3 have reached their regulation capacity limits. Although clusters 7 and 8 had available regulation capacities at this time, their user regulation willingness was lower than that of other clusters, and thus clusters 7 and 8 were not called upon to participate in the regulation.
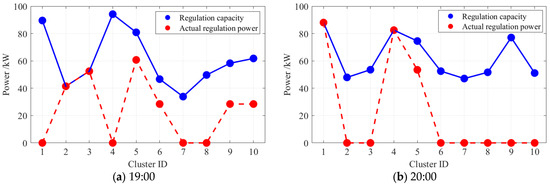
Figure 10.
Comparison of regulation capacity and actual regulation power at 19:00 and 20:00.
The comparison between clusters’ regulation capacities and their actual regulation power at 20:00 is illustrated in Figure 10b. It can be observed that EV clusters 1 and 4 reached their regulation capacity limits. Clusters 2 and 3, having provided their full regulation capacity at 19:00, did not participate in regulation at 20:00. Considering that load rebound may negatively impact the stable operation of the power system, the TCL clusters are not participated in load regulation during this period.
6.2.3. Clusters’ Load Regulation Amount and Time Analysis
As shown in Figure 11, the regulation times vary among the different clusters. TCL clusters generally provide less regulation compared to EV clusters. This is because TCLs exhibit load rebound effect after regulation, and thus the scheduling strategy prioritizes the use of EV clusters. Moreover, for TCL clusters with relatively small available regulation capacity such as TCL cluster 2 and cluster 3, the system further reduces their dispatch priority.
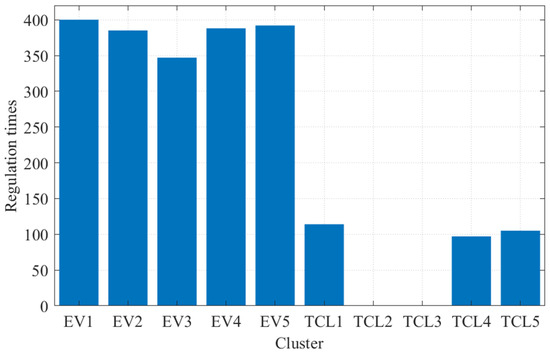
Figure 11.
Regulation times of clusters.
Since the EV cluster participates in load regulation, the load reduction during the regulation period needs to be made up during the remaining regulation period. Therefore, the EV charging power is scheduled based on the user’s willingness to participate in the regulation. The power of EV cluster 1–5 is shown in Figure 12.
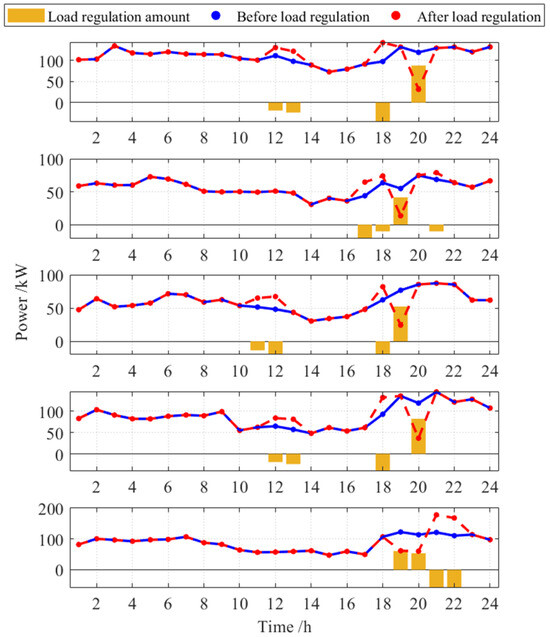
Figure 12.
Comparison of EV clusters’ power before and after load regulation.
The charging period is concentrated between 11:00 and 13:00, as the original load during this period is low. Therefore, the load in this period is increased during optimization to reduce the peak-valley difference. Only clusters 2 and 5 experienced a load increase during the load rebound period. This is because these two clusters had lower willingness during off-peak period, and to avoid new load peaks or power overages, their power is kept low during the remaining off-peak periods.
Compared to EVs, TCLs participating in load regulation can cause load rebound. Therefore, when both the EV clusters and the TCL clusters participate in load regulation, all five EV clusters are involved in the regulation, while three of the five TCL clusters participate, as shown in Figure 13.
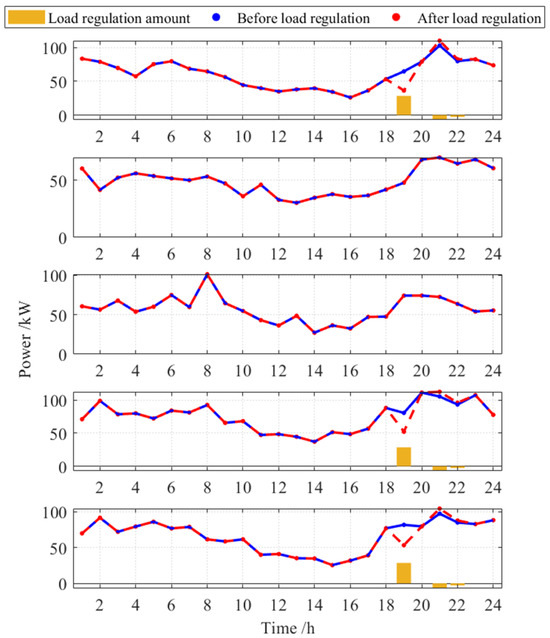
Figure 13.
Comparison of TCL clusters’ power before and after load regulation.
6.2.4. Optimization Results Analysis
Figure 14 presents a comparison of the rolling horizon optimization method, the traditional day-ahead approach and the robust optimization. The robust method tends to be more conservative in most time periods. While it successfully satisfies the regulation requirements, it results in a higher peak load of 1138.97 kW, exceeding those observed in the proposed rolling-horizon and day-ahead optimization. The day-ahead optimization approach failed to account for the multiple uncertainties, leading to Cluster 5’s inability to satisfy the ramping constraint during the actual load regulation process, as is shown in Figure 15. Cluster 5’s ramping rate from 20:00 to 21:00 was 121.68 kW/h, exceeding the 120 kW/h ramping rate limit. This occurred because the day-ahead optimization did not fully account for the uncertainties of EV users’ start travel time, end travel time and load fluctuations. As a result, at 19:00, the TCLs’ power, originally scheduled by rolling optimization, decreased from 85.32 kW to 61.22 kW, requiring the participation of more EVs in load regulation, as is shown in Figure 16. Consequently, the cluster was unable to achieve the scheduled load regulation demand.
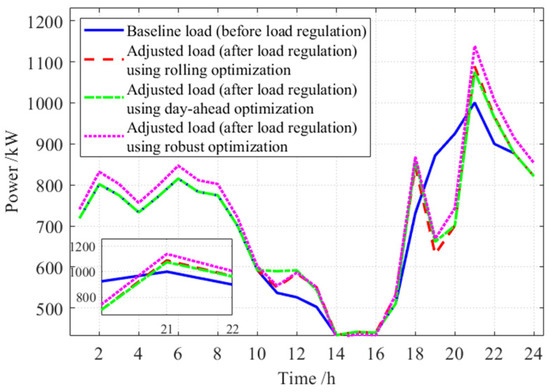
Figure 14.
Comparison of load regulation results.
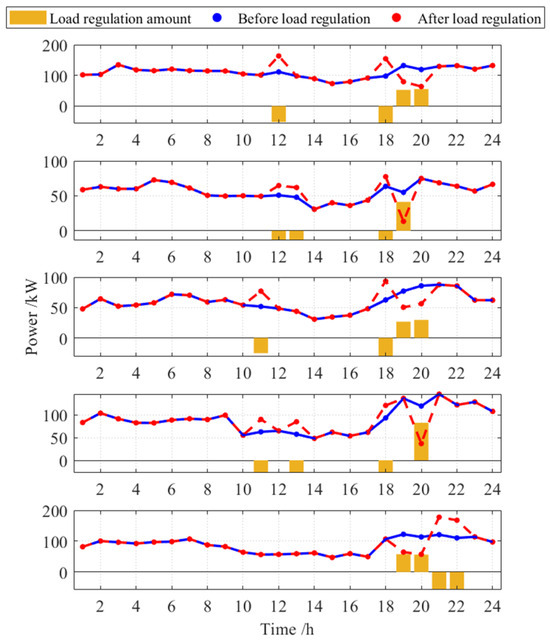
Figure 15.
Comparison of EV clusters’ power before and after load regulation using day-ahead optimization.
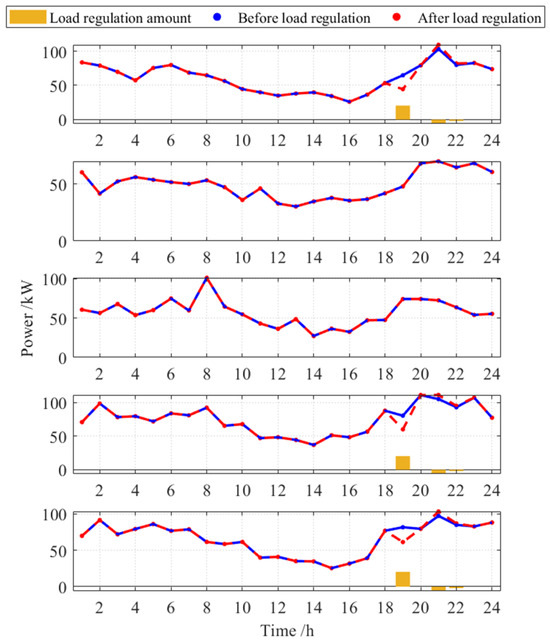
Figure 16.
Comparison of TCL clusters’ power before and after load regulation using day-ahead optimization.
6.2.5. Load Rebound Effect Analysis
Figure 17 presents a comparison of the load with and without considering load rebound. It can be observed that, due to the consideration of load rebound, the maximum power after participating in load regulation decreased from 1187.54 kW to 1088.91 kW, representing a reduction of 9.06%. This effectively reduces the new load peaks caused by load rebound. If the load rebound effect is not considered, the load rebound rate would reach 29.27%, leading to instances of load exceeding the limit, potentially creating new load gaps and threatening the normal operation of the system.
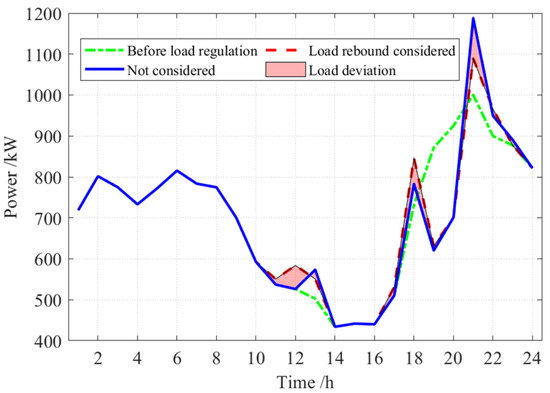
Figure 17.
Comparison of load with and without considering load rebound.
Figure 18 compares the user clusters involved in load regulation. Compared the optimization without considering load rebound, the TCL clusters would be more heavily utilized, while the EV clusters, after participating in load regulation, would need to increase their power during other periods. The participation of TCL clusters in load regulation involves reducing their own power, minimizing the impact on the load curve during other periods. However, since normal power needs to be restored after participating in load regulation, load rebound occurs.
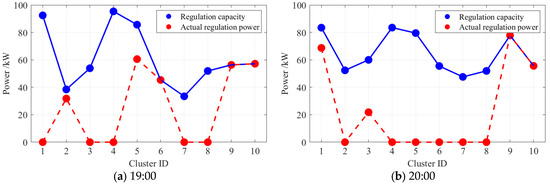
Figure 18.
Comparison of regulation capacity and actual regulation power at 19:00 and 20:00 without considering load rebound.
6.2.6. Economic Loss Analysis
Table 3 presents a comparative analysis of economic losses for three optimization strategies: robust optimization, day-ahead optimization, and rolling optimization. The results demonstrate that rolling optimization yields the lowest user loss, grid loss, and load rebound loss among the evaluated approaches. Compared with robust optimization, rolling optimization reduces user loss by approximately 7.2%, grid loss by 10.7%, and load rebound loss by 8.1%. Relative to day-ahead optimization, it achieves a 15.2% reduction in user loss, an 18.5% reduction in grid loss, and a 16.3% decrease in load rebound loss.

Table 3.
Comparison of economic loss under different optimization.
7. Sensitivity Analysis and Discussion
To evaluate the performance variation of the proposed multi-objective optimization model under different weight settings, a sensitivity analysis was conducted. Figure 19 presents the daily load corresponding to different weight combinations
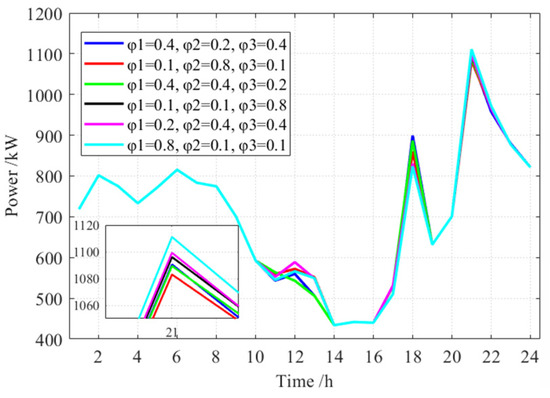
Figure 19.
Sensitivity analysis of weight coefficients.
When the weight associated with grid fluctuation is higher, the daily load tends to be smoother with a reduced peak-valley gap, indicating that the optimization process prioritizes mitigating rapid load changes. When the weight associated with load rebound is higher, evening load peaks are noticeably reduced. However, when the weight placed on user loss is increased, the load exhibits larger fluctuations during load regulation periods, with some load rising, suggesting that prioritizing user loss may weaken the overall load balancing performance.
8. Conclusions
A rolling-horizon co-optimization method for EV and TCL clusters is proposed in this paper. The proposed method is compared with the day-ahead co-optimization method and the co-optimization method without considering load rebound. The conclusions are as follows:
- The proposed rolling-horizon co-optimization method accounts for the load rebound effect of TCL users after participating in load regulation, satisfies the load regulation requirements, and reduces new peaks caused by load rebound.
- Compared with the day-ahead and robust optimization method, the proposed rolling-horizon co-optimization method can optimize load regulation capacities under load fluctuations caused by uncertainties in EV users’ start and end travel times, as well as outdoor temperature and solar irradiation. By rolling updates within the prediction horizon, it ensures that load regulation signals are responded to while satisfying the constraints of EVs and TCLs.
- The proposed method incorporates economic losses into the optimization process, quantitatively considering user loss, grid loss, and load rebound loss. Compared with day-ahead and robust optimization, it achieves reductions in all three types of losses.
In the future work, we will extend the method to larger-scale user scenarios to further evaluate its scalability, adaptability, and applicability. We will also consider coupling constraints, such as rebound-aware EV charging to offset TCL peaks, enabling coordinated operation among different flexible loads. In addition, we plan to validate the assumed uncertainty distributions using large-scale historical traffic and weather datasets, thereby enhancing the model’s accuracy and robustness under real-world conditions.
Author Contributions
Conceptualization, J.Z. (Jiarui Zhang); methodology, J.Z. (Jiarui Zhang) and J.L.; software, J.L. and L.M.; validation, J.L., J.Z. (Jian Zhao). and Z.L.; formal analysis, L.M.; data curation, J.L.; writing—original draft preparation, J.Z. (Jiarui Zhang); writing—review and editing, J.L.; visualization, Z.L. and L.M. All authors have read and agreed to the published version of the manuscript.
Funding
This work was supported in part by the National Key R&D Program of China 2022YFB2403900 and in part by the National Natural Science Foundation of China under Grant U22B20105.
Data Availability Statement
All data included in this study are available upon request.
Conflicts of Interest
Authors Ling Miao and Jian Zhao were employed by the company State Grid Henan Electric Power Company Electric Power Science Research Institute. The remaining authors declare that the research was conducted in the absence of any commercial or financial relationships that could be construed as a potential conflict of interest.
Abbreviations
| Nomenclature | Minimum SOC at the user’s start travel time | ||
| N-piecewise linear function | |||
| Abbreviatures | Number of participating EV/TCL users in cluster j | ||
| EV | Electric Vehicle | Power of EV/TCL cluster | |
| SOC | State of Charge | Real-time SOC | |
| TCL | Thermostatically Controlled Load | Regulation willingness | |
| Revenue reduction in the grid | |||
| Symbols | Set of EV/TCL users | ||
| Setting temperature | |||
| Active power of TCL | SOC before the start of travel | ||
| Binary variable | SOC of EV upon connection to the grid | ||
| Charging and discharging power of EV | Switching state of TCL | ||
| Charging/discharging efficiency | Start/end of the user’s travel period | ||
| Continuous variable | Thermal capacitance | ||
| Travel distance of EV | Time interval | ||
| Energy consumption of EV | Upward/downward regulation capacity of EV cluster | ||
| Generalized battery capacity | Upward/downward regulation capacity of TCL cluster | ||
| Influence on users | Upper/lower limit of indoor temperature regulation range | ||
| Indoor/outdoor temperature | Upper/lower limit of maximum acceptable indoor temperature | ||
| Load deviation function | Upward/downward ramping rate | ||
| Load rebound amount | |||
| Load rebound ratio index | Coefficients | ||
| Load regulation requirement | |||
| Maximum/minimum power of EV | α, β, χ | Coefficients of load rebound | |
| Maximum/minimum power of TCL | Influence coefficients of load regulation influence function | ||
| Maximum regulation times | Parameters of load rebound function | ||
| Maximum/minimum SOC | Weights of different optimization objectives | ||
| Maximum transmission capacity |
Appendix A
Appendix A.1. Load Rebound Coefficients Fitting
In this study, TCLs were simulated using the RC model, which has been applied in [26,27,28]. The RC model was employed to capture the thermal dynamics of the loads under regulation scenarios. Based on the simulation results, the relationship between load rebound and the amount of load regulation was characterized through curve fitting, as illustrated in Figure A1. Load rebound coefficients fitting. The fitting results directly give the values of as 0.62, as 0.07, and as 0.02.
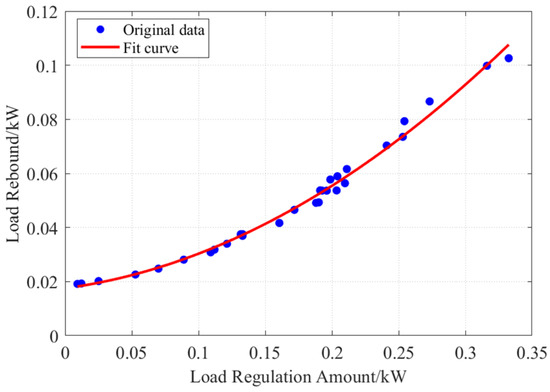
Figure A1.
Load rebound coefficients fitting.
References
- Shu, Y.; Zhang, L.; Zhang, Y.; Wang, Y.; Lu, G.; Yuan, B.; Xia, P. Carbon peak and carbon neutrality path for China’s power industry. Strateg. Study Chin. Acad. Eng. 2021, 23, 1–14. [Google Scholar] [CrossRef]
- Qiu, Y.; Zhou, S.; Gu, W.; Pan, G.; Chen, X. Application prospect analysis of hydrogen enriched compressed natural gas technologies under the target of carbon emission peak and carbon neutrality. Proc. CSEE 2022, 42, 1301–1320. [Google Scholar]
- Navidi, T.; El Gamal, A.; Rajagopal, R. Coordinating distributed energy resources for reliability can significantly reduce future distribution grid upgrades and peak load. Joule 2023, 7, 1769–1792. [Google Scholar] [CrossRef]
- Nikzad, M. Risk-averse stochastic multi-objective optimization for time-of-use demand response pricing in smart microgrids. Energy 2025, 322, 135733. [Google Scholar] [CrossRef]
- Harsh, P.; Sun, H.; Das, D.; Rameshrao, A.G.; Jiang, J. Stochastic Incentive-based Demand Response Program for Virtual Power Plant with Distributed Energy Resources. IEEE Trans. Ind. Appl. 2025, 61, 4862–4875. [Google Scholar] [CrossRef]
- Chakraborty, N.; Mondal, A.; Mondal, S. Efficient load control based demand side management schemes towards a smart energy grid system. Sustain. Cities Soc. 2020, 59, 102175. [Google Scholar] [CrossRef]
- Cossutta, M.; Pholboon, S.; McKechnie, J.; Sumner, M. Techno-economic and environmental analysis of community energy management for peak shaving. Energy Convers. Manag. 2022, 251, 114900. [Google Scholar] [CrossRef]
- Yan, Q.; Tong, X.; Zhang, N.; Chen, X.; Yi, Y. A dynamic multi-level temporal and spatial coordination method for orderly power utilization based on customer load curtailment cost characteristics. Power Syst. Technol. 2016, 40, 425–432. [Google Scholar]
- Yang, H.; Zhang, X.; Chu, Y.; Ma, Y.; Zhang, D.; Guerrero, J.M. Multi-objective based demand response strategy optimization considering differential demand on reliability of power system. Int. J. Electr. Power Energy Syst. 2023, 152, 109202. [Google Scholar] [CrossRef]
- Yang, J.; Sun, Q.; Yao, L.; Liu, Y.; Yang, T.; Chu, C.; Fang, L.; Zhu, L. A novel dynamic load-priority-based scheduling strategy for home energy management system. J. Clean. Prod. 2023, 389, 135978. [Google Scholar] [CrossRef]
- Singh, P.P.; Das, S.; Wen, F.; Palu, I.; Singh, A.K.; Thakur, P. Multi-objective planning of electric vehicles charging in distribution system considering priority-based vehicle-to-grid scheduling. Swarm Evol. Comput. 2023, 77, 101234. [Google Scholar] [CrossRef]
- Tomat, V.; Vellei, M.; Ramallo-González, A.P.; González-Vidal, A.; Le Dréau, J.; Skarmeta-Gómez, A. Understanding patterns of thermostat overrides after demand response events. Energy Build. 2022, 271, 112312. [Google Scholar] [CrossRef]
- Meng, Q.; Gao, T.; Zhang, X.; Zhao, F.; Wang, L.; Lei, Y.; Wu, X.; Li, H. Load rebound suppression strategy and demand response potential of thermal storage HVAC systems: An experimental and simulation study. J. Energy Storage 2023, 73, 108872. [Google Scholar] [CrossRef]
- Zhang, L.; Li, J.; Jiang, J.; Yan, G. A method for evaluating the regulation capacity of thermostatically controlled load group based on state complementary control strategy. Energy Rep. 2024, 12, 4320–4338. [Google Scholar] [CrossRef]
- Li, H.; Yu, L.; Chen, Y.; Tu, H.; Zhang, J. Uncertainty of available range in explaining the charging choice behavior of BEV users. Transp. Res. Part A Policy Pract. 2023, 170, 103624. [Google Scholar] [CrossRef]
- Yoldas, Y.; Goren, S.; Onen, A.; Ustun, T.S. Dynamic rolling horizon control approach for a university campus. Energy Rep. 2022, 8, 1154–1162. [Google Scholar] [CrossRef]
- Corinaldesi, C.; Schwabeneder, D.; Lettner, G.; Auer, H. A rolling horizon approach for real-time trading and portfolio optimization of end-user flexibilities. Sustain. Energy Grids Netw. 2020, 24, 100392. [Google Scholar] [CrossRef]
- Lu, X.; Liu, Z.; Ma, L.; Wang, L.; Zhou, K.; Feng, N. A robust optimization approach for optimal load dispatch of community energy hub. Appl. Energy 2020, 259, 114195. [Google Scholar] [CrossRef]
- Gubler, S.; Fukutome, S.; Scherrer, S.C. On the statistical distribution of temperature and the classification of extreme events considering season and climate change—An application in Switzerland. Theor. Appl. Climatol. 2023, 153, 1273–1291. [Google Scholar] [CrossRef]
- Zahid, M.Z.B.M.; Aki, H. Analyses on the impact of consumers’ participation by demand response for flexibility procurement. Sustain. Energy Grids Netw. 2024, 38, 101237. [Google Scholar] [CrossRef]
- Hu, J.; Cao, J. Demand response optimal dispatch and control of tcl and pev agents with renewable energies. Fractal Fract. 2021, 5, 140. [Google Scholar] [CrossRef]
- Erdinç, F.G. Rolling horizon optimization based real-time energy management of a residential neighborhood considering PV and ESS usage fairness. Appl. Energy 2023, 344, 121275. [Google Scholar] [CrossRef]
- Xu, L.; Gu, X.; Song, Z. Optimal charging for large-scale heterogeneous electric vehicles: A novel paradigm based on learning and backward clustering. Appl. Energy 2025, 382, 125232. [Google Scholar] [CrossRef]
- Jiang, Z.; Peng, J.; Yin, R.; Hu, M.; Cao, J.; Zou, B. Stochastic modelling of flexible load characteristics of split-type air conditioners using grey-box modelling and random forest method. Energy Build. 2022, 273, 112370. [Google Scholar] [CrossRef]
- Qi, Y.; Wang, D.; Jia, H.; Chen, N.; Wei, W.; Liu, K.; Fan, M. Research on under frequency load shedding strategy using aggregated thermostatically controlled loads based on demand response. Proc. CSEE 2017, 37, 751–760. [Google Scholar]
- Zhu, G.; Bao, Y.; Yu, Q. A control strategy for air-conditioning loads participating in frequency regulation based on model predictive control. Sustain. Energy Grids Netw. 2024, 38, 101369. [Google Scholar] [CrossRef]
- Fan, D.; Zhang, S.; Huang, H.; Zhou, L.; Wang, Y.; Xiao, X. Three-stage day-ahead scheduling strategy for regional thermostatically controlled load aggregators. Prot. Control Mod. Power Syst. 2023, 8, 1–11. [Google Scholar] [CrossRef]
- Lin, Q.; Ding, L.; Kong, Z.; Yu, Z.-W.; Li, X.; Wang, H. Multi-Time Scale Model Predictive Control-Based Demand Side Management for a Microgrid. IEEE Trans. Smart Grid 2024, 16, 1181–1193. [Google Scholar] [CrossRef]
Disclaimer/Publisher’s Note: The statements, opinions and data contained in all publications are solely those of the individual author(s) and contributor(s) and not of MDPI and/or the editor(s). MDPI and/or the editor(s) disclaim responsibility for any injury to people or property resulting from any ideas, methods, instructions or products referred to in the content. |
© 2025 by the authors. Licensee MDPI, Basel, Switzerland. This article is an open access article distributed under the terms and conditions of the Creative Commons Attribution (CC BY) license (https://creativecommons.org/licenses/by/4.0/).