Abstract
Wearable systems are increasingly adopted for health monitoring and wellness promotion. Among the most relevant biosignals, the electrocardiogram (ECG) plays a key role; however, in wearable settings (e.g., during physical activity), it is often corrupted by electromyogram (EMG) interference. This study presents a novel adaptive algorithm, template masking (TM), which integrates the stationary wavelet transform (SWT) with template matching for denoising the ECG from EMG. The method identifies the optimal wavelet and decomposition level to maximise detail sparsity. To mitigate EMG interference, after alignment in the SWT domain with a template, the detail coefficients are multiplied by a binary mask and smoothed. TM was compared with soft and hard thresholding on (1) simulations combining clinical ECGs (MIT-BIH database) and synthetic EMGs with different signal-to-noise ratios (SNRs), and (2) experimental signals including ECGs acquired with dry electrodes corrupted by EMGs (SimEMG database, also varying SNRs), as a potential wearable scenario. In both cases, TM yielded significantly lower reconstruction errors at SNRs below 5 dB () and significantly outperformed thresholding in the sensitivity of R-peaks estimation (). These results demonstrate the potential of TM, highlighting the value of adaptive denoising algorithms.
1. Introduction
The electrocardiogram (ECG) is the recording of the heart’s electrical activity and is widely used in clinical settings to diagnose cardiovascular diseases, which is the leading cause of death worldwide [1]. Nowadays, the widespread use of wearable devices such as smartwatches [2], wristbands [3], and smart garments [4,5] has led users to self-monitor their health status outside hospitals through ECG recordings. Alongside consistent technical innovations, leading to smaller, lighter, and smarter devices, some challenges remain, e.g., the lack of high-quality recordings. In this regard, ECGs are often affected by interferences coming from either the human body or the external environment. With particular reference to devices meant for ECG recording, the signal of interest is susceptible to different artifacts. Among them, motion artifacts (MAs) and electromyogram (EMG) interference are certainly the most critical [6,7].
It is worth mentioning that, unlike power line interference and baseline wander, it is not possible to adopt hardware solutions to remove the influence of EMGs and MAs. Traditional approaches, such as filtering techniques, are not always effective in removing these artifacts, especially when the noise overlaps with the frequency range of the ECG signal and has high amplitude. For this reason, different approaches have been proposed, and the adaptive least mean square algorithm is one of the most adopted [8,9]. This filter dynamically adjusts its coefficients to minimise the mean square error between the desired signal and actual output. The method is simple [10] and can be used for managing the non-stationarity of the ECG [11]. However, it relies on a reference signal, such as the noise source, and adjusting the step size can make the process more complex and potentially affect its stability.
Another technique to be mentioned is empirical mode decomposition (EMD) [12], whose principle is to decompose the signal into intrinsic mode functions (IMFs) [13]. The method is adaptive and suitable for the non-stationary signals. For denoising purposes, IMFs related to the noise are usually discarded [14]. Overall, EMD suffers from the so-called mode mixing, which occurs when an IMF contains oscillatory components with widely different frequencies, thus failing to properly separate the underlying time–frequency scales necessary for denoising purposes. Modified versions of EMD exist to mitigate the effect of the mixing mode, such as ensemble EMD (EEMD) [15] and complete EEMD with adaptive noise (CEEMDAN) [16]. In general, EMD is computationally expensive [13], and the complexity increases with EEMD and CEEMDAN.
In addition to the above, the wavelet transform (WT) should be mentioned. WT decomposes a signal into coefficients across multiple levels, each corresponding to a specific frequency band. WT overcomes the intrinsic limitation of the short-time Fourier transform by providing good resolutions at high and low frequencies [17]. In the paramount of WTs, the stationary wavelet transform (SWT) has gained importance for ECG denoising [18,19,20,21,22,23], with a recent study [13] showing superior performance compared to the EMD, EEMD, CEEMDAN, and hybrid approaches. To perform denoising with the SWT, thresholding techniques are used; more specifically, coefficients below a threshold are either scaled (soft thresholding) or set to zero (hard thresholding). When dealing with WT, denoising performance is strictly dependent on different aspects: the chosen wavelet, the decomposition levels, the thresholding rule (soft or hard), and the thresholds used [24].
In the field of ECG denoising, recent advances in deep learning (DL) have had a significant impact [25,26,27]. DL enables ECG denoising by automatically learning complex patterns and generalising across patients. However, it is computationally intensive, may overfit when training data are limited, and can struggle to adapt to new or unseen conditions of noise. Given the limitations above, simpler methods still find application, as they can also be more easily embedded into wearable devices.
Overall, due to the variability of noise in biological signals, dynamic and adaptive approaches are needed to modify wavelet’s coefficients to preserve the morphological components of the ECG and correctly estimate the location of R-peaks, especially in the presence of consistent noise, which is a common condition when using wearable devices.
In this paper, we present a novel approach designed to address the needs described above by employing a hybrid strategy that combines SWT and template matching. We refer to this method as template masking (TM) and evaluate its performance on noisy signals, particularly in scenarios where noise can significantly overpower the ECG, as is commonly observed in wearable applications. This study evaluates the goodness of TM in simulations, considering clinical ECGs corrupted with synthetic EMGs, and on ECGs collected with dry electrodes and corrupted with real EMGs, to evaluate TM’s performance on signals acquired in a potential wearable device condition. The denoising performance of TM was compared against traditional thresholding techniques employing various threshold selection rules. Additionally, the sensitivity of R-peaks estimation was evaluated and compared across the methods.
The rest of this work is structured as follows. Section 2 is dedicated to a description of the ECG databases, the explanation of the multilayer cylindrical model used to simulate the synthetic EMGs, a brief introduction to WTs and the denoising approaches based on WTs, and a description of our proposal. Section 3 is focused on a comparison between TM and thresholding-based denoising algorithms, considering different noisy signals. Finally, Section 4 and Section 5 are dedicated to the discussion and conclusion, respectively.
2. Materials and Methods
2.1. Datasets
Here, we present in detail the datasets considered to test our proposal in simulation and on experimental conditions. Furthermore, the multilayer cylindrical model used to generate synthetic EMGs for the simulations is presented.
2.1.1. Simulations
For simulations, the MIT-BIH Arrhythmia database [28] was used, which consists of 48 records, each lasting 30 min, of ambulatory ECGs of patients suffering from arrhythmia. The participants’ ECGs were digitised with a sampling frequency of 360 Hz and an 11-bit resolution within the 10 mV range. This study utilised the first of the two available channels. ECGs were high-pass filtered at 0.5 Hz with a 5th-order Chebyshev type II filter with 40 dB attenuation in the stop-band to remove possible motion artifacts.
The multilayer cylindrical model presented in [29] was used to generate synthetic EMG signals (see Figure 1a,b). The model’s parameters were adopted from [30], as detailed below. Skin conductivity was set equal to 2.2 · 10−2 S/m and fat conductivity to 4.0 · 10−2 S/m. In addition, transversal and longitudinal conductivity of the muscle tissue were set at 9.0 · 10−2 and 40.0 · 10−2 S/m, respectively. Concerning the bone conductivity, it was set at 2.0 · 10−2 S/m. For this study, one electrode with a surface of 1.0 mm2 was simulated as aligned to the muscular fibres, as shown in Figure 1a. Concerning the monopolar signal fibre action potentials (SFAPs), they were simulated for fibres with mean semi-lengths of 60 mm with the innervation zones (IZs) in the middle; however, the exact location of fibre ends and IZs were randomly chosen (with uniform distribution) with a range of variation of 10 mm (see Figure 1a). The number of fibres per motor unit (MU) was distributed exponentially, with values between 15 and 300. Furthermore, the density of muscle fibres was 20 per mm2. A total of 400 MUs was considered, and their locations were chosen randomly in the muscle with a uniform distribution. The fibres nearest to the centre of an MU were selected as its members, and their corresponding SFAPs were summed to simulate the motor unit action potential. The conduction velocity (CV) of the MUs was determined using a Gaussian distribution with a mean of 4.0 m/s and a standard deviation of 0.3 m/s. The CV values were assigned following the size principle. Interference signals were simulated according to [31], assuming a recruitment threshold range equal to 70% of the maximal voluntary contraction (MVC). The firing rate (FR) ranged from 8 to 30 Hz, increasing linearly with the force level at a slope of 1 Hz per 1% MVC after MU recruitment, up to the maximum FR. A 10% random Gaussian jitter was applied to the inter-spike interval. Furthermore, white Gaussian noise (representing electronic noise) was added to the simulated EMG so that the power of the EMG was ten times greater than that of the white Gaussian noise.
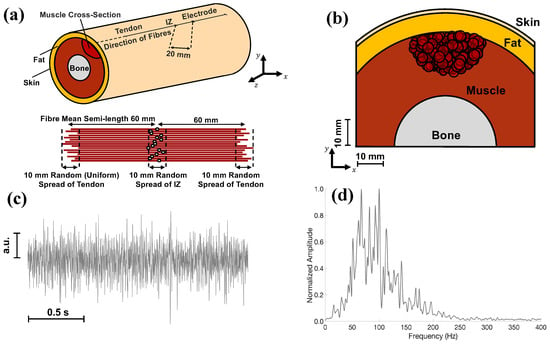
Figure 1.
(a) Graphical representation of the multilayer cylindrical model presented in [29]. The innervation zone (IZ), the tendons, and the electrode are shown on the cylindrical surface. The distance between the IZ and the considered electrode was 20 mm. (b) Transverse view of the multilayer cylindrical model, including bone, muscle, fat, and skin. The red circles indicate the motor units considered for simulations. Notably, the parameters considered for the EMG simulator are the same as in [30]. (c) Portion of the EMG signal, whose total length was 2 s in this image, generated through the model in (a). (d) Power spectral density of the synthetic EMG, estimated through the Welch method, considering epochs of 500 ms, the Hamming window, 50% overlap, and 0.5 Hz resolution. The EMG signals were resampled from 2048 Hz to 360 Hz to match the ECG’s sampling frequency.
An example of simulated EMG is shown in Figure 1c, whereas its power spectral density is depicted in Figure 1d. For the latter’s estimation, the Welch method was used, considering epochs of 0.5 s, the Hamming window, an overlap of 50%, and a resolution of 0.5 Hz. The original sampling frequency of the EMG signals was 2048 Hz. Therefore, EMGs were resampled to match the ECG’s sampling frequencies of the investigated databases (i.e., 360 Hz).
From now on, the ECG will be referred to as the signal (), and the EMG as noise (). Regarding the latter, a force level of 40% MVC was considered, and two conditions were simulated: an isotonic (constant) and an intermittent contraction, respectively. For the intermittent EMG, three contractions lasting 2, 1, and 3 s were simulated. To match the duration of the signal, the corresponding simulated EMG segments were concatenated, creating a noise with the same ECG temporal length, regardless of the type of contraction. For simplicity, to model intermittent contractions, the EMG signals were windowed using Tukey windows, and when the muscles were simulated as inactive, only white Gaussian noise was present. Notice that this is a simplification, as it does not model the gradual activation and deactivation of the muscle. The signal and the noise were uncorrelated, and their combination, hereafter referred to as the noisy signal (), is defined as
To quantify the noise contribution to the noisy signal, the signal-to-noise ratio (SNR) was estimated
where is the power of the signal and the power of the noise.
2.1.2. Experimental Conditions
The SimEMG database [32,33] was considered to test our proposal on experimental ECGs corrupted by EMGs. As stated above, given the experimental set-up (i.e., the use of dry electrodes), the conditions are similar to those of a wearable device. The database includes 110 ECGs collected from different anatomical regions (i.e., wrist and fingers) and multiple sensors from 14 healthy subjects (5 men and 9 women, of age 40 ± 13, mean ± standard deviation). ECGs were collected using a custom 12-lead ECG device that exploits the 24-bit Texas Instruments A/D converter. Each recording lasted 30 s. To compare the results between the datasets, signals were resampled at 360 Hz.
The signals were recorded while participants were in a supine position with their arms resting alongside the body (posture 1), with their forearms touching the hips at roughly a 45-degree angle to the bed (posture 2), and with their forearms perpendicular to the bed (posture 3). Each subject held clips in their hands and was instructed to press them using their thumb and index fingers to produce EMG noise. An additional ECG recorded on the shoulder served as a reference, since muscle activity did not affect it. For further details on data acquisition, we refer the reader to [32].
ECGs were already pre-filtered. More specifically, baseline wander was eliminated using a 5th-order high-pass Butterworth filter with a cut-off frequency of 1 Hz. Power line interference was suppressed by a 2nd-order IIR notch filter at 50 Hz. Additionally, a 2nd-order low-pass Butterworth filter with a cut-off frequency of 100 Hz was applied to remove high-frequency components.
Two types of electrodes were used to record the ECGs from the fingers: wet and dry. In this study, only the recordings from the dry electrodes (“ORB”) were considered. Dry electrodes are known to provide a lower SNR than wet ones, mainly due to higher skin–electrode impedance and greater vulnerability to motion artifacts. Concentrating on dry electrodes enabled us to test the method in more demanding conditions, similar to an acquisition with a wearable device. The database includes 37 records with “ORB” in their names, which were selected for the subsequent analysis.
2.2. Methods
Here, we describe the methods, starting with a brief introduction to the WT, followed by the most common thresholding strategies, and concluding with a description of our proposal.
2.2.1. Wavelet Transforms
The continuous wavelet transform (CWT) can be defined as
where is the signal to be investigated, and is the mother wavelet, from which her daughters are obtained changing the scale (s) and translation () factors
The discrete wavelet transform (DWT) is formulated similarly to Equations (3) and (4), but scale and translation factors are powers of two (i.e., and )
What unites CWT and DWT is their ability to decompose a signal into components at different frequency scales. In the case of DWT, this is achieved through a recursive filtering process using high-pass and low-pass filters, resulting in detail () and approximation () coefficients. While CWT does not use this filter bank approach, it similarly analyses the signal at multiple scales by convolving it with scaled and translated versions of a mother wavelet. Unlike the CWT, the DWT down-samples the signal by a factor of two after each filtering stage, producing orthogonal basis functions that enable efficient and fast computation [18]. On the other hand, CWT is a redundant transform since all the continuous values of s and are considered.
An extension of the DWT is the SWT, which avoids decimation in the time domain, making it a redundant transform [20]. In other words, the typical down-sampling of the DWT is replaced with an up-sampling, overcoming some DWT limitations, e.g., translation invariance and lower time resolution at low frequencies [1,19]. Even though an increased redundancy in coefficients occurs, the benefit is in avoiding the extra artifacts brought about by time-domain down-sampling at larger sizes [19].
2.2.2. Wavelet Thresholding
WTs are suggested to overcome the limitations of the traditional filters, whose performance is reduced when the spectrum of the signal of interest overlaps significantly with the noise one. Indeed, in the WT domain, signal and noise are more effectively separated compared to representations based solely on time or frequency.
For denoising purposes, wavelet thresholding can be adopted, and its effectiveness depends on the type of wavelet, the decomposition levels, the choice of threshold, and how this threshold is applied to the coefficients [24,34]. In particular, the thresholding process is typically applied to the detail coefficients, while the approximation coefficients are generally preserved without modification [24]. Different thresholding rules are available, and the most popular are certainly the soft and hard thresholding, defined in the same order below
where stands for the threshold, j indicates the investigated level, and k the sample considered. Overall, soft thresholding reduces the coefficients that exceed the threshold, resulting in a decrease in signal amplitude. On the other hand, hard thresholding introduces discontinuities into the detail coefficients, which can generate undesired oscillations in the time domain, also referred to as pseudo-Gibbs phenomena [24].
As concerns thresholding, the threshold depends on the noise intensity
where indicates the magnitude of the noise and depends on the threshold selection rule, which will be discussed next. If the noise is Gaussian and white, it is possible to estimate its magnitude through the standard deviation of the SWT coefficients of the first decomposition level
In that case, the resulting is level-independent, and if the noise is not white, which is a common aspect in physiological signals (e.g., for the neural activity [24]), it is preferable to have a level-dependent approach by calculating for each decomposition level (j).
Regarding estimation, different approaches exist. In the context of the SWT, the most commonly used selection methods include the universal threshold, the minimax threshold, the adaptive threshold based on Stein’s unbiased risk estimate (also known as rigrsure in the MATLAB implementation), and the heuristic variant, which combines the latter and the universal threshold [35,36]. All the thresholds are implemented in MATLAB and were considered in this study for comparison with our proposal.
2.2.3. Template Masking
The implementation of TM needs some preparatory steps. To begin, a reference ECG waveform must be estimated to serve as a template. This template is derived from analysing the first 5 s of each recording. The waveforms are identified, aligned, and then averaged to produce the final template. An example template can be appreciated in Figure 2a, relative to subject 101.
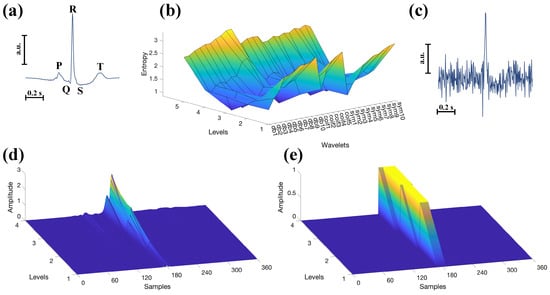
Figure 2.
(a) ECG template from subject 101: 5 s of signal were considered for its estimation. (b) Entropy values for different decomposition levels and wavelets. The optimal decomposition level and mother wavelet were selected based on the criterion of minimum entropy on the details coefficients. (c) Corrupted version of the signal in (a) with SNR of 0 dB. To denoise this signal, the chosen decomposition level was 4 and the optimal wavelet, estimated in (b), was “coif1”. (d) Rectified details coefficients for the ECG waveform depicted in (a). (e) Example of binary mask used for the TM.
Subsequently, the template is used to estimate the optimal mother wavelet for each subject from a set of candidates, which is then applied to process the remaining ECG signal. This research is performed to minimise the entropy of the detail coefficients, thus guaranteeing a compact representation of the template in the SWT domain. Up to 5 decomposition levels and three wavelet families, commonly used for processing the ECG [37], are considered: Daubechies (db1, db2, db3, db4, db5, db6, db7, db8, db9, and db10), Coeiflets (coif1, coif2, coif3, coif4, and coif5), and Symlets (sym1, sym2, sym3, sym4, sym5, sym6, sym7, sym8, sym9, and sym10), for a total of 25 orthogonal wavelets (see Figure 2b). It is worth mentioning that since SWT requires the signal length to be a power of two, additional samples equal to the signal’s median are appended if necessary to meet this requirement.
The Shannon entropy (H) of the details, whose numerosity is equal to N, is then calculated for each wavelet () and decomposition level (j)
and the minimum of H is estimated in order to extract the optimal wavelet () and the optimal “temporary” decomposition level ()
Once the mother wavelet is estimated, the noisy signal is considered (see Figure 2c), and the entropy of the details coefficients is estimated again, but only varying the decomposition levels. The decomposition level at which entropy is minimised is selected, and the temporary decomposition level is updated accordingly. The term “temporary ” is used because entropy minimisation is performed for each new noisy signal, resulting in an updated decomposition level every time a new noisy signal has to be processed.
Notably, the use of the optimal wavelet–decomposition level pair in the entropy sense would generate concentrated coefficients among the levels. This is illustrated in Figure 2d, which shows the rectified detail coefficients of the template in Figure 2a, thereby enabling their inclusion in a binary mask, like the one shown in Figure 2e.
The estimation of that binary mask is the last of the preliminary steps. The mask edges are derived from the centred discrete normalised gradient of the rectified detail coefficients, by identifying values that exceed 0.1 (value chosen by a fine-tuning on a few data). Then the region included in the edges is filled with ones, and the rest is set to zero. It is worth mentioning that after the optimal wavelet estimation, the research for the temporary decomposition level is performed on levels 3 to 5, to avoid the risk of having small masks.
Once the preliminary steps are performed, the TM can be implemented. A pipeline of the whole algorithm is depicted in Figure 3 and consists of 6 steps. Steps (1) and (2) are already presented and are relative to the temporary decomposition level estimation through the entropy minimisation strategy from the noisy signal, and perform the SWT. Then, the binary mask is aligned in the time domain in correspondence to each waveform (3). The alignment is obtained through a cross-correlation with the template (i.e., template matching), considering the details coefficients of both the noisy signal and the template at the last level of decomposition. To detect the peak(s) for the alignment, a threshold equal to 2 times the standard deviation of the cross-correlation was considered. Thereafter, the mask is applied only to the detail coefficients (4), and the non-zero coefficients in each level are substituted with a cubic smoothing spline interpolation (5), with a smoothing parameter (S) to reduce the contribution of noise, which may manifest with abrupt changes in the coefficients. The smoothing parameter is level-dependent, and it is estimated as
where represents the variance in the detail coefficients of the template at level j, and is the corresponding variance for the noisy signal at the same level. The maximum value of S was limited to 1. For , the fit is linear, and for , it is a natural cubic spline; as S varies between 0 and 1, the smoothing shifts gradually from the linear fit to the spline. As depicted in Figure 3 (step 5), the coefficients transition gently toward zero rather than abruptly, helping to avoid potential Gibbs effects. Finally, the inverse SWT (ISWT) is performed, obtaining the denoised signal (6). Overall, TM seeks to mimic an adaptive thresholding approach by setting to zero the detail coefficients that do not correspond to the ECG waveform, while retaining and smoothing the relevant ones to mitigate the effect of noise. Furthermore, by moving to the SWT domain (where signal and noise are expected to be partially separated) the method aims to overcome the intrinsic limitation of template matching, which relies on the temporary localisation of an ECG template around an R-peak.
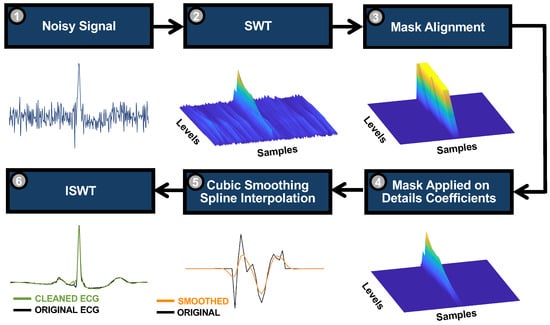
Figure 3.
Algorithm pipeline. Once the mother wavelet is defined, the noisy signal (1) is considered, and the signal is decomposed considering the mentioned wavelet and the new estimated temporary decomposition level (2). For this example, the signal in Figure 2c was considered. Once the mask is aligned with the noisy ECG through template matching (3), it is applied to the detail coefficients (4), preserving their sign for the next step. The non-zero coefficients are interpolated with a cubic smoothing spline (5), and the inverse SWT is performed (6).
2.3. Performance Evaluation
This section presents the tests conducted to assess the effectiveness of our proposal in comparison with thresholding methods, as well as the corresponding statistical analysis.
2.3.1. Performance Indexes
Concerning simulations, different noisy conditions were evaluated. The denoising performance of TM and thresholding techniques was estimated on blocks of 1 s, considering all the subjects of the whole dataset. The choice to conduct this analysis was to simulate a real-time signal acquisition.
Still on simulations, we evaluated the denoising performance on both constant and intermittent EMGs, varying the SNRs from 10 to −10 dB, with steps of 5 dB. The signals were corrupted with noise before being segmented into 1 s blocks. Since the original ECG is available and noise is artificially added as described in Equation (1), the effectiveness of the denoising algorithms was quantified using the normalised root mean square error (NRMSE)
where indicates the output of the denoising algorithm. For each subject, we estimated the average NRMSE by considering all 1 s blocks and TM’s performance was compared with both hard and soft thresholding approaches, considering as thresholding selection rules the ones presented in Section 2. Notably, to normalise the reconstruction error of each block, we used the original signal as the denominator in Equation (13). Due to the nature of the noise, a level-dependent approach was considered for the estimation of the thresholds. It is worth mentioning that the thresholding methods were applied to the SWT obtained with the same wavelet and decomposition levels as those employed by the TM.
In addition, the sensitivity of the R-peaks estimation was evaluated considering a tolerance of ±5 samples
where indicates the true positive and the false negative. The considered tolerance results in a heart rate estimation error of less than 3%. This analysis focused on signals exhibiting a marked drop in sensitivity (i.e., median sensitivity below 95%), which for tests on simulations happened with noisy signals at −5 and −10 dB. Note that sensitivity values can be estimated a priori from the noisy signal, before any denoising pipeline is applied. For automatic peaks detection, the Pan–Tompkins algorithm [38] implemented in [39] was used.
Regarding the tests emulating acquisitions with wearable device, two tests were conducted. First, an evaluation of the denoising performance of the investigated methods was carried out considering the available noisy signals. The NRMSE was used as a performance index, in a way similar to the simulations described above. Since the sensitivity of R-peaks estimation for the original noisy signals was close to 100%, a comparison with the denoising methods was omitted.
Secondly, since ECGs recorded from another anatomical region (the shoulder) were available, the noise contribution in the corrupted signals was estimated by subtraction (see additive model in Equation (1)). This is admittedly an approximation, as the volume conductor filters the ECG differently depending on the acquisition site, but the residual (visually inspected) appeared to be fairly small (however, effectively making the evaluation more conservative). Then, the noise was summed to the clean data after amplitude scaling to obtain different SNRs, which were varied from −10 to 10 dB in steps of 5 dB, similarly to what was performed for simulations above. Again, the NRMSEs were computed and compared across the methods. Additionally, the sensitivity in R-peaks identification was evaluated with SNR of −10 dB, as in that case the median sensitivity of the noisy signals falls below 95%.
Simulations and tests were performed with MATLAB® (MathWorks, Inc., Natick, MA, USA, R2025a) on a workstation (AMD Ryzen 7 9700X CPU [8 physical cores, 16 logical threads, 3.8 GHz] and 64 GB of RAM).
2.3.2. Statistical Analysis
Concerning the statistical analysis, to test the effects of multiple methods, we applied the 2-way ANOVA Scheirer Ray Hare test [40], considering the denoising methods and subject as factors without interaction terms to account for repeated measurements. In the presence of significant effects detected by ANOVA, pairwise comparisons were performed using Wilcoxon signed-rank tests. A significance level () of 0.05 was adopted for all analyses.
3. Results
The efficacy of our proposal was tested first on a single template, as shown in Figure 4, which takes into account the same ECG waveform investigated in Figure 2. The performance of the different thresholding selection rules is reported in Figure 4d–h. For this example, the hard thresholding rule was considered. This preliminary test on a single subject shows that TM yielded the lowest NRMSE.
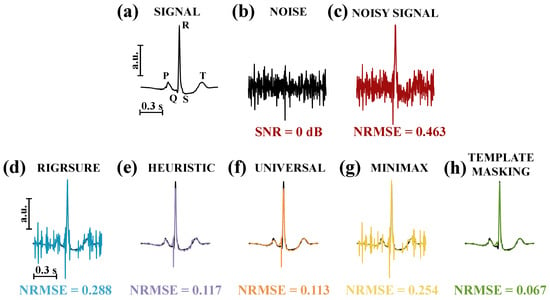
Figure 4.
(a) Signal: clean ECG from subject 101. (b) Noise: EMG used to corrupt the signal. (c) Noisy signal: corrupted ECG with an SNR equal to 0 dB. (d–h) Denoising performance in terms of NRMSE for the hard thresholding considering the Stein’s unbiased risk estimate method (Rigrsure), the heuristic, the universal, and minimax threshold selection rules and template masking. To facilitate the comparison, the clean ECG waveform (in black) is superimposed on the cleaned signal.
A second preliminary test was conducted on 10 s of corrupted ECGs (SNR at 0 dB). Results from four subjects are shown in Figure 5. The original ECG is coloured in black, whereas the grey and green ones represent the corrupted and the cleaned signals, respectively. Notably, the original signal is superimposed on the TM’s output to visually assess the quality of the reconstruction, assessed through NRMSE. In addition, at the bottom right side of each figure, the template is depicted. The ECG in Figure 5a belongs to the same subject in Figure 2 and Figure 4, whereas the remaining figures show ECGs from other subjects, with two cases of participants manifesting different waveforms than the template in the record. The performance of TM on intermittent EMGs can be observed in Figure 6, which also illustrates the type of noise used in the tests (see Figure 6a).
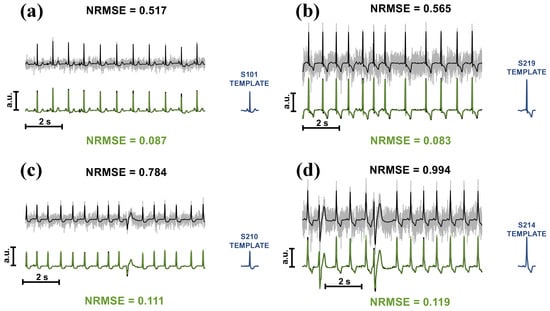
Figure 5.
Performance of the TM algorithm on 10 s ECGs corrupted with EMGs. Subjects 101 (a), 219 (b), 210 (c), and 214 (d) were considered. The original clean signals are shown in black, the corrupted ones in grey, and the cleaned ones in green. Each record was corrupted with an EMG to obtain an SNR equal to 0 dB. The NRMSE in black indicates the error before the denoising process, whereas the one in green is at the end of the process.
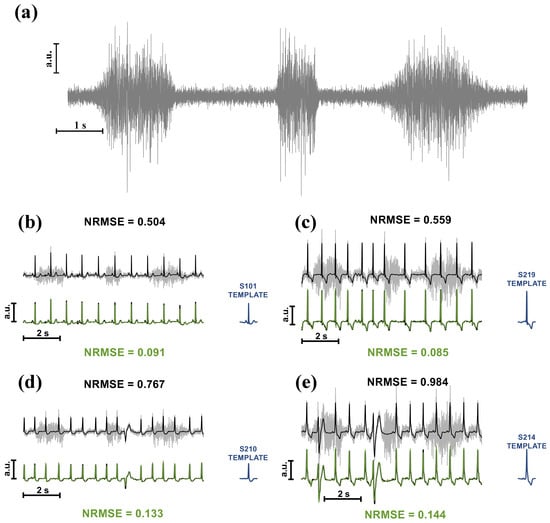
Figure 6.
(a) Graphical representation of the intermittent EMG. Three contractions were simulated, lasting 2, 1, and 3 s, respectively. To simulate an intermittent contraction, EMGs were windowed using Tukey windows. An SNR of 0 dB was considered for this example. (b–e) Same as Figure 5, but considering the ECG corrupted with intermittent EMGs.
Figure 7 shows the results of the full dataset analysis on constant and intermittent contractions using hard and soft thresholding rules. As stated in the Section 2, the average NRMSEs for each subject were considered, and TM’s performance was compared with four threshold selection rules: rigrsure (RIG), heuristic (HEU), universal (UNI), and minimax (MIN). Figure 7 is divided into two rows: the first is relative to the constant EMG contractions, whereas the second assesses the impact of intermittent EMG. The solid lines indicate the median of the distributions, whereas the patches represent the range between the 25th and 75th percentile. A marker is shown in correspondence with the SNR value on the x-axis when all comparisons with the TM are statistically significant (). For constant EMG contractions, results indicate that TM yielded lower NRMSE when compared to the traditional thresholding selection rules from SNRs below 5 dB. Similar results can be appreciated for intermittent EMG contractions. Indeed, TM always led to statistically significant improvements (), regardless of the thresholding rule: hard (Figure 7c) or soft (Figure 7d).
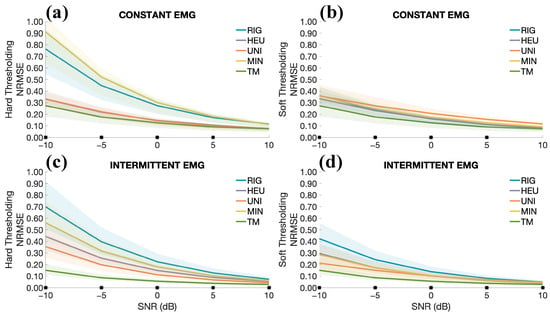
Figure 7.
Performance comparison of the denoising methods considering the constant and intermittent EMG contractions. The abbreviations correspond to the following threshold selection rules: rigrsure (RIG), heursure (HEU), universal (UNI), and minimax (MIN). (a) Average NRMSEs at different SNRs, ranging from 10 dB to −10 dB for constant EMG contractions and hard thresholding. The solid lines indicate the median across all the subjects, whereas the patches indicate the range between the 25th and 75th percentiles. (b) Same as (a), but considering soft thresholding. (c,d) Same as (a,b), but considering intermittent EMGs. Only pairwise comparisons with our proposal are considered. The marker (*) on the x-axis indicates that all pairwise comparisons revealed statistically significant differences () in favour of the TM.
Additionally, we investigated the chosen wavelets and decomposition levels for all the subjects. In Figure 8a it is possible to appreciate the occurrence in percentage of the investigated wavelets, whereas the rest of the image is dedicated to the decomposition levels for two noisy conditions (10 and −10 dB) and noise type: constant (see Figure 8b) and intermittent (see Figure 8c). Regarding Figure 8a, no single wavelet emerged as most dominant, whereas the decomposition levels tend to shift toward higher values with the higher noise, but not clearly for the intermittent contraction.
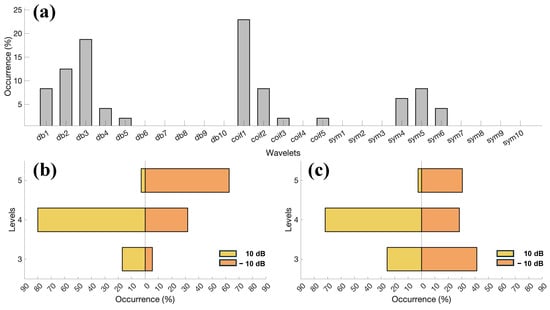
Figure 8.
(a) Occurrence of the investigated wavelets in all the participants, expressed as a percentage. (b) Occurrence of decomposition levels for all the participants and epochs for constant EMG contractions. Two noisy conditions were evaluated: at 10 dB (yellow) and −10 dB (orange). (c) Same as (b), but considering the intermittent EMG contractions.
The sensitivities of the R-peaks estimation are depicted in Figure 9, considering the two thresholding rules (hard and soft) and the two types of noise (constant and intermittent contractions). For additional comparison, the sensitivities of R-peaks estimation for the noisy signals (NS), i.e., before the cleaning process, are shown. Except for two comparisons (TM vs. HEU-Hard and TM vs. RIG-Soft), results in Figure 9a (considering constant noise and SNR = −5 dB) indicate a statistically significant improvement in sensitivity when using TM (, except for the case TM vs. HEU-Soft, showing a lower significance, i.e., ). However, the median value of the distribution in TM (96.15%) was the highest among the methods. Results depicted in the rest of Figure 9 show a substantial improvement in sensitivity, with statistically significant differences () consistently favouring the TM method. Specifically, sensitivity reaches approximately 92.34% in the case of constant contractions and 90.37% for intermittent contractions.
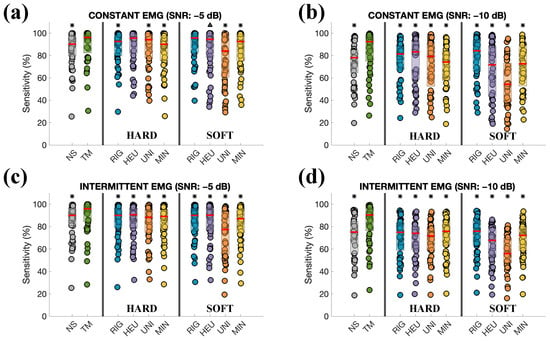
Figure 9.
(a) Sensitivity of R-peaks estimation considering all the subjects and the denoising method for the constant EMG contraction (SNR −5 dB). NS indicates the distribution of sensitivity for the noisy signals before the denoising process. The thresholding rule (hard or soft) is indicated in the bottom part of each Figure. The red line indicates the median of the distribution. (b) Same as (a), but with SNR of −10 dB. (c,d) Same as (a,b), but considering an intermittent EMG. Only pairwise comparisons with our proposal are considered, and statistically significant differences with TM are shown with △ for and with * for on top of each distribution.
Results relative to the experimental tests are depicted in Figure 10 and Figure 11. An example of a clean (from the shoulder) and noisy ECG is shown in Figure 10a, as well as the EMG estimated from the noisy signal by subtracting the clean ECG. To characterise the time series, the SNRs of the noisy signals were estimated and reported in Figure 10b. Notably, for the considered noisy signals, most of them have an SNR between 0 and 4 dB. The denoising performance of the methods, expressed in terms of NRMSE, is reported in Figure 10c. Even in this case, TM yielded a significantly lower NRMSE compared to the other methods ().
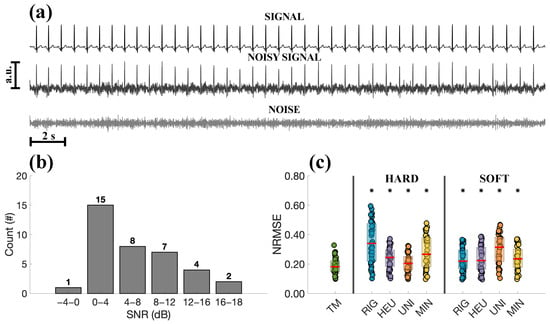
Figure 10.
Tests on SimEMG database. (a) Clean ECG (recorded from the shoulder), noisy ECG from the participant’s finger, and estimated EMG, obtained by subtracting the two signals (Subject P11_4_ORB). (b) Estimated SNRs of the investigated ECGs from the SimEMG database. (c) Comparison in terms of NRMSE between TM and the other thresholding methods. The red line indicates the median of the distribution. Statistically significant differences are indicated with * for .
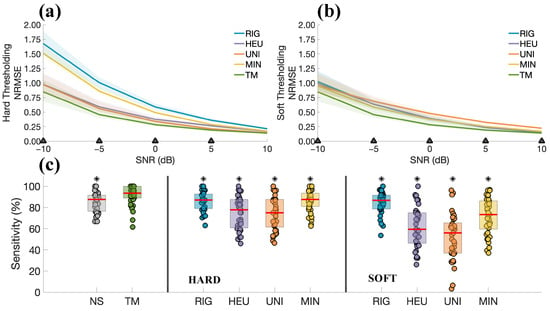
Figure 11.
(a) Comparison between TM and thresholding methods in terms of NRMSE, using ECGs from the SimEMG database with artificially modified SNRs. The solid lines indicate the median across all the subjects, whereas the patches indicate the range between the 25th and 75th percentiles. The marker (△) on the x-axis indicates that all pairwise comparisons revealed statistically significant differences () in favour of the TM. (b) Same as (a), but considering soft thresholding. (c) Comparison of the denoising methods in terms of the sensitivities of the R-peaks estimation on signals with an SNR of −10 dB. NS stands for “noisy signals”, i.e., before the denoising process. The thresholding rule (hard or soft) is indicated in the bottom part of the figure. Statistically significant differences are indicated with * for .
Figure 11a,b show the results considering different SNRs. TM led to significantly lower NRMSE than other methods, specifically for SNRs below 5 dB and 10 dB for the techniques based on the hard and soft thresholding rules, respectively (see Figure 11a,b). The rest of Figure 11 is dedicated to the comparison of the sensitivity in R-peaks estimation (SNR equal to −10 dB). Results show that TM yielded significantly higher sensitivity than the other methods (), with a median value of 93.54%.
4. Discussion
Given the critical role of ECG signals in clinical and diagnostic applications [41], effectively mitigating the impact of exogenous and endogenous interferences remains essential. This need becomes even more pressing in out-of-hospital settings, where wearable devices are now being used [42]. In addition to the importance of R-peaks detection, e.g., for heart rate variability (HRV) estimation [43,44], other ECG features related to the P and T waves have also been shown to be important. For example, in estimating acute mental stress [45], thus highlights the necessity of reliable denoising algorithms even in situations of unfavourable SNRs. Among endogenous sources, EMGs significantly contribute to signal degradation [46], particularly when ECG electrodes are placed on muscle-rich regions prone to contraction, such as the arms [47]. This results in a signal being severely degraded by noise, requiring advanced algorithms for its mitigation.
For this purpose, we present a novel approach for ECG denoising by combining SWT with template matching. First, clinical ECGs (i.e., records from the MIT-BIH dataset) were corrupted with EMGs simulated with a model with a multilayer cylindrical volume conductor. Regarding noise generation, with respect to previous studies, this work adopts a richer and more detailed model that accounts for several factors, such as the position of the IZs, the number of MUs, tissue conductivity, and MU recruitment during voluntary contractions. Indeed, this approach allows for a more detailed and physiologically meaningful interpretation of noise if compared to the commonly used coloured Gaussian noise in similar studies like [13]. Two types of EMGs were simulated: constant and intermittent. Secondly, the method was tested on ECGs recorded with a set-up similar to a wearable condition (i.e., with dry electrodes), also corrupted with real EMGs. Given the availability of an additional ECG free from noise, SNRs were also varied to simulate challenging noisy conditions.
To evaluate the effectiveness of our proposal, some of the most common thresholding methods and threshold selection rules were considered, i.e., UNI, MIN, HEU, and RIG [35]. Given the nature of the noise (i.e., not white Gaussian), a level-dependent approach was adopted for estimating (see Equation (9)).
Similarly to the template matching algorithm, estimating the reference ECG is essential (see Figure 2a). For this study, we decided to consider the first 5 s of the record for the estimation of the reference template. However, longer records in rest conditions can be considered, or periodic recalibration to obtain a more reliable estimation. It is worth mentioning that the use of a reference ECG and SWT is not new. Indeed, another study considered the combination of template matching and SWT for denoising the ECG [22], but with some differences. More specifically, the latter employs a multi-level thresholding approach using multiples of the universal threshold, as well as a fixed wavelet and decomposition level. Regardless of the threshold selection rule, with our study, we demonstrated the importance of an optimised wavelet–decomposition level, which led to a significant reduction in noise even in unfavourable SNRs. Furthermore, we also took into account the detail coefficients at the low decomposition levels (e.g., the first and second), which were arbitrarily set to zero in [22]. Although these coefficients are often dominated by noise, they may still contain valuable information related to the target signal. Discarding them entirely can lead to imperfections in signal reconstruction, such as the loss of high-frequency components critical for accurately capturing important features like the R-peaks.
When dealing with SWT, both the choice of the wavelet and of the decomposition level are crucial factors to consider as they significantly influence denoising algorithms [24]. The decomposition level, in particular, plays a vital role, as beyond a certain point, further decomposition may decrease denoising performance and increase computational cost [36]. For this reason, an entropy minimisation approach was considered to obtain the optimal wavelet and decomposition level, which could lead to prevalent and concentrated coefficients (see Figure 2d), then selected by a binary mask to clean the signal. Notably, the use of entropy minimisation to guide the choice of decomposition level finds application in other studies like [34], reinforcing the methodological strength of our pipeline.
A key component of TM is certainly the binary mask. Notably, this mask depends on the rectified coefficients and their concentration (see Figure 2d). More concentrated coefficients lead to narrower masks, thus making them less susceptible to noise corruption. Once estimated, the binary mask can be applied to the corrupted details after the alignment, and, in the case of multiple waveforms, the mask is aligned in correspondence with each peak. In contrast to template matching, which imposes a fixed reference waveform at a specific point, our method exploits a binary mask to accommodate potential morphological variations in the ECG waveform. Indeed, thanks to the binary mask and the cubic smoothing spline interpolation (see step 5 of Figure 3), it is possible to preserve the morphological shape of the ECG waveform even in the presence of consistent noise.
The effect of applying the mask to waveforms that differ from the reference becomes apparent in Figure 5. With particular reference to Figure 5c,d, instead of setting the coefficients corresponding to these different ECG waveforms to zero, they are preserved and smoothed to mitigate the effect of noise. Similar comments can be made for Figure 6, which considers intermittent EMG contractions.
As stated above, the goodness of TM was first assessed on simulations, varying the type of contractions (constant or intermittent), and considering epochs of 1 s at a time, simulating a real-time acquisition and processing. Results in Figure 7, which consider hard and soft thresholding rules, indicate that TM outperformed the other methods regardless of the type of contractions. Overall, an improvement in the average NRMSE was obtained when dealing with low SNRs. It is worth noting that the tests were intentionally conducted under unfavourable conditions. While the reference signal used by TM remained constant for each subject throughout the tests, updating it over time could potentially improve performance, thus allowing for compensation of slow drifts in the signal (e.g., due to gradual electrode displacement or sweating).
Concerning the tests on intermittent contractions, the insufficient performance of traditional thresholding algorithms is primarily due to the way their thresholds are estimated. These methods rely heavily on the robust standard deviation (see Equation (8)), which is calculated using the median of the coefficients, as described in Equation (9). Consequently, for recordings with intermittent EMG activity, in which some coefficients are close to zero for the absence of noise, traditional thresholding methods tend to fail, highlighting the need for an adaptive and continuous threshold estimation approach.
In general, our approach aims to emulate an adaptive thresholding method by setting to zero the coefficients unrelated to the ECG waveform, while preserving and smoothing the relevant ones to minimise the impact of noise. Results of simulations indicate that the proposed method is effective, achieving significant reductions in NRMSE in various noise conditions. This improvement is particularly pronounced at low SNRs, for which this method was mainly designed (see Figure 7).
To test whether our proposal considers different wavelets and decomposition levels under various conditions, an additional analysis was performed. Figure 8a considers the occurrence of the investigated wavelets (expressed in percentage) for all the participants. The results do not point to a single dominant wavelet, highlighting the importance of adapting the wavelet selection to each individual. Interestingly, some wavelets were either never considered or hardly considered. For this reason, they could be excluded from the extensive research in the preliminary phase, thus speeding up the time required for that step. As an example, using our workstation, the time required to identify the optimal wavelet processing a 5 s epoch in the preliminary step was 35.53 ± 40.52 ms (mean ± standard deviation). On the other hand, the time required to process online the 1 s epochs was 2.15 ± 0.85 ms for the TM and 0.76 ± 0.23 ms for the thresholding methods. Concerning the adopted wavelets, the results indicate that low-order wavelets were the most frequently considered, which is consistent with [37]. This may be attributed to the fact that higher-order wavelets have more complex shapes, making them less similar to the QRS complex.
The necessity of an adaptive approach can be appreciated also for the decomposition level, as depicted in Figure 8b,c. Two SNRs were considered: 10 dB and −10 dB. Regarding low SNRs, a shift toward a higher decomposition level is observed for the test with constant EMG noise (see Figure 8b). Surprisingly, the trend is not so evident for the intermittent contractions (see Figure 8c). Indeed, the decomposition level that occurs the most is 3. The result may be due to several factors, one of which is that in signals dominated by white Gaussian noise, where its contribution is comparable to that of the target signal, the entropy values tend to become similar across all decomposition levels, thereby reducing the effectiveness of the minimisation criterion. However, it is important to note that the simulated white Gaussian noise was intentionally significant and represents a particularly challenging condition, which is unlikely to occur in practice when the electrode–skin impedance is low.
Still considering the number of decomposition levels, it is important to clarify that TM depends heavily on the signal’s sampling frequency. High sampling frequencies require more decomposition levels, which in turn lead to increased computational cost and memory requirements. For the reasons mentioned above, we consider excessively high sampling rates unnecessary and, if needed, suggest applying down-sampling before TM.
Still on simulation results, the sensitivity of R-peaks estimation was explored and shown in Figure 9, which explored both thresholding methods and types of muscle contractions. The analysis was performed on signals with SNRs of −5 and −10 dB, as they were the cases in which the use of noisy signals led to inaccurate R-peaks identification. In these most challenging noise scenarios, the TM method achieves statistically higher accuracies than the other methods.
Results on ECGs corrupted with real EMGs and collected with dry electrodes (thus simulating a wearable device acquisition) show that TM achieves a lower NRMSE than the other methods (see Figure 10). Since the available ECGs span a range of SNRs (see Figure 10b), additional tests were carried out to evaluate the performance of TM under different noise conditions, varying the amplitude of the EMGs to modulate the SNRs. The outcomes are shown in Figure 11a,b. Even in the presence of real EMG artifacts, TM provided statistically significant improvements over thresholding methods, particularly for SNRs below 5 dB. Regarding the latter tests, it should be noted that subtracting the “reference” ECG recorded from the shoulder from the noisy signals introduces artifacts, due to differences in sensors and volume conductor. Therefore, its reasonable to assume that the resulting noise will not have only EMG components, thus justifying the importance of the simulations, in which both the signal and noise can be perfectly separated and analysed.
Figure 11c presents the sensitivity of R-peaks estimation, for signals corrupted with an SNR of –10 dB. Results indicate that TM statistically outperformed the thresholding approaches, confirming the positive results obtained with simulations and suggesting that the method preserves high sensitivity even under severe noise conditions.
Despite the positive results, this work has some limitations. Further studies are necessary to validate the method on different conditions, e.g., on ECGs recorded with a smart garment (like the one in [47]) during multiple biceps contractions at varying force levels. Tests could be performed on both healthy subjects, for which we expect better denoising performance since the ECG template will not differ significantly during the test (as demonstrated with the ECGs from the SimEMG database), and patients, which we tried to investigate with the MIT-BIH database in this study. To test the algorithm under critical conditions, it is worth noting that both the waveform and corresponding binary masks were voluntarily not updated over time in this study. However, these aspects should be taken into account for further studies, especially when waveform changes are expected, such as during physical activity [48]. Among the limitations of our study, we acknowledge the absence of benchmarking (e.g., against other decomposition methods) beyond thresholding approaches, which represents an important direction for future research. Another potential limitation concerns the sampling frequency. Lowering it could reduce the resolution needed to accurately estimate R-peaks, which are crucial for HRV analysis. However, since the upper frequency limit of the ECG is approximately 100 Hz [49], a sampling frequency of 250 Hz would satisfy the sampling theorem [50], enable reliable HRV estimation [51], reduce memory and energy requirements [52], and allow our method to operate with low computational cost due to the limited number of decomposition levels analysed.
5. Conclusions
Despite the growing diffusion of wearable devices for continuous biological signal acquisition, collecting records of good quality remains a challenge, making denoising algorithms for reducing the effect of exogenous and endogenous sources, like the EMG, necessary. With this study, we present a novel denoising algorithm that exploits both the SWT and template matching. Compared to traditional thresholding methods with various selection rules, our approach allowed us to obtain better signal reconstructions across different SNRs. Furthermore, statistical improvements in the sensitivity of R-peaks estimation were obtained in signals with low SNRs, indicating that the method maintains high sensitivity even under severe noise. Future research using signals collected from wearable devices during dynamic contractions will enable a more comprehensive evaluation of our method’s effectiveness and could pave the way for broader applications.
Author Contributions
Conceptualisation, M.R.; methodology, M.R. and L.M.; software, M.R.; validation, M.R.; formal analysis, M.R.; investigation, M.R.; resources, L.M.; data curation, M.R.; writing—original draft preparation, M.R.; writing—review and editing, L.M.; visualisation, M.R.; supervision, L.M. All authors have read and agreed to the published version of the manuscript.
Funding
This work was financially supported by the European Union—NextGenerationEU.
Data Availability Statement
The data presented in this study are available in Physionet at https://physionet.org/content/mitdb/1.0.0/ and Mendeley at https://data.mendeley.com/datasets/yx5pb66hwz/1 reference numbers [30] and [33], respectively. Simulated EMGs can be provided under reasonable request to the corresponding author.
Conflicts of Interest
The authors declare no conflicts of interest.
Correction Statement
This article has been republished with a minor correction to the Data Availability Statement. This change does not affect the scientific content of the article.
References
- Mc Namara, K.; Alzubaidi, H.; Jackson, J.K. Cardiovascular disease as a leading cause of death: How are pharmacists getting involved. Integr. Pharm. Res. Pract. 2019, 8, 1–11. [Google Scholar] [CrossRef]
- King, C.E.; Sarrafzadeh, M. A survey of smartwatches in remote health monitoring. J. Healthc. Inform. Res. 2018, 2, 1–24. [Google Scholar] [CrossRef]
- Hwang, S.; Lee, S. Wristband-type wearable health devices to measure construction workers’ physical demands. Autom. Constr. 2017, 83, 330–340. [Google Scholar] [CrossRef]
- Li, M.; Xiong, W.; Li, Y. Wearable measurement of ECG signals based on smart clothing. Int. J. Telemed. Appl. 2020, 2020, 6329360. [Google Scholar] [CrossRef]
- Fernández-Caramés, T.M.; Fraga-Lamas, P. Towards the Internet of smart clothing: A review on IoT wearables and garments for creating intelligent connected e-textiles. Electronics 2018, 7, 405. [Google Scholar] [CrossRef]
- Soroudi, A.; Hernández, N.; Berglin, L.; Nierstrasz, V. Electrode placement in electrocardiography smart garments: A review. J. Electrocardiol. 2019, 57, 27–30. [Google Scholar] [CrossRef]
- Tong, W.; Kan, C.; Yang, H. Sensitivity analysis of wearable textiles for ECG sensing. In Proceedings of the 2018 IEEE EMBS International Conference on Biomedical & Health Informatics (BHI), Las Vegas, NV, USA, 4–7 March 2018; IEEE: New York, NY, USA, 2018; pp. 157–160. [Google Scholar]
- Lu, G.; Brittain, J.S.; Holland, P.; Yianni, J.; Green, A.L.; Stein, J.F.; Aziz, T.Z.; Wang, S. Removing ECG noise from surface EMG signals using adaptive filtering. Neurosci. Lett. 2009, 462, 14–19. [Google Scholar] [CrossRef]
- Thakor, N.V.; Zhu, Y.S. Applications of adaptive filtering to ECG analysis: Noise cancellation and arrhythmia detection. IEEE Trans. Biomed. Eng. 1991, 38, 785–794. [Google Scholar] [CrossRef] [PubMed]
- Kahankova, R.; Mikolasova, M.; Martinek, R. Optimization of adaptive filter control parameters for non-invasive fetal electrocardiogram extraction. PLoS ONE 2022, 17, e0266807. [Google Scholar] [CrossRef] [PubMed]
- Friesen, G.M.; Jannett, T.C.; Jadallah, M.A.; Yates, S.L.; Quint, S.R.; Nagle, H.T. A comparison of the noise sensitivity of nine QRS detection algorithms. IEEE Trans. Biomed. Eng. 1990, 37, 85–98. [Google Scholar] [CrossRef]
- Huang, N.E.; Shen, Z.; Long, S.R.; Wu, M.C.; Shih, H.H.; Zheng, Q.; Yen, N.C.; Tung, C.C.; Liu, H.H. The empirical mode decomposition and the Hilbert spectrum for nonlinear and non-stationary time series analysis. Proc. R. Soc. Lond. Ser. A Math. Phys. Eng. Sci. 1998, 454, 903–995. [Google Scholar] [CrossRef]
- Beni, N.H.; Jiang, N. Heartbeat detection from single-lead ECG contaminated with simulated EMG at different intensity levels: A comparative study. Biomed. Signal Process. Control 2023, 83, 104612. [Google Scholar] [CrossRef]
- Kabir, M.A.; Shahnaz, C. Denoising of ECG signals based on noise reduction algorithms in EMD and wavelet domains. Biomed. Signal Process. Control 2012, 7, 481–489. [Google Scholar] [CrossRef]
- Wu, Z.; Huang, N.E. Ensemble empirical mode decomposition: A noise-assisted data analysis method. Adv. Adapt. Data Anal. 2009, 1, 1–41. [Google Scholar] [CrossRef]
- Torres, M.E.; Colominas, M.A.; Schlotthauer, G.; Flandrin, P. A complete ensemble empirical mode decomposition with adaptive noise. In Proceedings of the 2011 IEEE International Conference on Acoustics, Speech and Signal Processing (ICASSP), Prague, Czech Republic, 22–27 May 2011; IEEE: New York, NY, USA, 2011; pp. 4144–4147. [Google Scholar]
- Li, W. Wavelets for electrocardiogram: Overview and taxonomy. IEEE Access 2018, 7, 25627–25649. [Google Scholar] [CrossRef]
- Merah, M.; Abdelmalik, T.; Larbi, B. R-peaks detection based on stationary wavelet transform. Comput. Methods Programs Biomed. 2015, 121, 149–160. [Google Scholar] [CrossRef]
- Kalidas, V.; Tamil, L. Real-time QRS detector using stationary wavelet transform for automated ECG analysis. In Proceedings of the 2017 IEEE 17th International Conference on Bioinformatics and Bioengineering (BIBE), Washington, DC, USA, 23–25 October 2017; IEEE: New York, NY, USA, 2017; pp. 457–461. [Google Scholar]
- Kumar, A.; Tomar, H.; Mehla, V.K.; Komaragiri, R.; Kumar, M. Stationary wavelet transform based ECG signal denoising method. ISA Trans. 2021, 114, 251–262. [Google Scholar] [CrossRef] [PubMed]
- El Bouny, L.; Khalil, M.; Adib, A. ECG noise reduction based on stationary wavelet transform and zero-crossings interval thresholding. In Proceedings of the 2017 International Conference on Electrical and Information Technologies (ICEIT), Rabat, Morocco, 15–18 November 2017; IEEE: New York, NY, USA, 2017; pp. 1–6. [Google Scholar]
- Peng, H.; Chen, Y.; Shi, D.; Xie, F. Electrocardiogram Signal Denoising Based on Multi-Threshold Stationary Wavelet Transform. In Proceedings of the 2022 IEEE International Symposium on Medical Measurements and Applications (MeMeA), Messina, Italy, 22–24 June 2022; IEEE: New York, NY, USA, 2022; pp. 1–6. [Google Scholar]
- Li, S.; Lin, J. The optimal de-noising algorithm for ECG using stationary wavelet transform. In Proceedings of the 2009 WRI World Congress on Computer Science and Information Engineering, Los Angeles, CA, USA, 31 March–2 April 2009; IEEE: New York, NY, USA, 2009; Volume 6, pp. 469–473. [Google Scholar]
- Baldazzi, G.; Solinas, G.; Del Valle, J.; Barbaro, M.; Micera, S.; Raffo, L.; Pani, D. Systematic analysis of wavelet denoising methods for neural signal processing. J. Neural Eng. 2020, 17, 066016. [Google Scholar] [CrossRef] [PubMed]
- Arsene, C.T.; Hankins, R.; Yin, H. Deep Learning Models for Denoising ECG Signals. In Proceedings of the 2019 27th European Signal Processing Conference (EUSIPCO), A Coruña, Spain, 2–6 September 2019; pp. 1–5. [Google Scholar]
- Jin, Y.; Qin, C.; Liu, J.; Liu, Y.; Li, Z.; Liu, C. A novel deep wavelet convolutional neural network for actual ECG signal denoising. Biomed. Signal Process. Control 2024, 87, 105480. [Google Scholar] [CrossRef]
- Peng, H.; Chang, X.; Yao, Z.; Shi, D.; Chen, Y. A deep learning framework for ECG denoising and classification. Biomed. Signal Process. Control 2024, 94, 106441. [Google Scholar] [CrossRef]
- Moody, G.B.; Mark, R.G. The MIT-BIH arrhythmia database on CD-ROM and software for use with it. In Proceedings of the [1990] Proceedings Computers in Cardiology, Chicago, IL, USA, 23–26 September 1990; IEEE: New York, NY, USA, 1990; pp. 185–188. [Google Scholar]
- Farina, D.; Mesin, L.; Martina, S.; Merletti, R. A surface EMG generation model with multilayer cylindrical description of the volume conductor. IEEE Trans. Biomed. Eng. 2004, 51, 415–426. [Google Scholar] [CrossRef]
- Mesin, L. Separation of interference surface electromyogram into propagating and non-propagating components. Biomed. Signal Process. Control 2019, 52, 238–247. [Google Scholar] [CrossRef]
- Fuglevand, A.J.; Winter, D.A.; Patla, A.E. Models of recruitment and rate coding organization in motor-unit pools. J. Neurophysiol. 1993, 70, 2470–2488. [Google Scholar] [CrossRef]
- Atanasoski, V.; Petrovic, J.; Maneski, L.P.; Miletić, M.; Babić, M.; Nikolić, A.; Panescu, D.; Ivanović, M.D. A database of simultaneously recorded ECG signals with and without EMG noise. IEEE Open J. Eng. Med. Biol. 2023, 4, 222–225. [Google Scholar] [CrossRef] [PubMed]
- Atanasoski, V.; Popovic Maneski, L.; Miletic, M.; Babic, M.; Ivanovic, M.; Nikolic, A.; Petrovic, J.; Bojovic, B.; Hadzievski, L. SimEMG Database- Simultaneous Recordings of Noise-Free and Noise-Contaminated ECG Signals. Mendeley Data. 2022. Available online: https://doi.org/10.17632/yx5pb66hwz.1 (accessed on 1 August 2025).
- Jaffery, Z.A.; Ahmad, K.; Sharma, P. Selection of optimal decomposition level based on entropy for speech denoising using wavelet packet. J. Bioinform. Intell. Control 2012, 1, 196–202. [Google Scholar] [CrossRef]
- Laha, S.K.; Swarnakar, B.; Kansabanik, S.; Ray, S. A novel signal denoising method using stationary wavelet transform and particle swarm optimization with application to rolling element bearing fault diagnosis. Mater. Today Proc. 2022, 66, 3935–3943. [Google Scholar] [CrossRef]
- Valencia, D.; Orejuela, D.; Salazar, J.; Valencia, J. Comparison analysis between rigrsure, sqtwolog, heursure and minimaxi techniques using hard and soft thresholding methods. In Proceedings of the 2016 XXI Symposium on Signal Processing, Images and Artificial Vision (STSIVA), Bucaramanga, Colombia, 31 August–2 September 2016; IEEE: New York, NY, USA, 2016; pp. 1–5. [Google Scholar]
- Abi-Abdallah, D.; Chauvet, E.; Bouchet-Fakri, L.; Bataillard, A.; Briguet, A.; Fokapu, O. Reference signal extraction from corrupted ECG using wavelet decomposition for MRI sequence triggering: Application to small animals. Biomed. Eng. Online 2006, 5, 11. [Google Scholar] [CrossRef] [PubMed]
- Pan, J.; Tompkins, W.J. A Real-Time QRS Detection Algorithm. IEEE Trans. Biomed. Eng. 1985, BME-32, 230–236. [Google Scholar] [CrossRef]
- Wedekind, D. MATLAB—Pan-Tompkins QRS Detector. 2025. Available online: https://github.com/danielwedekind/qrsdetector (accessed on 26 July 2025).
- Scheirer, C.J.; Ray, W.S.; Hare, N. The analysis of ranked data derived from completely randomized factorial designs. Biometrics 1976, 32, 429–434. [Google Scholar] [CrossRef]
- Kamga, P.; Mostafa, R.; Zafar, S. The use of wearable ECG devices in the clinical setting: A review. Curr. Emerg. Hosp. Med. Rep. 2022, 10, 67–72. [Google Scholar] [CrossRef]
- Bouzid, Z.; Al-Zaiti, S.S.; Bond, R.; Sejdić, E. Remote and wearable ECG devices with diagnostic abilities in adults: A state-of-the-science scoping review. Heart Rhythm 2022, 19, 1192–1201. [Google Scholar] [CrossRef] [PubMed]
- Castaldo, R.; Xu, W.; Melillo, P.; Pecchia, L.; Santamaria, L.; James, C. Detection of mental stress due to oral academic examination via ultra-short-term HRV analysis. In Proceedings of the 2016 38th Annual International Conference of the IEEE Engineering in Medicine and Biology Society (EMBC), Orlando, FL, USA, 16–20 August 2016; IEEE: New York, NY, USA, 2016; pp. 3805–3808. [Google Scholar]
- Mesin, L. Heartbeat monitoring from adaptively down-sampled electrocardiogram. Comput. Biol. Med. 2017, 84, 217–225. [Google Scholar] [CrossRef] [PubMed]
- Raggi, M.; Chiri, S.; Roatta, S.; Rabbito, R.; Mesin, L. A Novel Approach for Acute Mental Stress Mitigation Through Adapted Binaural Beats: A Pilot Study. Appl. Sci. 2025, 15, 5742. [Google Scholar] [CrossRef]
- Satija, U.; Ramkumar, B.; Manikandan, M.S. A review of signal processing techniques for electrocardiogram signal quality assessment. IEEE Rev. Biomed. Eng. 2018, 11, 36–52. [Google Scholar] [CrossRef]
- Contini, M.; Sarmento, A.; Gugliandolo, P.; Leonardi, A.; Longinotti-Buitoni, G.; Minella, C.; Vignati, C.; Mapelli, M.; Aliverti, A.; Agostoni, P. Validation of a new wearable device for type 3 sleep test without flowmeter. PLoS ONE 2021, 16, e0249470. [Google Scholar] [CrossRef] [PubMed]
- Simoons, M.; Hugenholtz, P. Gradual changes of ECG waveform during and after exercise in normal subjects. Circulation 1975, 52, 570–577. [Google Scholar] [CrossRef]
- Kligfield, P.; Gettes, L.S.; Bailey, J.J.; Childers, R.; Deal, B.J.; Hancock, E.W.; Van Herpen, G.; Kors, J.A.; Macfarlane, P.; Mirvis, D.M.; et al. Recommendations for the standardization and interpretation of the electrocardiogram: Part I: The electrocardiogram and its technology: A scientific statement from the American Heart Association Electrocardiography and Arrhythmias Committee, Council on Clinical Cardiology; The American College of Cardiology Foundation; and the Heart Rhythm Society endorsed by the International Society for Computerized Electrocardiology. Circulation 2007, 115, 1306–1324. [Google Scholar]
- Mesin, L.; Cipriani, G.E.; Amanzio, M. Electroencephalography-based brain–machine interfaces in older adults: A literature review. Bioengineering 2023, 10, 395. [Google Scholar] [CrossRef]
- Kwon, O.; Jeong, J.; Kim, H.B.; Kwon, I.H.; Park, S.Y.; Kim, J.E.; Choi, Y. Electrocardiogram sampling frequency range acceptable for heart rate variability analysis. Healthc. Inform. Res. 2018, 24, 198–206. [Google Scholar] [CrossRef]
- Mesin, L. A neural algorithm for the non-uniform and adaptive sampling of biomedical data. Comput. Biol. Med. 2016, 71, 223–230. [Google Scholar] [CrossRef]
Disclaimer/Publisher’s Note: The statements, opinions and data contained in all publications are solely those of the individual author(s) and contributor(s) and not of MDPI and/or the editor(s). MDPI and/or the editor(s) disclaim responsibility for any injury to people or property resulting from any ideas, methods, instructions or products referred to in the content. |
© 2025 by the authors. Licensee MDPI, Basel, Switzerland. This article is an open access article distributed under the terms and conditions of the Creative Commons Attribution (CC BY) license (https://creativecommons.org/licenses/by/4.0/).