Article

Simultaneous Speech Denoising and Super-Resolution Using mGLFB-Based U-Net, Fine-Tuned via Perceptual Loss †

Department of Electronic Engineering, National I-Lan University, I-Lan 26047, Taiwan
*
Author to whom correspondence should be addressed.
This paper is an expanded version of Hu, H.-T.; Tsai, H.-H. mGLFB-based U-Net for simultaneous speech denoising and super-resolution, In Proceedings of the 11th International Conference on Advances in Artificial Intelligence, Information Communication Technology, and Digital Convergence (ICAIDC-2025), Jeju, Republic of Korea, 10–12 July 2025.
Electronics 2025, 14(17), 3466; https://doi.org/10.3390/electronics14173466
Submission received: 6 August 2025 / Revised: 27 August 2025 / Accepted: 28 August 2025 / Published: 29 August 2025

Abstract

This paper presents an efficient U-Net architecture featuring a modified Global Local Former Block (mGLFB) for simultaneous speech denoising and resolution reconstruction. Optimized for computational efficiency in the discrete cosine transform domain, the proposed architecture reduces model size by 13.5% compared to a standard GLFB-based U-Net, while maintaining comparable performance across multiple quality metrics. In addition to the mGLFB redesign, we introduce a perceptual loss that better captures high-frequency magnitude spectra, yielding notable gains in high-resolution recovery, especially in unvoiced speech segments. However, the mGLFB-based U-Net still shows limitations in retrieving spectral details with substantial energy in 4–6 kHz frequencies.

1. Introduction

Speech is the primary mode of human communication, but its intelligibility and quality are often degraded by factors such as background noise, reverberation, and bandwidth limitations. To address these issues, speech denoising and super-resolution have emerged as key tasks in speech enhancement [1,2], focusing on improving clarity and restoring missing high-frequency components. Speech denoising aims to remove additive noise and preserve intelligibility, while super-resolution seeks to reconstruct high-frequency details often lost during recording or transmission.
In recent years, deep neural networks (DNNs) have significantly advanced both denoising and super-resolution techniques [3,4]. Traditional signal processing approaches—such as spectral subtraction, Wiener filtering, and minimum mean squared error (MMSE)-based estimation—have gradually been surpassed by more sophisticated neural network-based methods. Prominent models include convolutional neural networks (CNNs) [4,5,6,7,8], recurrent neural networks (RNNs) [9,10], and transformer-based models [11,12,13], all of which have demonstrated impressive results in speech enhancement.
In the realm of speech super-resolution, predictive DNNs have been developed to map low-resolution speech to high-resolution outputs [14,15,16]. While the developed DNNs appeared effective in experimentally settled environments, these models often produce overly smoothed results and struggle with generalization due to their deterministic mapping design [17]. Hence, a few researchers explored generative approaches, including generative adversarial networks (GANs) [18,19] and diffusion models [20,21], which treat super-resolution as a conditional generation problem. While more robust to variability, the generative methods generally fell behind predictive models in terms of reconstruction accuracy. Hybrid models that combine the advantages of prediction and generation have become the latest evolution [22].
Over the past decade, deep learning-based speech enhancement has become a major focus in both academia and industry. The IEEE International Conference on Acoustics, Speech, and Signal Processing (ICASSP) has introduced the Deep Noise Suppression (DNS) Challenge [2,23], emphasizing the improvement of speech quality and intelligibility in noisy environments. Since noise suppression is increasingly vital for real-world applications, such as live video and smart devices, developing efficient and deployable solutions is critical. While much of the literature has centered on enhancing denoising capability, the real-time performance of super-resolution remains underexplored. Nevertheless, for speech enhancement to genuinely benefit end-users, solutions capable of real-time operation are imperative.
In our previous study [12], we demonstrated the potential of a six-level U-Net architecture, enhanced with Global Local Former Blocks (GLFBs) [11], for achieving efficient and effective speech enhancement in the short-time discrete cosine transform (STDCT) domain. Given the U-Net’s compatibility with resolution restoration, extending this framework to include super-resolution is a logical next step. More recently, the conformer-based CMGAN model [13] has shown promise for speech enhancement in the time-frequency (T-F) domain, handling tasks such as denoising, dereverberation, and super-resolution. However, a unified design that effectively integrates these tasks for robust real-world deployment remains an open challenge.
To address the above issues, this paper proposes reorganizing the U-Net architecture using modified GLFBs (termed mGLFBs) to enable simultaneous, real-time speech denoising and super-resolution. We further refine the loss function to emphasize perceptual quality, specifically targeting improvements in spectral feature restoration. By combining these enhancements, our approach unifies denoising and super-resolution within a real-time, practical U-Net framework, offering additional gains from the perceptually motivated loss function.
The remainder of this paper is organized as follows: Section 2 describes the proposed model architecture, including the modified GLFBs, U-Net framework, and perceptual loss function. Section 3 outlines the experimental setup, including datasets, evaluation metrics, and training procedures. Section 4 presents the results and discussions. Finally, Section 5 concludes the paper and suggests potential directions for future research.

2. DNN for Speech Enhancement

2.1. Processing Framework

A noisy speech signal y [ n ] is generally modeled as a sum of clean speech x [ n ] and additive noise z [ n ] :
y [ n ] = x [ n ] + z [ n ] .
Our processing framework for speech denoising follows a frame-based overlap-and-add (OLA) method. Specifically, the noisy speech signal is partitioned into overlapping frames of fixed length, and each frame is processed through a denoising DNN to generate the desired clean speech. Previous research has shown that performing speech denoising in the short-time discrete cosine transform (STDCT) domain offers distinct advantages over traditional time-domain approaches [12], thanks to the energy-compacting properties of the DCT. Therefore, we transform the speech signal into the STDCT domain before further processing.
To model temporal context in speech signals, we feed the STDCT sequences into the DNN using a sliding buffer that holds a certain number of past frames for causal modeling. After the denoising process, the frames are converted back to the time domain using the inverse DCT and then reassembled into a whole speech signal through the OLA method.
Figure 1 illustrates the overall framework for speech denoising. Given an 8 kHz sampling rate, we select a frame length L f of 256 samples, with a shift distance L s of 64 samples, resulting in a 32 ms window with an 8 ms stride. These settings introduce a 40 ms delay in real-time processing.

2.2. U-Net Architecture

The U-Net architecture has become widely adopted for speech enhancement tasks due to its effectiveness in recovering clean signals from noisy inputs. Originally developed for biomedical image segmentation, U-Net [24] has proven highly effective across various signal processing applications, including speech denoising [4,5,6,7,8] and super-resolution [14,15,25]. A U-Net is characterized by its U-shaped structure, consisting of an encoding path that extracts essential features and a decoding path that reconstructs the features to match the original input dimensions. The encoding and decoding stages are connected via skip connections, enabling the network to retain high-resolution details while learning hierarchical features at multiple scales.
In our previous study [12], we employed GLFBs to construct a six-level U-Net for speech denoising. GLFB, inspired by the transformer architecture [26], refers to a network module combining global and local modeling to better capture dependencies in the data. The GLFB blocks provide transformer-like functionality without the heavy computational cost typically associated with transformer networks. Compared to U-Nets built with conventional convolutional blocks, the GLFB-based U-Net achieves a 39% reduction in model size, decreasing from 612 K to 238.6 K. With fewer parameters and a more efficient design, the GLFB-based U-Net delivers superior performance while consuming less memory, making it an essential feature for real-time applications.
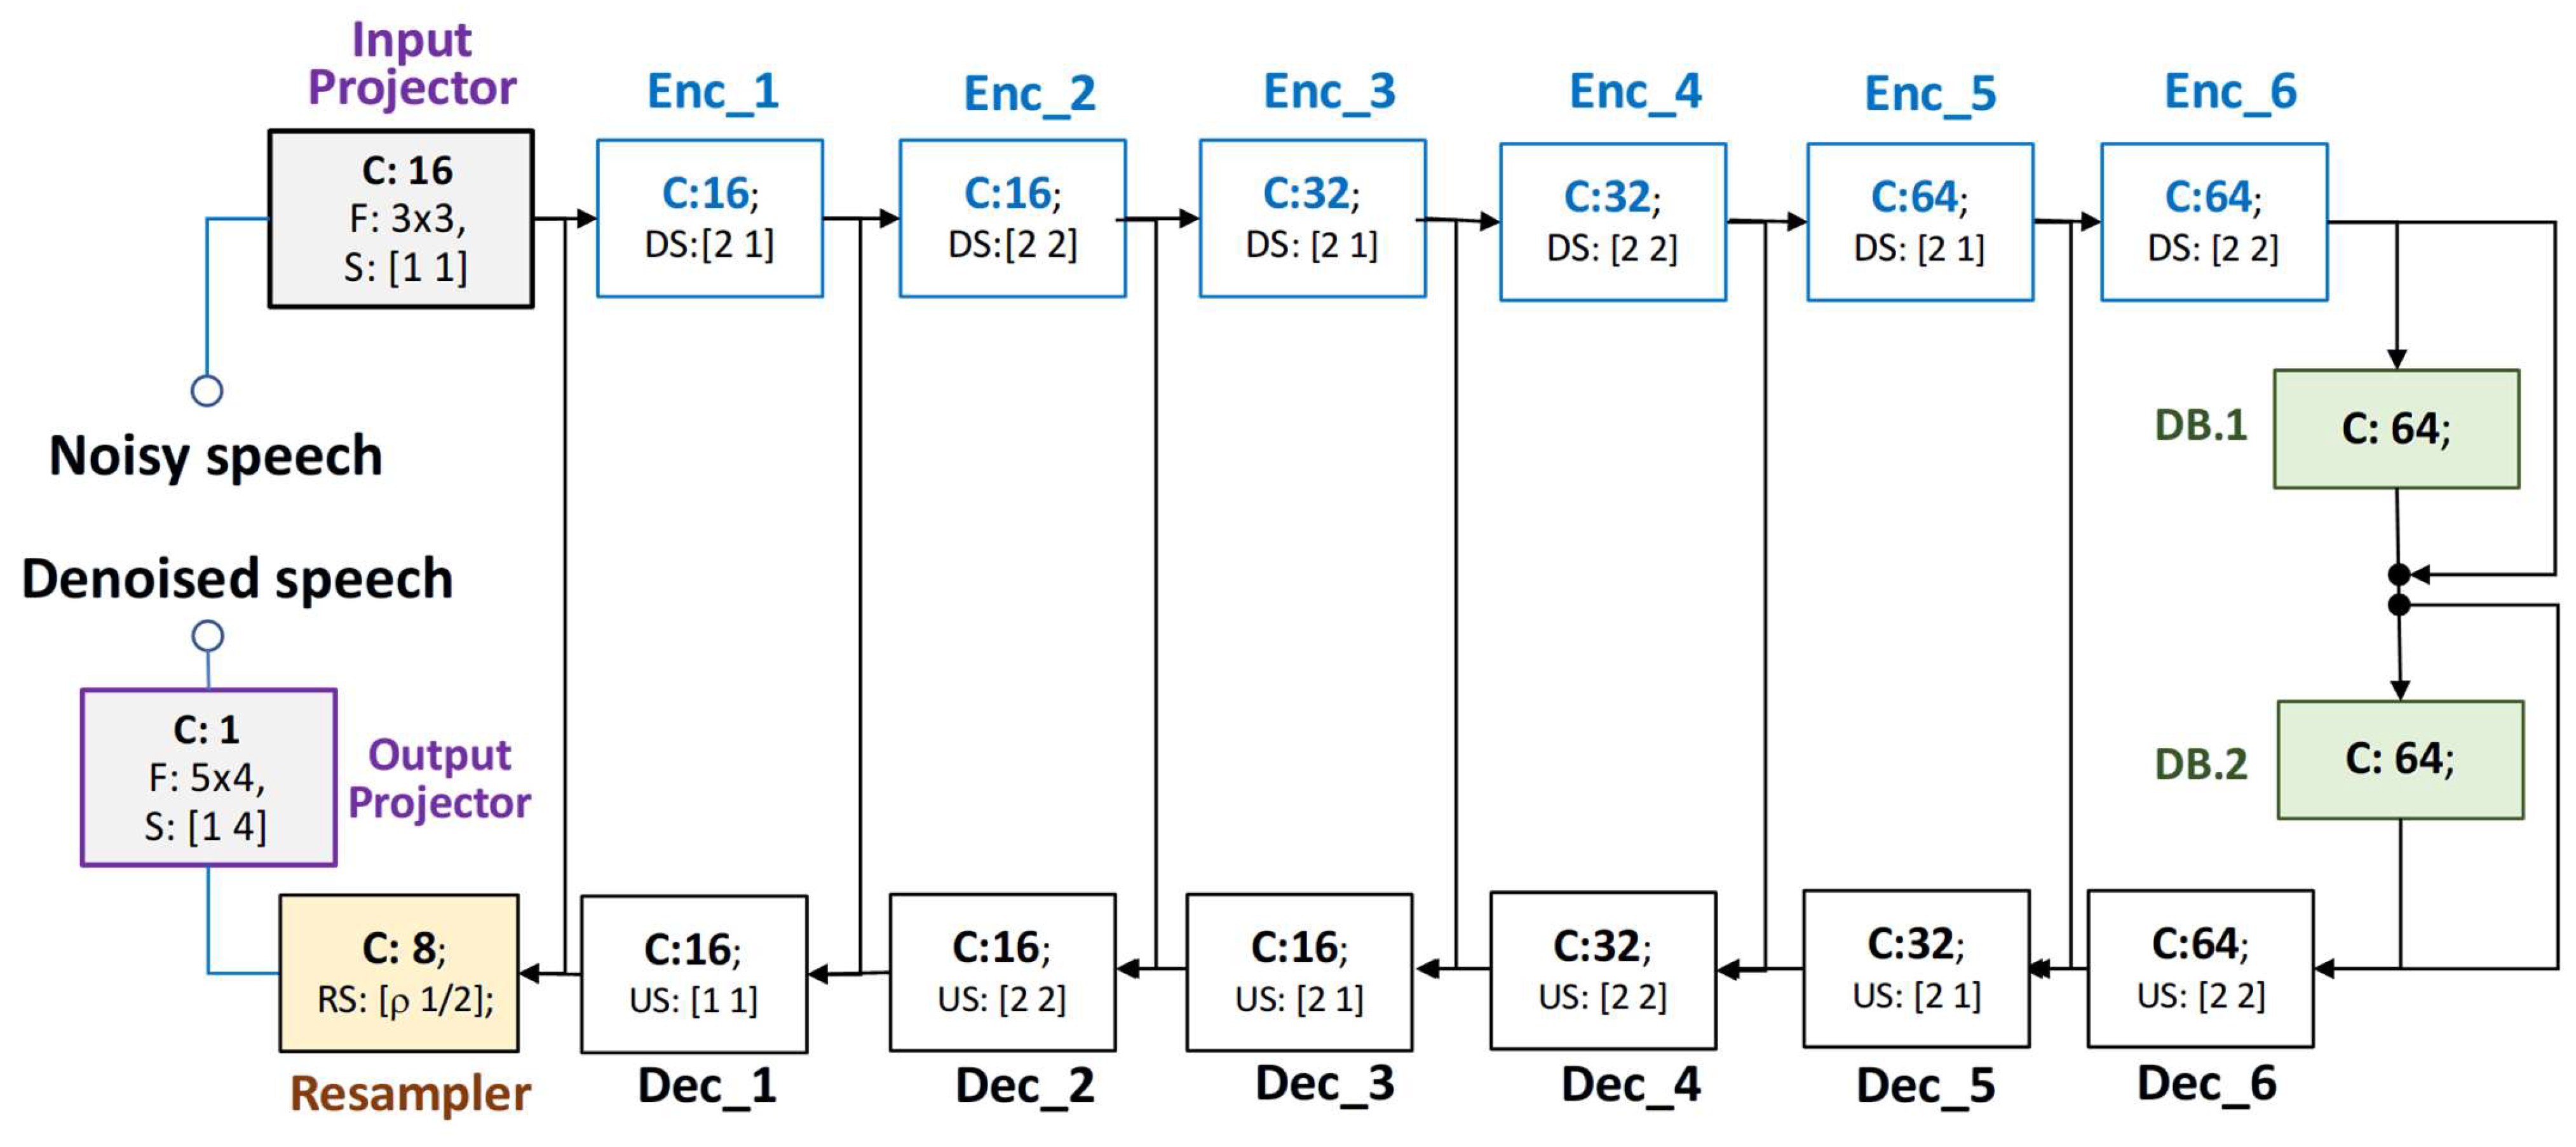
Building on our previous work, we adopt a modified GLFB (termed mGLFB) [27] to rebuild a U-Net capable of performing both speech denoising and super-resolution. Figure 2 illustrates the configuration of the adopted U-Net, where mGLFBs form the core building submodules of both the encoder and decoder. At the bottleneck, located on the right side of the figure, is a two-layer dense block that enhances parameter efficiency in the latent space. Table 1 summarizes the relevant parameters of each submodule in Figure 2 for better understanding.
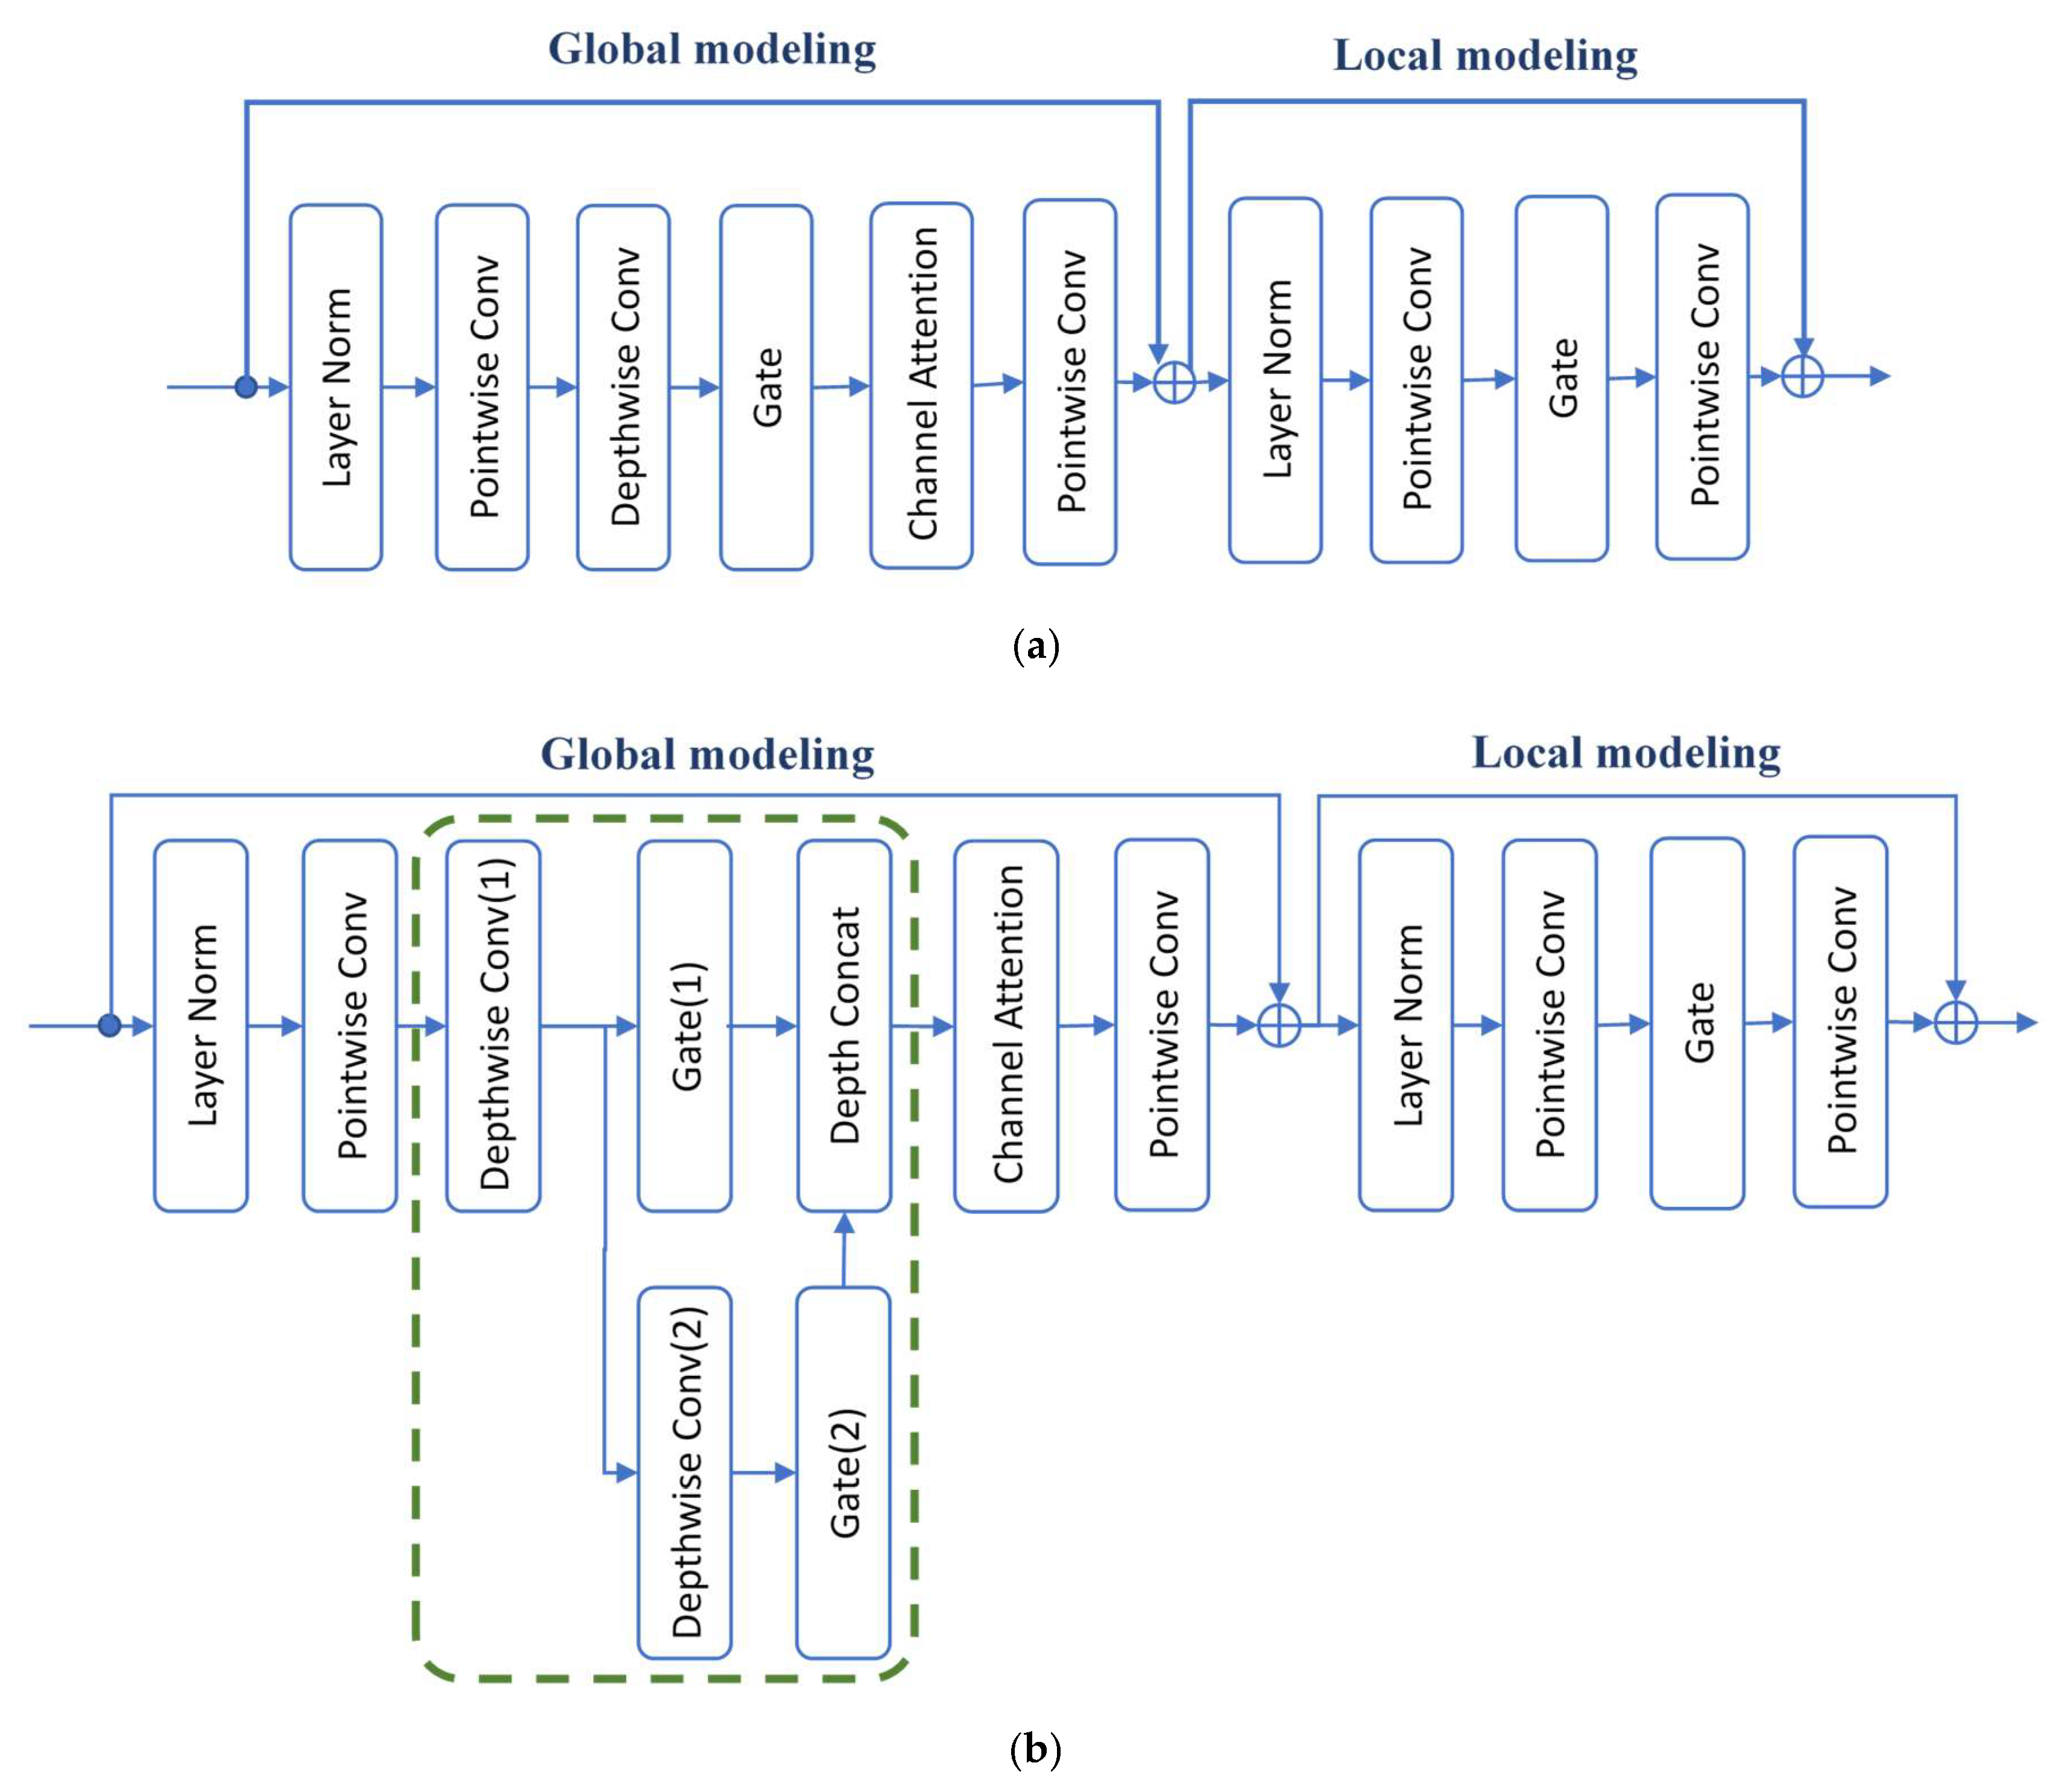
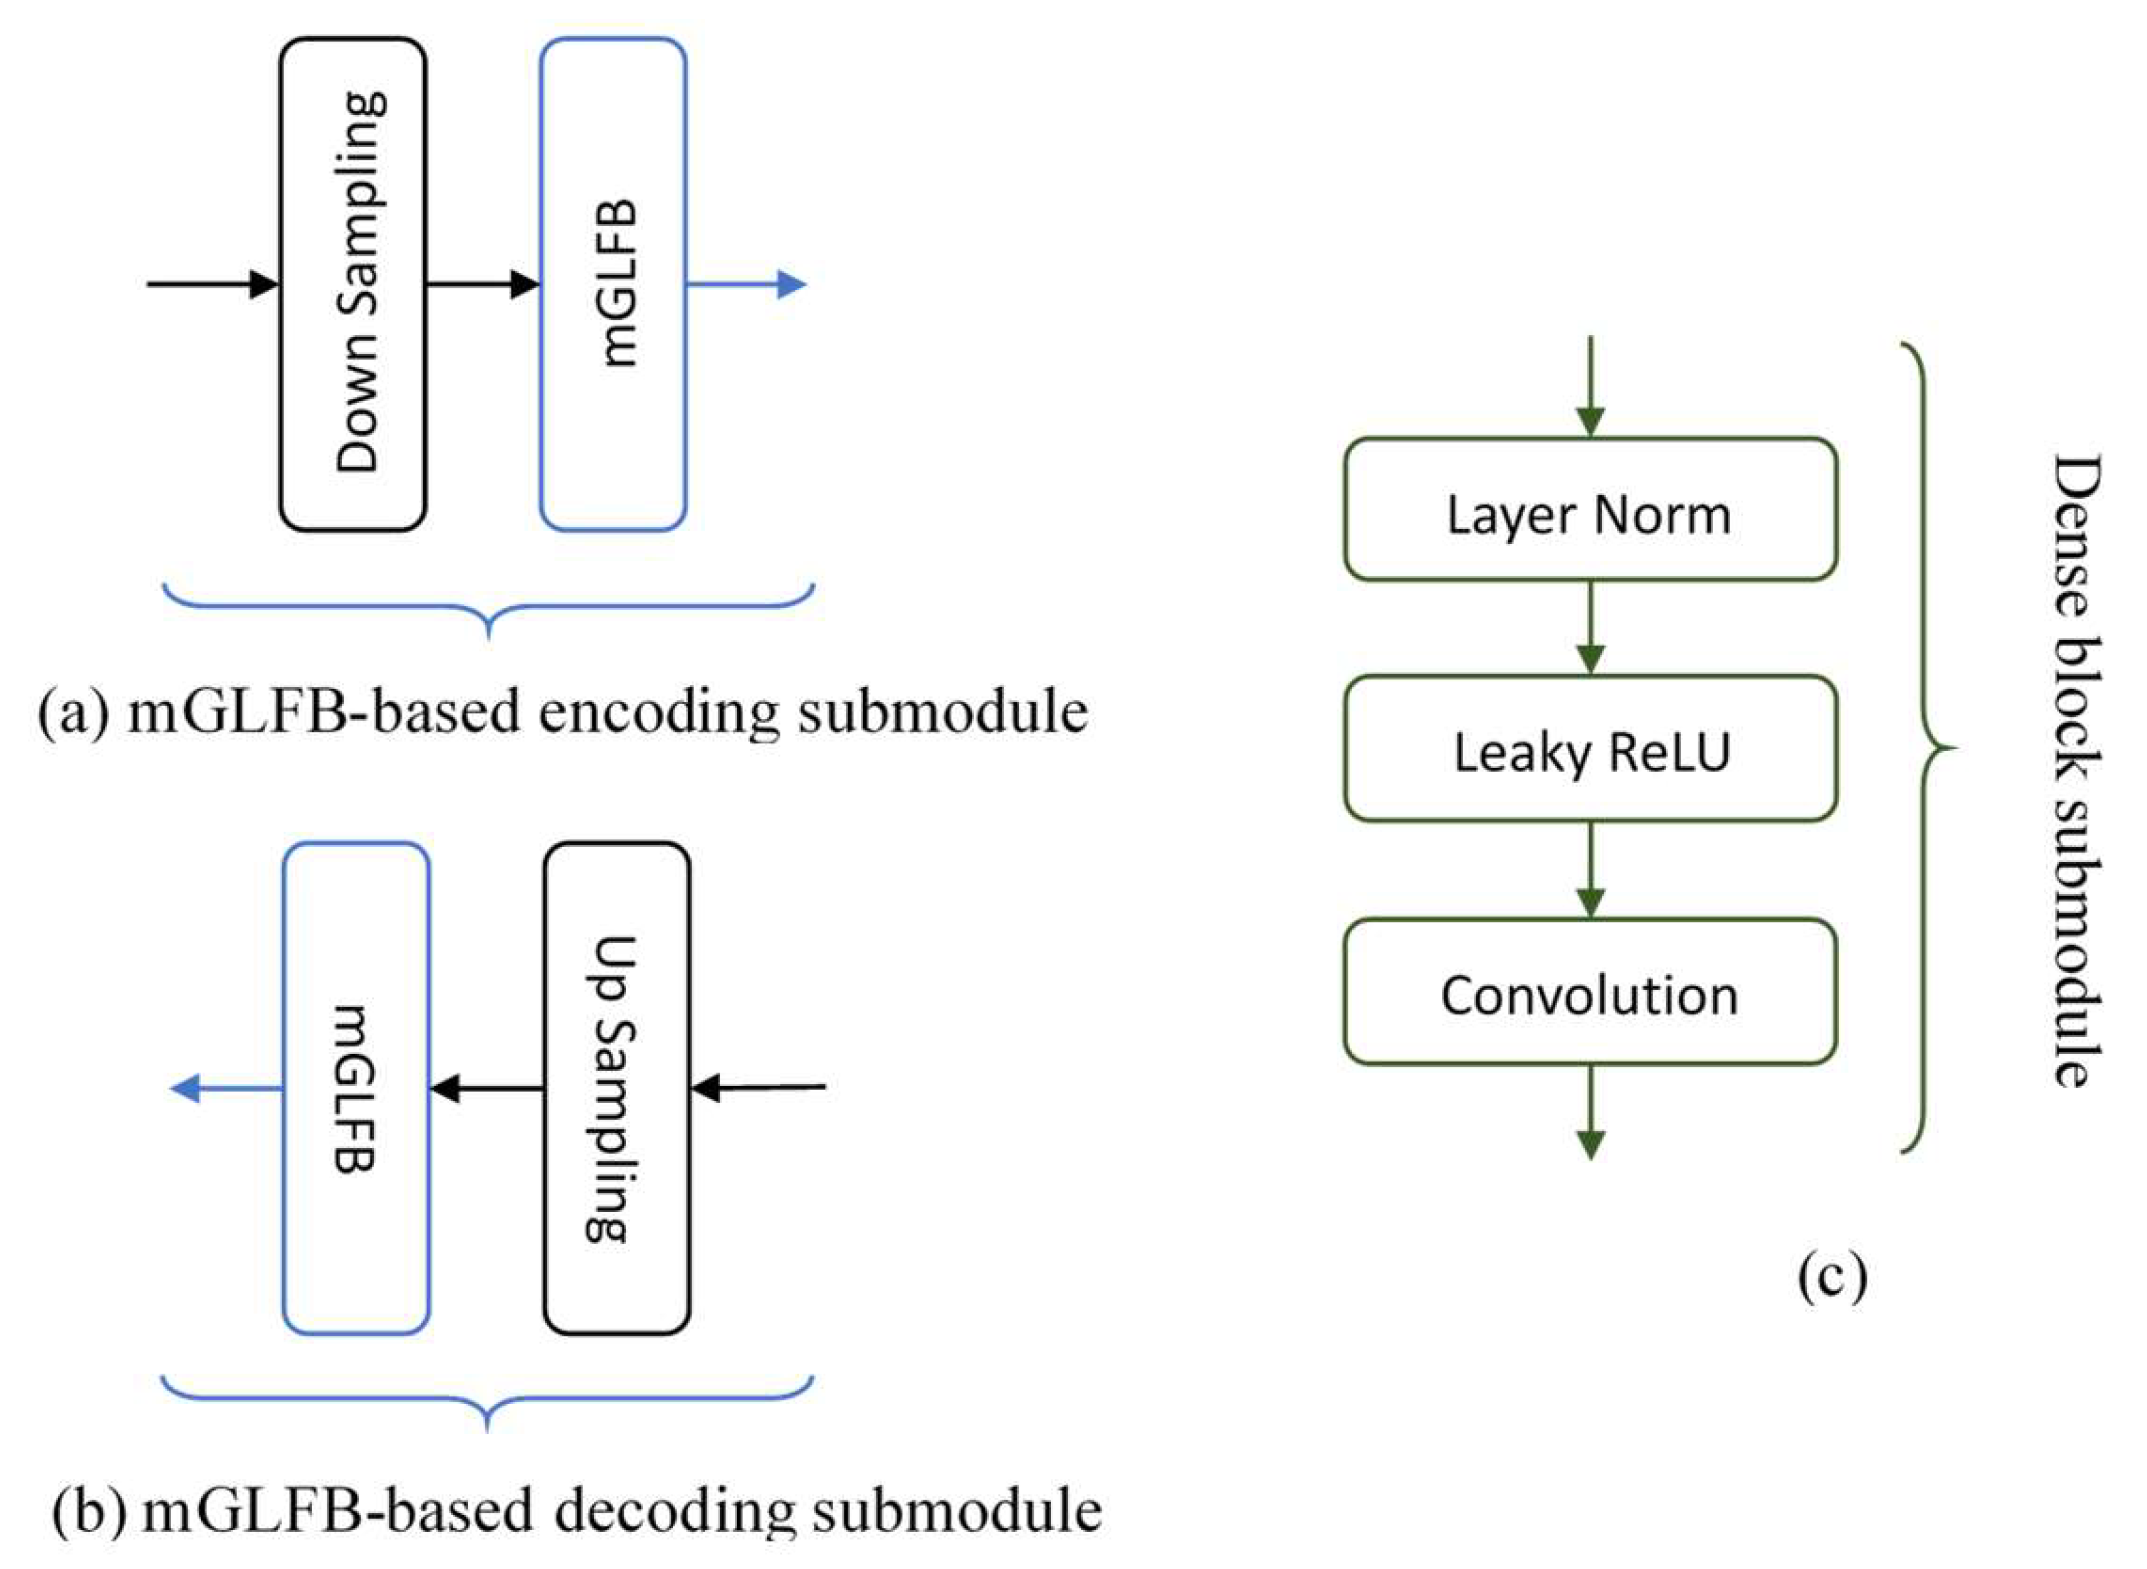
Evolving from the GLFB, the mGLFB adopts a structure similar to a transformer. Figure 3 illustrates the transition from GLFB to mGLFB, with additional details provided in the following subsection. Within the U-Net architecture, mGLFBs in both the encoder and decoder are paired with downsamplers and upsamplers to dynamically adjust the dimensions of intermediate feature maps as needed, as depicted in Figure 4. This multi-level design enables hierarchical feature extraction, while skip connections between the encoder and decoder help preserve detailed information, ultimately enhancing reconstruction quality.

2.3. Inner Composition of mGLFB

As shown in Figure 3, mGLFB inherits the basic architecture of GLFB, which comprises global and local modeling. The global modeling relies on the cooperation of the depthwise separable convolution, the gating mechanism, and the channel attention mechanism to capture global features. Local modeling, primarily involving pointwise convolutions and gating, focuses on local interactions within the input features. One special feature of the GLFB is that the gating operation replaces the role of standard activation. This alteration helps to reduce complexity and prevent overfitting by controlling information flow.
In our previous implementation of the GLFB-based U-Net, we did not consider the impact of kernel sizes in convolution operations. In general, large kernels increase computational cost while expanding the receptive field and introduce a probable risk of overfitting. This presented an opportunity for further improvement in the structural design of GLFB. Our modification lies in the involved depthwise separable convolutions, combined with gating in global modeling. As depicted in Figure 3b, we replace a single large kernel in the depthwise convolution with a cascade of two small-kernel convolutions, while keeping the number of channels intact (i.e., without doubling the channels). This cascade arrangement allows the receptive field to attain the desired level, as the second convolution layer builds upon the output of the first. To further extend the receptive field, we introduce dilation in the second convolution to help increase the coverage of this filter kernel.
In addition to expanding the receptive field, the cascade arrangement in depthwise convolution can save the need to double the number of channels required for gating. In the original GLFB, the use of gating functions to replace the activations requires doubling the number of channels in advance. Half of the channels process the information, while the other half regulates the flow of information through the gating mechanism. In our modification, we apply the gating mechanism to the intermediate outputs of the two convolutions individually, as shown in the dashed box in Figure 3. This results in two convolved outputs, each with half the number of channels. These two outputs are then concatenated along the channel dimension, eventually restoring the original number of channels. Though the cascading of two depthwise separable convolutions splits the receptive field into diverse patterns, the overall coverage of the receptive field in the 6-level U-Net remains comparable.

2.4. Super-Resolution Reconstruction

As in the case of GLFB, each mGLFB requires cooperation with either an upsampler or downsampler whenever feature maps need to be reshaped or the number of channels needs to be adjusted. The implementations of the upsamplers and downsamplers follow the specifications outlined in [11]. In addition to integrating up-samplers and down-samplers with the mGLFBs, we introduce a resampler to enable super-resolution, which aims at predicting high-frequency spectral components from their low-frequency counterparts. Since the height of the feature map corresponds to the frequency dimension, we utilize the pixel shuffling technique [28] to upscale resolution without introducing interpolation artifacts.
The intended resampler uses a 3   ×   3 kernel with a stride of [ 1 ,   2 ] and is equipped with a required number of channels to perform dimensional shuffling. As demonstrated in Figure 2, the input and output of the 6-level U-Net contain 16 channels of feature maps, each with a size of 256   ×   8 . The resampler increases the height while reducing the width of the feature maps, ensuring enough channels to facilitate pixel shuffling. For instance, if the target output of the resampler consists of 8 channels with feature maps of size 512   ×   4 , the resampler thus executes a 2-D convolution with 16 filters, each with a stride of [1, 2] in the vertical and horizontal directions, respectively. After convolution, the data (of size 256   ×   4 ×   ( 16   c h a n n e l s ) ) is shuffled along the channel dimension to form new 2-D feature maps of size 512   × 4   ×   ( 8   c h a n n e l s ) .

2.5. Perceptual Loss Function

In [12], we employed a composite loss function to guide the Adam optimizer (short for Adaptive Moment Estimation [29]) in adjusting the model’s weights. The loss function comprises two sources: the mean squared error (MSE) loss derived from the magnitude values and the MSE loss computed from the original polar values.
c o m p Y ^ D C T [ k ] , X D C T [ k ] = α M S E _ M a g | Y ^ D C T , β [ k ] | , | X D C T , β [ k ] | + ( 1 α ) M S E _ P o l a r Y ^ D C T , β [ k ] , X D C T , β [ k ] ,
where Y ^ D C T [ k ] represents the DCT sequence obtained from the U-Net’s output, and X D C T [ k ] is the DCT sequence of the clean speech. Y ^ D C T , β [ k ] and X D C T , β [ k ] are the two derivatives defined as follows:
Y ^ D F T , β ( k ) = sgn Y ^ D C T [ k ] Y ^ D C T [ k ] β ; X D F T , β ( k ) = sgn X D C T [ k ] X D C T [ k ] β ,
where sgn ( ) denotes the sign function. The parameter setting (α, β) = (0,1) in Equation (2) corresponds to the pure MSE loss between the DCT sequences of the recovered and clean speech, while ( α , β ) = ( 0.5 , 0.5 ) activates both magnitude compression and phase recovery concurrently. While the formula with ( α , β ) = ( 0.5 , 0.5 ) has yielded satisfactory results, we believe that other auditory features could further enhance performance.
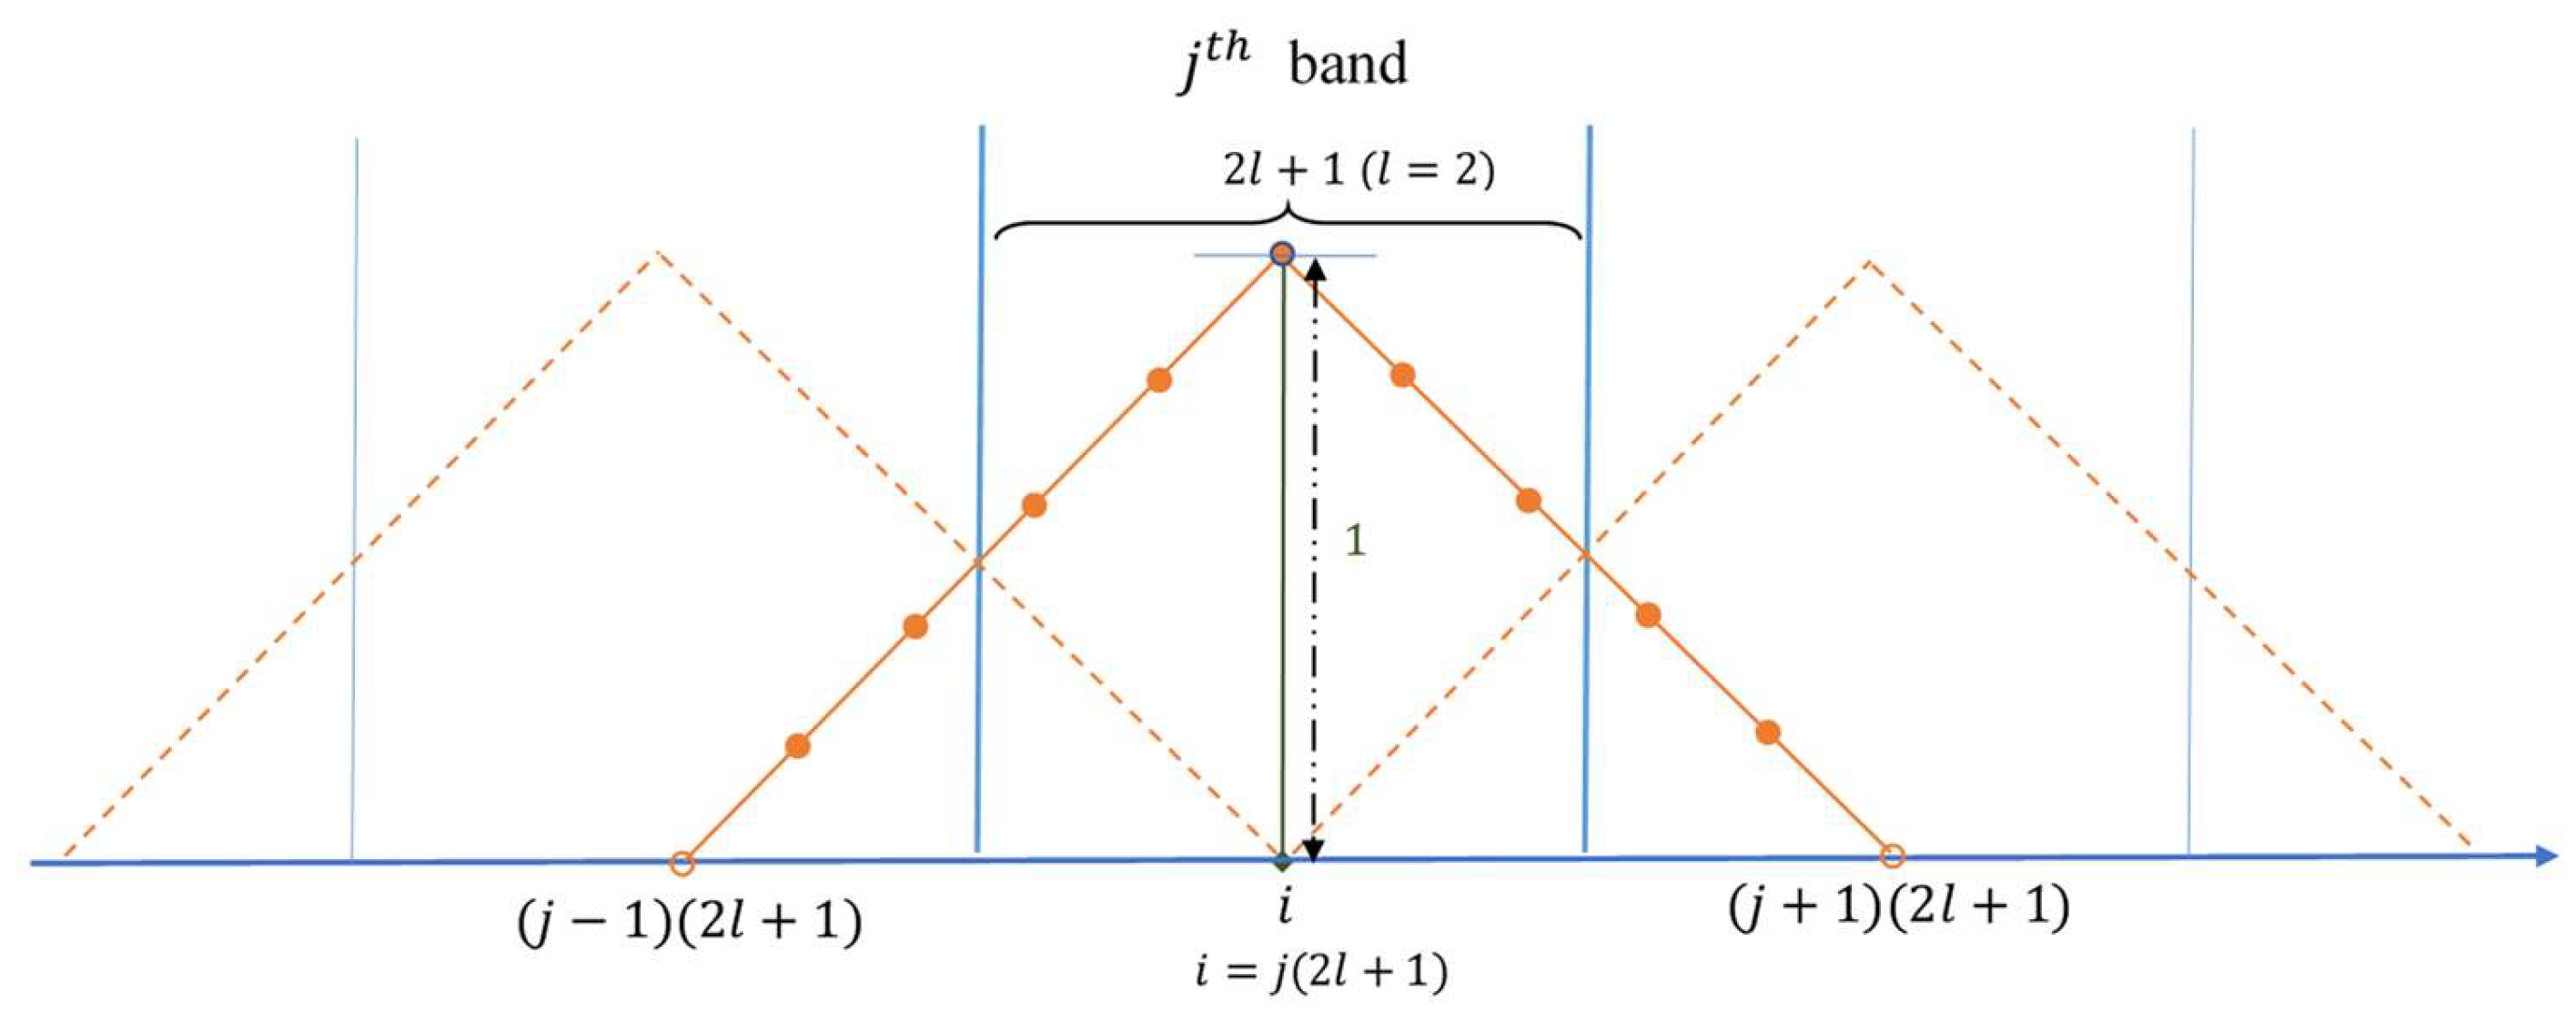
In this study, we propose the use of a perceptual loss function that better reflects the characteristics of the human auditory system. The formulation of this perceptual loss is inspired by the concept of critical bands in psychoacoustics [30,31], where a critical band represents a frequency range within which the ear processes and perceives sounds as a single auditory unit. Two key properties of critical bands guide our design: (1) spectral components within a band should be processed collectively, and (2) bands become wider at higher frequencies. To incorporate these two properties, we employ a ( 4 l   +   1 ) -point FIR filter with a symmetric triangular shape to estimate the energy of Y ^ D C T [ k ] within a given band, spanning ( 2 l   +   1 ) points.
E Y ^ ( j ;   i ) i = j ( 4 l + 1 ) = 1 2 l + 1 ( 2 l + 1 ) C ( l ) 2 [ i ] + k = 1 2 l 2 l + 1 k C ( l ) 2 [ i k ] + C ( l ) 2 [ i + k ] ,
where E Y ^ ( j ;   i ) denotes the estimated energy for the j t h band with the center at position i = j ( 2 l + 1 ) . C ( l ) [ i ] signifies the l t h -level coefficient sequence defined as follows:
C ( l ) [ i ] = Y ^ D C T L f 4 2 l δ [ l ] + i ; i = 0 , 1 , 2 , , L f / 2 1   for   l = 0 ; 0 , 1 , 2 , , 2 l 2 L f 1   for   l > 0 .  
Here, C ( l ) [ i ] is an intermediate variable for convenient explanation, and δ [ l ] stands for the Dirac delta function. C ( 0 ) [ i ] corresponds to the STDCT sequence in the 0–4 kHz frequency range, C ( 1 ) [ i ] spans 4–8 kHz, and C ( 2 ) [ i ] covers the 8 kHz to 16 kHz range.
Figure 5 illustrates the triangular FIR filter used to estimate the energy level of a frequency band. The perceptual distance 𝒟 C B ( j ) between the energy estimates (termed E Y ^ ( j ;   i ) and E X ( j ;   i ) , respectively) acquired from the super-resolved and original STDCT sequences in a frequency band can be defined as follows:
𝒟 C B ( j ) = 1 2 l + 1 i = j ( 2 l + 1 ) l j ( 2 l + 1 ) + l E Y ^ ( j ;   i ) β / 2 E X ( j ;   i ) β / 2 2 .
In the above equation, the exponent β / 2 signifies the application of magnitude compression. Since E Y ^ ( j ;   i ) and E X ( j ;   i ) vary with position i , we take the average over all possible indices within the j t h band, as in Equation (5). Extending this concept to all STDCT coefficients at the same frequency level, we reformulate the perceptual loss function into three main steps: (1) smoothing the squared STDCT coefficients using the triangular filter, (2) applying magnitude compression, and (3) computing the MSE between the compared energy estimates.
To better simulate the auditory system’s processing, we apply a variable-tap FIR filter to the squared STDCT coefficients. The smoothing range, manifested as ( 4 l   +   1 ) , is narrower for lower frequency bands and gradually widens at higher frequencies to align with the critical bands in human hearing [32], as follows:
C ˜ ( l ) 2 ( i ) = 1 2 l + 1 2 ( 2 l + 1 ) C ( l ) 2 ( i ) + k = 1 2 l 2 l + 1 k C ( l ) 2 ( i k ) + C ( l ) 2 ( i + k ) .
The smoothed STDCT magnitude at the l t h frequency level is then calculated as:
Y ˜ D C T , β ( l ) L f 4 2 l δ [ l ] + i = C ˜ ( l ) 2 [ i ] β / 2 = C ˜ ( l ) [ i ] β ;   i = 0 , 1 , 2 , , L f / 2 1   for   l = 0 ; 0 , 1 , 2 , , 2 l 2 L f 1   for   l > 0 ,  
with
C ˜ ( l ) [ i ] = 1 2 l + 1 C ( l ) 2 ( i ) + k = 1 2 l 2 l + 1 k 2 l + 1 2 C ( l ) 2 ( i k ) + C ( l ) 2 ( i + k ) 1 2 .
In Equation (7), the superscript ( l ) in Y ˜ D C T , β ( l ) simply reflects the corresponding level. The above spectral smoothing process (i.e., Equations (6)–(8)) allows the loss function to treat neighboring STDCT coefficients as groups rather than as individual elements, thereby enhancing perceptual relevance.
In addition to spectral smoothing, we adapt the weight factor (i.e., parameter α) for each frequency band. The weight assigned to the smoothed magnitude spectrum increases with frequency, thereby encouraging the mGLFB-based U-Net to place greater emphasis on the spectral magnitudes for high-frequency components. This concept is mathematically expressed as follows:
c o m p Y ^ D C T [ k ] , X D C T [ k ] = l = 1 2 α [ l ] M S E _ M a g | Y ˜ D C T , β ( l ) [ k ] | , | X ˜ D C T , β ( l ) [ k ] | + l = 1 2 1 α [ l ] M S E _ P o l a r Y ^ D C T , β ( l ) [ k ] , X D C T , β ( l ) [ k ]
where α [ l ] is set to 0.5, 0.55, and 0.75 for l = 0,1 , 2 , respectively. Note that in the first term on the right-hand side of Equation (9), | Y ˜ D C T , β ( l ) [ k ] | and | X ˜ D C T , β ( l ) [ k ] | have replaced the original | Y ^ D C T , β ( l ) [ k ] | and X D C T , β ( l ) [ k ] | , respectively, for spectral magnitude difference estimation, indicating the incorporation of the perceptual loss into the formulation.

3. Experiment and Assessment Metrics

The speech samples used in our experiments were sourced from the Centre for Speech Technology Voice Cloning ToolKit (CSTR VCTK) Corpus [33], which contains utterances from 110 individuals. We utilized recordings from 58 individuals (29 males and 29 females), each contributing approximately 400 sentences for training, while the recordings from another 20 speakers (10 males and 10 females) were selected for testing. These recordings were originally sampled at 48 kHz but were down-sampled to 8 kHz for our experiments. Noise data was sourced from the Diverse Environments Multi-channel Acoustic Noise Database (DEMAND) [34], which includes six categories of ambient noise, each containing three distinct recordings. During training, noise was randomly mixed with speech at signal-to-noise ratios (SNR) of −5, 0, 5, 10, and 15 dB.
For real-time speech denoising, we employed the OLA method with a frame length L f = 256 and a frame shift L s = 64 , resulting in a frame update rate of 125 times per second. This setup ensures real-time processing, as long as each frame of the input speech signal can be processed within 8 milliseconds.
The mGLFB-based U-Nets were trained on a desktop computer with an Intel® i5-14500 CPU (Intel Corporation, Santa Clara, CA, USA) and 128 GB RAM, coupled with an NVIDIA® RTX 4080 Super graphics card (NVIDIA Corporation, Santa Clara, CA, USA). We employed the Adam optimizer [29] and adjusted the model’s weights with the maximum batch size allowed by the hardware.
To assess the quality of the denoised speech, we employed the speech enhancement metrics proposed by Hu and Loizou [35], specifically CSIG, CBAK, and COVL, along with two quality metrics: the Perceptual Evaluation of Speech Quality (PESQ) [36] and Virtual Speech Quality Objective Listener (ViSQOL) [37]. CSIG and CBAK correspond to predicted speech and background distortion ratings, respectively, while COVL summarizes the overall quality prediction. These three metrics and ViSQOL are all based on the mean opinion score (MOS) scale, where values range from 1 (bad) to 5 (excellent). By contrast, PESQ provides a score between −0.5 and 4.5, with higher scores indicating better speech quality.
The metric for measuring speech intelligibility is the short-time objective intelligibility (STOI) [38], which ranges from 0 to 1 and is often presented as a percentage. Higher STOI scores correspond to better speech intelligibility.
For general objective evaluation, we used signal-to-noise ratio (SNR) and log-spectral distance (LSD) [39] to measure the temporal and spectral differences in the speech signals, respectively. As defined in Equation (10), SNR measures the ratio of the signal power to the noise power, providing insight into the level of noise in the signal:
SNR [ dB ] = 10 log 10 l = 0 L 1 s 2 [ l ] l = 0 L 1 s [ l ] s ^ [ l ] 2 ,
where s [ l ] and s ^ [ l ] are the original and processed speech signals with a length of L . While SNR is useful for understanding the noise level in a signal, it is not an ideal metric for evaluating speech quality as it does not account for spectral differences. To address this limitation, we utilized LSD to gauge the distance between the spectrograms of the original and processed speech signals in the T-F domain:
L S D = 1 N n = 0 N 1 1 L f k = 0 L f 1 log P ( n ) [ k ] log P ^ ( n ) [ k ] 2 1 / 2 ,
where P ( n ) [ k ] and P ^ ( n ) [ k ] represent the k t h power spectral coefficients derived from the original and processed speech signals, respectively, at the n t h frame, and N denotes the total number of frames.

4. Performance Evaluation

Our first concern is the efficiency gained by replacing GLFBs with mGLFBs for speech denoising. With this modification, the number of learnable parameters required for constructing the 6-level U-Net decreases from 238.5 K to 206.2 K, resulting in a 13.5% reduction. We evaluated the performance of both U-Nets (built with GLFBs and mGLFBs) using the metrics discussed in the previous section. Table 2 presents the experimental results when these two U-Nets were trained using the loss function described in Equation (2) with two settings: ( α , β ) = ( 0,1 ) and ( α , β ) = ( 0.5,0.5 ) .
With the exception of STOI for the case of ( α , β )   =   ( 0,1 ) , the results for SNR, LSD, CSIG, CBAK, COVL, PESQ, and ViSQOL are comparable between the two U-Nets. These results demonstrate that the mGLFB-based U-Net performs similarly to the GLFB-based U-Net, despite using fewer learnable parameters. The lower STOI for the mGLFB-based U-Net is conceivably due to the heavy use of dilated convolutions, which can reduce the network’s ability to model local continuity or fine details.
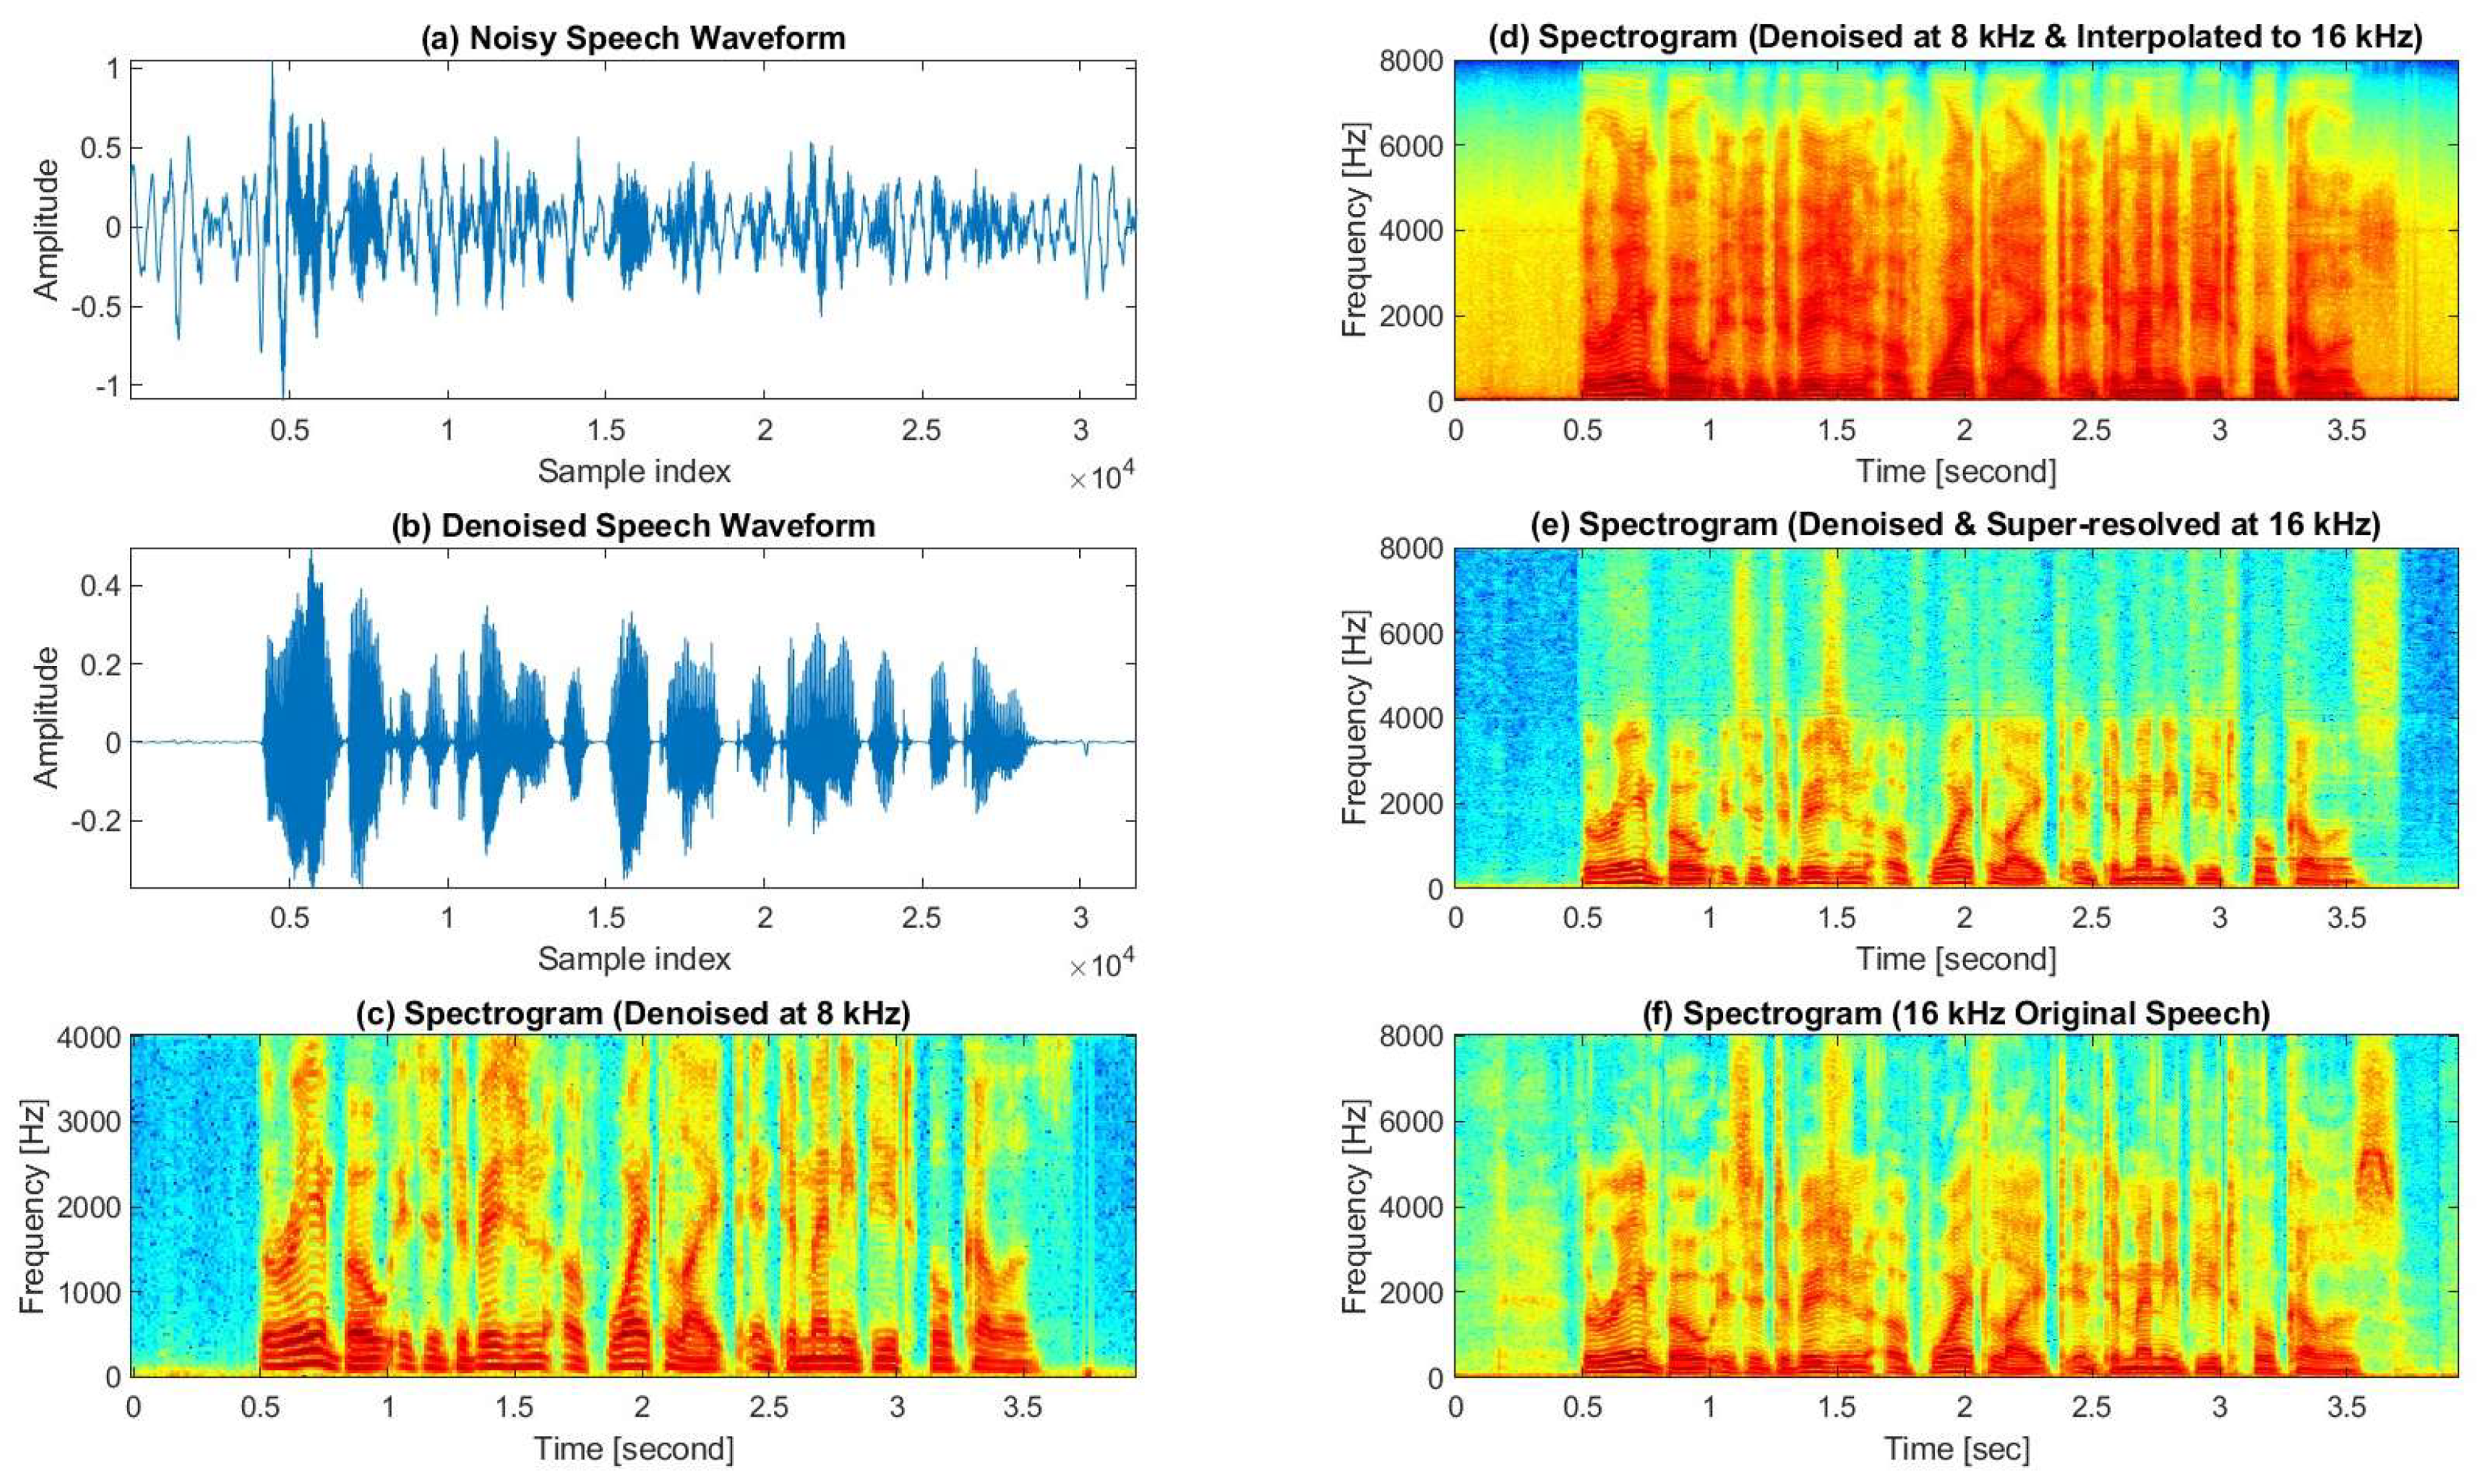
The second concern focuses on integrating speech denoising with resolution reconstruction. Assuming the input is an 8 kHz narrowband noisy speech signal and the output is a 16 kHz denoised and super-resolved speech signal, we implemented two approaches for this enhancement task. The first approach involved denoising the speech using the mGLFB-based U-Net at 8 kHz, followed by a resolution increase to 16 kHz using spline interpolation. The second approach performed speech denoising and super-resolution using a U-Net equipped with a resampler using an upscaling factor ρ of 2.
Table 3 presents the measured scores for the metrics used to assess speech quality. Compared to the results in Table 2, all metrics show a declining tendency, primarily due to the increase in frequency range. After the bandwidth expansion from 8 to 16 kHz, overall speech quality decreased by approximately 0.137 in PESQ (from 3.430 to 3.293) and 0.341 in ViSQOL (from 4.219 to 3.878). Regarding the advantages and disadvantages of the two approaches, the results in Table 2 reveal a notable divergence. While the commonly used LSD metric favors the second approach, PESQ indicates a preference for the first approach. Nevertheless, ViSQOL aligns with LSD, indicating better perceived quality for the second approach.
Given the importance of real-time processing for practical applications, we conducted a comprehensive performance comparison of the real-time factor (RTF) across two CPUs (Intel® i5-14500 and i9-11900: Intel Corporation, Santa Clara, CA, USA) and two GPUs (NVIDIA® RTX-3080Ti and RTX-4080S: NVIDIA Corporation, Santa Clara, CA, USA) using the MATLAB® environment (MathWorks, Natick, MA, USA). For the first approach, we specifically compare two denoising U-Nets built on GLFBs and mGLFBs. As shown in Table 4, the highest observed RTF was 0.482 when the second approach was executed on the i5-14500 processor. Since all RTF values are less than 1, these results confirm that every tested processor can handle speech data in real time.
Table 4 contains two variants of Approach 1, where U-Nets constructed using GLFBs and mGLFBs are studied. In theory, mGLFB should require less computation because it uses smaller kernels and fewer channels in the depthwise convolution. However, the first two rows of Table 4 show the opposite trend: the GLFB-based U-Net achieves a lower RTF than the mGLFB-based U-Net. We attribute this discrepancy to our implementation, where the program code adopts a highly modular, layer-wise design. As illustrated in Figure 3, each mGLFB block includes an additional convolutional layer and a gating layer compared with GLFB. In our implementation, these are invoked as separate functions, which introduces extra function-call and data-passing overhead that offsets the theoretical savings and slows the overall runtime. To fully realize mGLFB’s efficiency, the computations within the depthwise convolution should be fused into a single unit in future revisions.
To further investigate the differences in quality metrics reported in Table 3, we analyzed the spectrograms produced by different methods. As illustrated in Figure 6, incorporating the modified loss function from Equation (9) enables the U-Net to more effectively recover high-frequency components, especially in unvoiced segments. However, in the second approach, the U-Net is less successful at reconstructing the spectral range between 4 and 6 kHz. In contrast, applying spline interpolation after denoising at an 8 kHz sampling rate tends to produce stronger spectral intensity in the 4–7 kHz range, regardless of speech type. As a result, PESQ considers the intensified spectra in the 4–7 kHz region to be more perceptually acceptable, even though the overall LSD may indicate otherwise.
Finally, in order to assess the contribution of the perceptual loss function, we also conducted an ablation study focusing on the impact of the weight factor and spectral smoothing. Table 5 summarizes the metrics obtained under three experimental conditions. The top section shows the results using α = 0.5   0.5   0.5 with spectral smoothing disabled, which is equivalent to utilizing the original loss formulation (Equation (2)). As indicated in the middle and lower sections of Table 5, adjusting α to [0.5, 0.55, 0.75] reduces LSD while increasing CSIG, COVL, and ViSQOL, suggesting that prioritizing differences in high-frequency spectral magnitude benefits overall speech quality. Enabling spectral smoothing alone in the perceptual loss function can also yield similar improvements. The combined effect of these two enhancements, as previously shown in the bottom section of Table 3, results in further increases across all performance metrics, including STOI.

5. Conclusions

In this study, we utilized the mGLFB as the core building block to efficiently construct a 6-level U-Net for real-time speech enhancement. Additionally, we developed a frequency-adaptive perceptual loss function designed to improve spectral recovery in high-frequency regions. By integrating a resampler at the network output, the mGLFB-based U-Net is capable of performing both denoising and super-resolution simultaneously. Experimental results demonstrate that the proposed model achieves speech denoising with a more compact architecture, without compromising quality performance. However, the current U-Net shows limitations in capturing high-frequency content, particularly in the high-energy spectra within the 4–6 kHz range.
For future work, we plan to refine the bandwidth extension branch of the mGLFB-based U-Net to further enhance the predictability of high-frequency components. Additionally, in order to improve the restoration of high-frequency details, we intend to incorporate PESQ and ViSQOL scores into adversarial loss functions within a GAN training framework.

Author Contributions

Conceptualization, H.-T.H.; Data curation, H.-T.H. and H.-H.T.; Formal analysis, H.-T.H.; Funding acquisition, H.-T.H.; Investigation, H.-T.H. and H.-H.T.; Project administration, H.-T.H.; Resources, H.-T.H.; Software, H.-T.H. and H.-H.T.; Supervision, H.-T.H.; Validation, H.-T.H.; Visualization, H.-T.H. and H.-H.T.; Writing—original draft, H.-T.H. and H.-H.T.; Writing—review & editing, H.-T.H. All authors have read and agreed to the published version of the manuscript.

Funding

This research work was supported by the National Science and Technology Council, Taiwan, under Grant NSTC 113-2221-E-197-024.

Data Availability Statement

The speech and noise datasets analyzed during this study are accessible from the CSTR VCTK Corpus [https://www.kaggle.com/datasets/mfekadu/english-multispeaker-corpus-for-voice-cloning (accessed on 11 June 2025)] and DEMAND database [https://www.kaggle.com/datasets/chrisfilo/demand?resource=download (accessed on 11 June 2025)], respectively. The programs implemented in MATLAB® code are available upon reasonable request.

Conflicts of Interest

The authors declare no conflicts of interest.

References

  1. Kinoshita, K.; Delcroix, M.; Gannot, S.; Habets, E.A.P.; Haeb-Umbach, R.; Kellermann, W.; Leutnant, V.; Maas, R.; Nakatani, T.; Raj, B.; et al. A summary of the REVERB challenge: State-of-the-art and remaining challenges in reverberant speech processing research. EURASIP J. Adv. Signal Process. 2016, 2016, 7. [Google Scholar] [CrossRef]
  2. Dubey, H.; Gopal, V.; Cutler, R.; Aazami, A.; Matusevych, S.; Braun, S.; Eskimez, S.E.; Thakker, M.; Yoshioka, T.; Gamper, H.; et al. ICASSP 2022 Deep Noise Suppression Challenge. In Proceedings of the ICASSP 2022—2022 IEEE International Conference on Acoustics, Speech and Signal Processing (ICASSP), Singapore, 23–27 May 2022; pp. 9271–9275. [Google Scholar]
  3. Sun, Y.; Wang, W.; Chambers, J.A.; Naqvi, S.M. Enhanced Time-Frequency Masking by Using Neural Networks for Monaural Source Separation in Reverberant Room Environments. In Proceedings of the 2018 26th European Signal Processing Conference (EUSIPCO), Roma, Italy, 3–7 September 2018; pp. 1647–1651. [Google Scholar]
  4. Choi, H.-S.; Heo, H.; Lee, J.H.; Lee, K. Phase-aware Single-stage Speech Denoising and Dereverberation with U-Net. arXiv 2020, arXiv:2006.00687. [Google Scholar]
  5. Tan, K.; Wang, D. Learning Complex Spectral Mapping with Gated Convolutional Recurrent Networks for Monaural Speech Enhancement. IEEE/ACM Trans. Audio Speech Lang. Process. 2020, 28, 380–390. [Google Scholar] [CrossRef] [PubMed]
  6. Choi, H.-S.; Kim, J.-H.; Huh, J.; Kim, A.; Ha, J.-W.; Lee, K. Phase-aware Speech Enhancement with Deep Complex U-Net. arXiv 2019, arXiv:1903.03107. [Google Scholar] [CrossRef]
  7. Li, A.; Liu, W.; Zheng, C.; Fan, C.; Li, X. Two Heads are Better Than One: A Two-Stage Complex Spectral Mapping Approach for Monaural Speech Enhancement. IEEE/ACM Trans. Audio Speech Lang. Process. 2021, 29, 1829–1843. [Google Scholar] [CrossRef]
  8. Yuan, W. A time–frequency smoothing neural network for speech enhancement. Speech Commun. 2020, 124, 75–84. [Google Scholar] [CrossRef]
  9. Zhao, H.; Zarar, S.; Tashev, I.; Lee, C.H. Convolutional-Recurrent Neural Networks for Speech Enhancement. In Proceedings of the 2018 IEEE International Conference on Acoustics, Speech and Signal Processing (ICASSP), Calgary, AB, Canada, 15–20 April 2018; pp. 2401–2405. [Google Scholar]
  10. Tan, K.; Wang, D. A Convolutional Recurrent Neural Network for Real-Time Speech Enhancement. In Proceedings of the Interspeech, Hyderabad, India, 2–6 September 2018; pp. 3229–3233. [Google Scholar]
  11. Liu, L.; Guan, H.; Ma, J.; Dai, W.; Wang, G.-Y.; Ding, S. A Mask Free Neural Network for Monaural Speech Enhancement. arXiv 2023, arXiv:2306.04286. [Google Scholar] [CrossRef]
  12. Hu, H.-T.; Lee, T.-T. Options for Performing DNN-Based Causal Speech Denoising Using the U-Net Architecture. Appl. Syst. Innov. 2024, 7, 120. [Google Scholar] [CrossRef]
  13. Abdulatif, S.; Cao, R.; Yang, B. CMGAN: Conformer-Based Metric-GAN for Monaural Speech Enhancement. IEEE/ACM Trans. Audio Speech Lang. Process. 2024, 32, 2477–2493. [Google Scholar] [CrossRef]
  14. Kuleshov, V.; Enam, S.Z.; Ermon, S. Audio Super Resolution using Neural Networks. arXiv 2017, arXiv:1708.00853. [Google Scholar] [CrossRef]
  15. Birnbaum, S.; Kuleshov, V.; Enam, S.Z.; Koh, P.W.; Ermon, S. Temporal FiLM: Capturing long-range sequence dependencies with feature-wise modulation. In Proceedings of the 33rd International Conference on Neural Information Processing Systems, Vancouver, BC, Canada, 8–14 December 2019; p. 923. [Google Scholar]
  16. Lim, T.Y.; Yeh, R.A.; Xu, Y.; Do, M.N.; Hasegawa-Johnson, M. Time-Frequency Networks for Audio Super-Resolution. In Proceedings of the 2018 IEEE International Conference on Acoustics, Speech and Signal Processing (ICASSP), Calgary, AB, Canada, 15–20 April 2018; pp. 646–650. [Google Scholar]
  17. Wang, H.; Wang, D. Towards Robust Speech Super-Resolution. IEEE/ACM Trans. Audio Speech Lang. Process. 2021, 29, 2058–2066. [Google Scholar] [CrossRef]
  18. Li, S.; Villette, S.; Ramadas, P.; Sinder, D.J. Speech Bandwidth Extension Using Generative Adversarial Networks. In Proceedings of the 2018 IEEE International Conference on Acoustics, Speech and Signal Processing (ICASSP), Calgary, AB, Canada, 15–20 April 2018; pp. 5029–5033. [Google Scholar]
  19. Eskimez, S.E.; Koishida, K.; Duan, Z. Adversarial Training for Speech Super-Resolution. IEEE J. Sel. Top. Signal Process. 2019, 13, 347–358. [Google Scholar] [CrossRef]
  20. Lee, J.; Han, S. NU-Wave: A Diffusion Probabilistic Model for Neural Audio Upsampling. arXiv 2021, arXiv:2104.02321. [Google Scholar] [CrossRef]
  21. Yu, C.Y.; Yeh, S.L.; Fazekas, G.; Tang, H. Conditioning and Sampling in Variational Diffusion Models for Speech Super-Resolution. In Proceedings of the ICASSP 2023—2023 IEEE International Conference on Acoustics, Speech and Signal Processing (ICASSP), Rhodes Island, Greece, 4–10 June 2023; pp. 1–5. [Google Scholar]
  22. Wang, H.; Healy, E.W.; Wang, D. Combined generative and predictive modeling for speech super-resolution. Comput. Speech Lang. 2025, 94, 101808. [Google Scholar] [CrossRef]
  23. Dubey, H.; Aazami, A.; Gopal, V.; Naderi, B.; Braun, S.; Cutler, R.; Ju, A.; Zohourian, M.; Tang, M.; Golestaneh, M.; et al. ICASSP 2023 Deep Noise Suppression Challenge. IEEE Open J. Signal Process. 2024, 5, 725–737. [Google Scholar] [CrossRef]
  24. Ronneberger, O.; Fischer, P.; Brox, T. U-Net: Convolutional Networks for Biomedical Image Segmentation. arXiv 2015, arXiv:1505.04597. [Google Scholar] [CrossRef]
  25. Rakotonirina, N.C. Self-Attention for Audio Super-Resolution. In Proceedings of the 2021 IEEE 31st International Workshop on Machine Learning for Signal Processing (MLSP), Gold Coast, Australia, 25–28 October 2021; pp. 1–6. [Google Scholar]
  26. Vaswani, A.; Shazeer, N.M.; Parmar, N.; Uszkoreit, J.; Jones, L.; Gomez, A.N.; Kaiser, L.; Polosukhin, I. Attention is All you Need. In Proceedings of the Neural Information Processing Systems, Red Hook, NY, USA, 4–9 December 2017. [Google Scholar]
  27. Hu, H.-T.; Tsai, H.-H. mGLFB-based U-Net for simultaneous speech denoising and super-resolution. In Proceedings of the 11th International Conference on Advances in Artificial Intelligence, Information Communication Technology, and Digital Convergence (ICAIDC-2025), Jeju City, Jeju Island, Republic of Korea, 10–12 July 2025. [Google Scholar]
  28. Shi, W.; Caballero, J.; Huszár, F.; Totz, J.; Aitken, A.P.; Bishop, R.; Rueckert, D.; Wang, Z. Real-Time Single Image and Video Super-Resolution Using an Efficient Sub-Pixel Convolutional Neural Network. In Proceedings of the 2016 IEEE Conference on Computer Vision and Pattern Recognition (CVPR), Las Vegas, NV, USA, 27–30 June 2016; pp. 1874–1883. [Google Scholar]
  29. Kingma, D.P.; Ba, J. Adam: A Method for Stochastic Optimization. arXiv 2015, arXiv:1412.6980. [Google Scholar]
  30. Gelfand, S.A. Hearing: An Introduction to Psychological and Physiological Acoustics, 4th ed.; Marcel Dekker: New York, NY, USA, 2004; 512p. [Google Scholar]
  31. Munkong, R.; Juang, B.H. Auditory perception and cognition. IEEE Signal Process. Mag. 2008, 25, 98–117. [Google Scholar] [CrossRef]
  32. Glasberg, B.R.; Moore, B.C.J. Derivation of auditory filter shapes from notched-noise data. Hear. Res. 1990, 47, 103–138. [Google Scholar] [CrossRef]
  33. Yamagishi, J.; Veaux, C.; MacDonald, K. CSTR VCTK Corpus: English Multi-speaker Corpus for CSTR Voice Cloning Toolkit (Version 0.92); The Centre for Speech Technology Research (CSTR): Edinburgh, UK, 2019. [Google Scholar] [CrossRef]
  34. Thiemann, J.; Ito, N.; Vincent, E. The Diverse Environments Multi-channel Acoustic Noise Database (DEMAND): A database of multichannel environmental noise recordings. J. Acoust. Soc. Am. 2013, 133, 3591. [Google Scholar] [CrossRef]
  35. Hu, Y.; Loizou, P.C. Evaluation of Objective Quality Measures for Speech Enhancement. IEEE Trans. Audio Speech Lang. Process. 2008, 16, 229–238. [Google Scholar] [CrossRef]
  36. ITU-T, R.P. Methods for Subjective Determination of Transmission Quality; International Telecommunications Union: Geneva, Switzerland, 1996. [Google Scholar]
  37. Hines, A.; Skoglund, J.; Kokaram, A.; Harte, N. ViSQOL: The Virtual Speech Quality Objective Listener. In Proceedings of the International Workshop on Acoustic Signal Enhancement (IWAENC 2012), Aachen, Germany, 4–6 September 2012; pp. 1–4. [Google Scholar]
  38. Taal, C.H.; Hendriks, R.C.; Heusdens, R.; Jensen, J. An Algorithm for Intelligibility Prediction of Time–Frequency Weighted Noisy Speech. IEEE Trans. Audio Speech Lang. Process. 2011, 19, 2125–2136. [Google Scholar] [CrossRef]
  39. Rabiner, L.R.; Juang, B.H. Fundamentals of Speech Recognition; PTR Prentice Hall: Englewood Cliffs, NJ, USA, 1993. [Google Scholar]
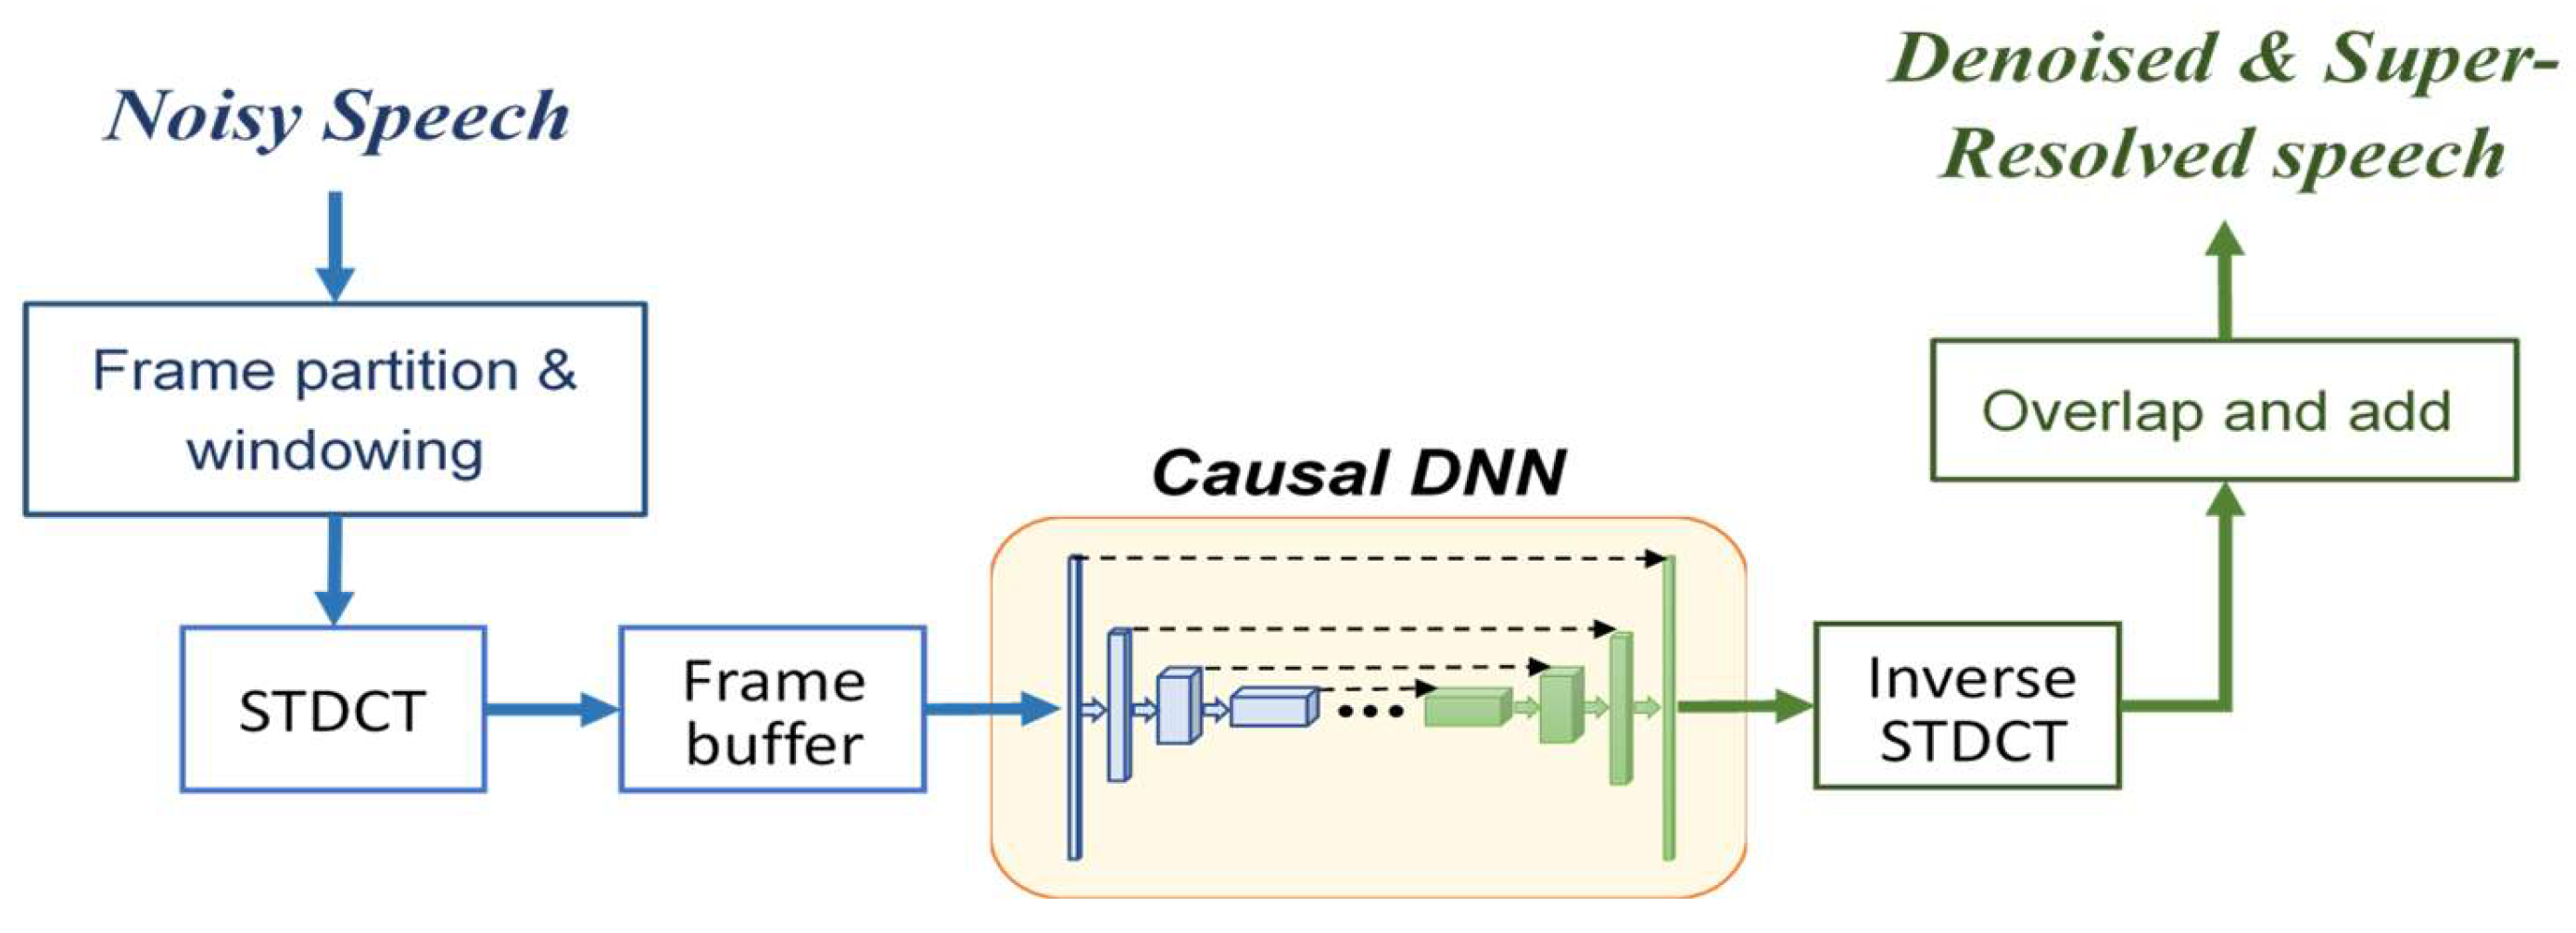
Figure 1. Processing framework for speech enhancement.
Electronics 14 03466 g001
Figure 2. The proposed six-level U-Net built with mGLFBs.
Electronics 14 03466 g002
Figure 3. Structural compositions for (a) GLFB and (b) mGLFB.
Electronics 14 03466 g003
Figure 4. (a) Encoding and (b) decoding submodules, along with (c) the dense block used in the latent space.
Electronics 14 03466 g004
Figure 5. Illustration of energy estimation via a triangular filter for each frequency band.
Electronics 14 03466 g005
Figure 6. Illustration of speech denoising and resolution reconstruction. (a) shows the noise-corrupted speech waveform; (b,c) display the denoised speech waveform and its corresponding spectrogram; (d,e) present the spectrograms obtained using the first and second approaches; panel (f) shows the spectrogram of the original 16 kHz wideband speech signal. In (cf), colors are related to energy levels, which increase from violet to red.
Electronics 14 03466 g006
Table 1. Specifications of network layers in the six-level U-Net. Each submodule in the encoder comprises an mGLFB (in the form of two 2D convolutional operations in tandem) and a downsampler, while a decoder submodule is a combination of an upsampler and an mGLFB. The labels in the table are interpreted as follows: (1) F i D i : 2 D   K e r n e l D i l a t i o n   F a c t o r used in the i t h filter; (2) C : C h a n n e l   N u m b e r ; (3) D S : 2 D   D o w n s a m p l i n g   F a c t o r ; (4) U S : 2 D   U p s a m p l i n g   F a c t o r ; (5) S : 2 D   S t r i d e ; (6) R S : [ 2 D   S c a l i n g   F a c t o r   i n   a   R e s a m p l e r ] ; (7) : Additive Connection; (8) ⇉: Dense Connection.
Layer Index6-Level U-Net
Encoder Side Decoder Side
Input/Output
Projection
F: 3 × 3, C: 16; S: [1 1] F: 5 × 4, C: 1; S: [1 4]
Resampler: C: 8; RS: [ρ 1/2];
F1[D1]: 3[1] × 3[1]; F2[D2]: 3[2] × 3[2];
1F1[D1]: 5[1] × 3[1]; F2[D2]: 3[3] × 3[2]; C:16; DS:[2 1] C:16; US: [1 1]; F1[D1]: 3[1] × 3[1]; F2[D2]: 3[2] × 3[2];
2F1[D1]: 5[1] × 3[1]; F2[D2]: 3[3] × 3[2]; C:16; DS:[2 2] C:16; US: [2 2]; F1[D1]: 5[1] × 3[1]; F2[D2]: 3[3] × 3[2];
3F1[D1]: 3[1] × 3[1]; F2[D2]: 3[2] × 3[1]; C:32; DS: [2 1] C:16; US: [2 1]; F1[D1]: 5[1] × 3[1]; F2[D2]: 3[3] × 3[2];
4F1[D1]: 3[1] × 3[1]; F2[D2]: 3[2] × 3[1]; C:32; DS: [2 2] C:32; US: [2 2]; F1[D1]: 3[1] × 3[1]; F2[D2]: 3[2] × 3[1];
5F1[D1]: 3[1] × 3[1]; F2[D2]: 3[2] × 1[1]; C:64; DS: [2 1] C:32; US: [2 1]; F1[D1]: 3[1] × 3[1]; F2[D2]: 3[2] × 3[1];
6F1[D1]: 3[1] × 3[1]; F2[D2]: 3[2] × 1[1]; C:64; DS: [2 2] C:64; US: [2 2]; F1[D1]: 3[1] × 3[1]; F2[D2]: 3[2] × 1[1];
Latent space
(dense block)
C: 64; F[D]: 3[1] × 1[1]; S: [1 1] C: 64; F[D]: 3[2] × 1[2]; S: [1 1]
Table 2. Performance comparison for the U-Nets built with GLFBs and mGLFBs.
Building Module Loss   Function   ( α , β ) Initial
SNR
Final
SNR (dB)
LSDCSIGCBAKCOVLPESQViSQOLSTOI (%)
Original
GLFB
(0, 1)−2.5 dB13.642.7653.2493.0693.0662.9803.70586.30
2.5 dB16.132.4283.7753.3423.4783.2384.03190.62
7.5 dB18.072.1694.1983.5543.8033.4404.26490.08
12.5 dB20.041.9294.5153.7684.0633.6214.44489.72
Average16.972.3233.9343.4333.6033.3204.11189.18
(0.5, 0.5)−2.5 dB13.732.5133.8573.1693.4213.0443.87488.80
2.5 dB16.372.2384.2753.4393.7923.3384.16192.72
7.5 dB18.392.0044.5983.6664.0833.5784.37393.96
12.5 dB20.201.8064.8403.8774.3083.7694.52594.74
Average17.172.1404.3933.5383.9013.4324.23392.56
Modified
GLFB
(0, 1)−2.5 dB13.402.7693.3283.0433.0942.9623.71185.14
2.5 dB16.032.4243.8323.3163.4933.2184.02989.56
7.5 dB18.042.1374.2463.5443.8223.4334.28090.28
12.5 dB19.971.8954.5553.7634.0813.6194.46890.51
Average16.862.3063.9903.4163.6223.3084.12288.87
(0.5, 0.5)−2.5 dB13.652.5303.8723.1683.4283.0393.85588.55
2.5 dB16.202.2484.2863.4433.7983.3364.14492.93
7.5 dB18.272.0194.6033.6694.0843.5714.35893.99
12.5 dB20.151.8184.8563.8854.3203.7724.51894.23
Average17.072.1534.4043.5413.9073.4304.21992.42
Table 3. Evaluation for 16 kHz denoised and super-resolved speech signals obtained by (1) denoising at 8 kHz followed by upsampling to 16 kHz using spline interpolation, and (2) simultaneously performing denoising and super-resolution using the mGLFB-based U-Net at 16 kHz.
ApproachInitial
SNR
Final
SNR (dB)
LSDCSIGCBAKCOVLPESQViSQOLSTOI (%)
(1)
mGLFB-based U-Net (8 kHz)
+ spline interpolation (16 kHz)
−2.5 dB11.403.741−1.8613.0720.5342.9613.40388.12
2.5 dB13.073.545−1.6363.3300.8153.2693.64492.62
7.5 dB14.243.359−1.4423.5501.0563.5343.83193.82
12.5 dB14.993.224−1.2733.7401.2553.7433.96594.35
Average13.423.467−1.5533.4230.9153.3773.71192.22
(2)
mGLFB-based U-Net (16 kHz)
−2.5 dB11.372.8073.3843.0173.1032.8963.51087.35
2.5 dB13.232.5833.7953.2753.4703.1883.80292.24
7.5 dB14.692.4214.1243.5013.7743.4434.02594.43
12.5 dB15.662.3134.3593.6944.0023.6454.17495.15
Average13.742.5313.9163.3723.5873.2933.87892.29
Table 4. Comparison of real-time performance.
ApproachModelParametersReal-Time Factor
Intel®
i5-14500
Intel®
i9-11900
NVIDIA® RTX-3080TiNVIDIA® RTX-4080S
Approach (1)GLFB-based U-Net (8 kHz) + spline interpolation (16 kHz)238.5 K0.3380.3810.0530.046
mGLFB-based U-Net (8 kHz) + spline interpolation (16 kHz)206.2 K0.4500.4470.1000.071
Approach (2)mGLFB-based U-Net (16 kHz)207.3 K0.4820.4760.1070.070
Table 5. Effects of the weight factor and spectral smoothing in the perceptual loss function.
Approach (2)
mGLFB-Based U-Net (16 kHz)
Initial SNRFinal SNR (dB)LSDCSIGCBAKCOVLPESQViSQOLSTOI (%)
α = 0.5   0.5   0.5 ;  
Spectral Smoothing in high frequencies: OFF
−2.5 dB10.993.0863.2212.9522.9852.8353.31685.72
2.5 dB12.972.9453.5183.2243.3013.1343.60390.89
7.5 dB14.392.8383.7373.4533.5533.3933.81292.82
12.5 dB15.352.7553.9083.6553.7583.6103.95793.83
Average13.432.9063.5963.3213.3993.2433.67290.81
α = 0.5   0.55   0.75 ;  
Spectral Smoothing in high frequencies: OFF
−2.5 dB11.112.8643.3302.9733.0512.8513.42385.99
2.5 dB13.062.6583.7023.2393.4043.1523.71390.47
7.5 dB14.492.5133.9873.4633.6853.4053.92592.03
12.5 dB15.462.4104.2093.6633.9123.6184.07892.89
Average13.532.6113.8073.3353.5133.2563.78490.34
α = 0.5   0.5   0.5 ;  
Spectral Smoothing in high frequencies: ON
−2.5 dB11.022.8833.2942.9573.0272.8453.41785.51
2.5 dB13.002.6633.6933.2293.3933.1443.72290.64
7.5 dB14.412.5083.9973.4563.6853.3993.94292.52
12.5 dB15.362.3954.2263.6533.9153.6084.09593.18
Average13.452.6123.8033.3243.5053.2493.79490.46
Disclaimer/Publisher’s Note: The statements, opinions and data contained in all publications are solely those of the individual author(s) and contributor(s) and not of MDPI and/or the editor(s). MDPI and/or the editor(s) disclaim responsibility for any injury to people or property resulting from any ideas, methods, instructions or products referred to in the content.