1. Introduction
Single-pixel imaging is a vital technique for locating target objects in both spatial and depth dimensions, emerging alongside the development of compressed sensing theory. As an innovative imaging method, it not only facilitates high-quality image reconstruction but also significantly reduces the cost and complexity of imaging systems. Additionally, it showcases notable characteristics such as wide-band response, high sensitivity, and robust stability. As a result, it holds considerable potential for applications across various fields, including medical imaging and aerospace remote sensing [
1,
2,
3].
However, optical quantum noise imposes limitations on the measurement accuracy of traditional optical 3D imaging. Particularly under specific energy constraints and practical device conditions, the resolution and accuracy of 3D imaging are further restricted by the efficiency of light energy utilization and the performance of light intensity detectors. To address the limitations of conventional active 3D optical imaging systems and enhance their performance, compressed sensing has been widely adopted in single-pixel 3D imaging. Recent efforts have focused on developing innovative measurement frameworks, such as compressive imaging and feature-specific imaging, to improve the performance of conventional imaging systems [
4,
5]. Liu [
6] proposed an innovative photon-limited imaging method that investigates the correlation between photon detection probability within a single pulse and light intensity distribution in a single-pixel correlated imaging system. Lai [
7] introduced a new single-pixel imaging approach based on Zernike patterns. Its reconstruction algorithm utilizes the inverse Zernike moment transform, enabling rapid reconstruction with minimal computation time.
This paper proposes a method to capture 3D information using a single-pixel sensor, which can reduce measurement time and enhance the utilization of light energy. Unlike traditional single-pixel compressive sensing measurements of two-dimensional signals, three-dimensional compressive imaging simultaneously involves two key challenges: second-order dimensionality reduction in sampling and second-order dimensionality enhancement in recovery. This method offers potential for reduced system complexity compared to conventional 3D imaging systems and some 3D imaging systems based on compressed sensing referenced in this paper. In our system, the intensity contribution from the axial and lateral locations are treated equally. Thus, neither temporal modulation nor pulsed laser is used to reconstruct the depth information, which reduces the demand for the light source and simplifies the complexity of the hardware system. To improve the reconstructed 3D image and avoid artificial overlapped objects in different depth slice planes, we present a reconstruction algorithm with disjoint constraint. Although the reconstruction algorithm was purposively designed for our 3D compressive imaging system, we would like to note that the algorithm can be extended to other applications of reconstruction in multidimensional CS systems. The main contributions of this paper are as follows:
We derive and prove the mathematical feasibility of three-dimensional and multi-dimensional simultaneous compressive sensing.
And we propose a 3D reconstruction algorithm based on Bregman’s iterative method, which takes advantage of prior knowledge of object space with disjoint constraint.
Based on compressed sensing, we present a framework of a 3D compressive imaging system using a single-pixel sensor and volume structure illumination. Additionally, a simulation and experiment demonstrate the feasibility of this algorithm.
2. Related Work
Some researchers have adapted CS to 3D imaging systems by employing single-pixel imaging, which requires fewer measurements to capture spatial information and results in faster measurements compared to traditional 3D imaging systems [
8,
9]. In this approach, a depth map is obtained using the conventional Time-of-Flight (TOF) camera method [
10,
11,
12] to generate a 3D image. The data post-processing involves CS reconstruction at each peak and the identification of peak locations. Snapshot compression imaging is grounded in the principles of CS and utilizes low-resolution detectors to achieve optical compression of high-resolution images. A significant challenge in this field is the construction of an optical projection system that satisfies the requirements for CS reconstruction. Esteban [
13] proposed a single-lens compression imaging architecture that optimizes optical projection by introducing aberrations in the pupil plane of the low-resolution imaging system. To accelerate the image reconstruction process in the terahertz compressed sensing single-pixel imaging system, Wang [
14] introduced a novel tensor-based compressed sensing model. This newly developed CS model significantly reduced the computational complexity of various CS algorithms by several orders of magnitude. Ndagijimana [
15] presented a method for extending a two-dimensional single-pixel terahertz imaging system to three dimensions using a single frequency. This approach achieved 3D resolution by leveraging the single-pixel method while avoiding mechanical scanning and eliminating the need for bandwidth through the use of a single frequency. To reduce artifacts and enhance the image quality of reconstructed scenes, Huang [
16] proposed an enhanced compressive single-pixel imaging technique utilizing zig-zag-ordered Walsh–Hadamard light modulation.
In recent years, advancements in computing power have propelled the rapid development of machine learning, particularly deep learning (DL) and other artificial intelligence algorithms. Researchers have begun to investigate the potential of applying machine learning to single-pixel imaging [
17,
18]. Saad [
19] developed a deep convolutional autoencoder network architecture, known as DCAN, which models and analyzes artifacts through context learning mechanisms. This approach employs convolutional neural networks for denoising, effectively eliminating ringing effects and enhancing the image quality of low-resolution images generated from Fourier single-pixel imaging. To tackle the issue of image quality degradation in low sampling rate scenarios of single-pixel imaging, Xu [
20] introduced the FSI-GAN method, which is based on generative adversarial networks. This method integrates perceptual loss, pixel domain loss, and frequency domain loss functions into the GAN model, thereby effectively preserving image details. Jiang [
21] designed an SR-FSI generative adversarial network that combines U-Net with an attention mechanism, overcoming the trade-off between efficiency and quality in Fourier single-pixel imaging. This network addresses the challenge of insufficient image quality in low sampling rate reconstruction, achieving high-resolution reconstructions from low-sampling-rate Fourier single-pixel imaging results. Lim [
22] conducted a comparative study of Fourier and Hadamard single-pixel imaging in the context of deep learning-enhanced image reconstruction. This study is notable for being the first to compare conventional Hadamard single-pixel imaging (SPI), Fourier SPI, and their DL-enhanced variants using a state-of-the-art nonlinear activation-free network. Song [
23] developed a Masked Attention Network to eliminate interference in the optical sections of samples. This network effectively addresses the problem of overlapping sections, which arises due to the limited axial resolution of photon-level single-pixel tomography. Although deep learning methods offer certain advantages in high-quality reconstruction and real-time performance, they experience a significant decline in generalization performance in scenarios with limited samples. For example, these methods require a substantial amount of labeled data for training, and the reconstruction quality may be poor in scenarios that are either absent or not represented in the training data.
3. Three-Dimensional Extension of Compressive Imaging
Given the sparse nature of most objects, CS is capable of measuring signals with significantly fewer measurements than the native dimensionality of the signals, constituting one of the greatest advantages of measurement systems based on this technique. A linear measurement system is typically modeled as follows:
where the vector
represents a signal from the measurements, the matrix
denotes the measurement projection matrix depending on the measurement method and system parameters,
x is the information of interest which can be represented a vector
, and
denotes random noise. Some advanced linear measurement systems transform
x to another domain by using a transform projection
, where
represents the transform matrix and
remains a vector of
. To obtain the solution of the underlying
x or
, M = N is a necessary condition to keep the traditional measurement systems nonsingular. The CS paradigm exploits the inherent sparsity of the information of interest to obtain the solution of
x or
from under-determined systems (M < N). A sparse vector has a much smaller number of non-zero elements than the native dimensionality of the vector, e.g., K (K < N, or K << N) non-zero entries in vector
. Solving a noise-free under-determined problem with sparsity regularization is akin to solving an
L0 norm problem. While it is combinatorially expensive to solve the
L0 problem, it has been proven that a recovery sparse signal
can be obtained by solving an
L1-norm constrained minimization problem known as a basis pursuit problem:
where
is used herein for generality (if T is a trivial basis transform projection
,
equals
),
denotes the
L1 norm, and
is the measurement matrix. Importantly, when the measurement matrix
satisfies the restricted isometry property, a perfect reconstruction of the sparse signal is guaranteed using random projection, with the number of measurements being M = O (
).
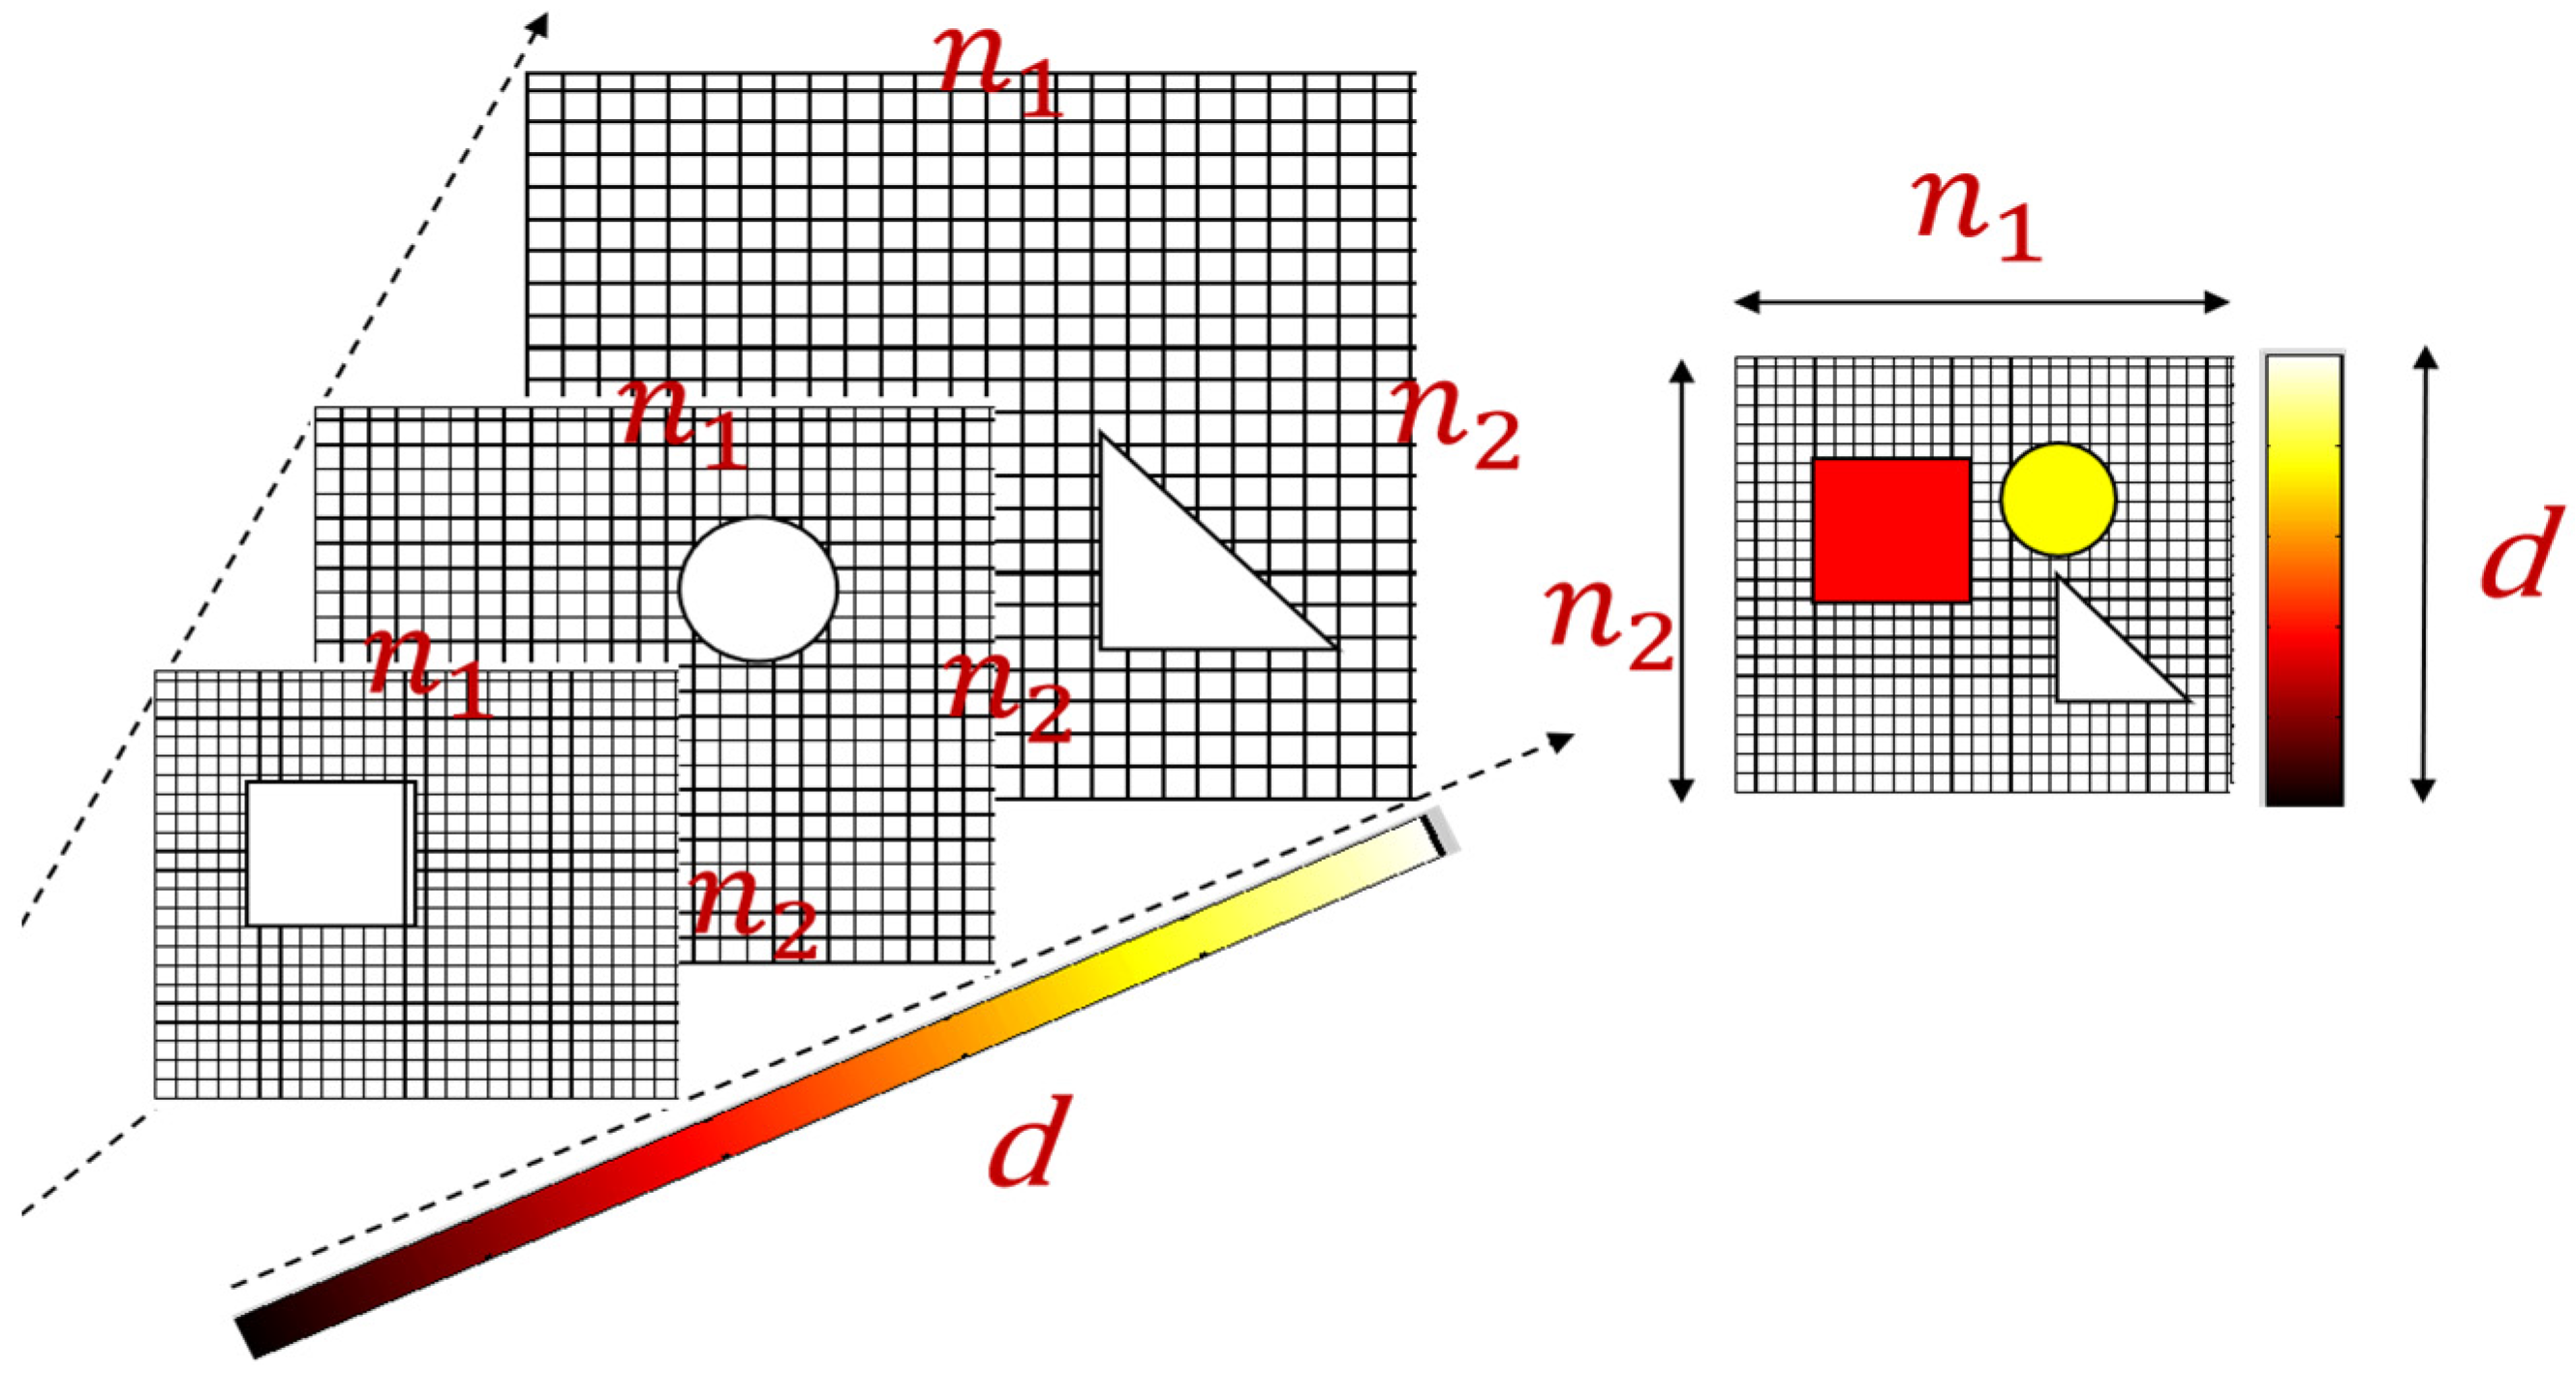
Before describing the framework of our three-dimensional compressive imaging (3DCI), we briefly exploit the CS form to the three-dimensional signal. We represent a three-dimensional signal of Cartesian coordinates with a matrix
, where
n1 and
n2 denote the spatial resolution of the lateral plane slides the scene, and
d is the resolution along the axial axis (see
Figure 1). In each measurement, a linear measurement projection
is projected to the object scene and the measurement signal
is captured. From Equation (1),
x and
Pr are, respectively, reformed to a column vector
and a row
by a vectorization operation.
In a noise-free measurement system, equals the inner product of x and . Finding a feasible linear measurement projection is the principal challenge of constructing a 3D CS imaging system.
It is important to note that the signal can also keep a matrix form that makes the 2D transformation convenient and also brings structure benefit, which will be discussed in
Section 4 and
Section 5. Let us reform the signal matrix as
, and also
and
θ. The vectorization operator denoted as ‘vec’ is used to stack the columns of the matrix on top of one another. Given m measurements, Equation (1) can be reformed as follows:
where
is a 2D transform matrix and
is a transpose of the matrix
. According to the compatibility property of the Kronecker product, the derivation from Equation (1) to Equation (3) is trivial and is hence omitted from this paper. By using Equation (3), not only is the form of the matrix of the signal kept, but also the construct of a compressive matrix is calculated. Otherwise, the present solution for Equation (2) is suitable for Equation (3).
The intrinsic essence of compressed sensing theory lies in the sparsity of the measured signal and the linear measurement properties of the detection system, thereby ensuring the adaptability of the L1-norm-based solution method, which is highly scalable. Under this premise, the dimensional characterization of detection information in actual detection scenarios is merely reflected in the different mathematical expressions of the sensing matrix and the sensing space.
4. Framework of Single-Pixel 3D Compressive Imaging System
Before we describe the single-pixel 3D compressive imaging system (SP3DCI), we will define the model represented by the 3D scene and the objects utilized in this paper, as illustrated in
Figure 1. The measurement scope pyramid in the 3D space of interest was discretely labeled in multiple slices of parallel planes, each containing an equal number of pixels. Specifically, the size of the pixels varied along the depth axis to maintain a consistent number of pixels across each lateral plane.
The objects were labeled as a 3D matrix
, with entries having a value of reflectivity at the pixel grid at the corresponding location. When recalling the linear measurement requirements for the measurement projection matrix
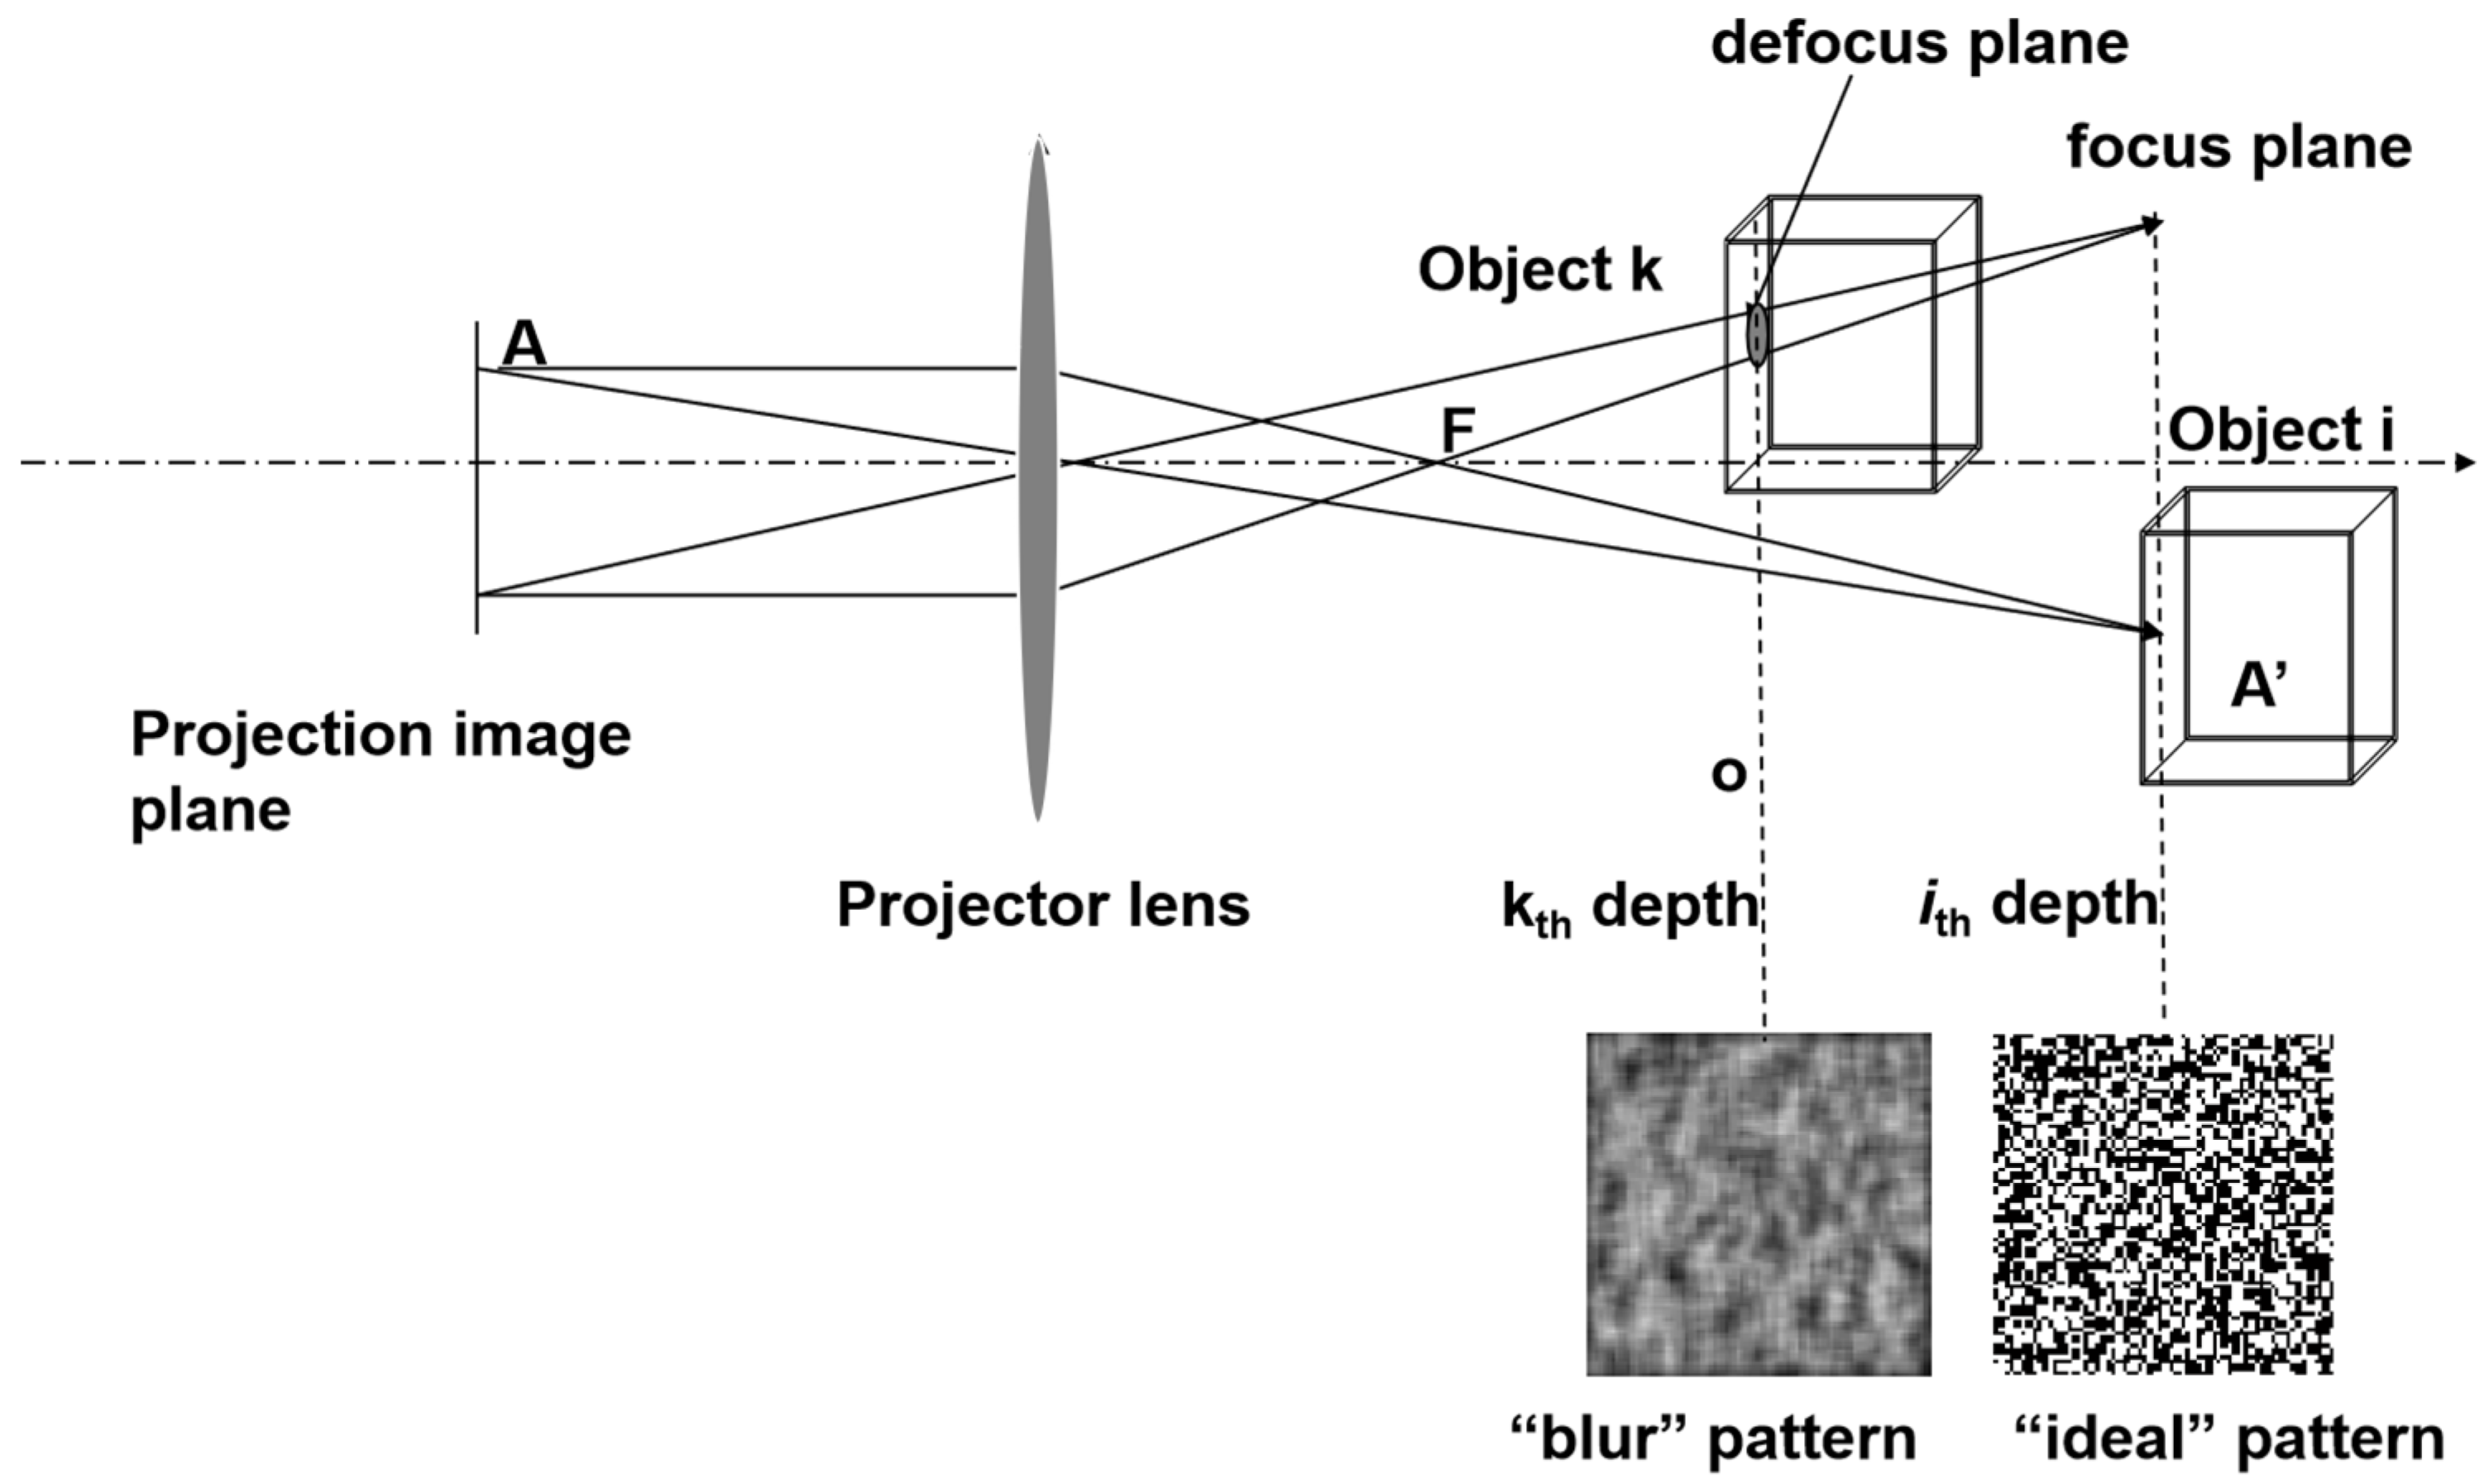
Pi for 3D compressive imaging, the random projection of the 3D scene of interest resulted in measurements of the 3D compression ratio. We then introduced the concept of random volume structured illumination, which was adapted to the pyramid of the 3D object scene, as illustrated in
Figure 2. The intensity distribution of each lateral plane at the
kth depth was the sum of the distribution from the focal plane and the defocus patterns from other planes. These patterns were derived from a 2D convolution of the defocus blurring function, and the original random pattern is as follows:
where
and
denote, respectively, the ideal all-in-focus random projection pattern and the spatially defocused kernel from the
ith depth projecting to the
kth depth along the axis. In the simulation,
could be a disk function or 2D Gaussian function at the relative position of
i and
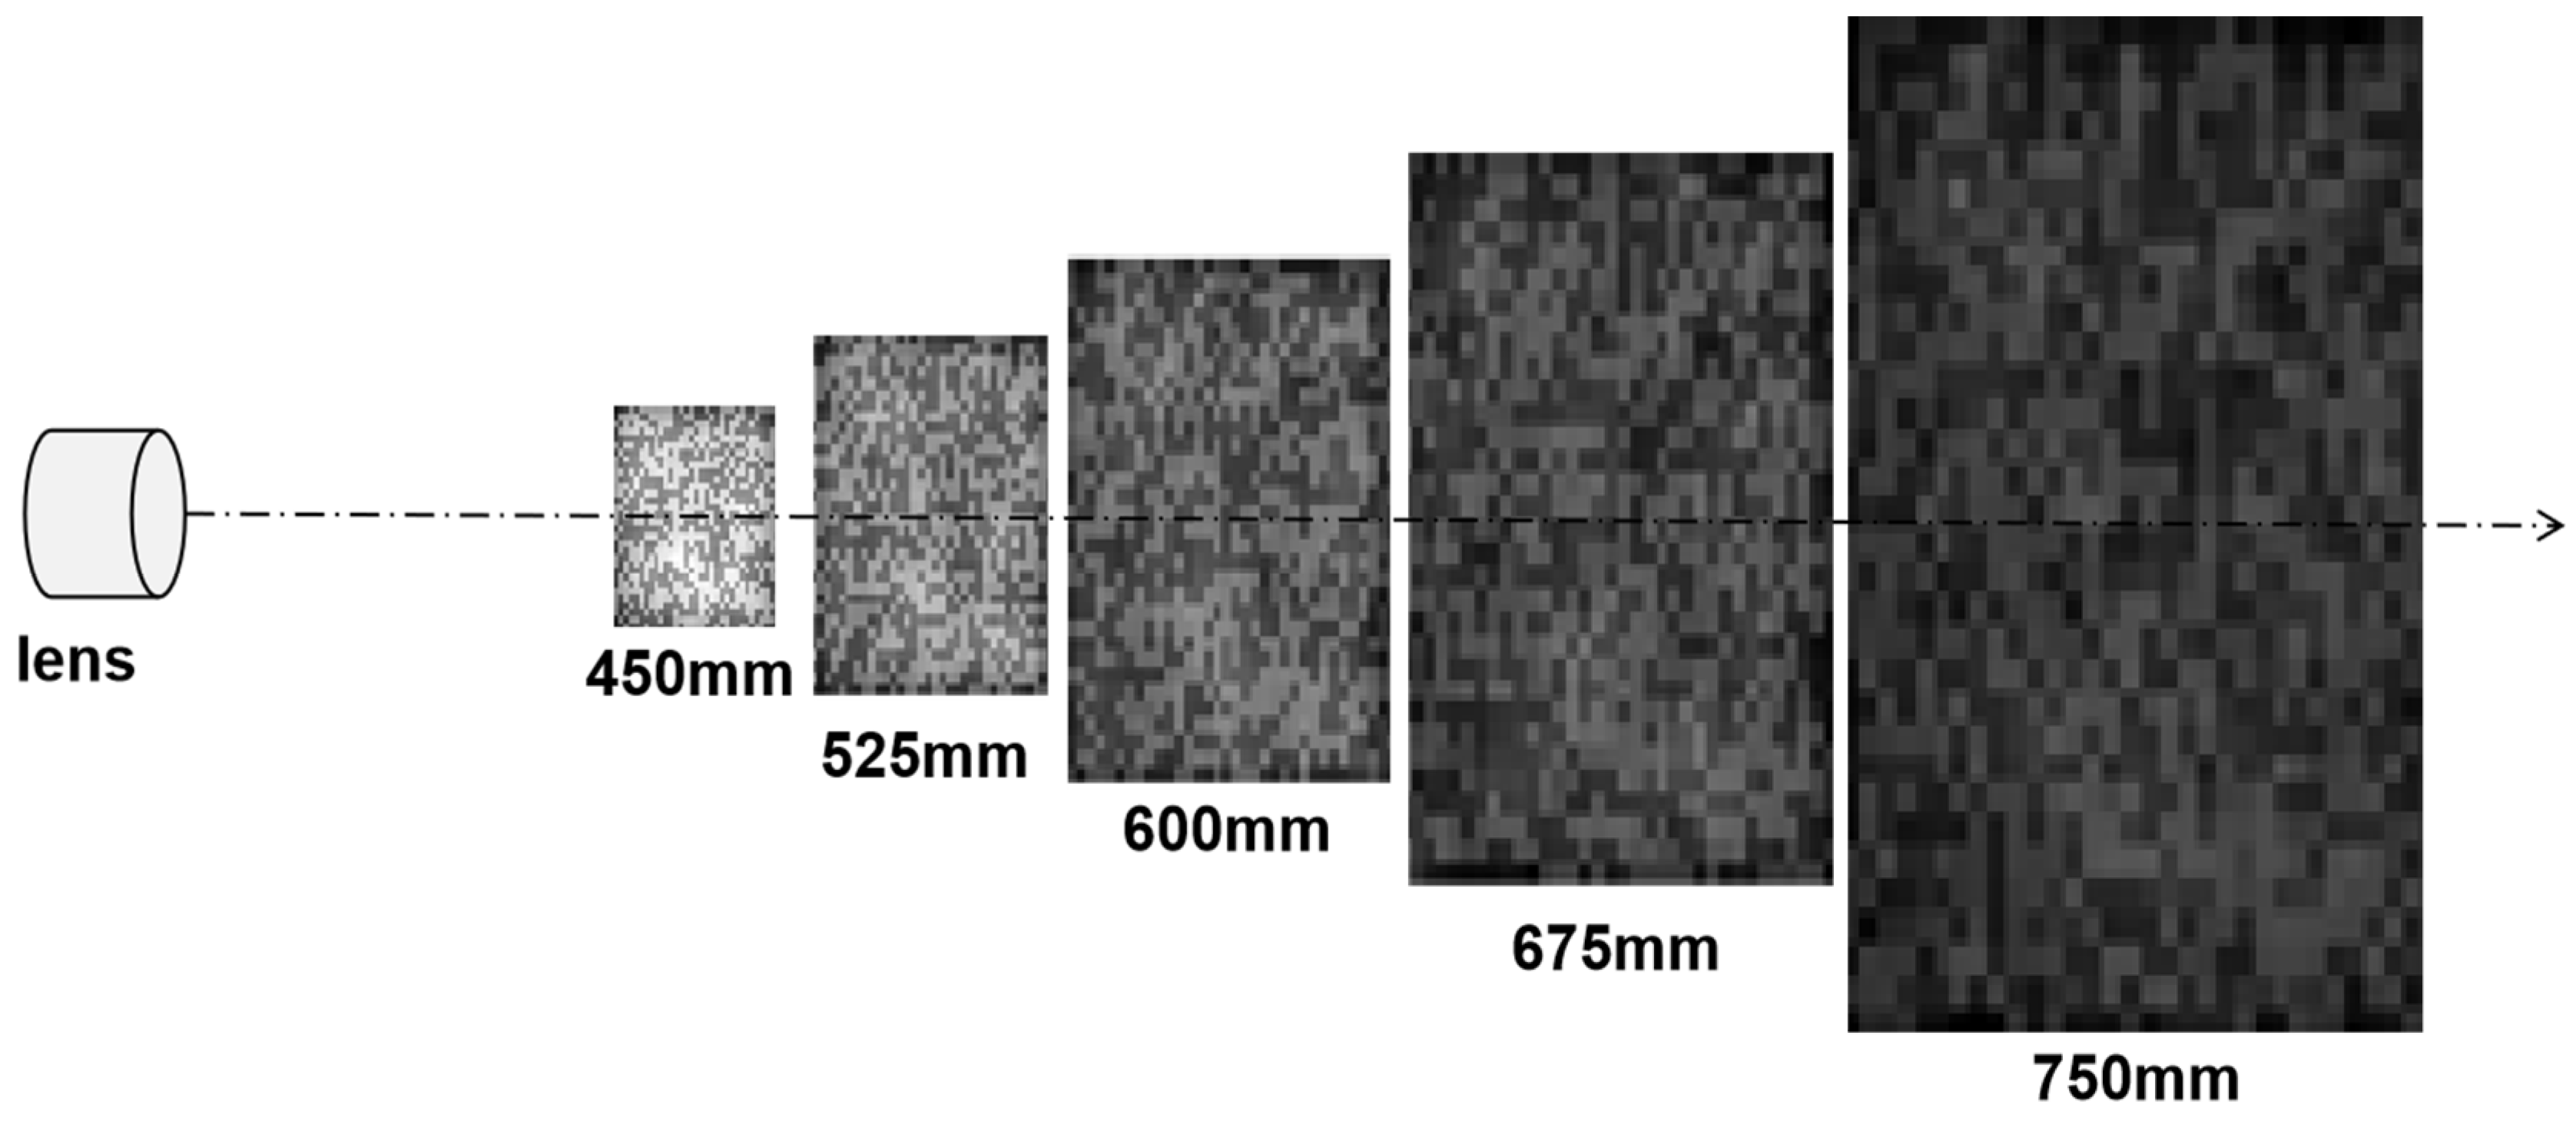
k. One example of 3D volume structure illuminations is shown in
Figure 3.
In each measurement, the one-pixel sensor received the reflected optical flow from the 3D objects as
where
is the cumulative illumination quantity of the point spread function projected by a random matrix onto the target.
We observed that the imaging system could only identify one corresponding pixel at various depths when dealing with non-transparent objects. This meant that an object positioned closer to the imaging system was likely to obstruct the view of objects located behind it if they overlapped in the lateral plane. A preliminary condition would facilitate the estimation process [
7]. Consequently, we were motivated to incorporate a disjoint constraint into the traditional CS equation.
Next, we found a mathematical expression for the non-overlapping features in 3D imaging in the framework of compressed sensing. Let us keep the matrix form of the 3D object signals as
, where each row vector of the matrix represents all the corresponding pixels at all
depths, and there is at most one non-zero entry in each row. The mathematical expression of this constraint is as follows:
where
denotes the
kth row of
, and
represents the L
0-norm, which is a stricter constraint than the original L
0-norm constraint in the CS and is another combinatorially high-cost problem. Notably, one definite inference from Equation (6) is that every column in x is orthogonal to the others, that is,
where
represents the column vector of
x, and
is a constant (≥0) that differs for different
i. One operational expression is
where
is a diagonal matrix. Now we could formulate our 3D compressive imaging measurement design problem, which we have presented as the following constrained optimization problem:
where
,
is a coefficient matrix from a basis transform projection
, and we make the lateral plane square and its spatial resolution is
, and
is a symmetric positive definite matrix. The L1 minimization problem has a data-fidelity constraint and non-overlapped constraint, and
is a constraint to make sure that the reconstruction is non-negative.
5. Proposed Algorithm of 3D Compressive Imaging
When theoretically extending single-detector three-dimensional synchronized compressed sensing in
Section 3, the solution approach for compressed sensing in Equation (3) remains useful, requiring only modifications to the shape of the measurement matrix and the target based on our conceptual framework. However, when implementing a practical synchronized compressed optical sensing experimental system using the actual 3D volume structure illumination from
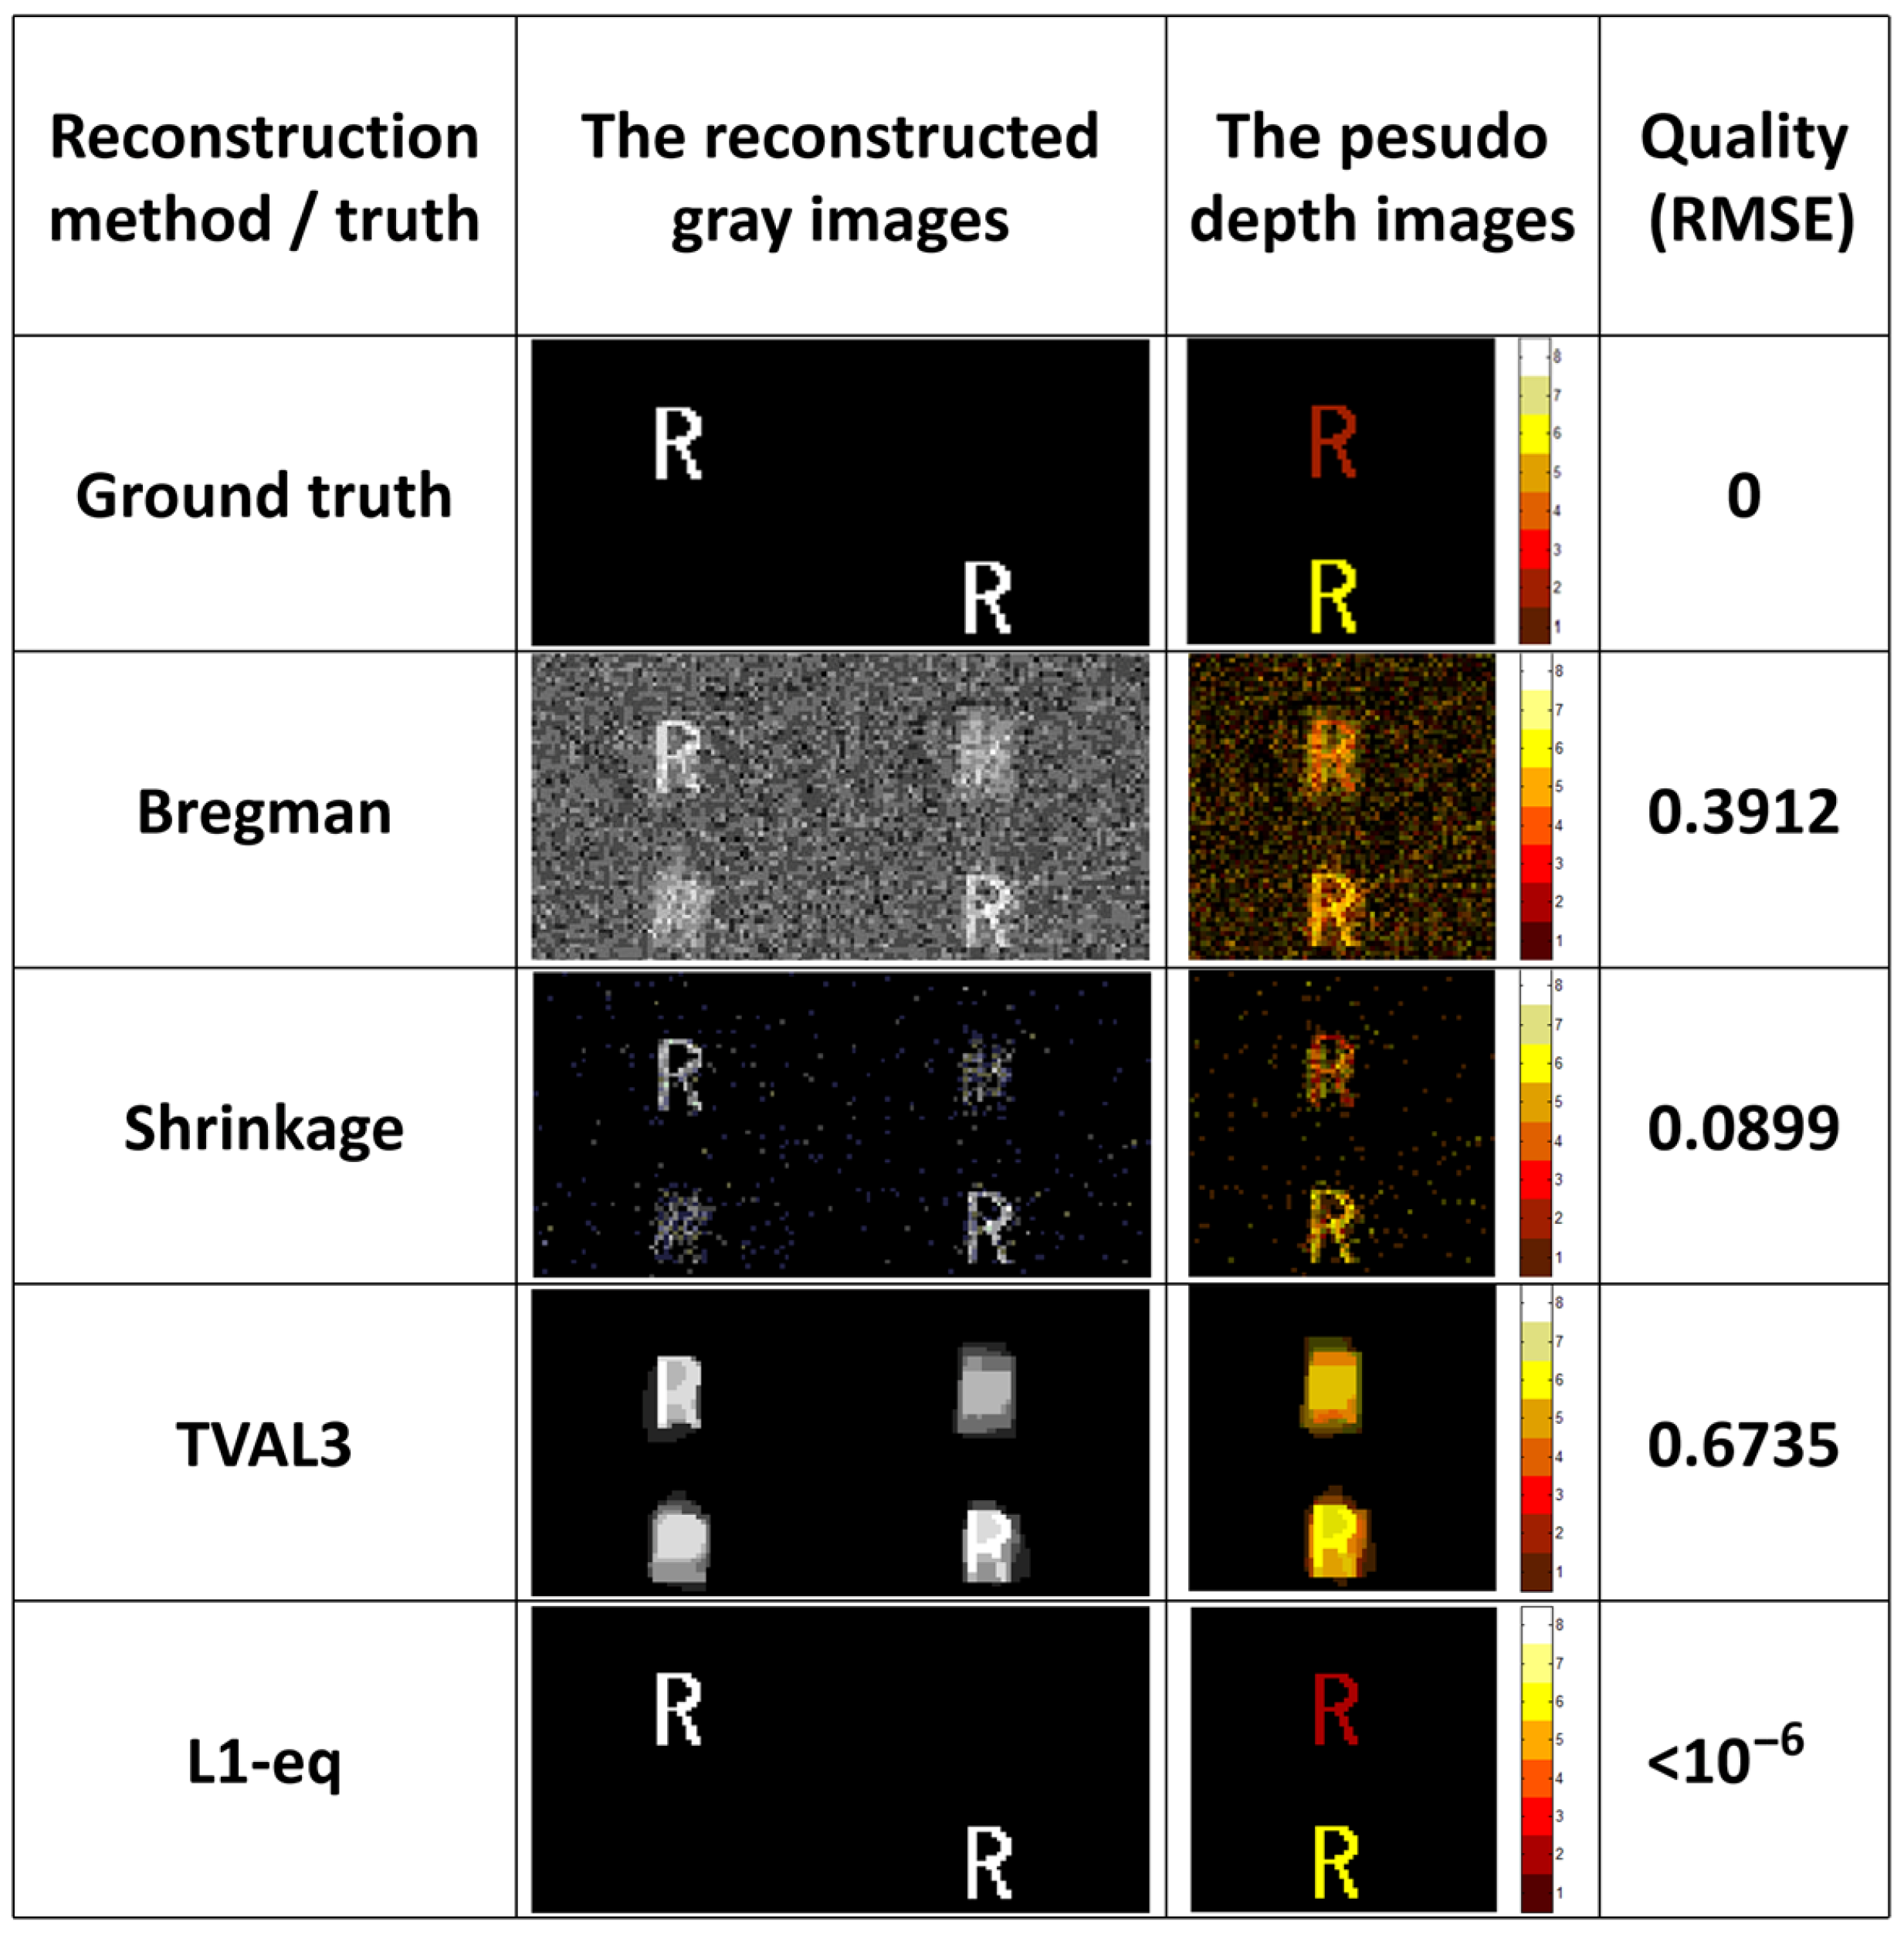
Section 4, it introduces a spatially defocused kernel that exhibits correlations with other depth vectors in the measurement matrix. Under similar circumstances, the original compressed sensing reconstruction methods did not account for optical non-overlapping constraints, where targets at different depths cannot overlap. Therefore, classic compressed sensing reconstruction methods such as TVAL3, Bregman, Shrinkage and L1-eq were used for simulation reconstruction experiments without noise to verify their feasibility. We set
n = 64, with two targets ‘R’ located at depths of 1500 mm and 3300 mm, respectively, occupying the upper and lower halves of the image plane.
To our knowledge, there is currently no solution to Equation (9). The results of the algorithm comparison experiment for noise-free signal recovery are shown in
Figure 4. We found that TVAL3 performed the worst in terms of recovery effectiveness without constraints; both the colors and shapes in its pseudo-color images were difficult to distinguish, whereas L1-eq performed very well. However, in later stages, when we attempted recovery using actual captured data from our hardware experiment, we found that none of these existing reconstruction algorithms could successfully recover a target. Consequently, we had to attempt to incorporate constraints into the recovery algorithm to enhance its reconstruction performance, using the L1-eq as a reference algorithm for our proposed algorithm for single-pixel three-dimensional compressive imaging systems.
The introduction of a non-overlapping constraint was intended to ensure that, within the depth dimension of 3D imaging, only the surface of the closest opaque objects to the imaging system are assigned a value, while all other elements in this depth dimension are set to zero. This constraint is commonly adhered to in optical 3D surface modeling and target depth detection. The mathematical derivation of this specific constraint is detailed in Equations (6)–(8), as presented in
Section 4.
Therefore, we developed an algorithm for the aforementioned model using L1-norm minimization, which is applied in both our numerical simulations and the reconstruction of our experimental data. The proposed algorithm is primarily based on the framework of Bregman iterative regularization for L1 minimization, an efficient method for addressing the fundamental pursuit problem. Each iteration consists of three steps.
As introduced in
Section 4,
is a symmetric positive definite matrix in Equation (9). We first introduce, utilizing
, the split orthogonality constraint, a new function where both
and
are convex. Therefore, the sum of them is also convex. Thus, the first step is to solve the unconstrained convex problem. We attempted the shrinkage method, also known as soft thresholding, to obtain a solution for every iteration when we realized that it was a convex optimization problem without constraints.The algorithmic framework was depicted in Algorithm 1.
Firstly, a shrinkage operation was performed to obtain the iterative update of
, also known as a shrinkage-thresholding operation, which will solve the L1 minimization problem with a data-fidelity constraint as follows:
where
. Note that here,
is an “adding noise back” iterative signal that not only makes
a data-fidelity constraint but also gives it the property of a Bregman distance. The shrinkage–thresholding operation is based on the gradient algorithm, which converts Equation (10) to follow an iterative scheme:
where
is a positive step size at iterative
k, and
is a matrix gradient of
, which can be derived from Equation (9) as follows:
where
represents the random projection matrix of the
ith measurement and
is an operation to sum all the elements in the diagonal from the upper left to the lower right of the matrix. The parameter
can be obtained by a component-wise shrinkage operation:
where
. Subsequently, we can convert
to object space
and apply the disjoint constraint
and positive constraint sequentially.
To keep the constraint, the procedure of the proposed algorithm has two steps. Firstly, we employed a diagonal matrix to exclude the energy same proportion of each depth of the current estimate object from the shrinkage operation. Secondly, the Orthogonal Procrustes matrix operation was introduced, which could be rebuilt to a matrix with one depth image orthogonal to the others, where we computed SVD factorization by singular value decomposition , was computed by , and the matrix I is an eye matrix of .
Finally,
was projected onto the coefficient space using
and put into the equivalent expression of the Bregman distance procedure as follows:
Note that Equation (14) adds the noise from the constraint back to the L1 minimization procedure and alternately minimized until converging.
| Algorithm 1 Bregman’s iterative method as the solution to Equation (9) |
Input: s, P, , , c
While “stop criteria c” are not satisfied, repeat
1: Shrinkage operation to find the by Equation (12),
2: Orthogonal Procrustes matrix operation to get and apply positive constraint on the object space,
3: Equivalent Bregman distance to update by Equation (13).
End
Output |
6. Numerical Simulation and Reconstruction Performance Analysis
In this section, we theoretically demonstrate the feasibility and potential of the proposed method by presenting simulation results of CS reconstruction of 3D objects using pseudo-random volume structured illumination. Volume structured illumination was simulated through optical systems utilizing digital micromirror device (DMD) projectors with a pixel size of 7.6 μm and a projection lens with an effective focal length of 14.95 mm and an F-number of 2. By adjusting the imaging distances, we obtained volume pseudo-random intensity distributions across five different lateral planes ranging from 450 mm to 750 mm at equal intervals, with example patterns illustrated in
Figure 2. In the remainder of this paper, we employ the normalized root mean square error (RMSE) metric to assess reconstruction error, which is defined as
, where DR denotes the object dynamic range, and
and
are, respectively, the three-dimensional reconstructed signal and the ground true signal. Note that the RMSE here is a joint evaluation with both the location and the reflective ratio of objects.
Firstly, the noiseless 3D CS simulation results use the three objects shown in
Figure 5. Note that objects have a sparsity of K = 125, N = 5120, thus M = O (Klog(N/K)) = O (464.0745) (e.g., measurement ratio ≥ 9.09%).
As illustrated in
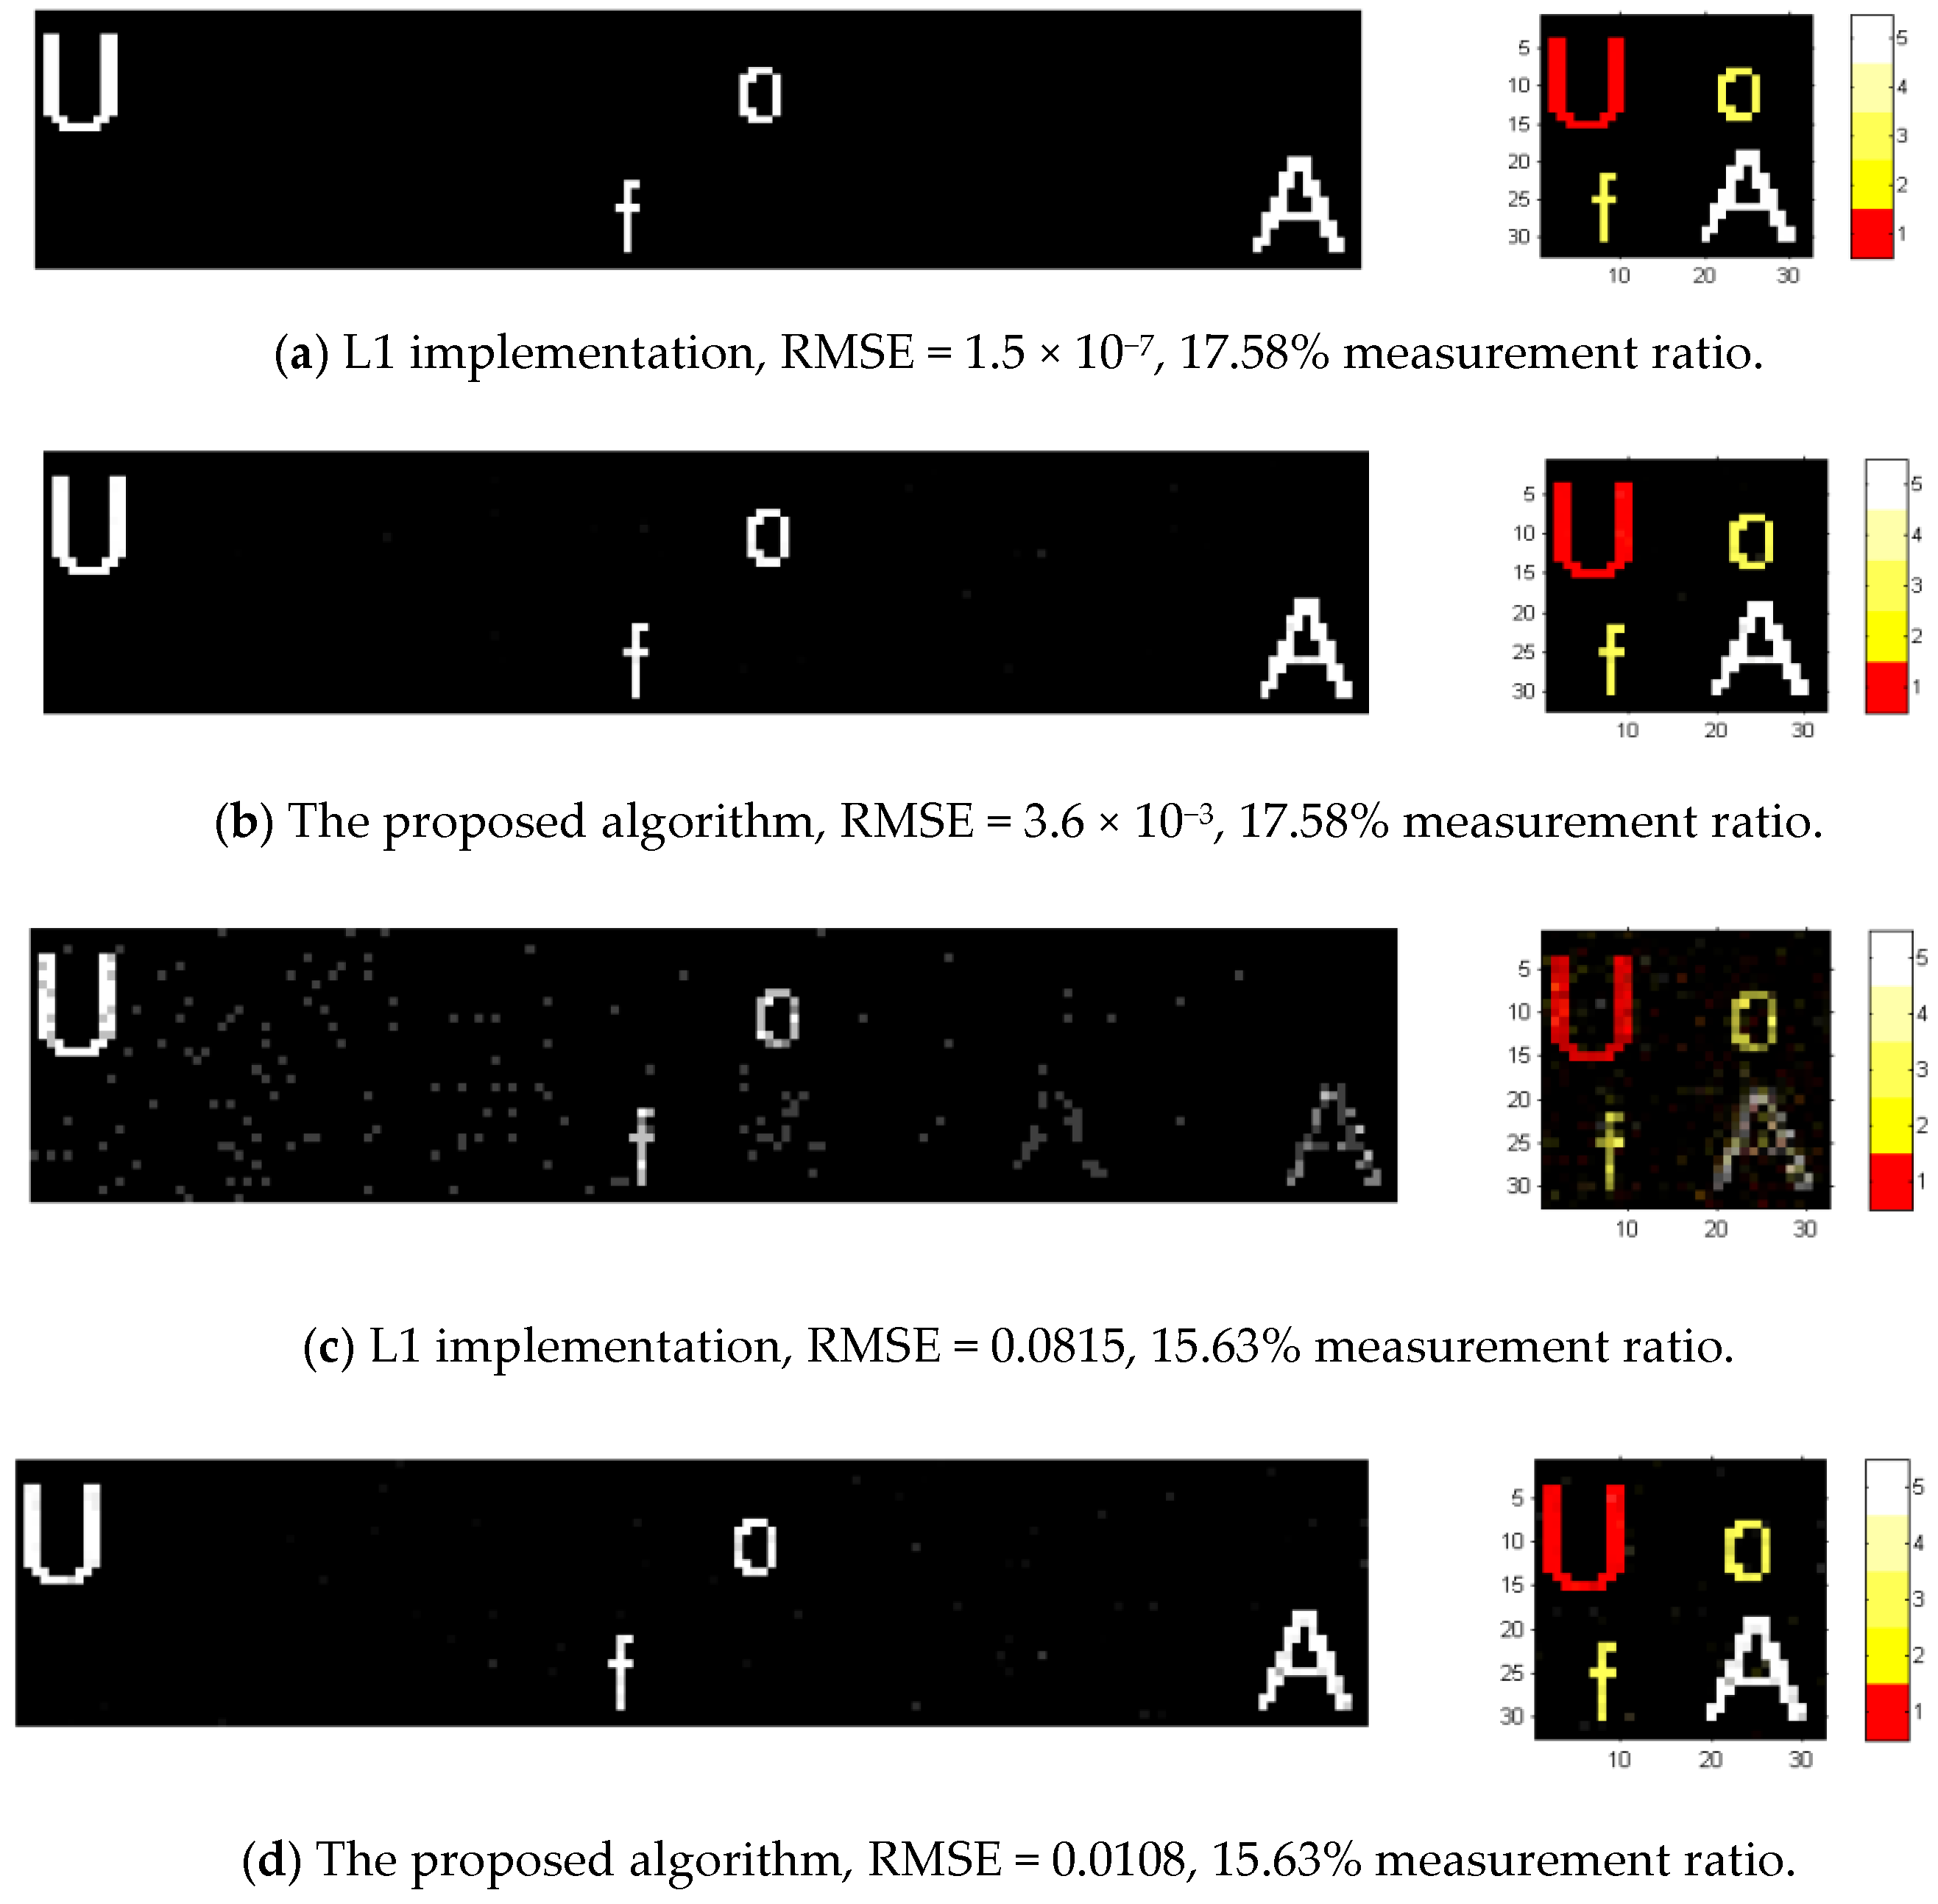
Figure 6a, we implemented the L1 magic algorithm in the reconstruction simulation within a framework based on Equation (9) without a disjoint constraint. In
Figure 6b, the simulation operates under the framework based on Equation (9) with the constraint, utilizing the proposed algorithm with the user-defined parameters
and
.
In the noiseless situation, our simulations demonstrated an exact reconstruction of 3D objects with a 17.58% measurement ratio using just M = 900, both using L1 magic implementation without constraints and our algorithm with a disjoint constraint. As illustrated in
Figure 6c, the reconstructed image from the L1 magic algorithm exhibits overlapping pixels in the lateral planes at depths 3, 4, and 5, which are the indices of depth in the pseudo-color, pseudo depth images (e.g., 600 mm, 675 mm, 750 mm), resulting in poor RMSE performance. The proposed algorithm effectively addresses the issue of overlapping pixels and demonstrates significantly improved RMSE performance. Further simulations yield an acceptable reconstruction with an RMSE of 0.0556 using only 600 measurements (e.g., measurement ratio = 11.71%), as shown in
Figure 7.
In physical systems, measurements are often subject to noise. In addition to the various types of noise associated with specific imaging systems, noise from the detector and readout circuit represents a universal and significant component that is challenging to compensate for. This noise is effectively modeled as Additive White Gaussian Noise (AWGN), characterized by a zero mean and a standard deviation. In our simulation of a noisy compressive system, the standard deviation is defined as a percentage of the average received intensity from our structured illumination volume.
To simulate noise, we modified the optical intensity signals obtained from the noise-free simulation experiment. The process involved averaging received optical intensity signals and subsequently multiplying them by a noise factor, such as 1% or 2%. We then multiplied this result by a random number drawn from a distribution defined by a probability distribution function with a mean of 1. The resultant values were then added back as AWGN. An increase in the number of measurements would enhance reconstruction performance in both noiseless and noisy scenarios; therefore, we also incorporated the measurement ratio into the simulation of noisy measurements.
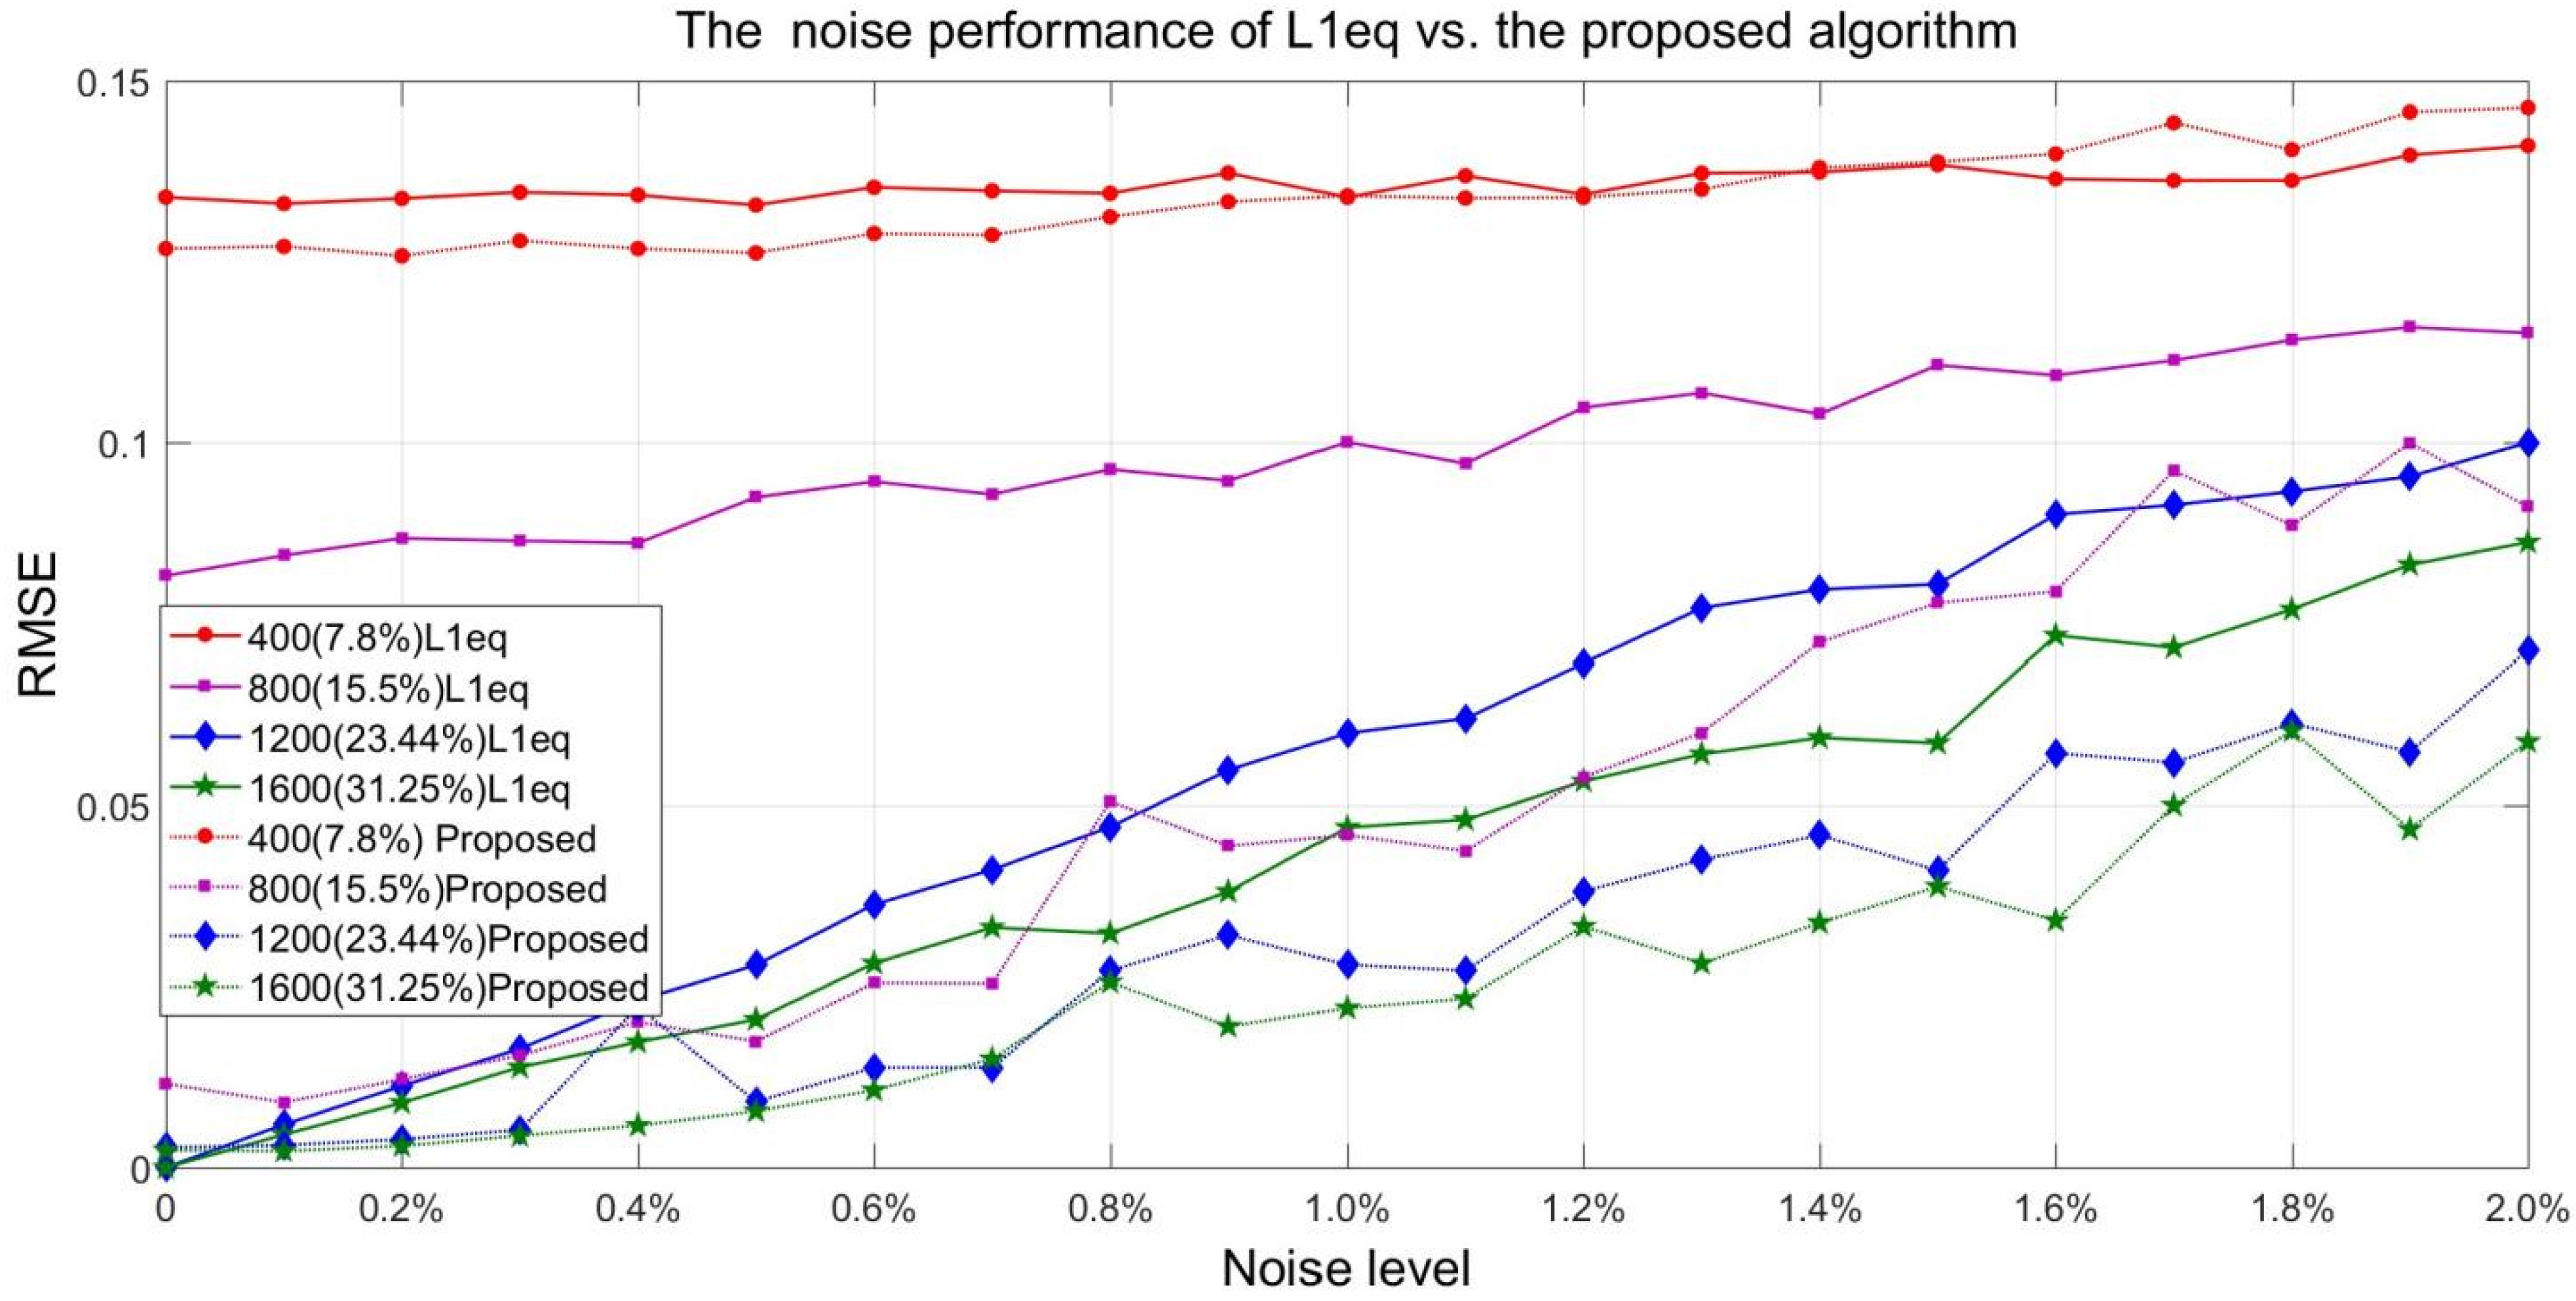
From
Figure 8, we can observe that the reconstruction performance was influenced by both the measurement ratio (the number of measurements) and the noise level. For a fixed number of measurements, the root mean square error (RMSE) of reconstruction increases as the noise level rises. The simulation results clearly demonstrate a superior RMSE performance, showing a difference of 30% compared to the L1 magic method without constraints at a 2% noise level. It is important to note that a 2% noise level corresponds to 2% noise of the total received energy from objects with a single projection pattern, which equates to a signal-to-noise ratio (SNR) of 17 dB, while a 1% noise level corresponds to an SNR of 20 dB.
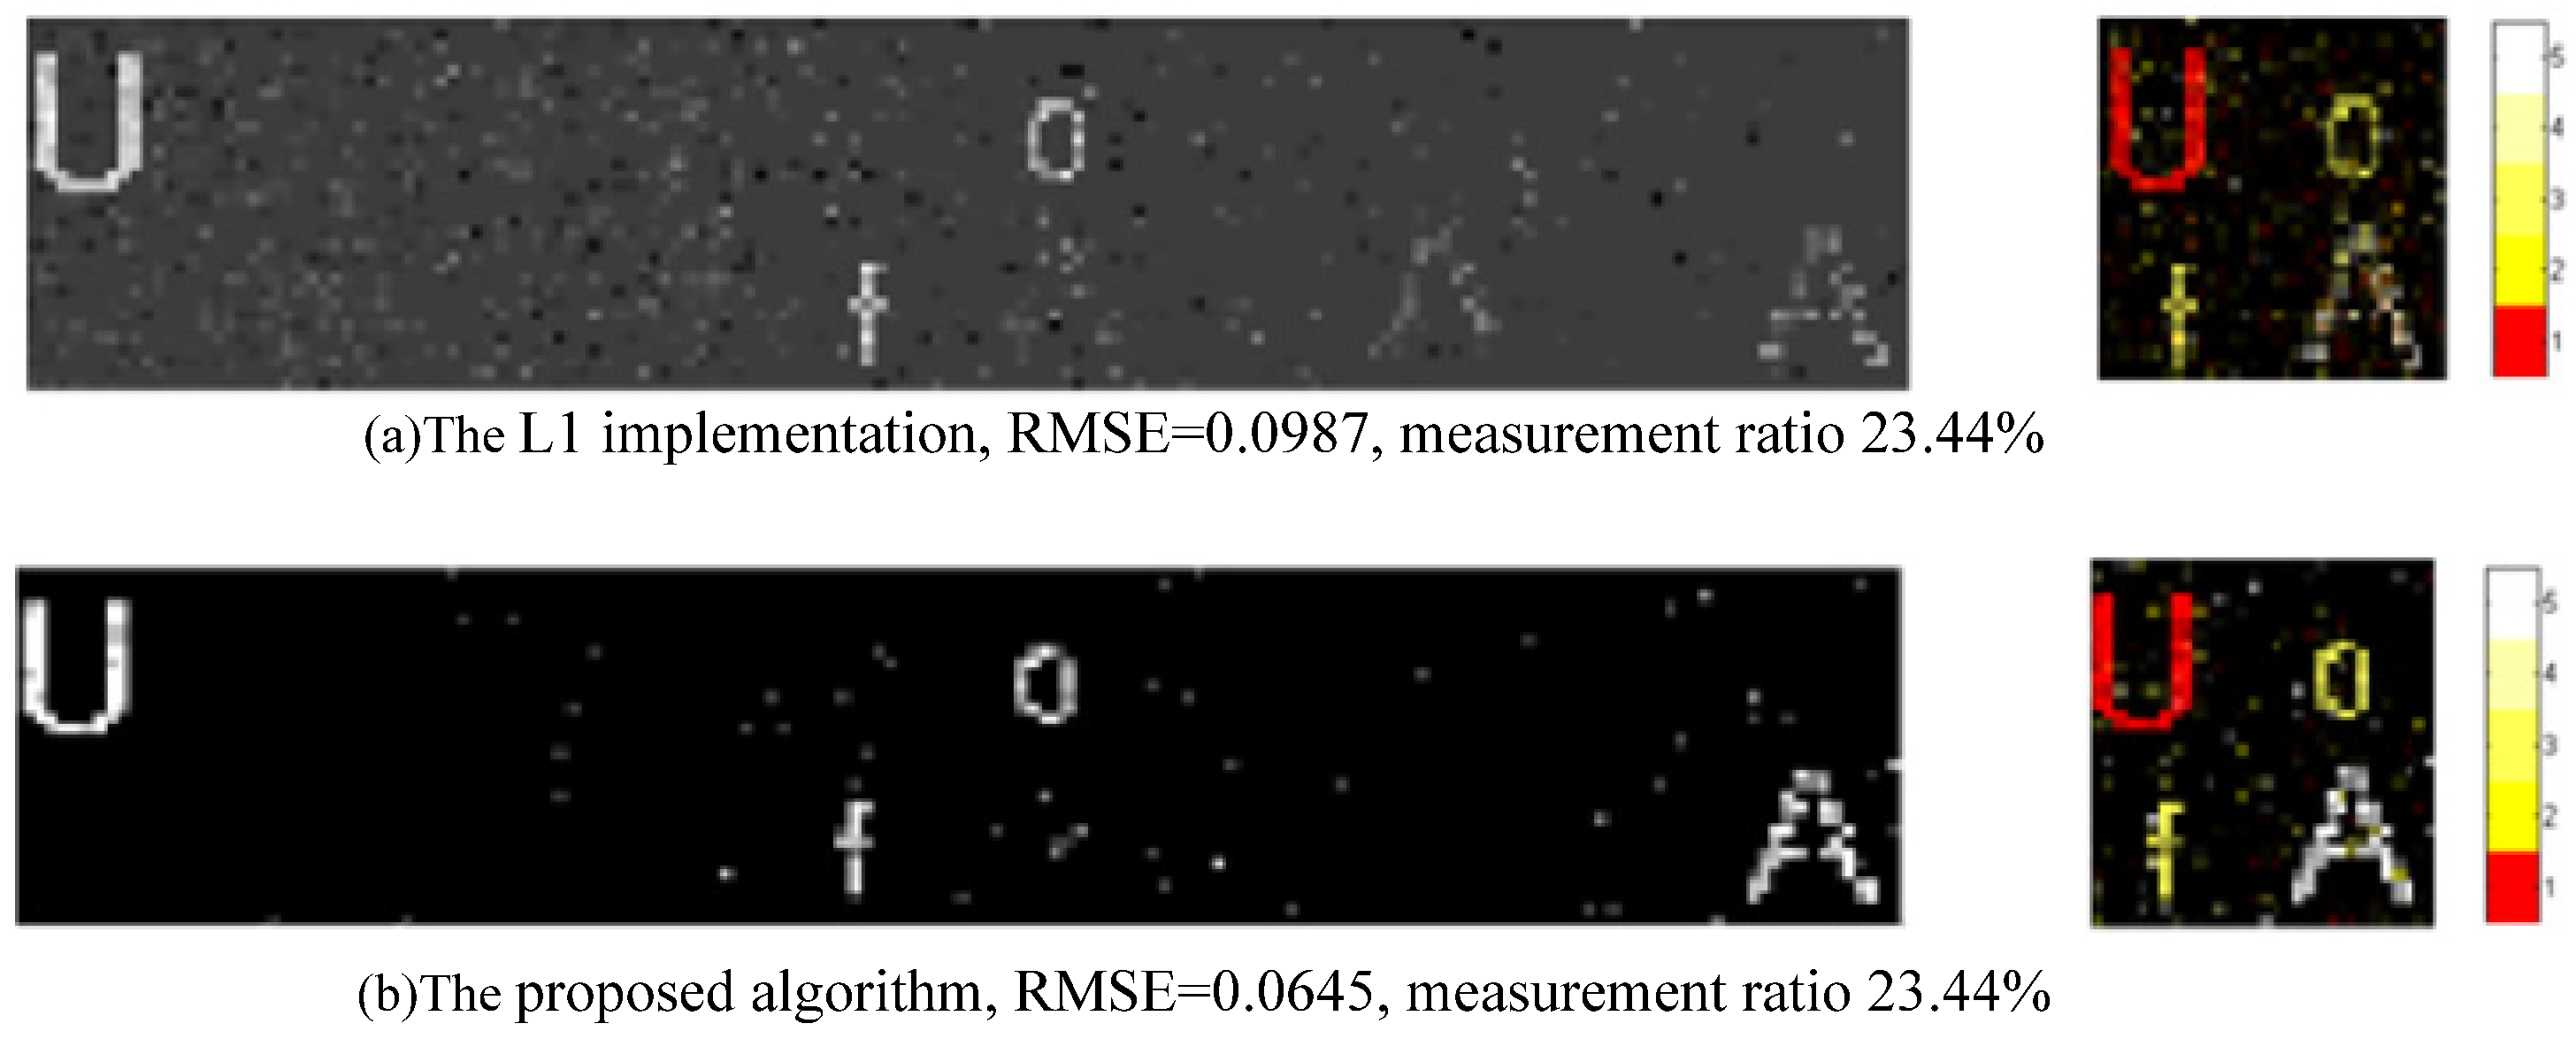
Therefore, we can conclude that employing our constrained algorithm enhances RMSE performance under the same measurement ratio. The simulation indicates that our algorithm is more effective at managing noise, thereby making the proposed single-pixel three-dimensional compressive imaging system more viable. An example of the reconstruction is illustrated in
Figure 9, where the measurement ratio is 23.44% with a noise level of 2%. It is noteworthy that the RMSE does not improve when the noise level exceeds 10% (e.g., SNR = 10 dB). However, we can observe that the same RMSE level of reconstruction can be achieved by increasing the measurement ratio for a given noise level.
7. Prototype of Single-Pixel Three-Dimensional Compressive Imaging System
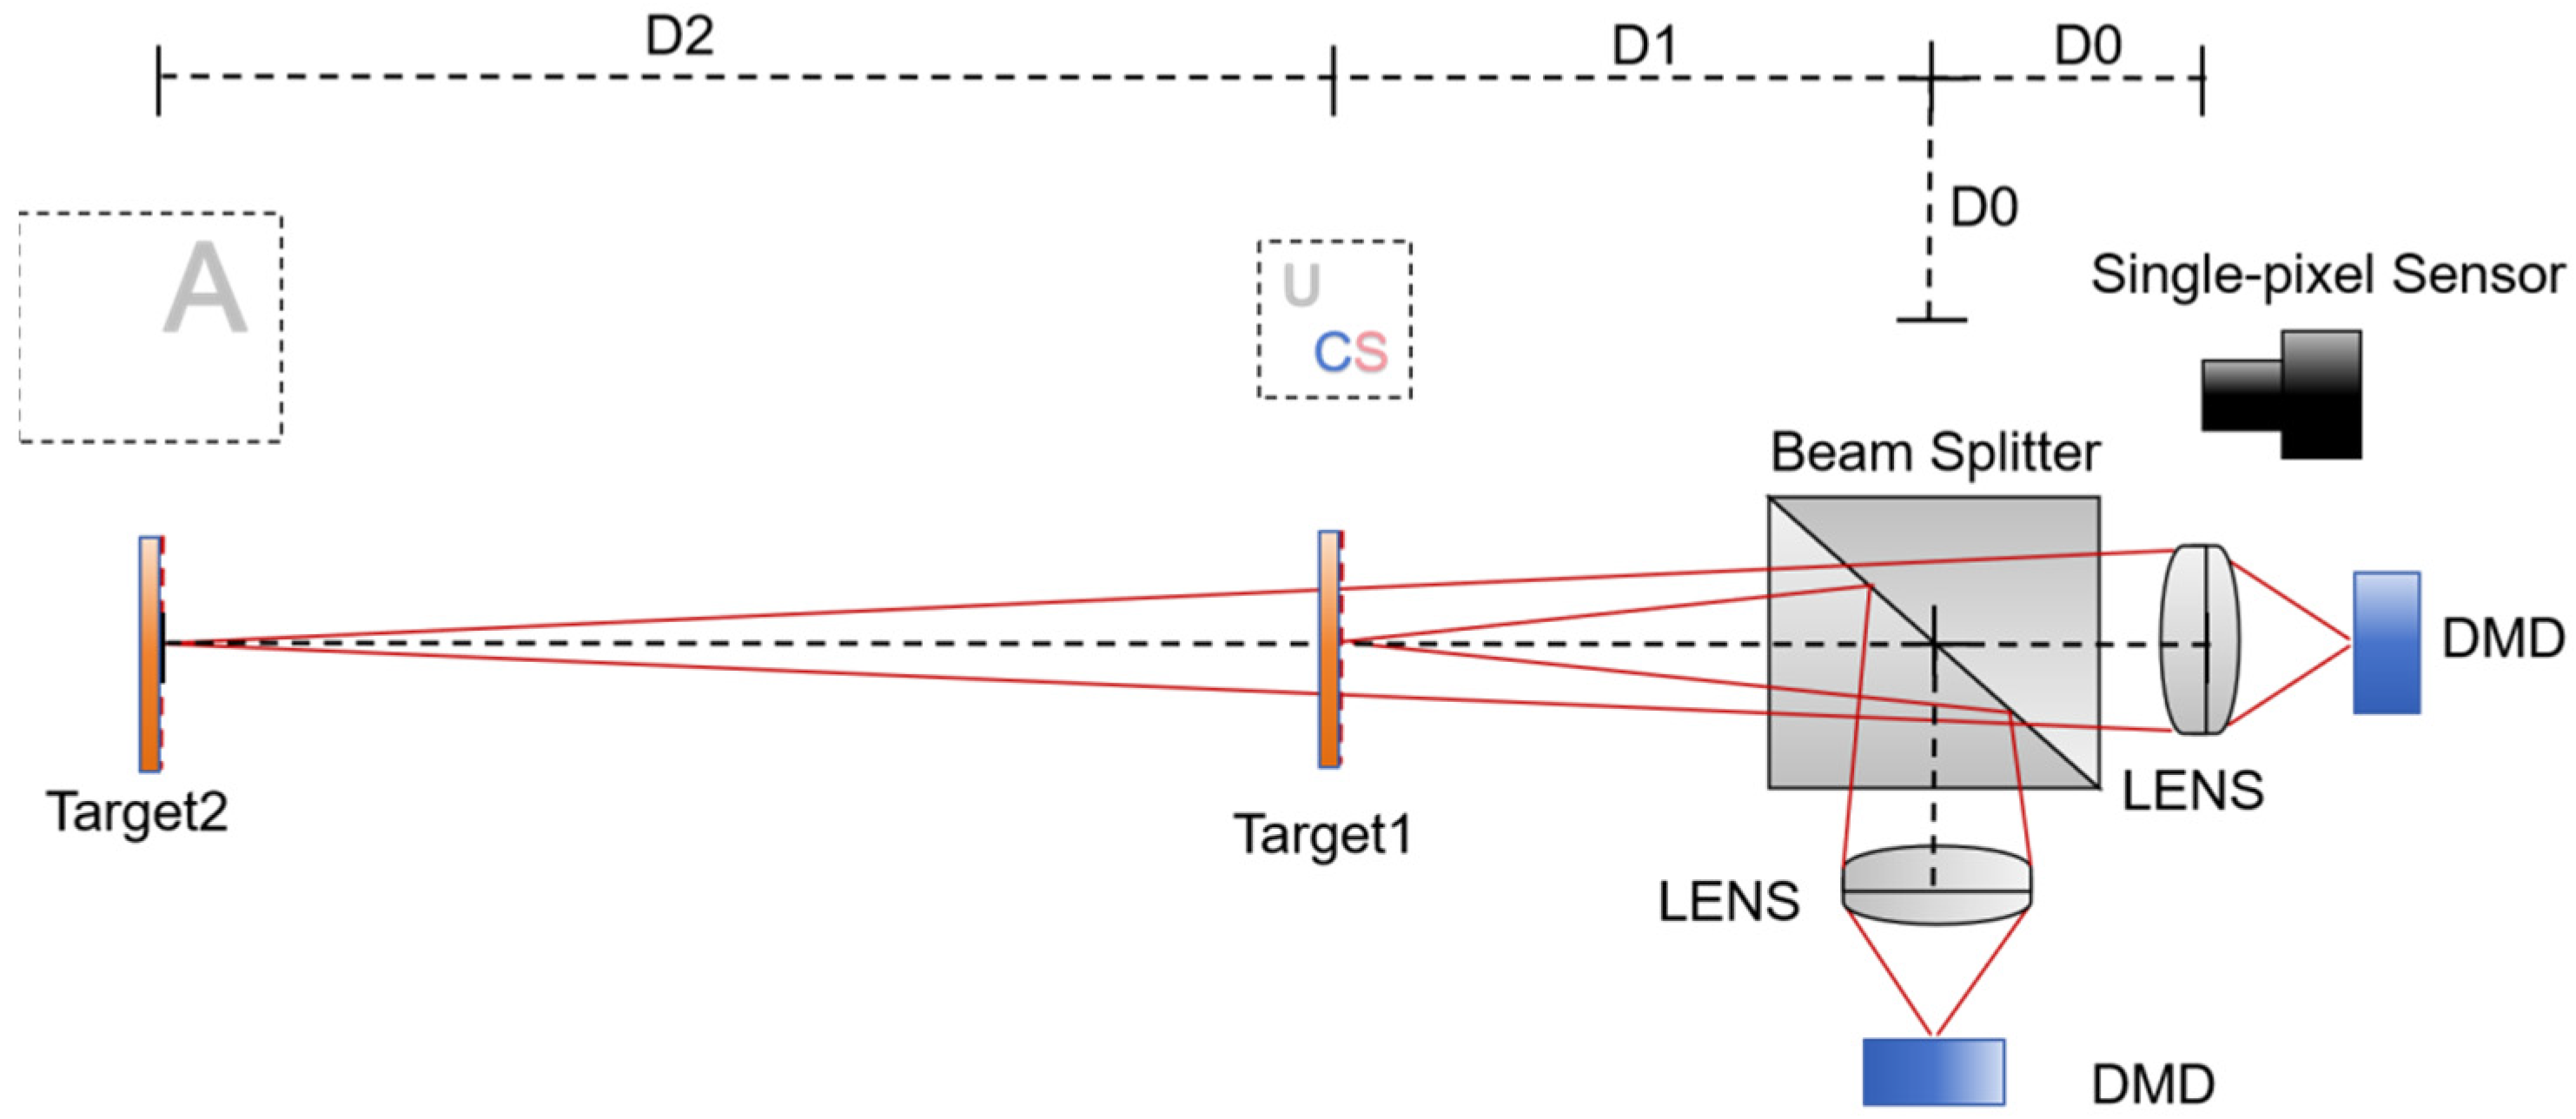
In this section, we experimentally demonstrate the feasibility of the proposed single-pixel three-dimensional compressive imaging system. As seen in the schematic presented in
Figure 10, the experimental setup primarily consisted of two adjustable projection lenses that generate projection patterns at different distances. These patterns were then merged along the main projection optical axis by a 50:50 beam splitter to form a volume structured illumination. We set the same working distance, D0, between the two projection lenses and the beam splitter, ensuring the coincidence of the illumination starting points for our volume structured illumination, which facilitated subsequent optical path adjustment and calibration. Two digital micromirror devices (DMDs) were synchronized to modulate and generate a measurement matrix, while a single-pixel detector, connected to a beam collection lens, collected reflected light signals from the detection area. Additionally, our system’s optical path diagram was scalable. By utilizing the same optical path diagram for both the beam splitter and projection system, complex hierarchical three-dimensional light illumination was achieved through the continuous expansion of beam splitters and projection system components.
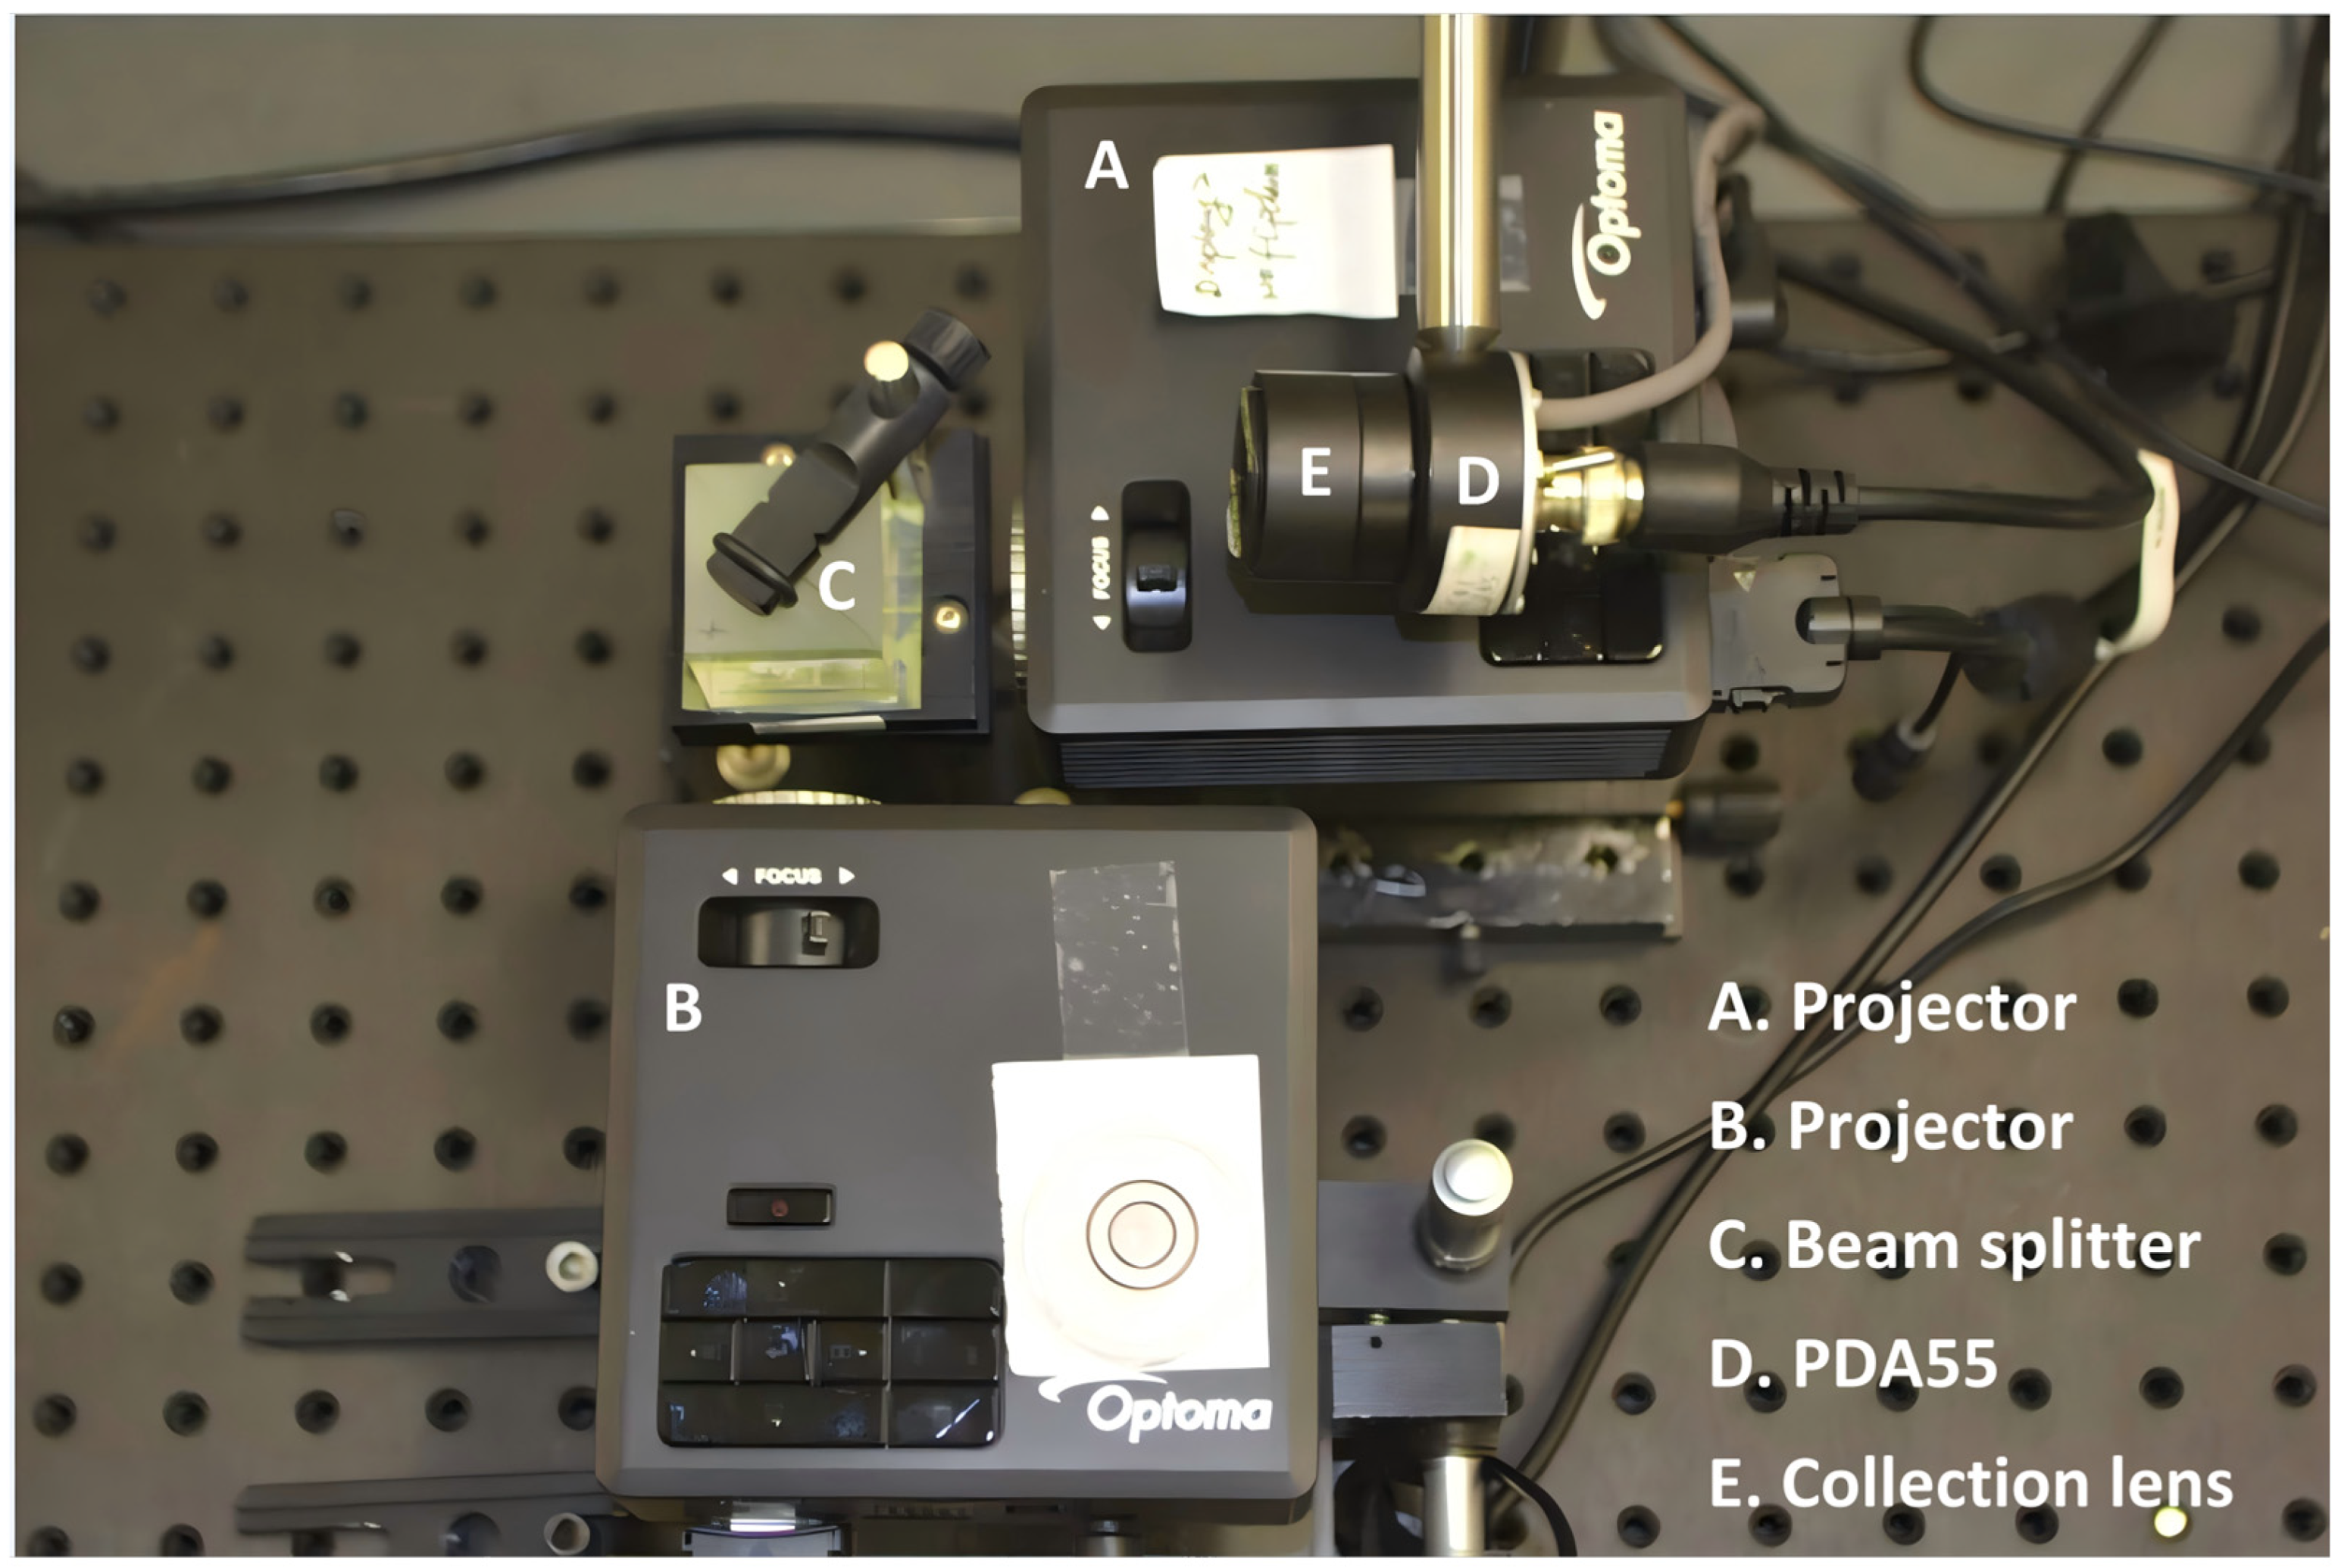
The hardware experimental setup photograph is illustrated in
Figure 11. Projectors A and B were positioned on the same horizontal plane with their optical axes perpendicular to each other, converging through beam splitter C, yet projecting at varying focal distances to create a multi-depth volume illumination. The projection matrices within both projector A and projector B were random 64 × 64 black-and-white matrices. D was a single-pixel detector, which was fitted with lens E for the collection of reflected light energy. The data from sensor D was captured through a data acquisition board and processed using a low-pass filter. The collection optics E parameters were D = 11.5 mm and EFL = 17.5 mm, coated with MgF
2. The projectors we selected were portable DLP LED projectors using a white light source, which featured a 0.45-inch diagonal DMD with a 7.6 µm micromirror pitch. For the sensor, we utilized the PDA55 and acquired its data using an NI-DAQ device.
Although the spatial resolution of our proposed system was not constrained by this principle, the resolution of the projection matrices was set to 64 × 64. This is because the measurements time cost increases proportionally with the total resolution when conducting compressed sensing experiments. Furthermore, hardware limitations, such as pixel configurations like 4 × 4 or 8 × 8 binning, were utilized to enhance the signal-to-noise ratio for elements of the projection matrices. Higher-resolution configurations could upgrade the hardware, such as DMD systems, in future implementations.
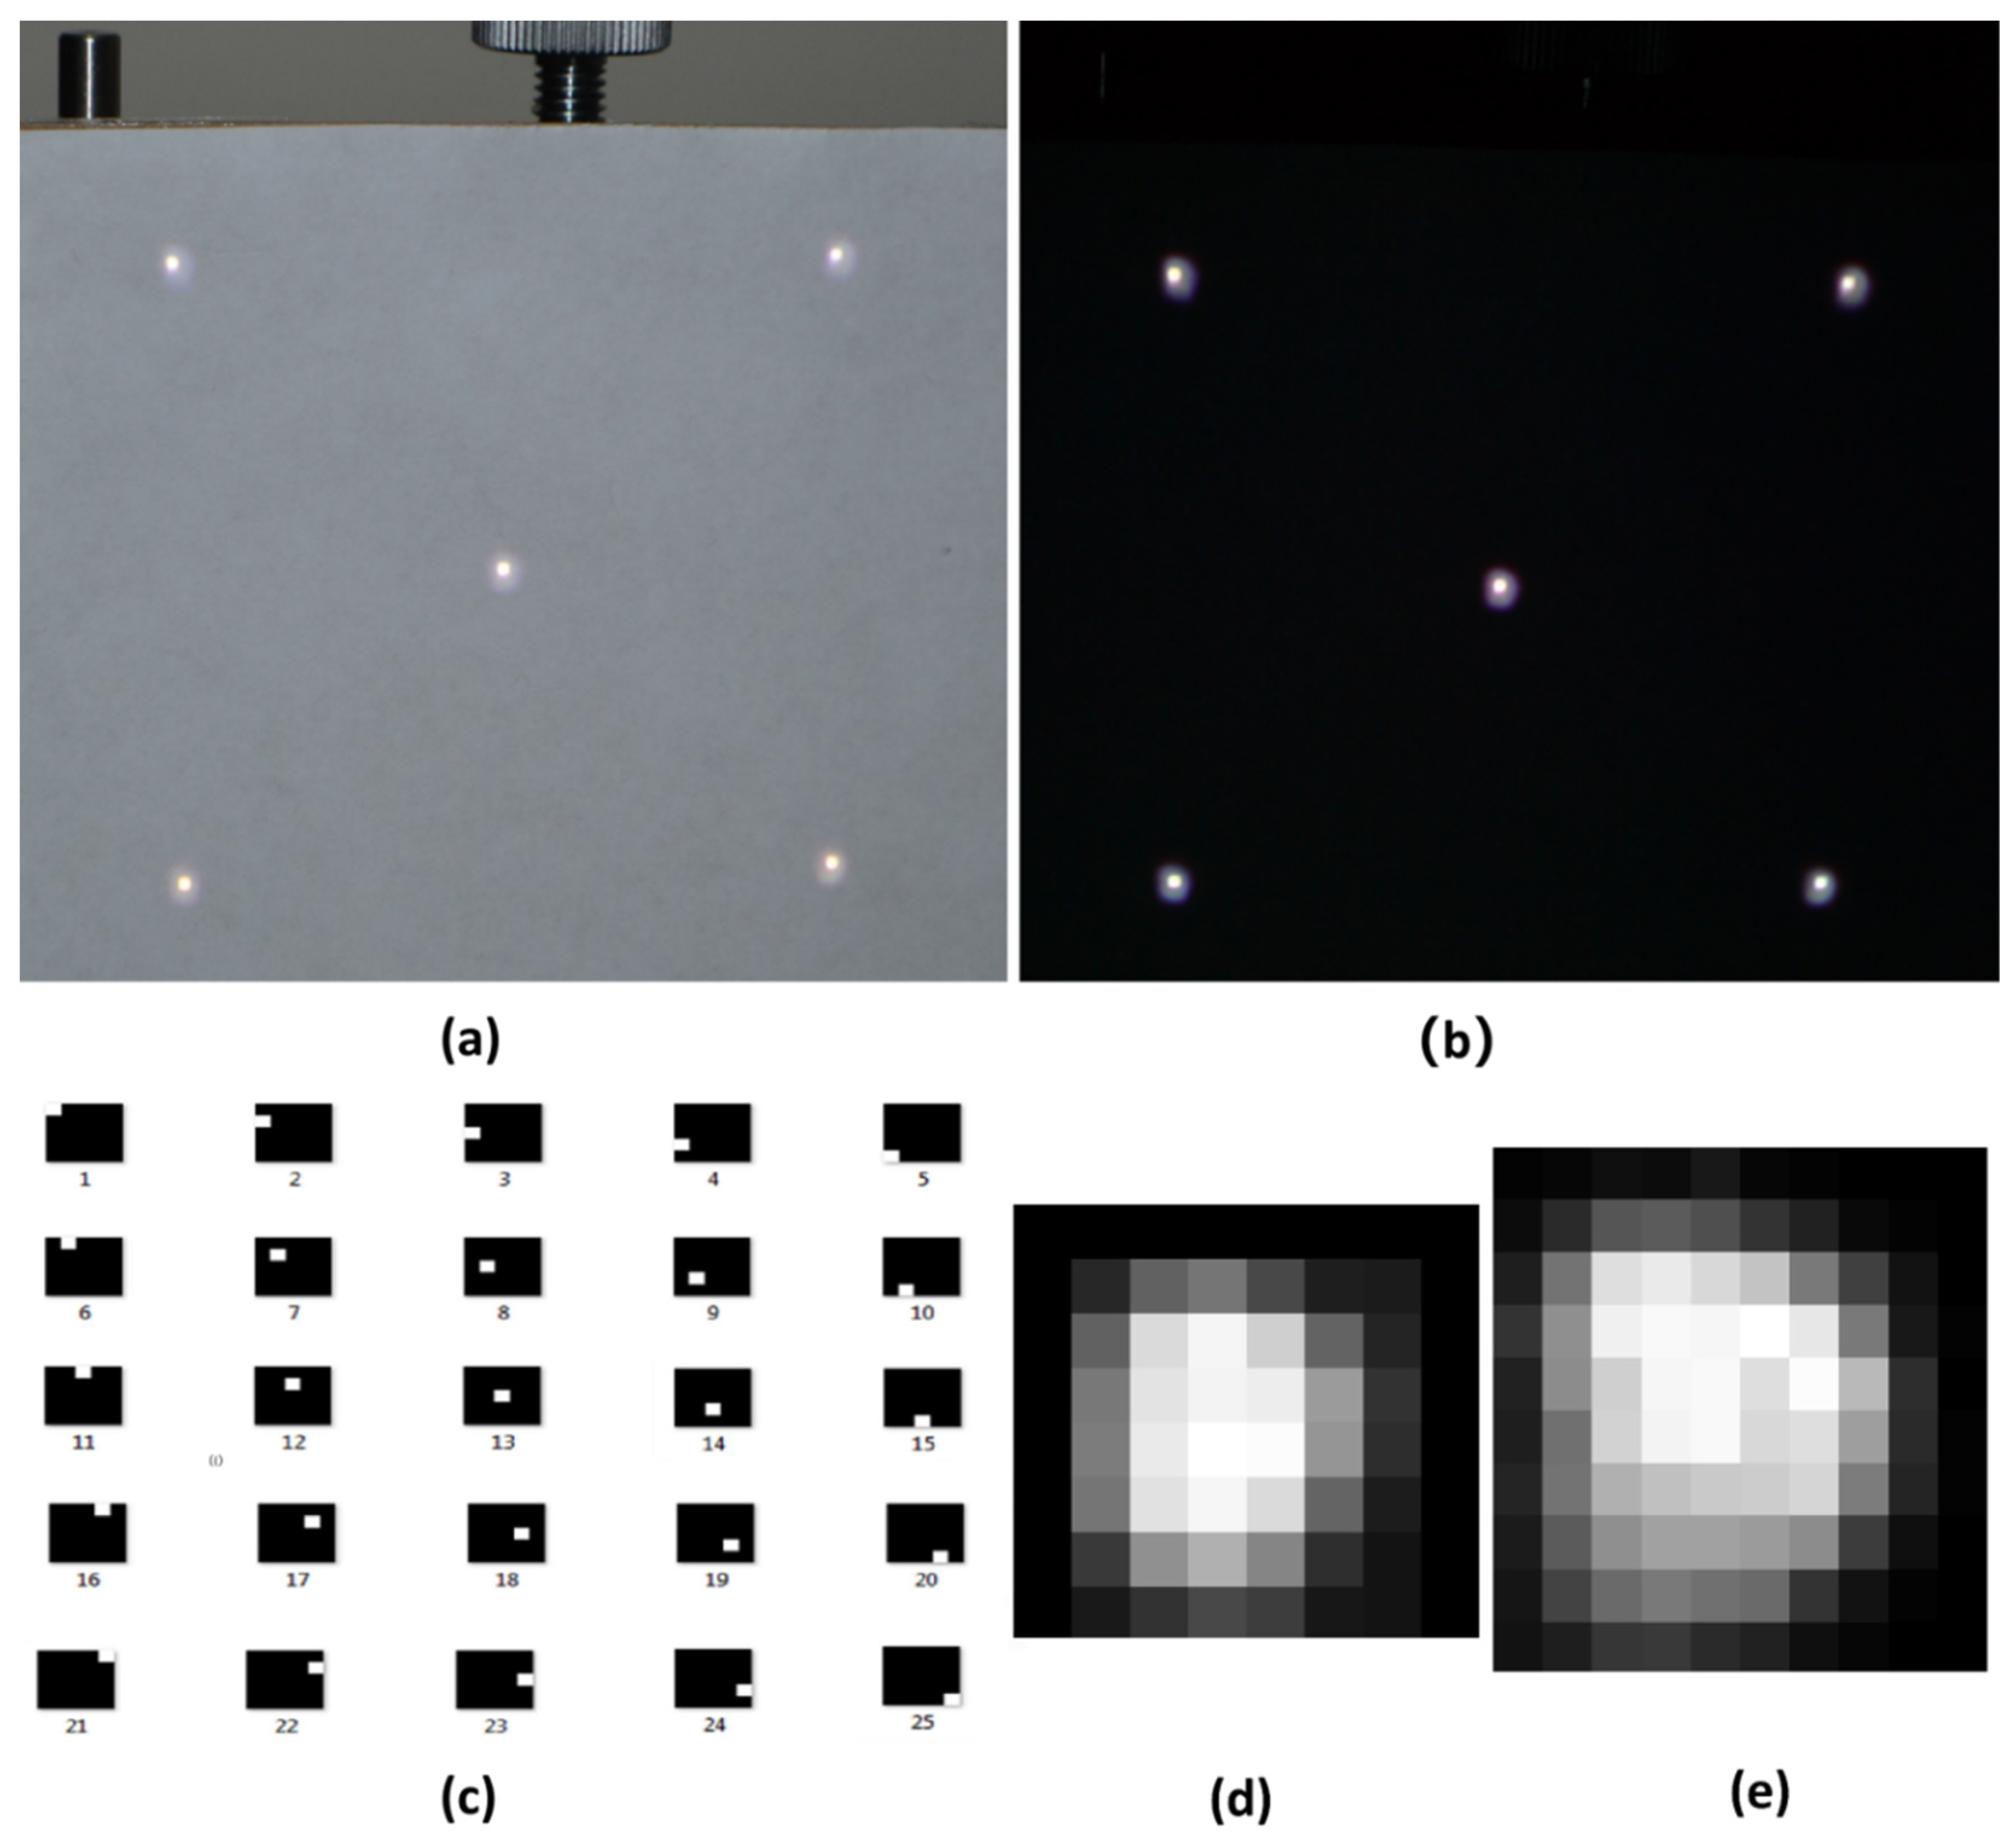
To construct a high-quality coaxial volume structured illumination, during the light adjustment of the hardware experimental system, we designed a five-fixed-light-point coaxial alignment method, where five light spots are located at the four vertices and the geometric center of the square projection area; see (a) and (b) in
Figure 12. Pattern images obtained from the camera enabled visual feedback to manually regulate the platform carrying the projector and the projector’s working distance, ensuring the coincidence of the projection optical axes between the central point and the edge boundary points.
Figure 12 also depicts a photograph taken during our adjustment process. According to Equation (3), calibration is necessary between the ideal measurement matrix sent to the projection system and the actual measurement matrix modulated by the detection target. In our experiment, we conducted a ‘pixel-by-pixel’ scan to balance the non-uniform inter-pixel intensity of the projection system while obtaining the relationship between the intensities of the two planes; one of the scan pattern arrays is shown in (c) of
Figure 12. In the calibration data shown in
Figure 13, the SNR from the plane at a depth of 450 mm is 21.5 dB, while SNR drops to 15.3 dB at the plane at a depth of 750 mm.
The actual defocus patterns were captured by photographing the real light spots and processed to serve as a defocus spread function to replace the point spread function in Equation (3). (d) and (e) display two of the defocus patterns in our experiment at 750 mm and 450 mm, respectively, in
Figure 12.
In the prototype experiment, the single-pixel detector and receiving optics operated continuously under continuous white light illumination without the use of a narrowband filter to block ambient light. Consequently, to account for the system’s baseline noise and the influence of ambient light and stray light, a measurement without any detection target was conducted before each detection to obtain the background noise of the prototype, followed by the detection target measurement.
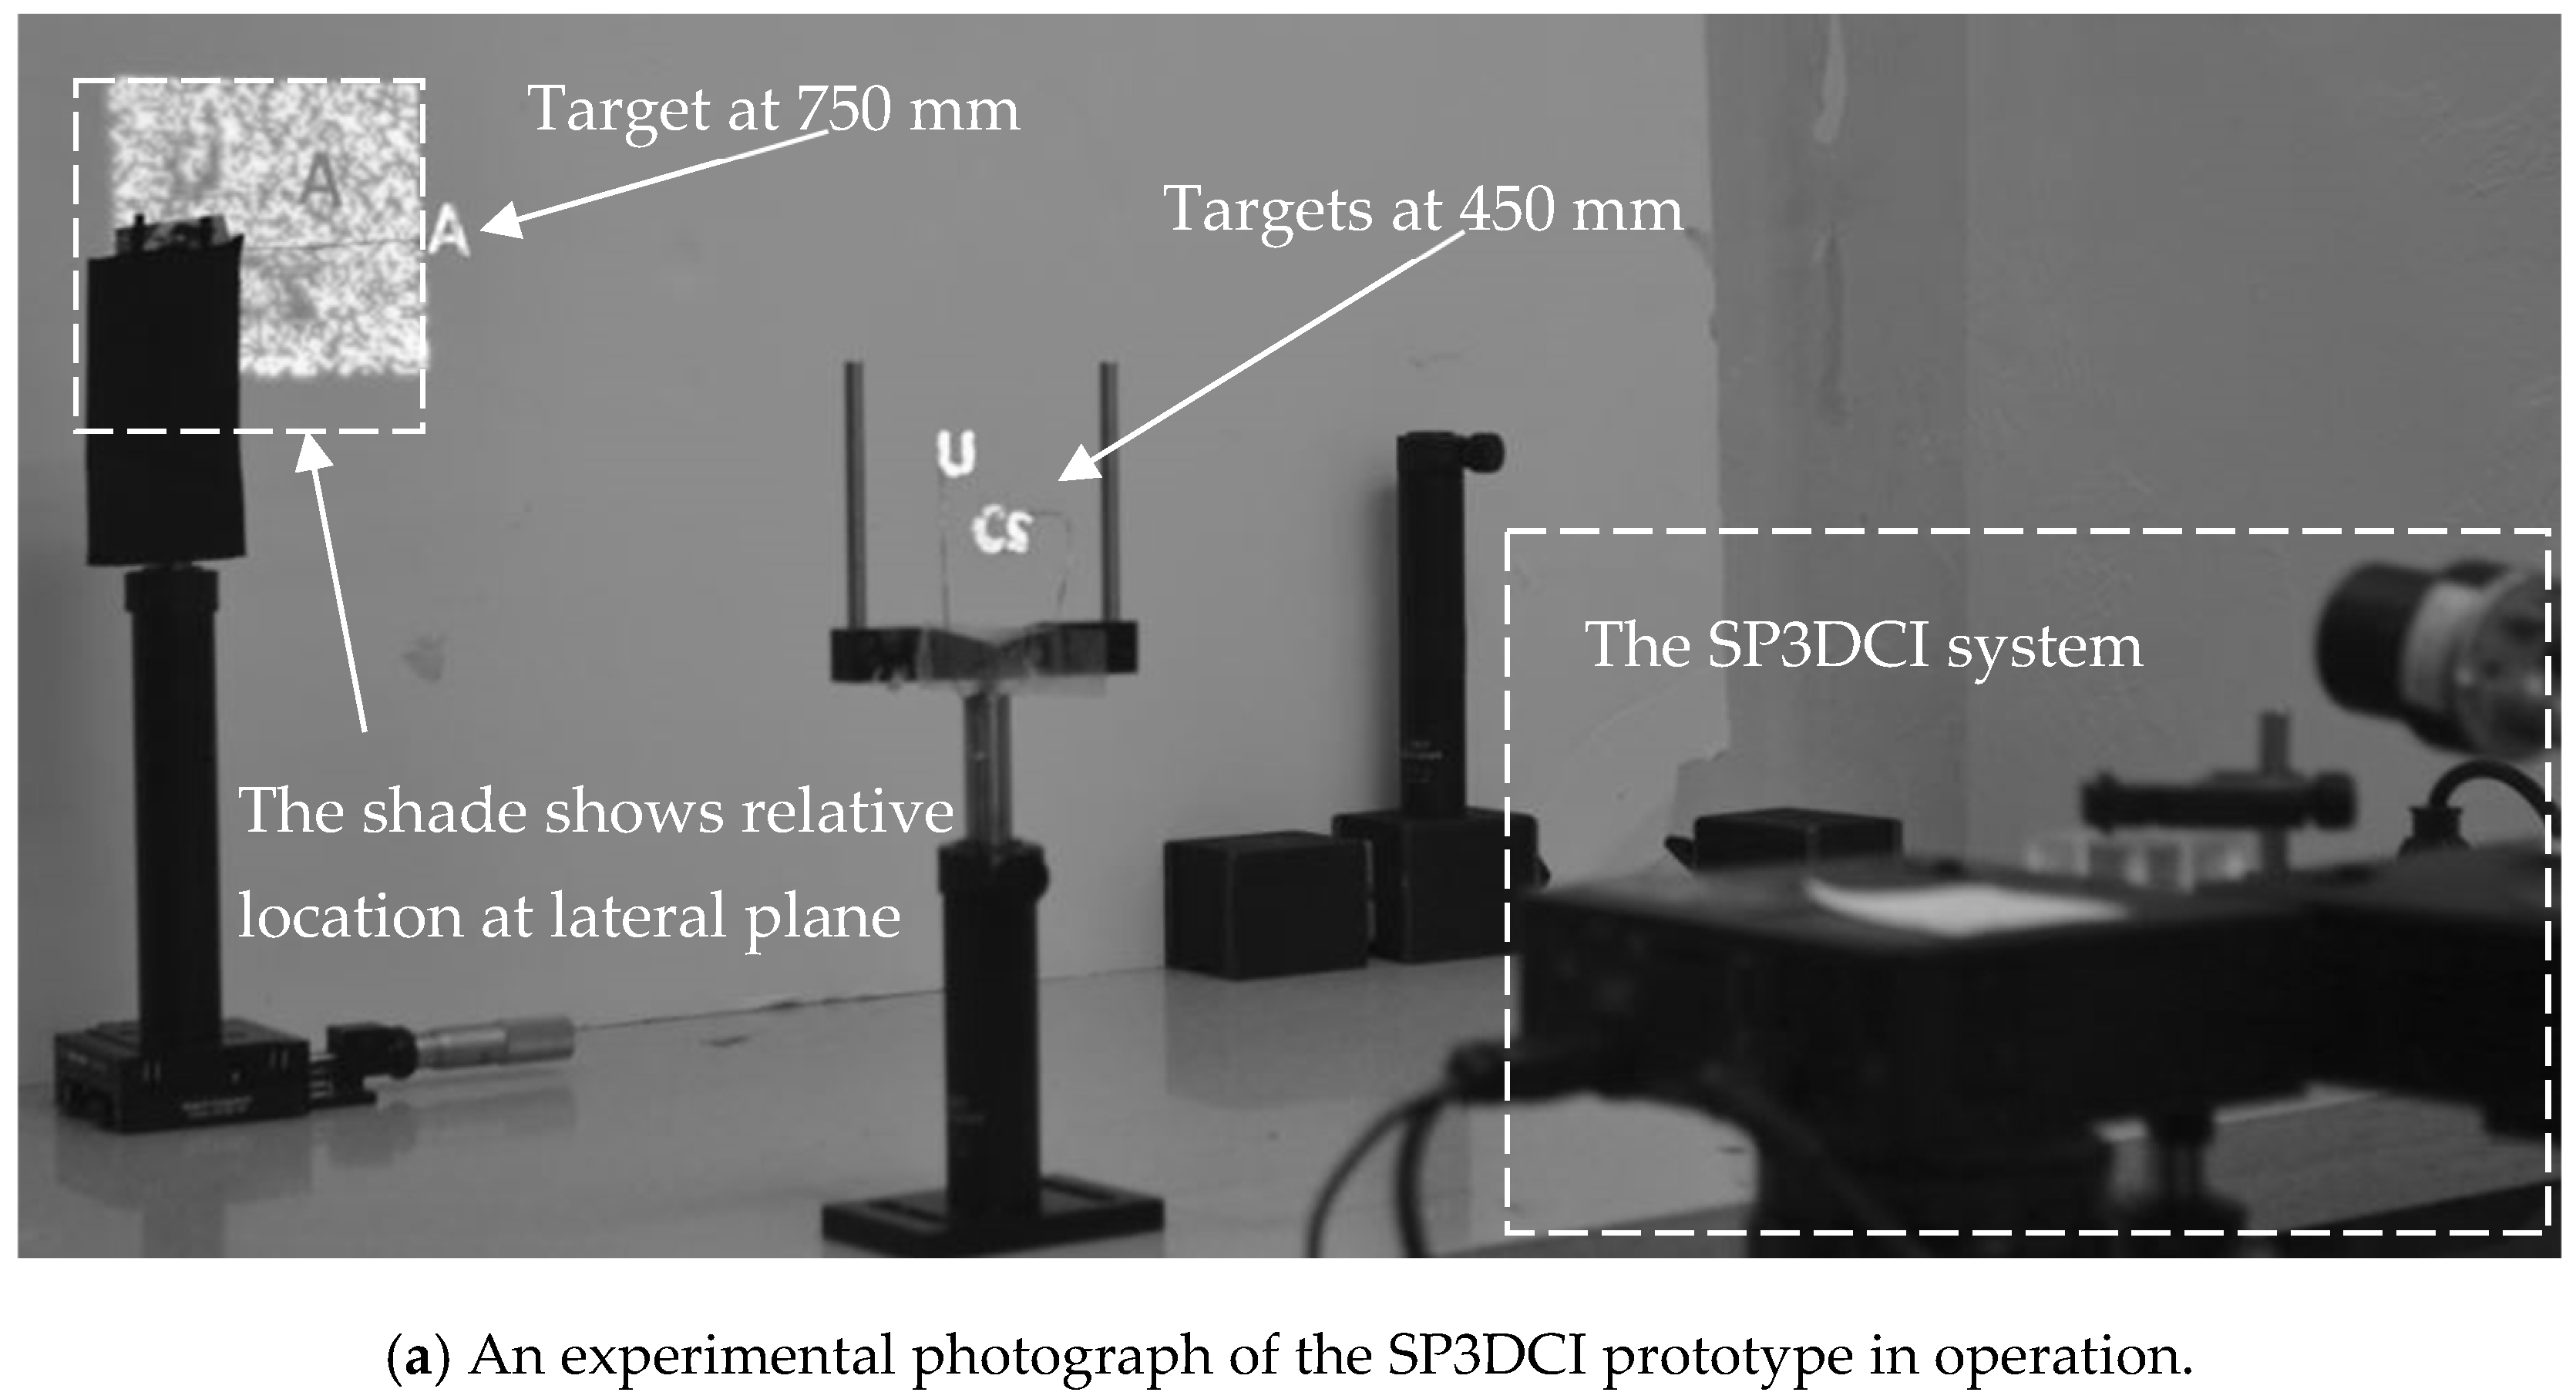
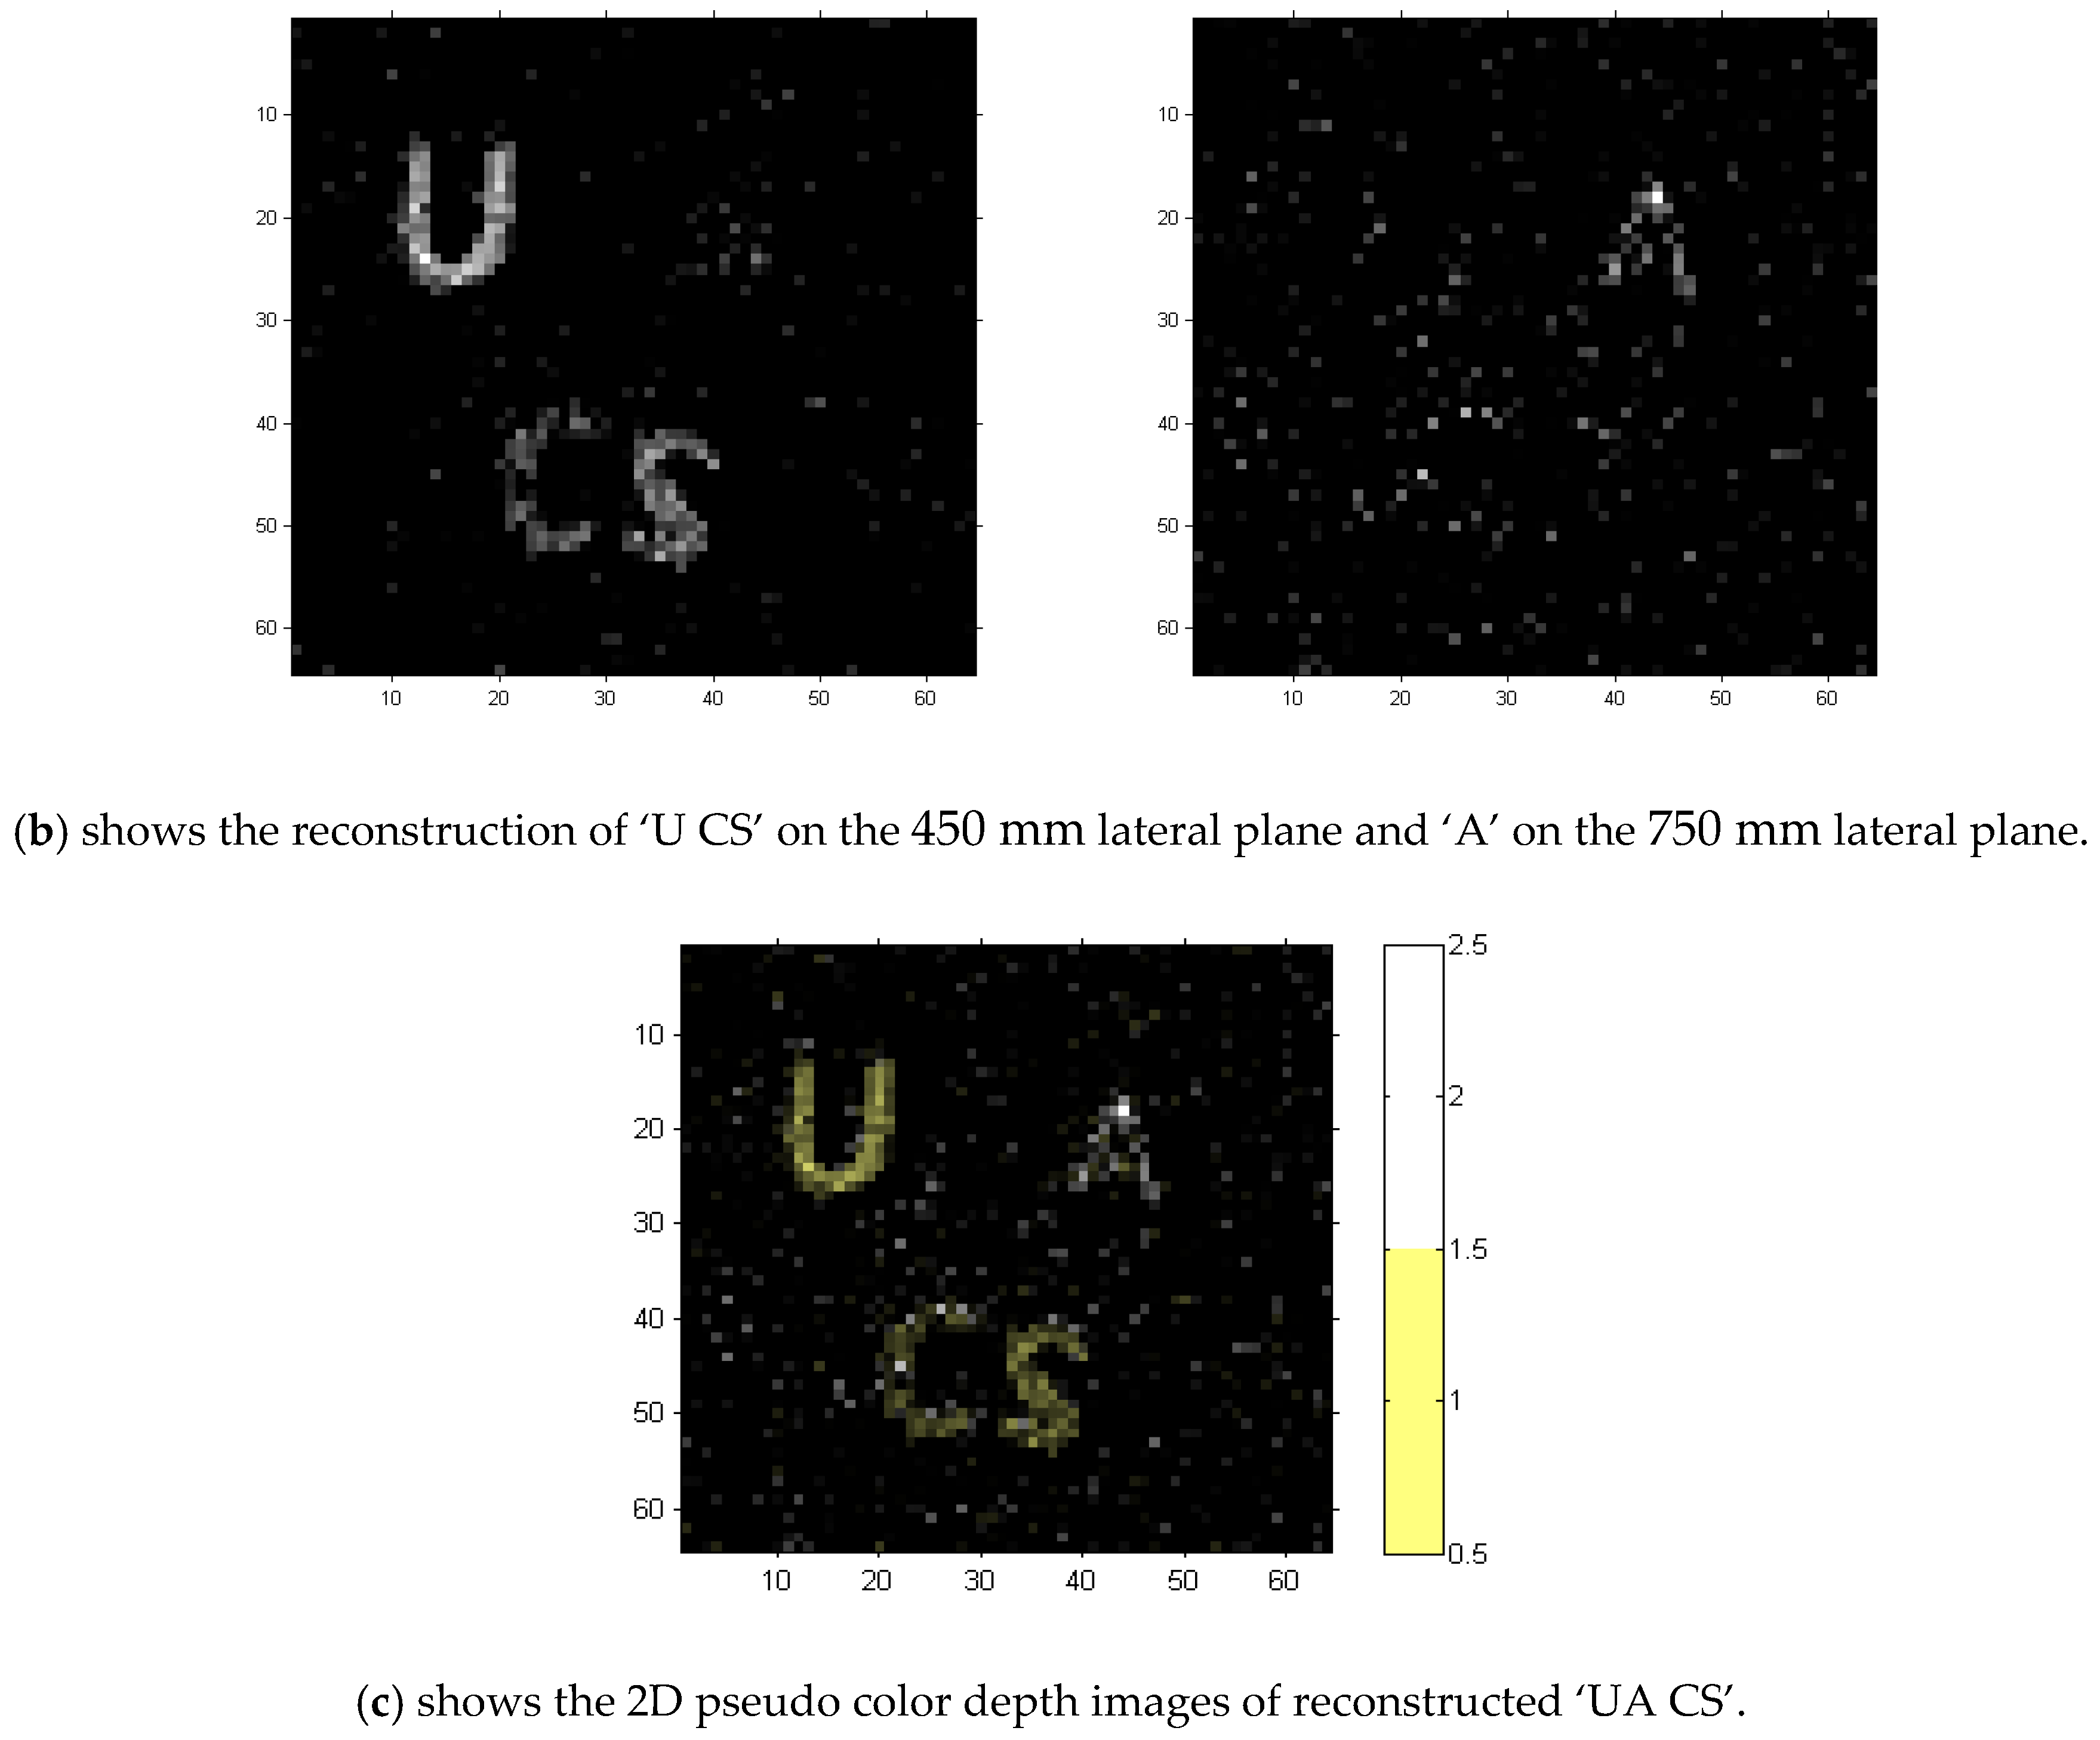
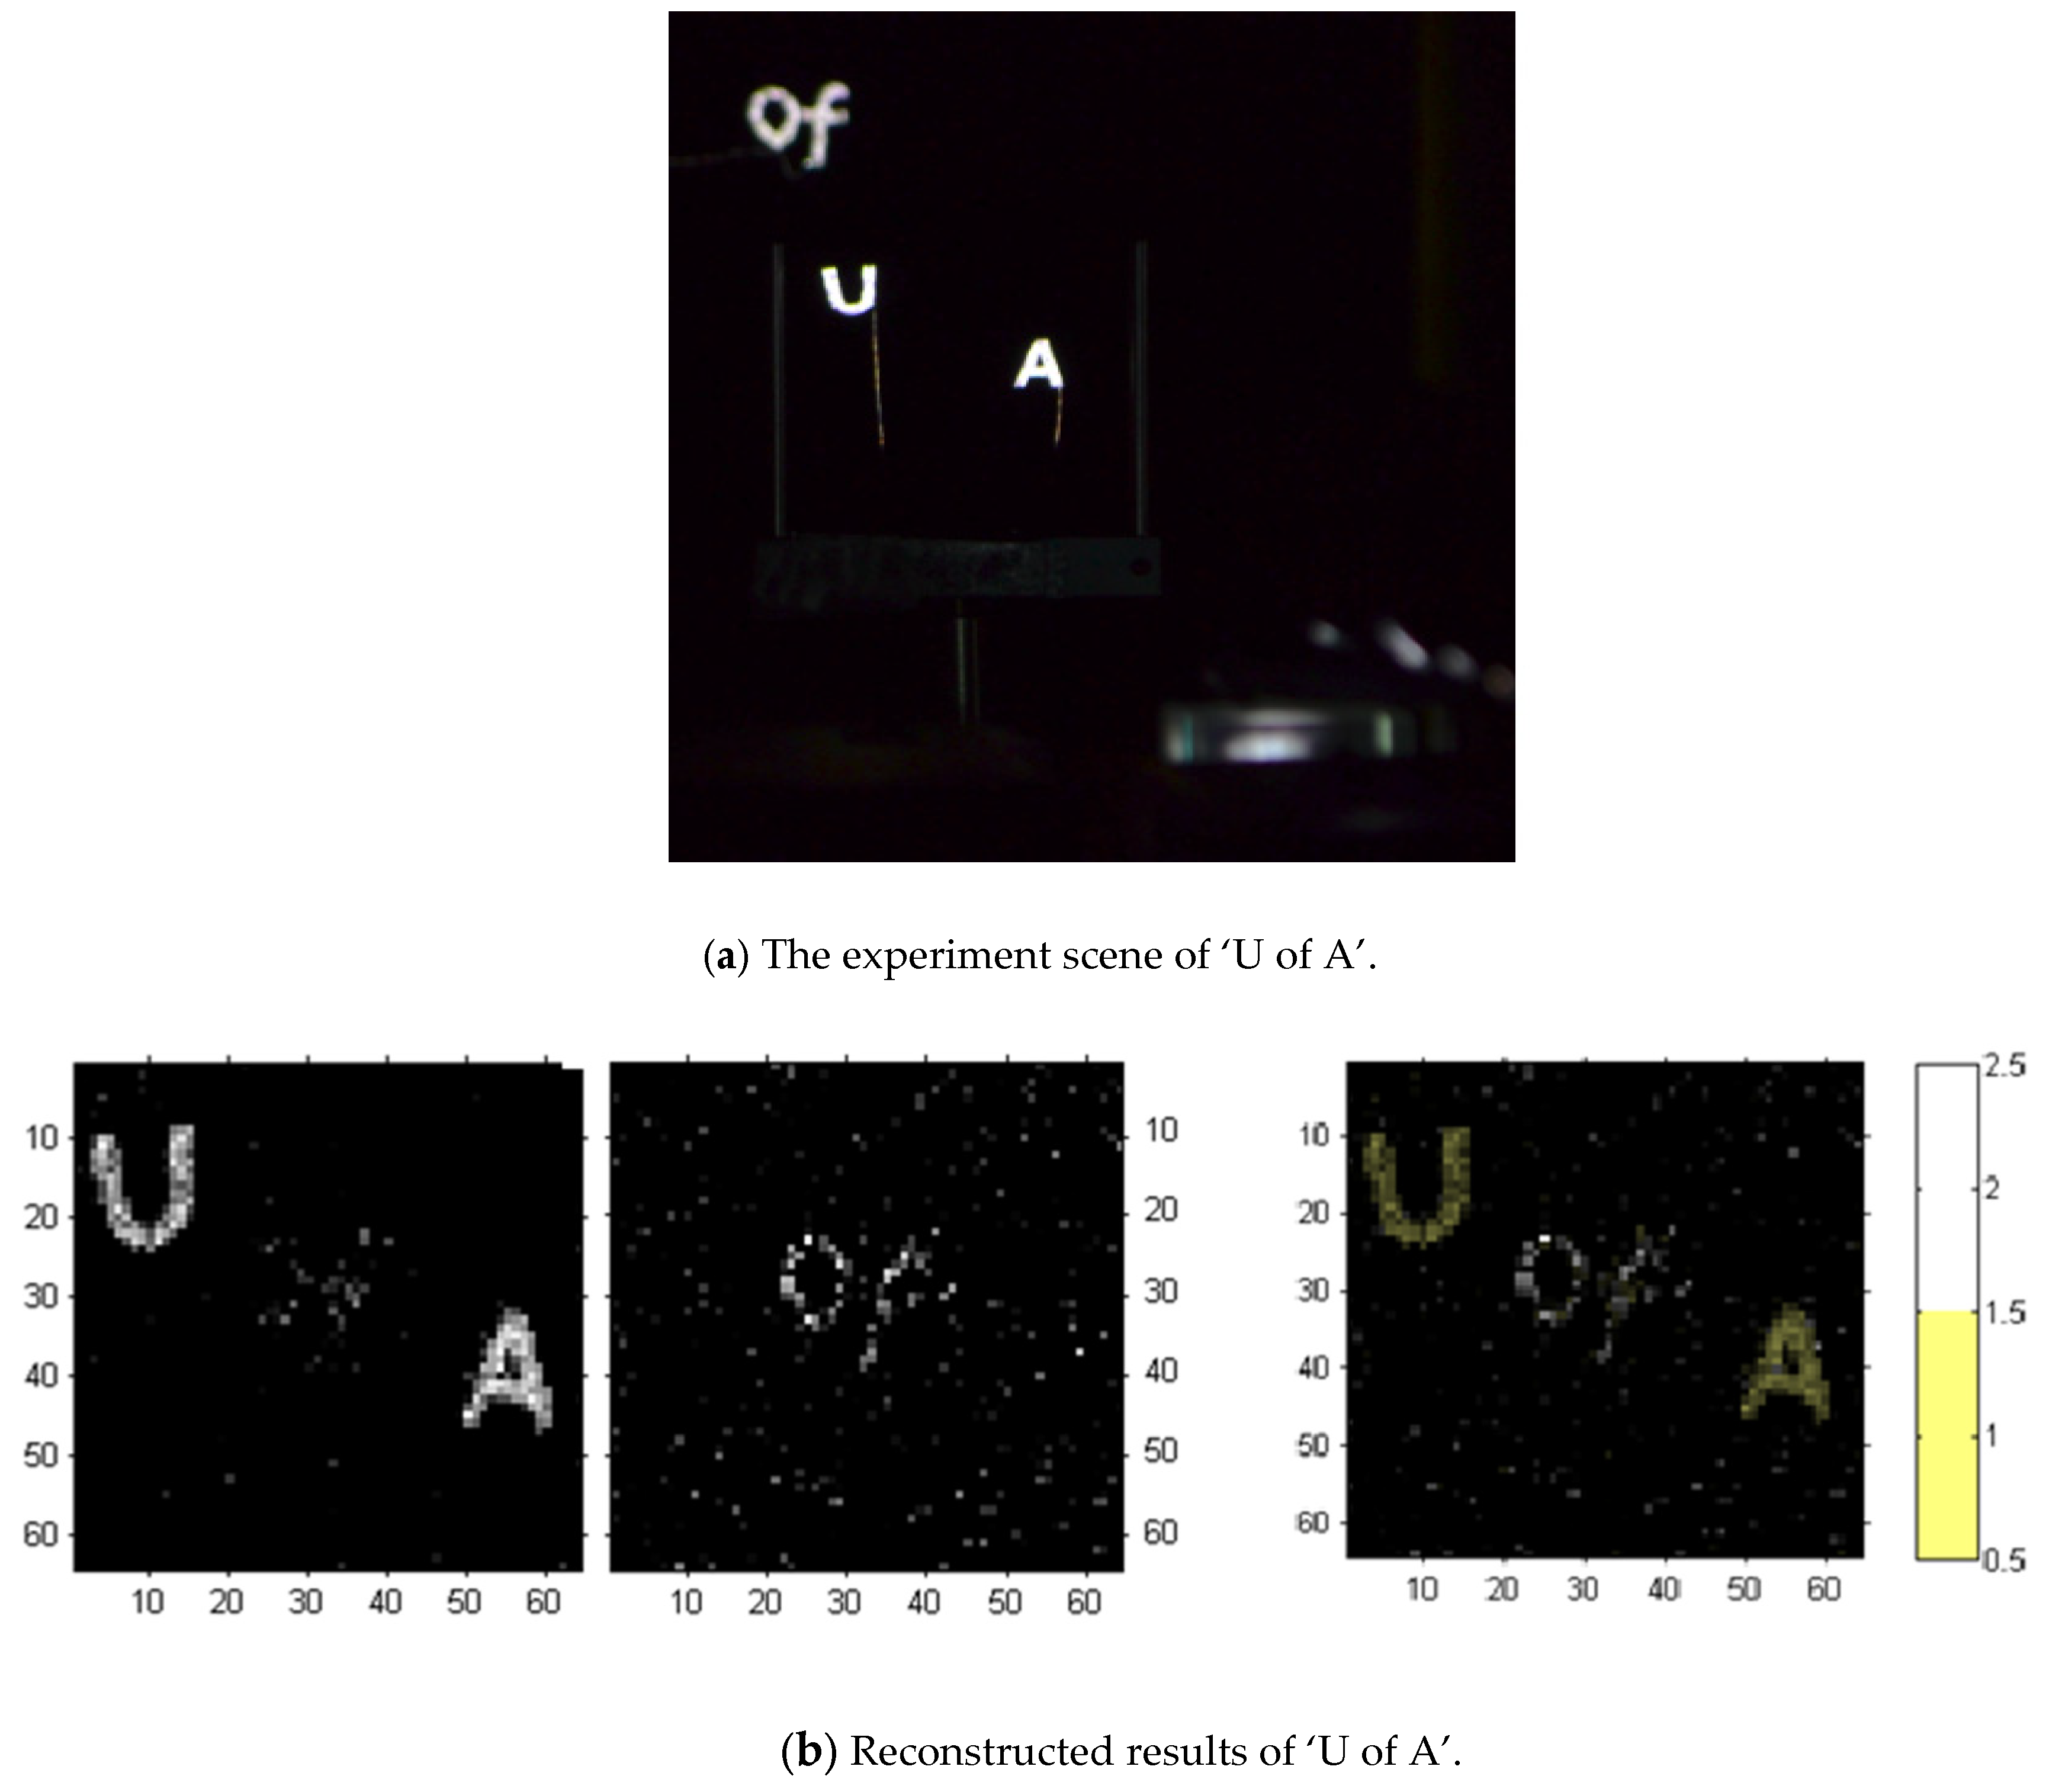
After system adjustment and calibration, the experimental results in
Figure 13 and
Figure 14 demonstrated the feasibility of the proposed three-dimensional synchronous compressed sensing architecture and the effectiveness of our hardware prototype. Additionally, the superiority of our proposed algorithm is well demonstrated by the reconstruction results at a 25% measurement rate.
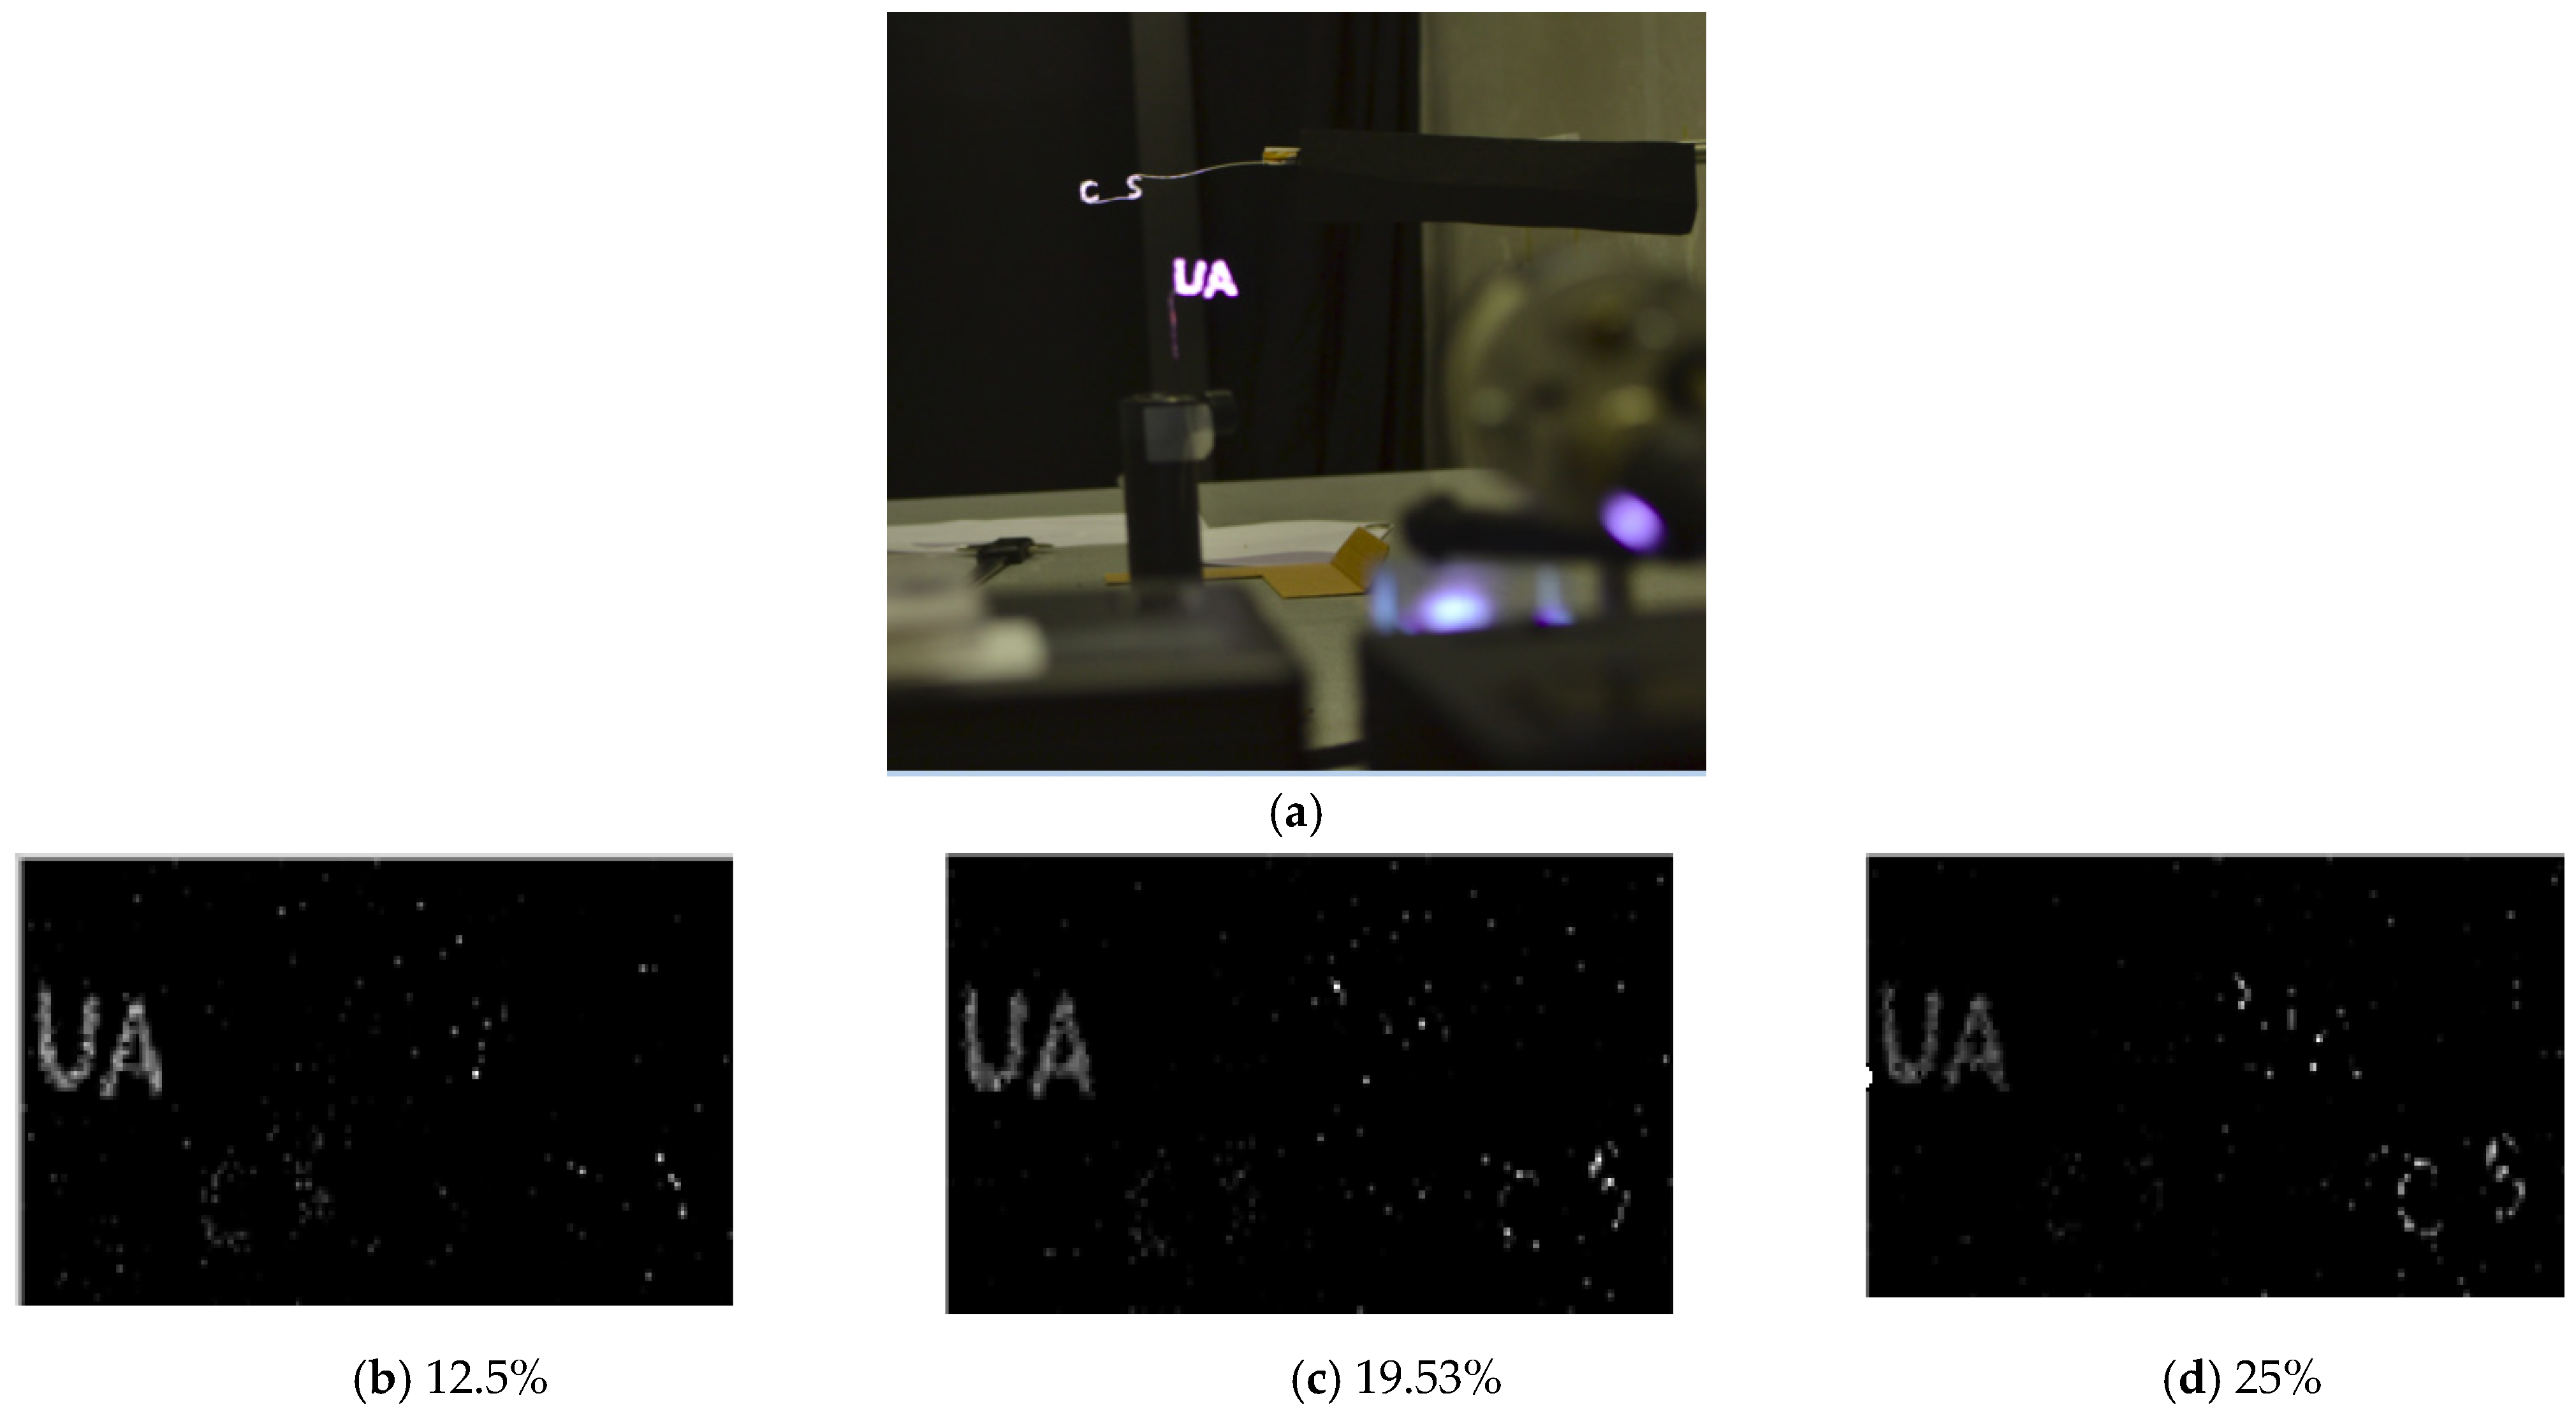
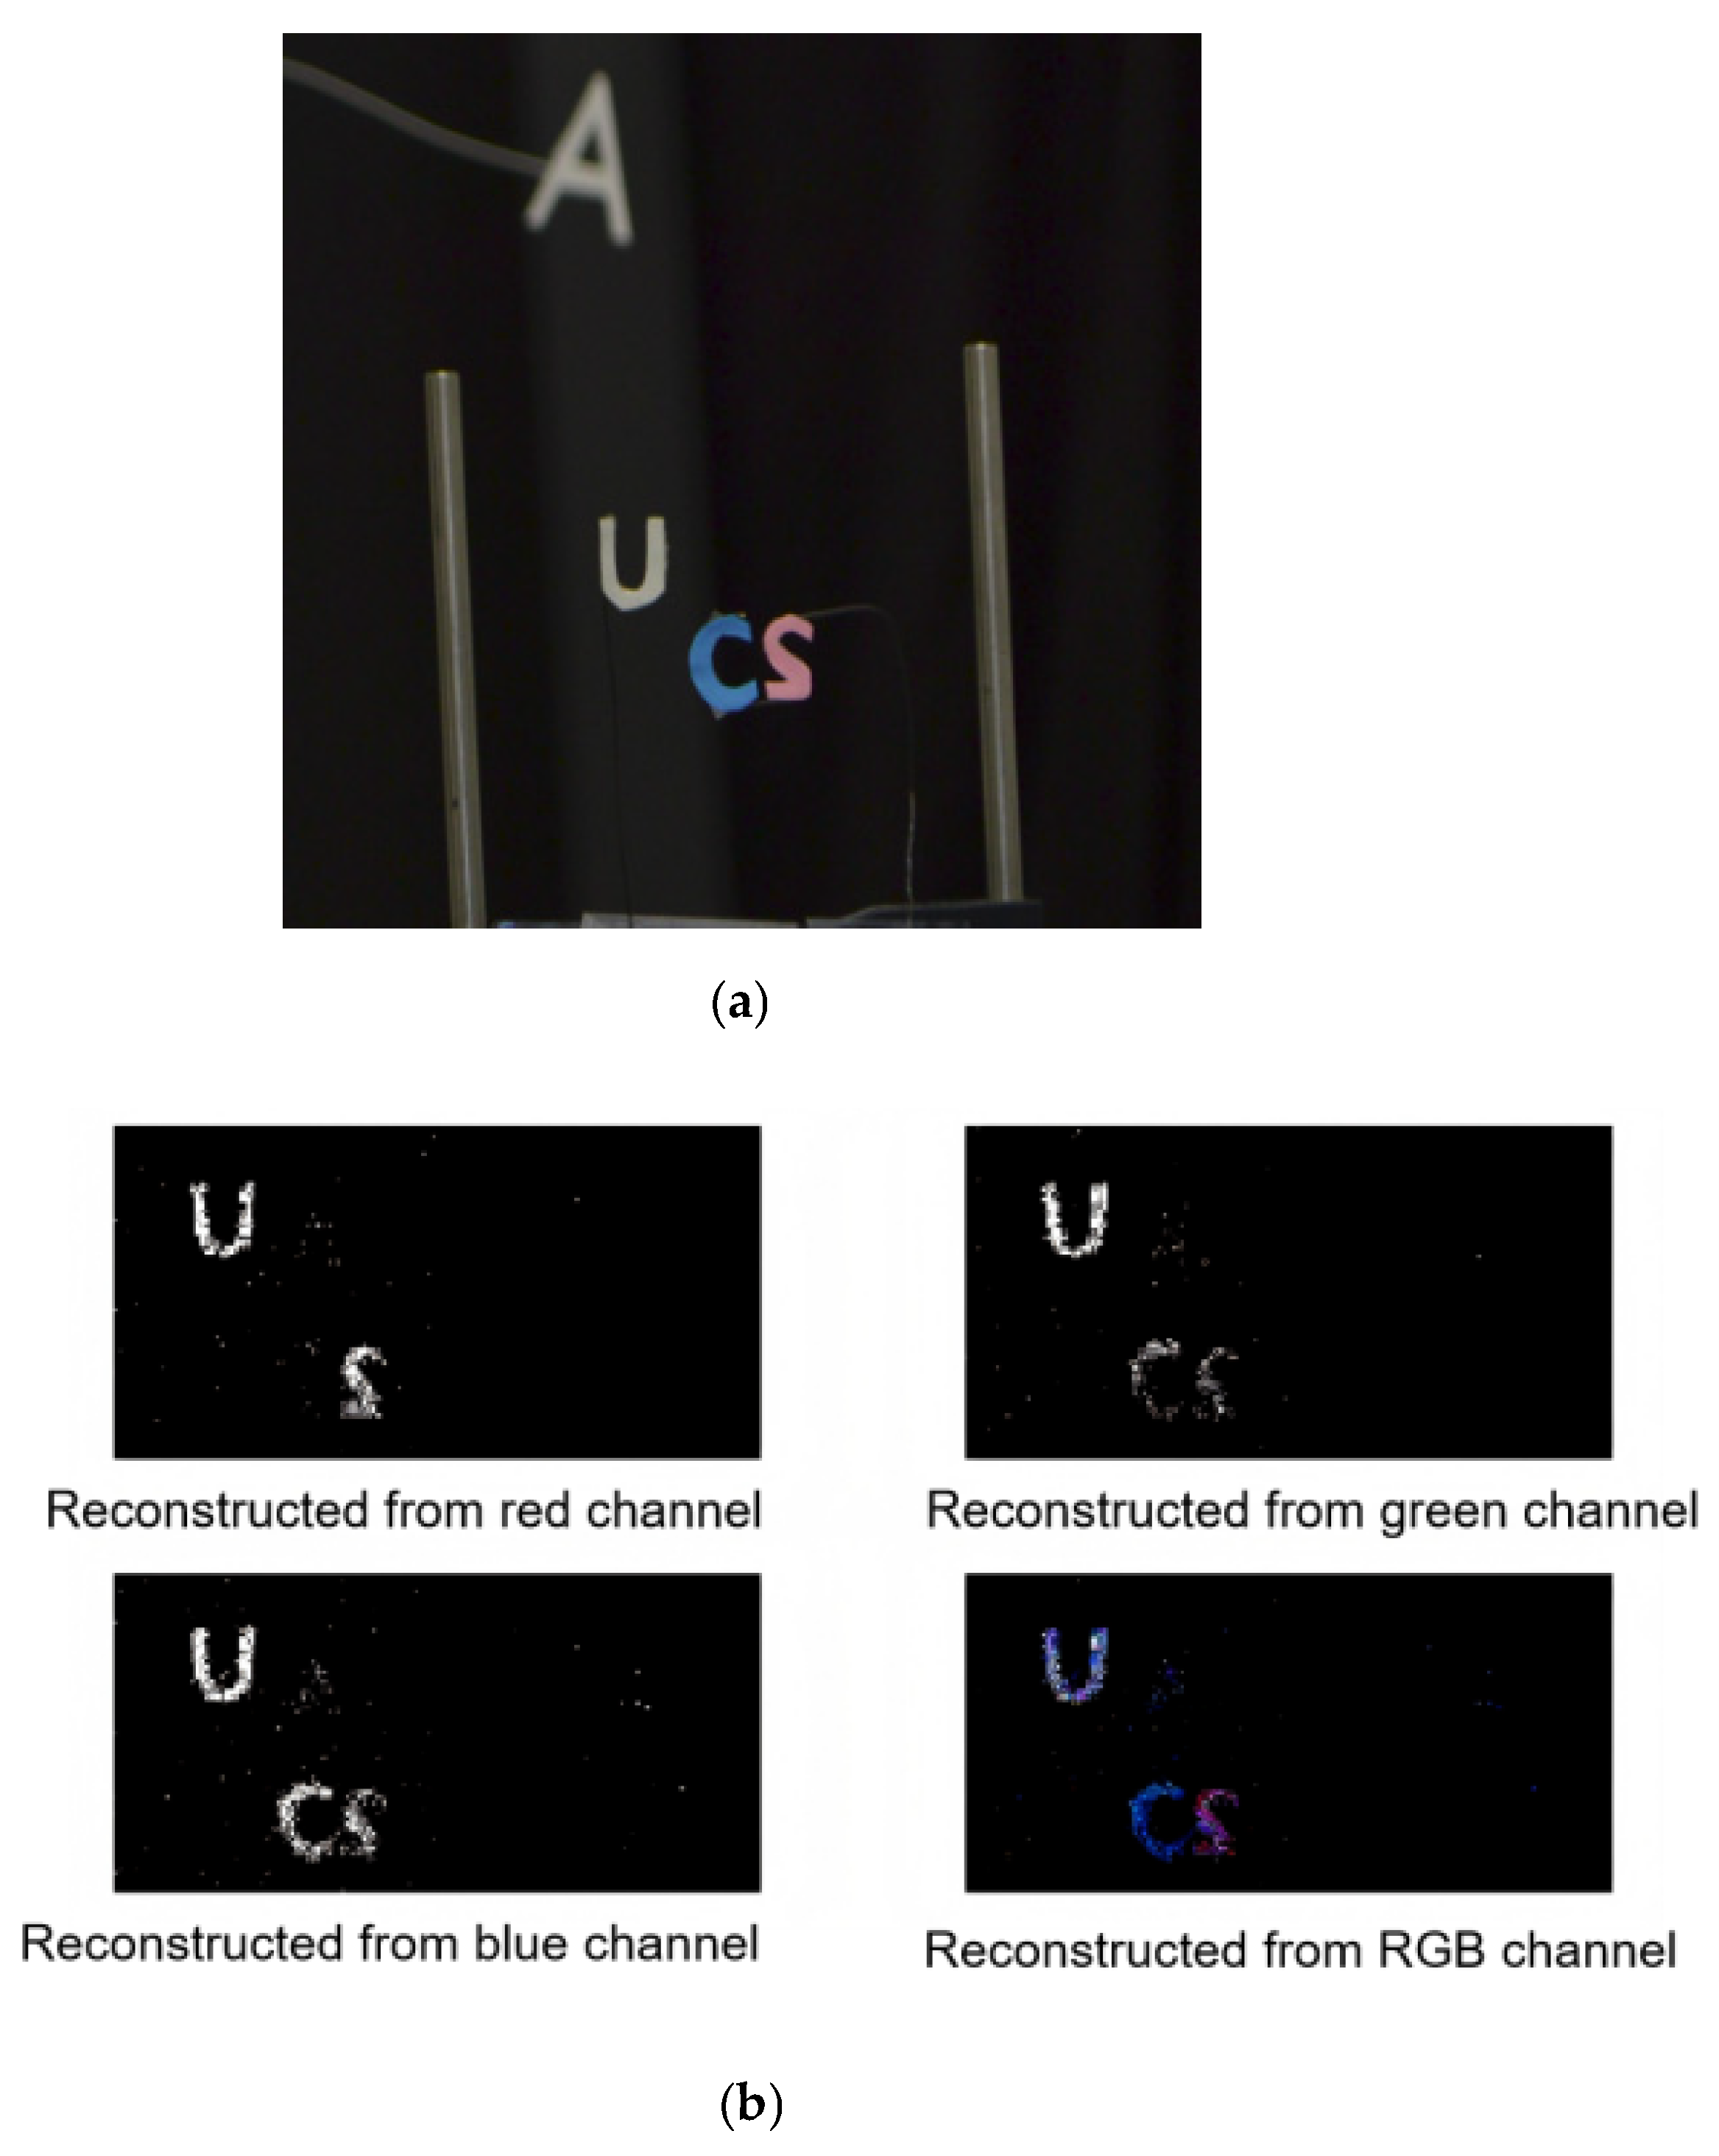
We also conducted reconstruction experiments on objects with varying measurement ratios and colors, as illustrated in
Figure 15 and
Figure 16. It should be noted that both
Figure 15 and
Figure 16 show the imaging and reconstruction results at two different depths, with a resolution of 64 × 64. Among them, the reconstructed images did not use pseudo-color reconstruction due to consideration of the effect of color reconstruction. Instead, we used two reconstructed images with a horizontal resolution of 64 × 64 for stitching different depths. The results indicate that increasing the measurement ratio enhances reconstruction performance, and the reconstruction of colored objects also yields improved results.
The experiments demonstrate that three-dimensional perception of target colors can be achieved through three monochromatic 3D perception measurements followed by linear color superposition of images. The monochromatic measurement experiment we conducted involved sequentially changing a white (255, 255, 255) pattern to a red (255, 0, 0), green (0, 255, 0), or blue (0, 0, 255) pattern, and then remixing their respective reconstructed results. The color target three-dimensional perception experiment effectively demonstrates that our single-pixel three-dimensional compressive imaging system exhibits excellent scalability for higher-dimensional information, such as color, with linear superposition. However, our experimental observations reveal that, during each single-color-channel 3D perception imaging, the emitted light intensity is only 1/3 of the original white light illumination. The experiment data showed that, in the color reconstruction experiment, the SNR from the plane at a depth of 450 mm was 16.1 dB while the SNR dropped to 12.5 dB at the plane at a depth of 750 mm. As illustrated in
Figure 14a, it is evident that the intensity of light at near targets was significantly greater than that at far targets, resulting in a lower signal-to-noise ratio at far targets. Consequently, the distant ‘A’ region failed to achieve effective 3D reconstruction due to its weaker light intensity and higher noise levels.
