1. Introduction
Mobile robots, as an emerging form of transport vehicles, are widely utilized across multiple applications due to their high flexibility and efficient transportation capabilities [
1,
2]. However, the diversity of their use cases, the complexity of spatial layout, and the demand for operational efficiency present significant challenges to achieving fully autonomous navigation [
3]. Among the core techniques, path planning has a significant impact on both the precision and efficiency of mobile robot operations [
4]. The effectiveness of the planning algorithm directly impacts the robot’s ability to perform tasks accurately and autonomous functionality [
5,
6]. Therefore, designing an optimal path for mobile robots remains a fundamental problem in this domain [
7].
Since the last century, extensive research has been conducted on robot path planning, resulting in numerous well-designed algorithms [
8], such as the A* algorithm [
9]. In recent years, the focus of research has shifted toward more sophisticated approaches tailored for complex and dynamic environments [
10]. For instance, ref. [
11] introduces a sine resistance network-based method under dynamic conditions for autonomous electric vehicles, while [
12] develops a self-supervised cost of transport estimation method to assist multimodal robots’ navigation. Similarly, ref. [
13] proposes a kinematically constrained batch informed trees (BIT*) algorithm utilizing variable density sampling to enhance efficiency and accuracy. Ref. [
14] presents edge computing to optimize vehicle path planning by minimizing delay and energy consumption. Although the above methods demonstrate strong theoretical performance, their practical deployment remains limited due to complexity and implementation challenges.
Ant Colony Optimization (ACO), an algorithm inspired by ant foraging mechanisms in nature [
15], has shown promise in addressing practical path planning problems, such as avoiding long paths [
16]. Although ACO has the advantages of high efficiency and robustness [
17], it suffers from the issues of slow convergence speed, susceptibility to local optima, and excessive path turning points. Recent efforts to enhance ACO have tackled these issues from multiple perspectives. For example, ref. [
18] introduces a potential field enhanced ACO that integrates a repulsive field function and adjustment factors to improve pheromone updates, effectively reducing path length. In [
19], a local pheromone update mechanism is used to lower pheromone concentration at visited nodes, encouraging population diversity; however, its fixed update mechanism limits adaptability. Ref. [
20] uses multiple swarm collaboration strategies to effectively improve global optimization ability and convergence efficiency by strategically distributing ants in starting and goal regions. Additionally, ref. [
21] introduces a greedy initialization strategy to guide early pheromone distribution and speed up convergence. A negative feedback balancing factor is presented in [
22] along with extended ants independent of the main pheromone trail, helping to escape local optima in later stages.
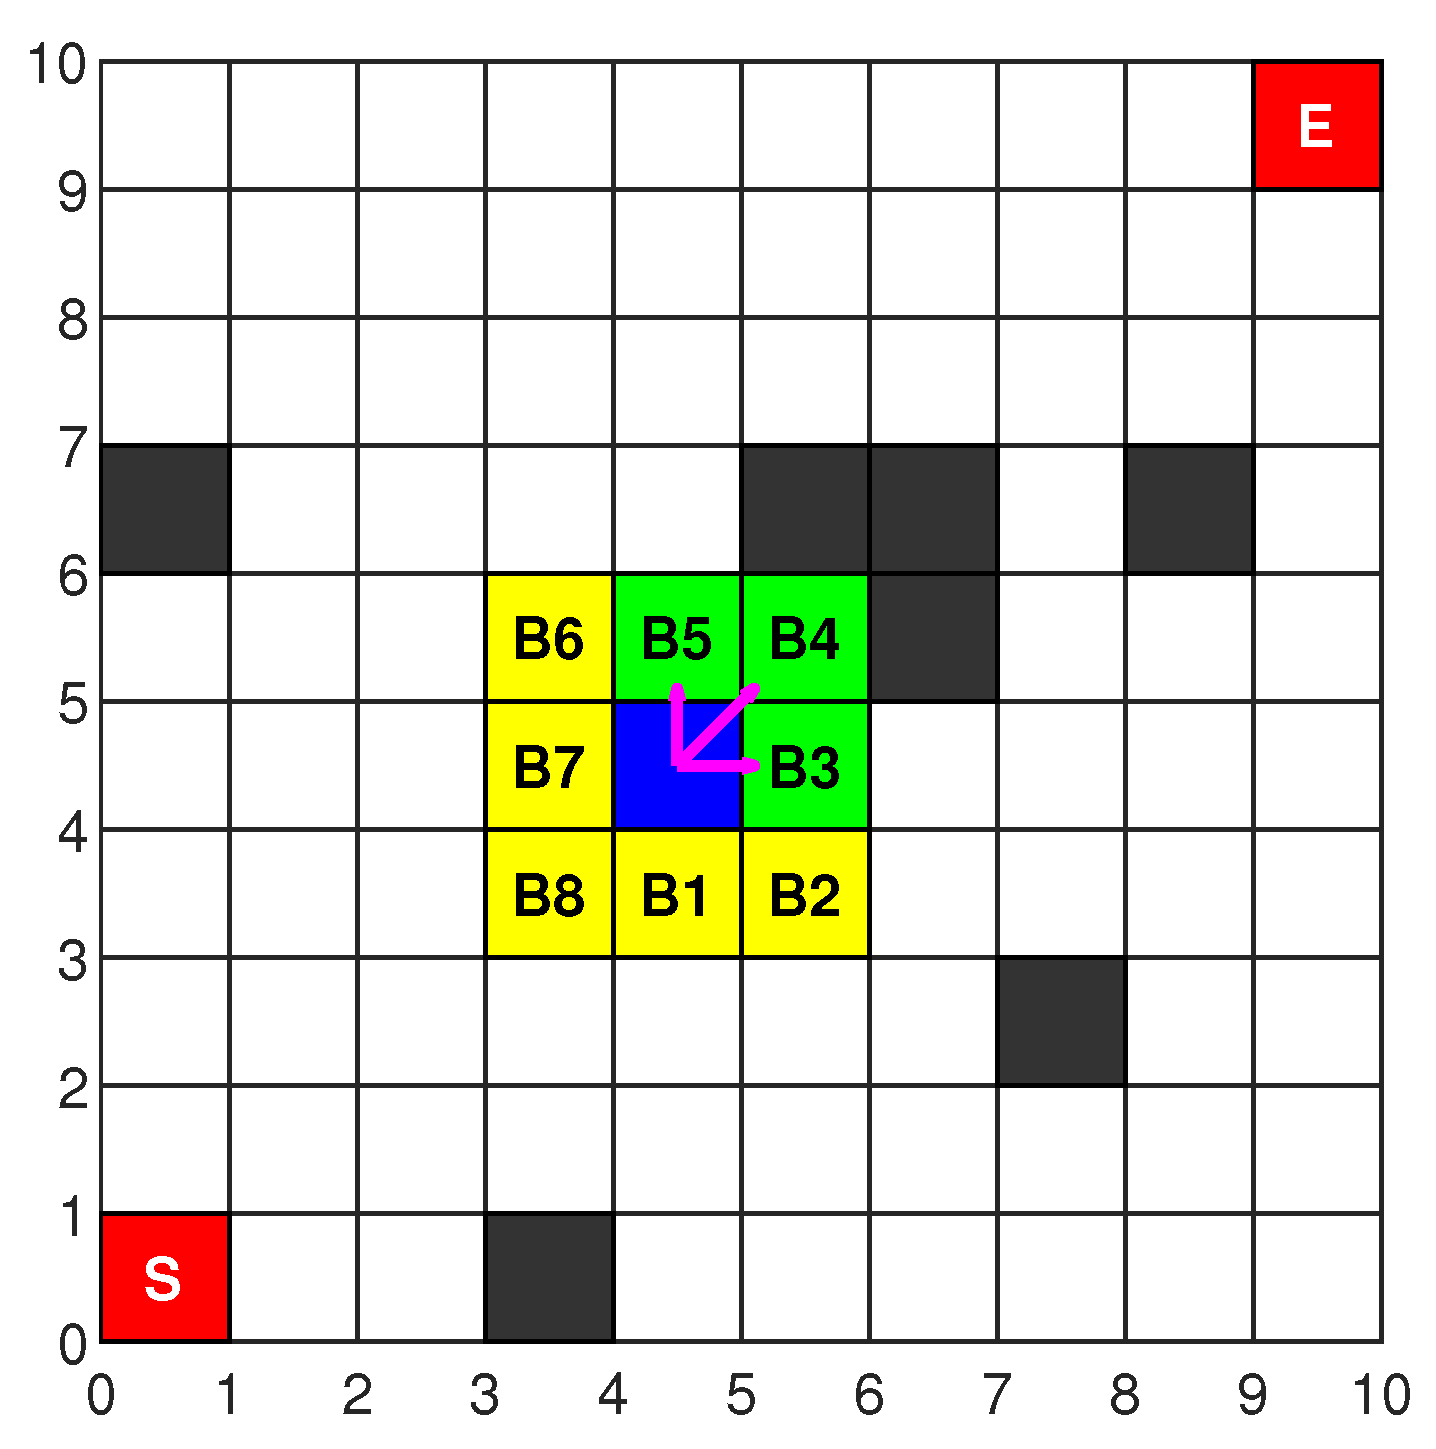
Although these approaches have achieved substantial improvements, some issues of the algorithm remain partially unsolved, for instance, slow convergence speed, and excessive path turning points. To address these limitations, this paper proposes a novel multi-strategy enhanced ACO under nonholonomic constraints (NMS-EACO). The proposed NMS-EACO incorporates five mechanisms: an A*-guided heuristic function, an adaptive enhanced pheromone update rule, a state transition probability model under nonholonomic constraints, a smooth factor for optimizing state transition probability, and a global path smoothing strategy. To validate the effectiveness of NMS-EACO, extensive simulation experiments—comprising hundreds of test cases across three types of maps—are conducted. The results demonstrate significant improvements in convergence speed, global search capability, and path smoothness compared with existing methods.
The structure of this paper is organized as follows:
Section 2 presents the ACO’s theoretical basis and mathematical model.
Section 3 presents five innovative mechanisms.
Section 4 describes the simulation experiments and analyzes experimental results.
Section 5 gives the conclusions of this article.
2. Mathematical Model and Working Environment
ACO is inspired by the natural behavior of ants, which communicate by releasing pheromones and collaborate to discover the shortest path while foraging for food [
23]. In this paper, the mobile robot is abstracted as an ant, and its position within the grid environment is represented by coordinates, effectively simulating the robot’s real-world operating conditions.
The ant determines its next target point guided by a fusion of pheromone concentration and heuristic knowledge. The probability of an ant transitioning from position
i to position
j is defined by the state transition formulas presented in Equations (
1) and (
2).
where
denotes the probability that the
k-th ant moves from its current position
i to position
j at time
t. The condition
indicates that node
j has not yet been visited by ant
k, making it a valid candidate for the next step.
represents the pheromone level on the path between nodes (
i,
j) at time
t, while
is the heuristic value that guides the
k-th ant in choosing the path from
i to
j. The parameter
is the heuristic factor of pheromone, indicating the influence of pheromone levels on path selection.
is the factor of the heuristic function, reflecting the weight of heuristic information in the decision-making process. Lastly,
denotes the Euclidean distance between nodes
i and
j.
During the foraging process, pheromones are deposited by ants as they navigate their environment, which serves to guide other ants in selecting their routes [
24]. Meanwhile, these pheromones gradually evaporate over time. After all
ants have completed an iteration, the global pheromone levels are updated according to Equations (
3) and (
4).
where
is the global pheromone evaporation coefficient, ranging between 0 and 1, where a higher value indicates faster pheromone evaporation.
indicates the amount of pheromone released by ant
on the path (
i,
j) during the current iteration.
is the pheromone enhancement coefficient and
represents the total length of the route explored by ant
.
The working environment of a mobile robot is often complex and abstract, making it essential to model the scene accurately. Common methods for environmental map modeling include the visual graph method, unit decomposition method, and grid method [
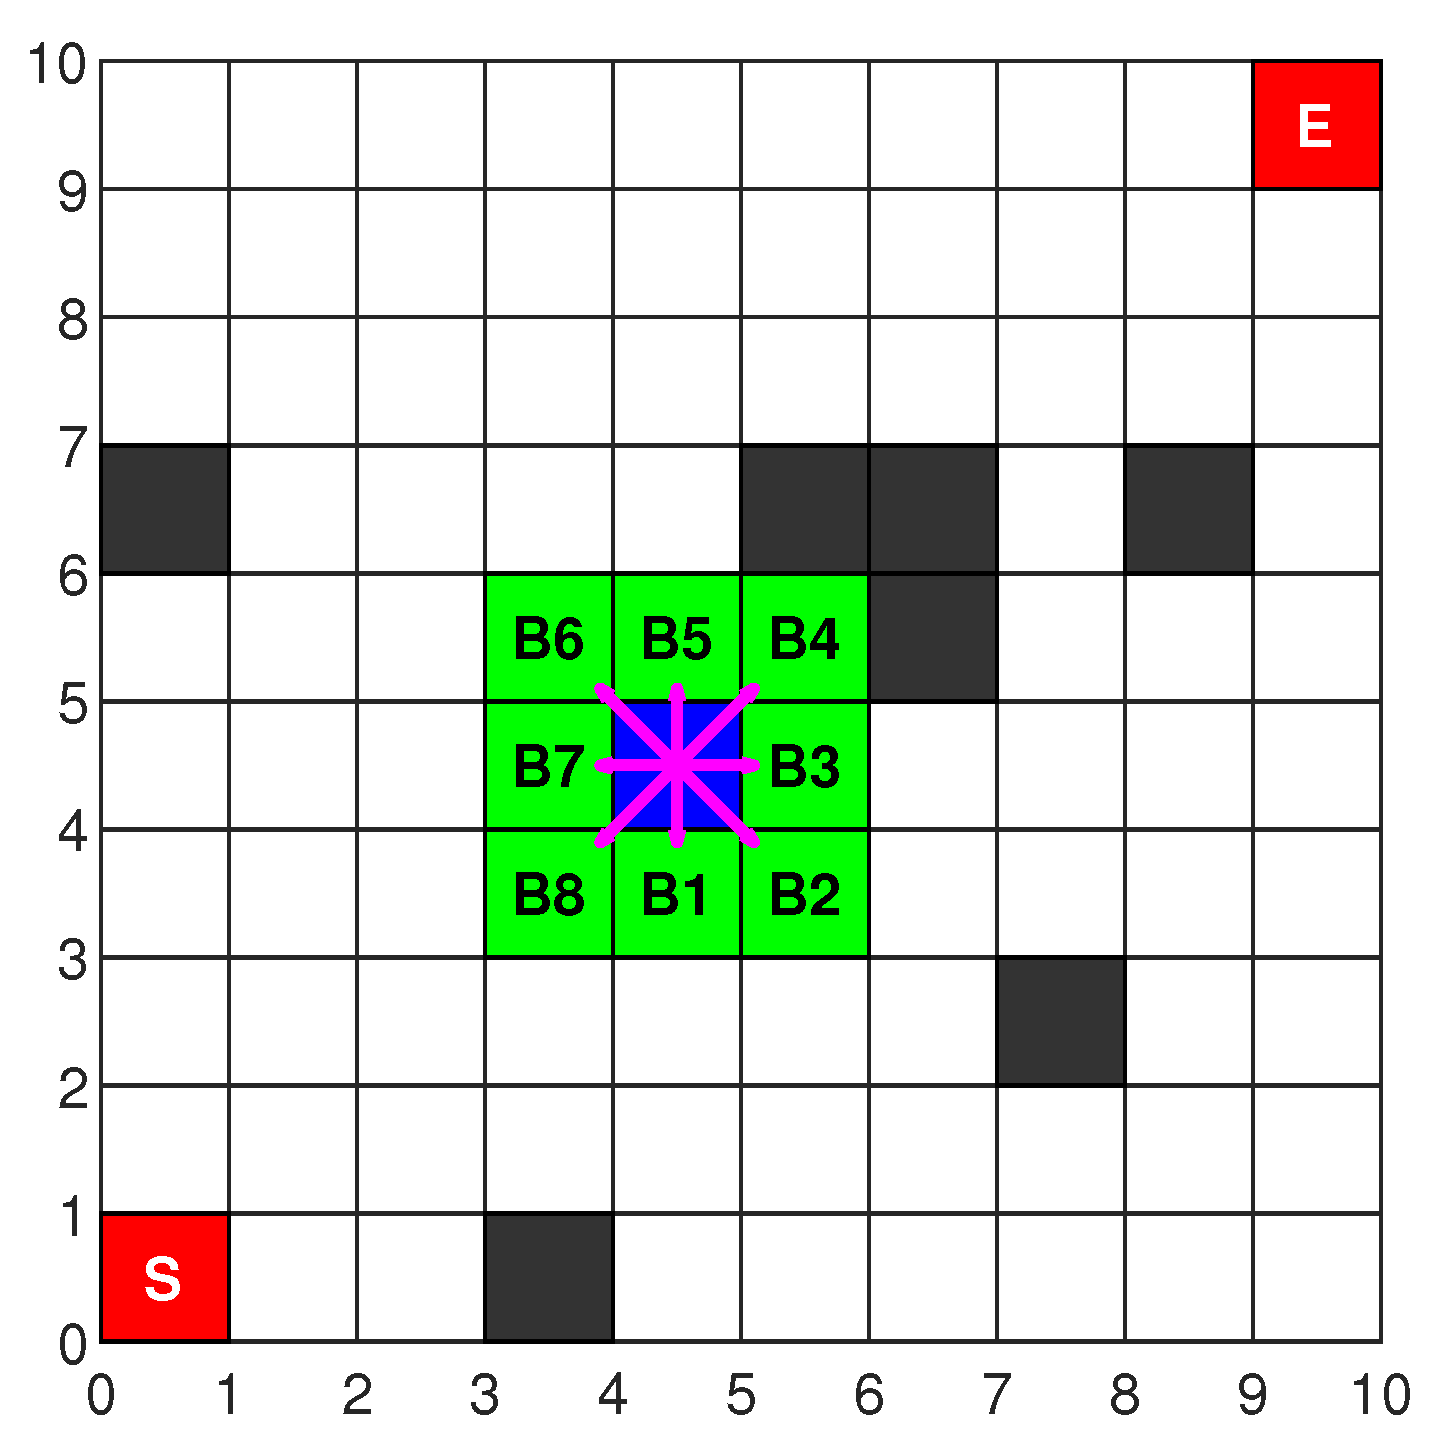
25]. Among these, the grid method is the most widely used due to its intuitive structure, ease of understanding, and straightforward implementation. In this study, a two-dimensional grid map is constructed using the grid method. As illustrated in
Figure 1,
S denotes the starting point,
E indicates the target endpoint, white cells represent free space, black cells denote obstacles, and each grid cell corresponds to a fixed coordinate.
4. Simulation Experiments and Analysis
This section presents simulation experiments of the NMS-EACO algorithm using a software platform. First, the algorithm’s parameters are configured. Second, an ablation study is performed to assess the contribution of each component. Third, NMS-EACO is compared against four other algorithms across three maps of varying sizes. Fourth, NMS-EACO is compared with other algorithms on three maps. Fifth, the performance of NMS-EACO is verified on complex maps. Finally, verifying the algorithm in a dynamic map.
4.1. Algorithm Parameters Configuration
Parameter settings play a crucial role in influencing the algorithm’s convergence speed, path quality, and overall performance. Drawing on practical engineering experience, this study conducts parameter tuning experiments under various map sizes and obstacle distributions. Particular attention is given to iterative adjustments of key parameters, such as the pheromone evaporation rate and heuristic function factor. After multiple rounds of evaluation based on metrics like path length and convergence speed, an optimal set of parameters demonstrating stable and high performance is identified, as outlined in
Table 1.
4.2. Ablation Study
To evaluate the effectiveness of each individual mechanism—namely, the A*-guided heuristic function, adaptive enhanced pheromone update rule, state transition probability under nonholonomic constraints, and the smoothing factor for optimizing state transitions—this study conducts a series of ablation experiments. Each mechanism is integrated with the basic ACO algorithm to create four extended variants, referred to as ACO1, ACO2, ACO3, and ACO4, as outlined in
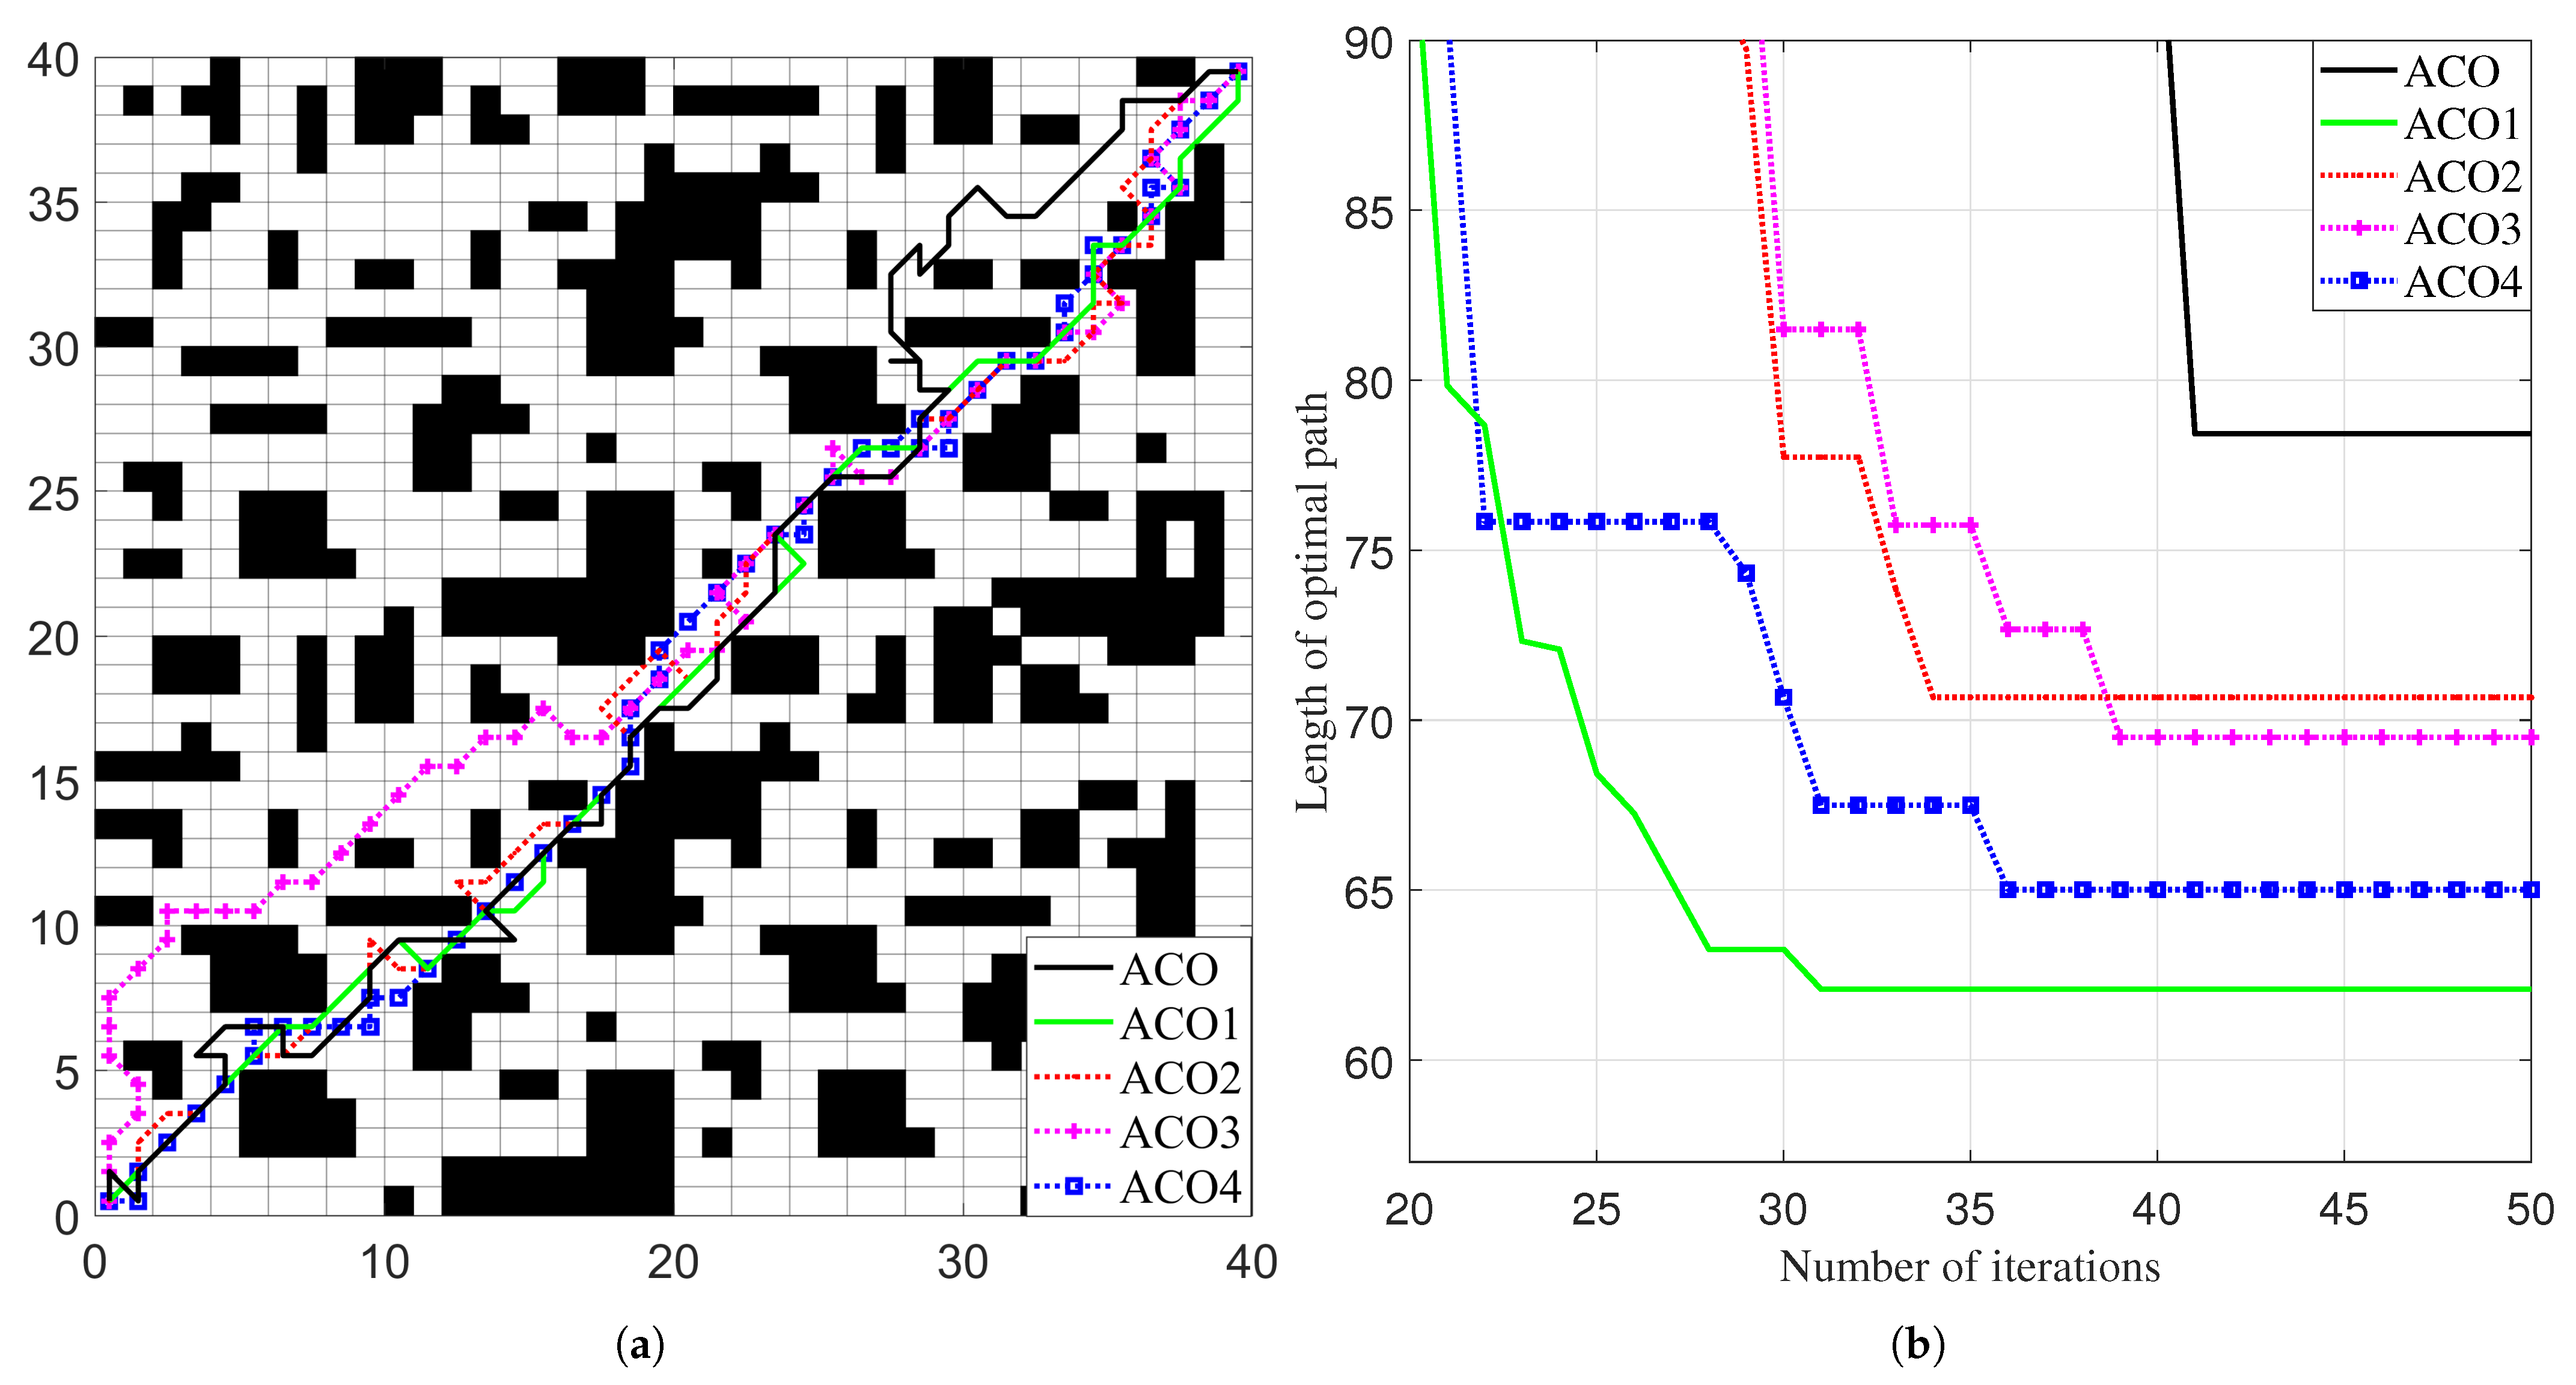
Table 2. A 40 × 40 grid map is used as the simulation environment, and each algorithm is executed 10 times. The outcomes of the experiments are presented in
Table 3.
As shown in
Figure 5 and
Table 3, all five ACOs successfully complete the path planning task. The minimum number of iterations for ACO2 through to ACO5 to converge to the optimal path is lower than that of the basic ACO. Specifically, ACO1 achieves both a shorter optimal path length and the average path length compared with ACO (62.08 < 78.43, 66.04 < 88.44, respectively), with fewer iterations (34 < 41), which proves the effectiveness of the A*-guided heuristic function. ACO2 also shows improvements, with shorter optimal and average path lengths (70.67 < 78.43 and 79.22 < 88.44) and reduced iterations (33 < 41), confirming the benefit of the adaptive enhanced pheromone update rule. Similarly, ACO3 outperforms the basic ACO in optimal and average path lengths (69.5 < 78.43 and 73.53 < 88.44) and requires fewer iterations (38 < 41), validating the use of state transition probability under nonholonomic constraints. In ACO4, the number of turns is significantly reduced (17 < 51), alongside shorter optimal and mean path lengths (65.01 < 78.43 and 67.59 < 88.44), which supports the effectiveness of the smoothing factor for optimizing state transitions. In addition, the run time of ACO1-ACO4 is shorter than that of ACO. From these results, it is evident that each individual mechanism substantially contributes to enhancing the performance of the ACO algorithm.
4.3. Simulation Experiments Across Three Different Environments
To demonstrate the superiority and applicability of NMS-EACO, simulation experiments are performed on grid maps of three different sizes:
,
, and
. In addition to varying map sizes, the obstacle distributions also differ. These three maps are referred to as Map-1, Map-2, and Map-3, respectively, as detailed in
Table 4. Additionally, four ACO variants are selected for experimental comparison, listed in
Table 5. To minimize experimental errors and ensure result reliability, each algorithm is executed 30 times.
This study uses optimal path length, average path length, and number of turns to assess path quality. Average convergence generation and run time are used to evaluate convergence performance, and standard deviation to measure algorithm stability. Based on practical engineering considerations, path quality is prioritized as the primary evaluation criterion, followed by convergence performance as the secondary criterion, and stability as the tertiary criterion.
4.3.1. Experimental Results on Map-1
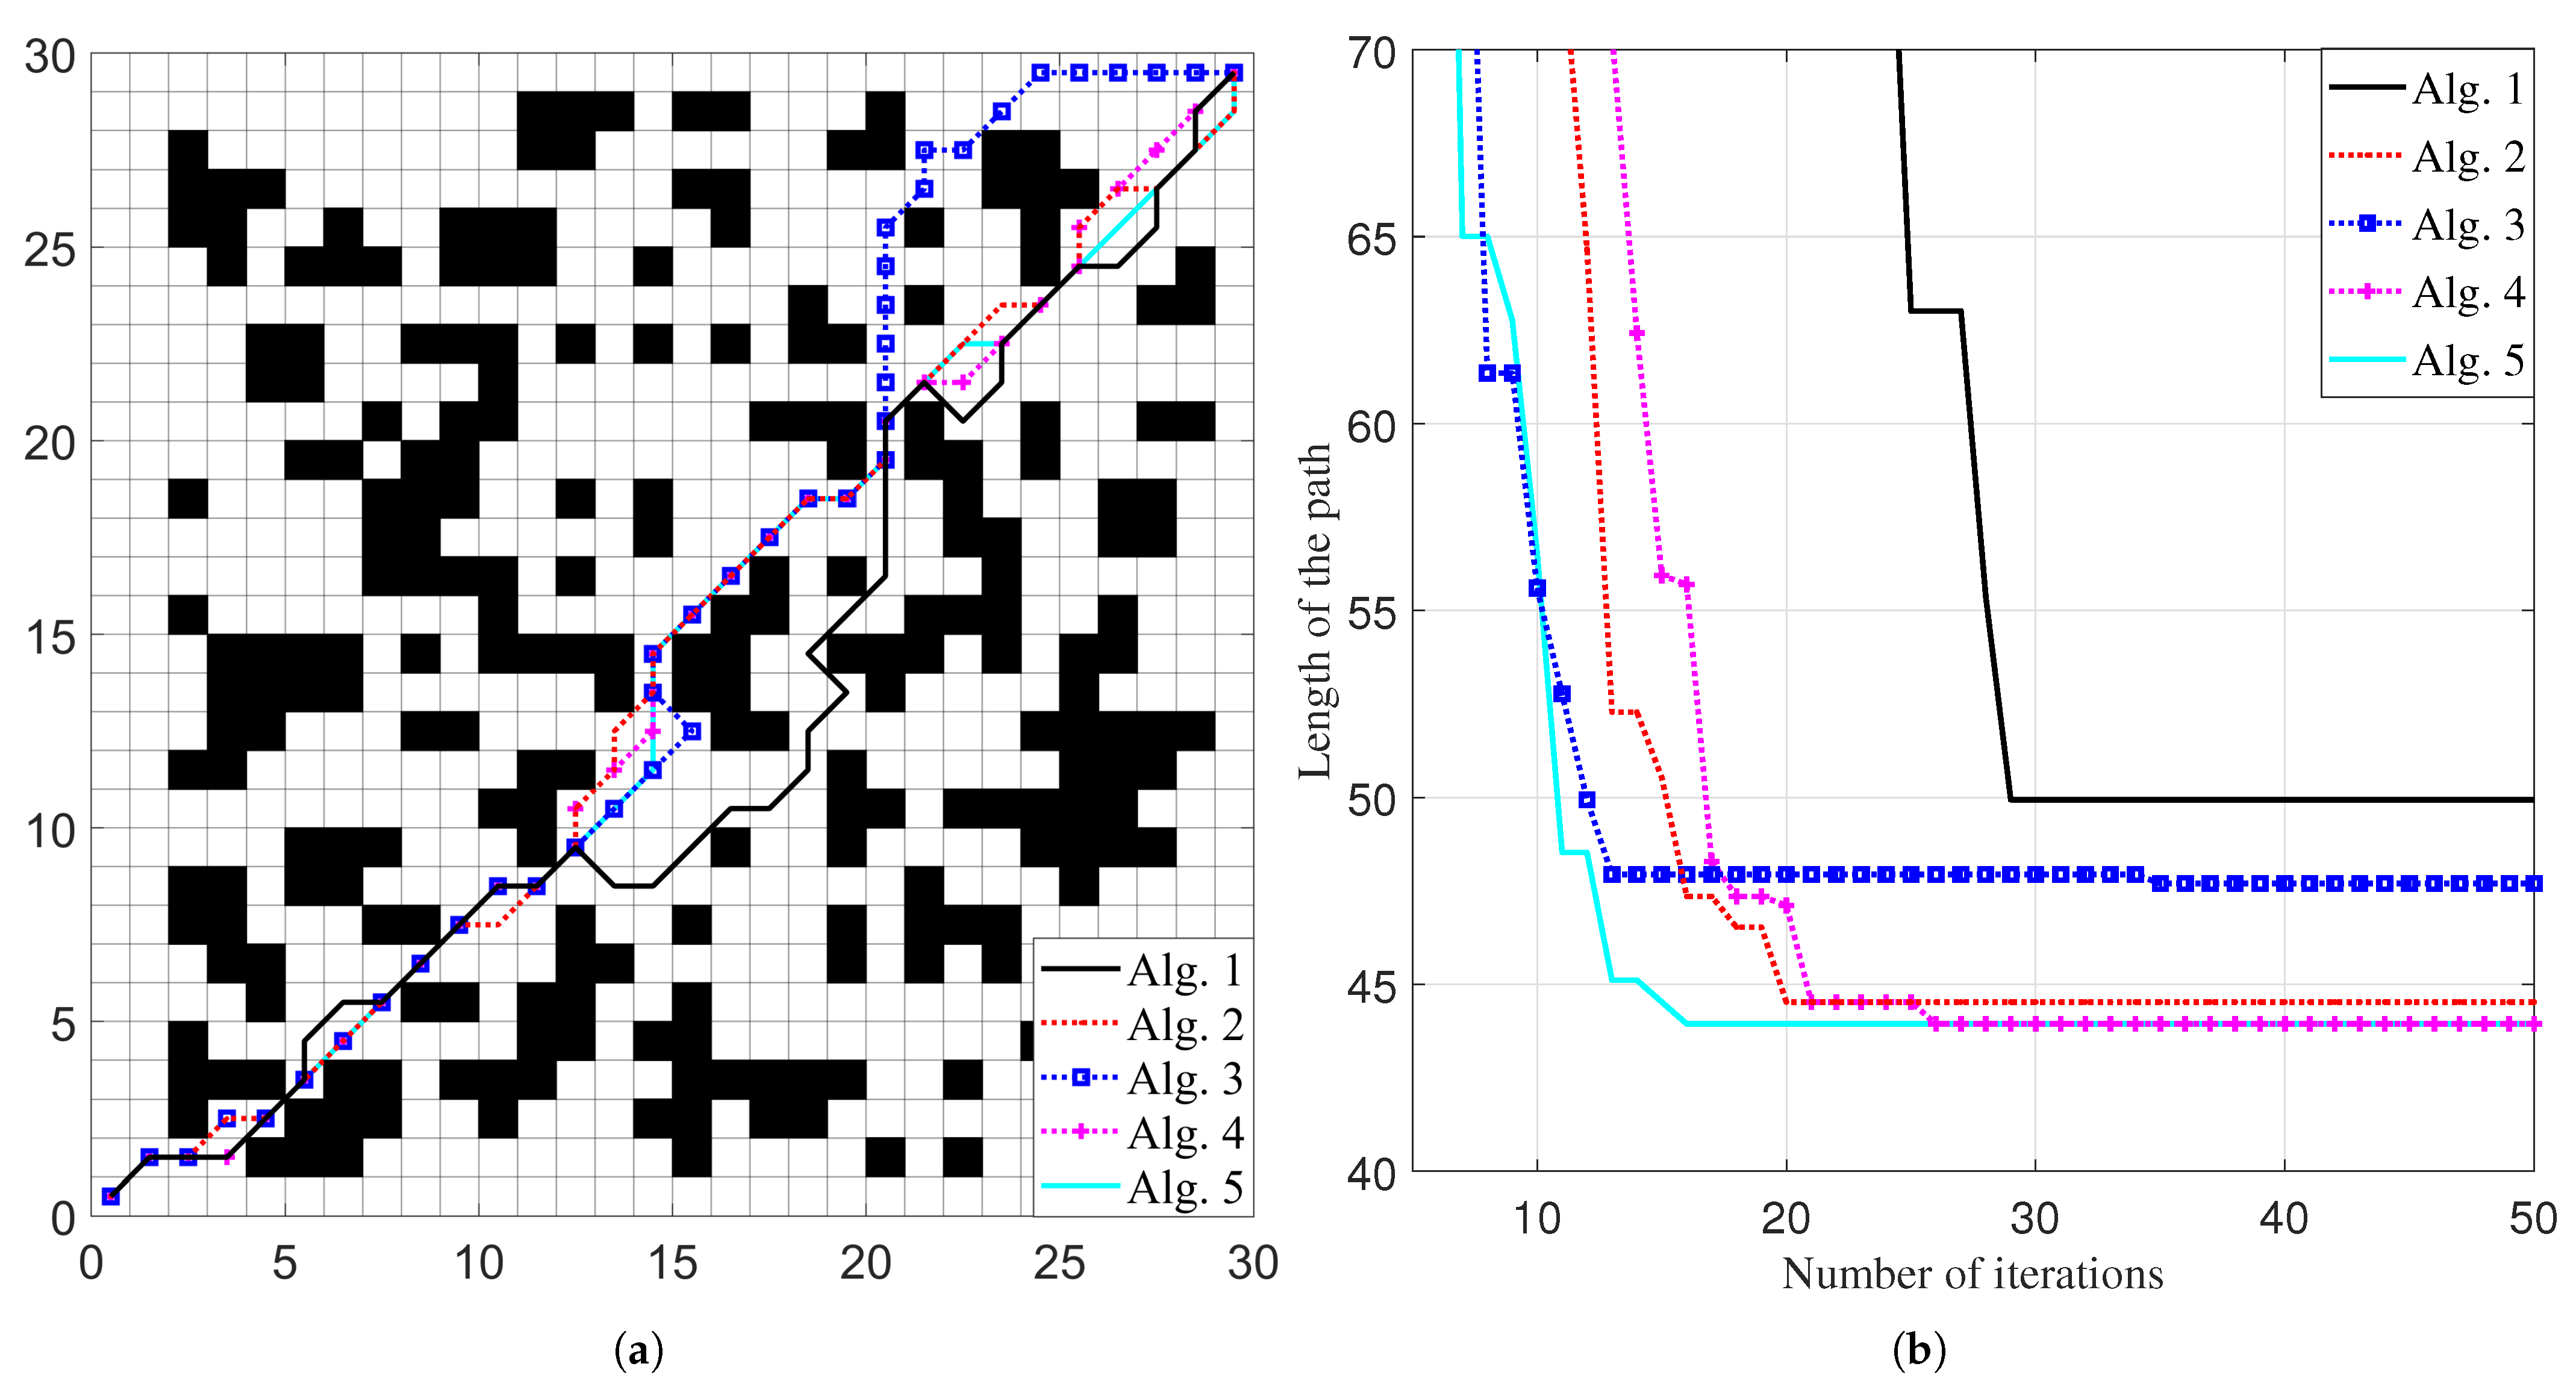
Figure 6 illustrates the optimal paths and iteration curves of the five algorithms on Map-1. The results from 30 runs of each algorithm are recorded and analyzed, with the statistical summary presented in
Table 6.
As shown in
Figure 6, all five algorithms successfully complete the optimal path planning. Among them, Alg.2, Alg.4 and Alg.5 produce similar path shapes, while the paths generated by Alg.1 and Alg.3 are significantly longer. In the iteration curves, Alg.2 through to Alg.5 converge in fewer iterations compared with Alg.1.
According to the data in
Table 6, Alg.4 and Alg.5 achieve the shortest optimal path length 43.94, while Alg.2 follows closely at 44.52. The average path lengths for these three algorithms are also comparable. In terms of turn count, Alg.4 is 18.50 and Alg.5 is 16.87, having fewer turns than Alg.2 at 23, indicating smoother paths. Based on the mean number of convergence iterations, ranked from fewest to most, the order is Alg.5 < Alg.2 < Alg.4, suggesting that Alg.5 has the fastest convergence, followed by Alg.2 and then Alg.4. In addition, the running times of Alg.2–Alg.5 are much lower than that of Alg.1. Additionally, when comparing the standard deviation of path lengths, Alg.5 exhibits the smallest variation at 0.63, followed by Alg.2 at 0.74 and Alg.4 at 0.93, indicating higher stability in path planning.
Therefore, on Map-1, Alg.4 and Alg.5 demonstrate better performance in terms of path quality, convergence speed, and stability, with Alg.2 performing slightly behind them.
4.3.2. Experimental Results on Map-2
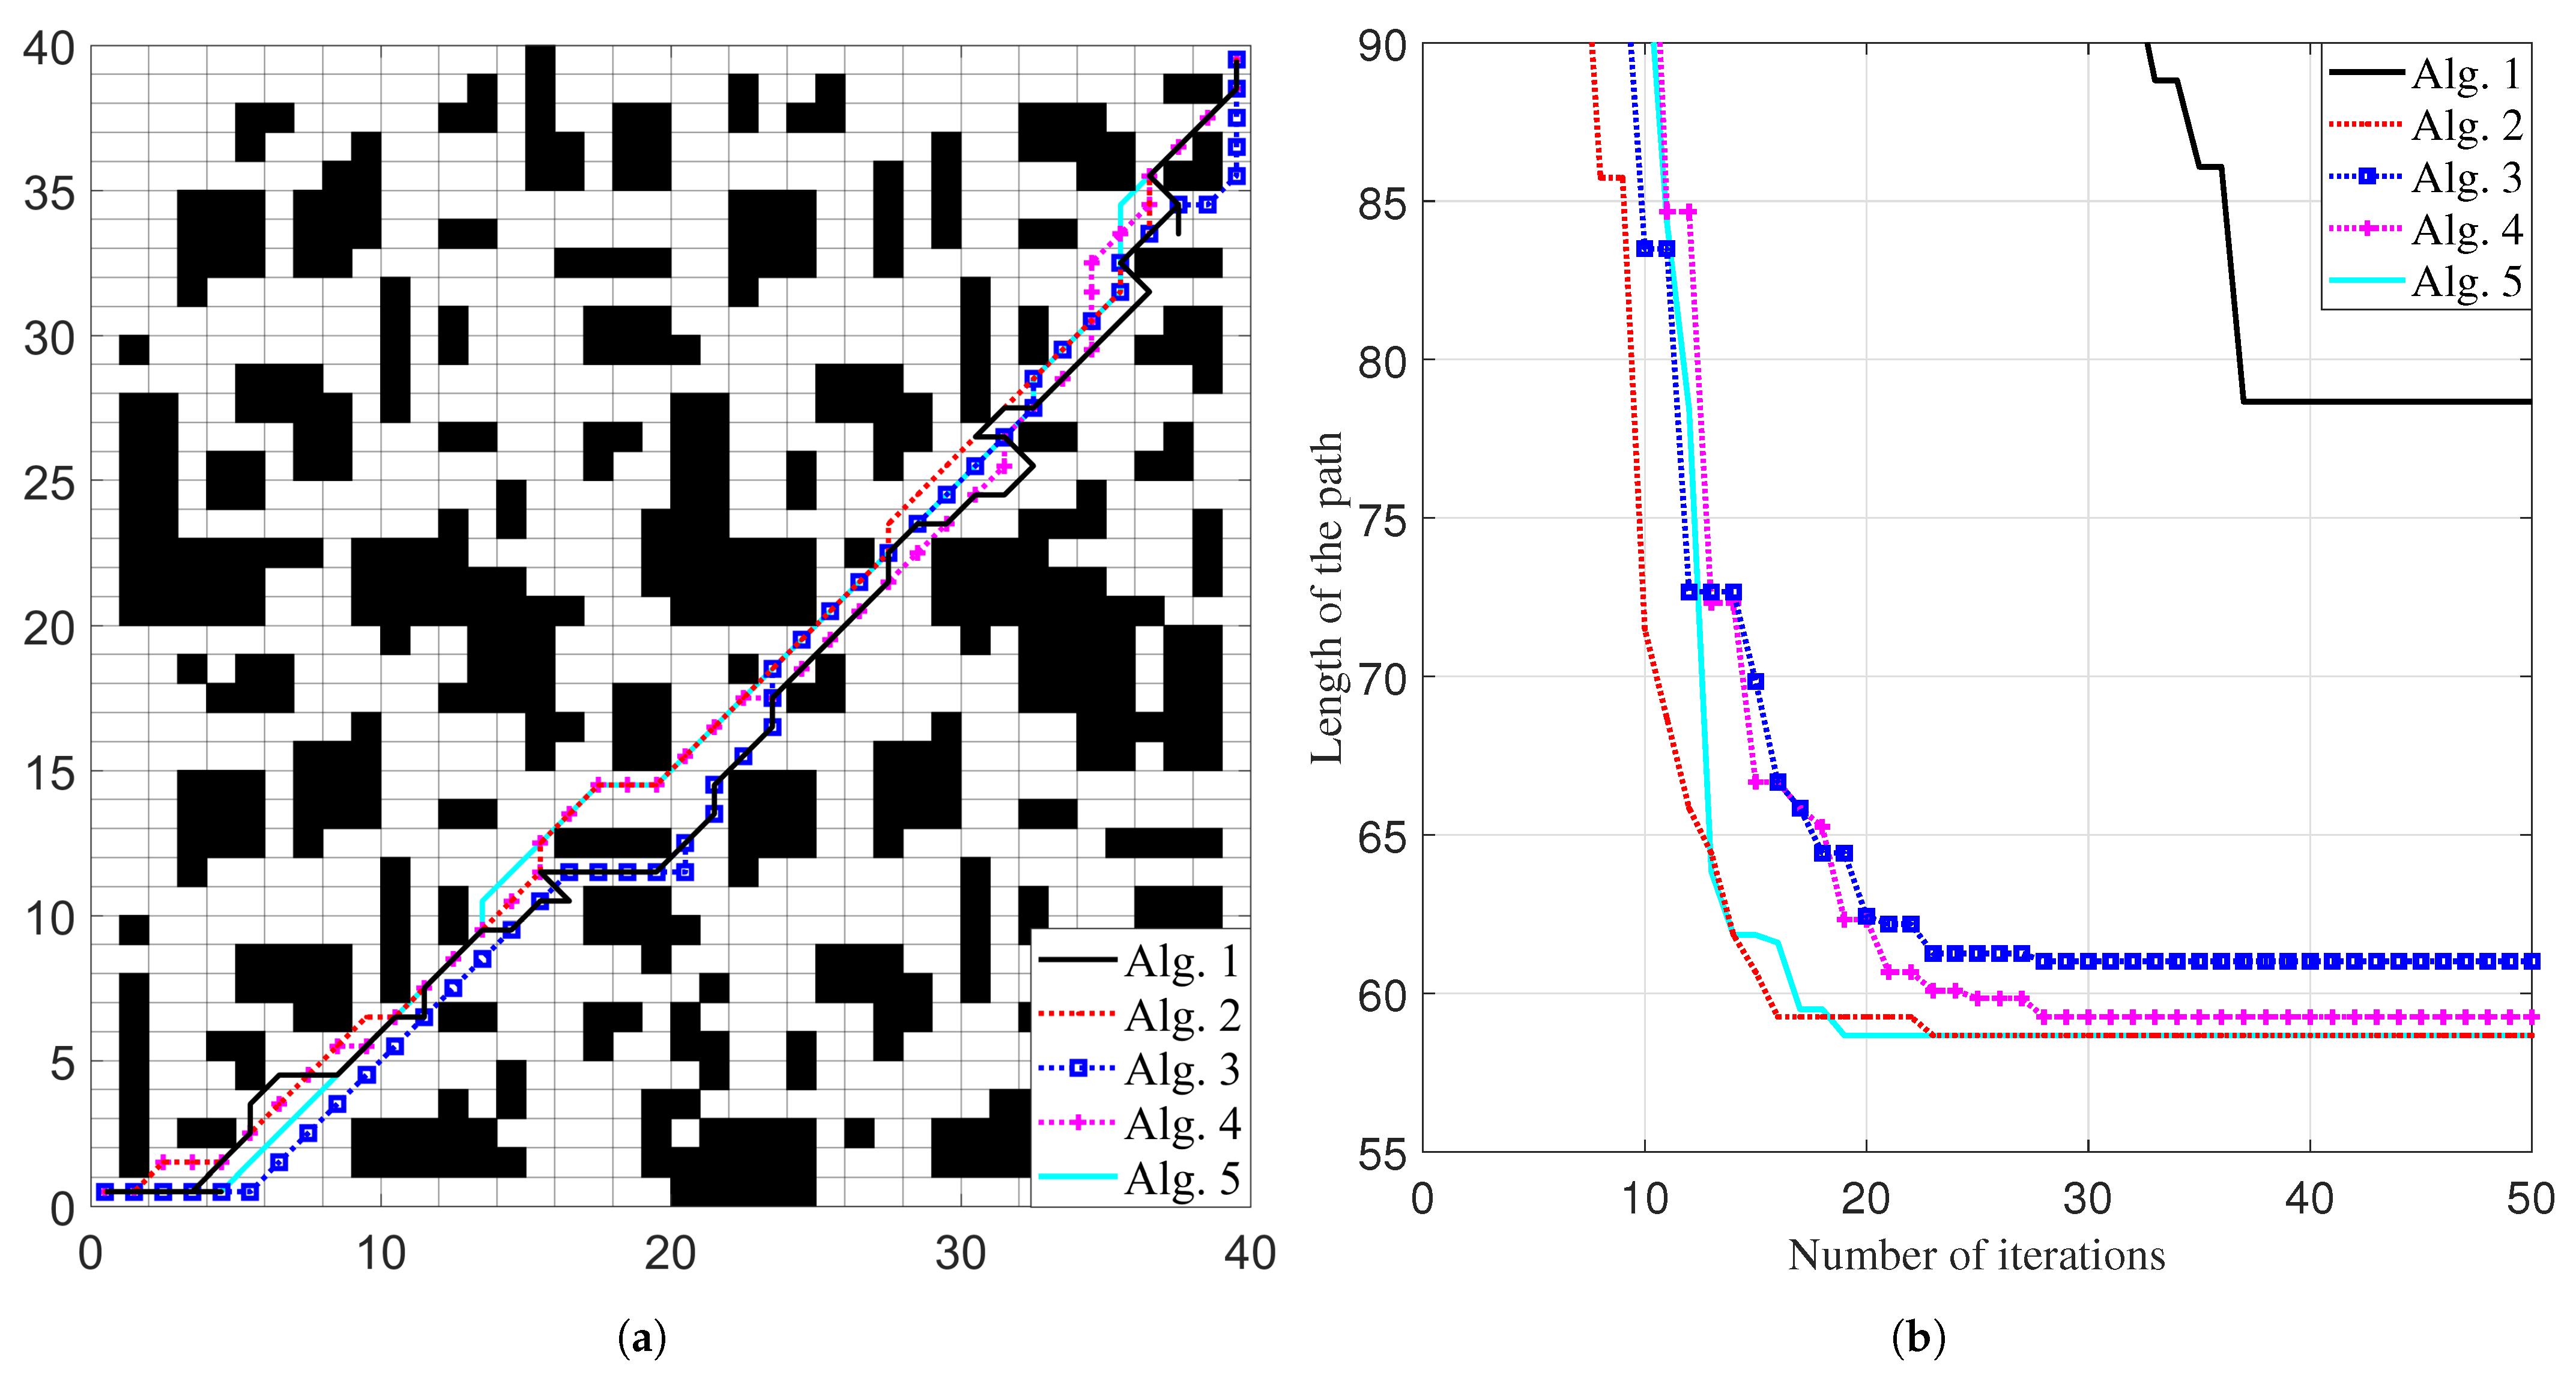
Figure 7 displays the optimal paths and iteration curves of the five algorithms on Map-2. The results from 30 runs of each algorithm are collected and analyzed, with the statistical outcomes summarized in
Table 7.
As shown in
Figure 7, all five algorithms have completed the optimal path planning task, with the resulting paths displaying similar shapes. However, the path generated by Alg.1 contains more turning points and appears less smooth. The iteration curves for the optimal paths of Alg.2 through to Alg.5 follow similar trends and converge with noticeably fewer iterations compared with Alg.1.
According to
Table 7, Alg.2, Alg.4, and Alg.5 achieve the shortest optimal path length at 58.66, and their average path lengths are also closely aligned. Among them, Alg.5 has the fewest turns (12.50), compared with Alg.2 (20.04) and Alg.4 (21.53), indicating a smoother path. In terms of average convergence iterations, Alg.5 (19.40) performs the best, followed closely by Alg.4 (21.53), both of which outperform Alg.2 (23.63). Except for this, the running times of Alg.2–Alg.5 are close and lower than Alg.1. Regarding path stability, Alg.5 again shows the smallest standard deviation (1.00), followed by Alg.4 (1.54), indicating more consistent performance.
Overall, in Map-2, Alg.5 and Alg.4 deliver the best results across all three evaluation metrics: path quality, convergence speed, and stability, which are followed by Alg.3.
4.3.3. Experimental Results on Map-3
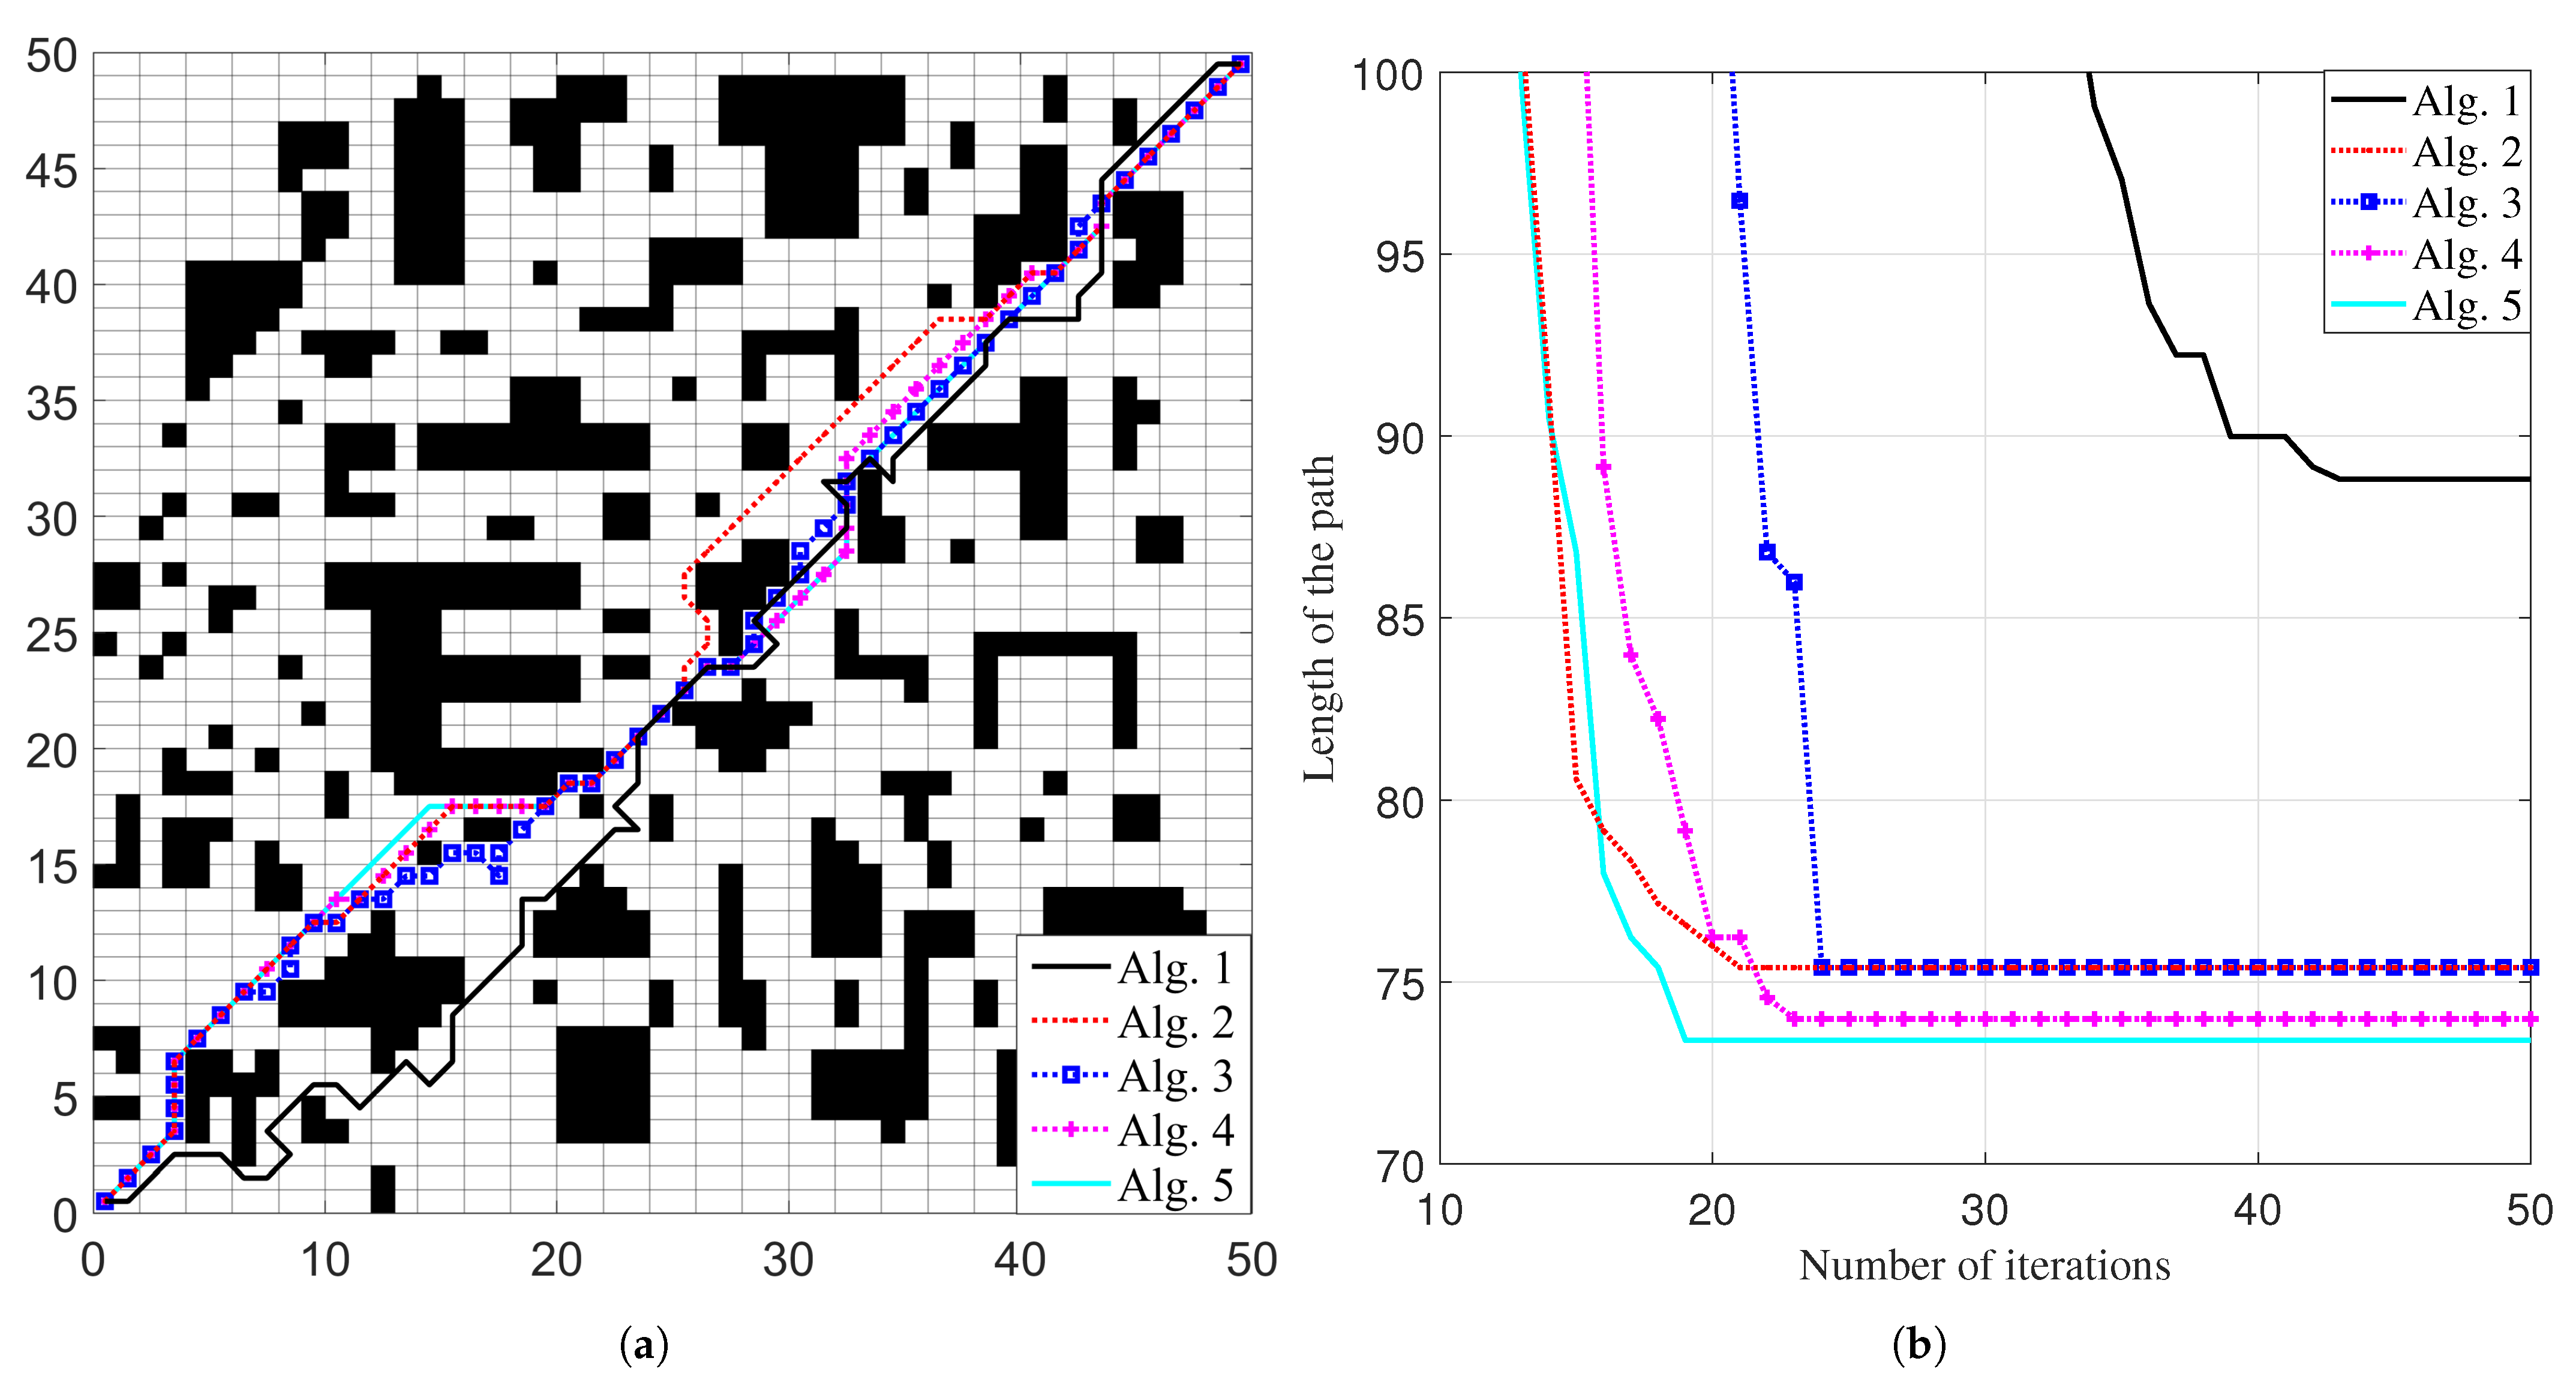
Figure 8 presents the optimal paths and iteration curves of the five algorithms on Map-3. Each algorithm is executed 30 times, and the resulting data are recorded and analyzed. The statistical results are summarized in
Table 8.
As illustrated in
Figure 8, the optimal paths generated by Alg.2 through to Alg.5 are quite similar, while the path produced by Alg.1 appears longer and less smooth. In the iteration curves, Alg.2, Alg.4, and Alg.5 converge more quickly than Alg.1 and Alg.3, with Alg.3 requiring fewer iterations than Alg.1.
According to
Table 8, Alg.5 achieves both the shortest optimal path length (73.89) and mean path length (74.01), followed by Alg.4 (73.98, 76.81), Alg.2 (75.39, 77.58), and Alg.3 (75.44, 77.70). Additionally, Alg.5 records the lowest average number of turns (13.3), compared with Alg.4 (19.50), Alg.3 (22.43), and Alg.2 (30.36), indicating a smoother path. When comparing average convergence iterations, Alg.5 (20.46) again performs best, followed by Alg.3 (26.30) and Alg.4 (26.33). In addition, Alg.5 has the shortest running time, Alg.2–Alg.4 have similar running times, slightly longer than Alg.5, and Alg.1 has the longest running time. In terms of stability, measured by the standard deviation of path lengths, Alg.5 shows the smallest variation (0.61), with Alg.3 (1.74) and Alg.4 (1.88) following.
In summary, for Map-3, Alg.5 delivers the strongest overall performance across all evaluation metrics, followed by Alg.4 and then Alg.3.
To summarize, on Map-1, Alg.2, Alg.4, and Alg.5 demonstrate better performance, while on Maps 2 and 3, Alg.3 through to Alg.5 perform more effectively. Although the performance of each algorithm is influenced by the specific map, both Alg.4 and Alg.5 show strong adaptability across all three environments. As detailed in
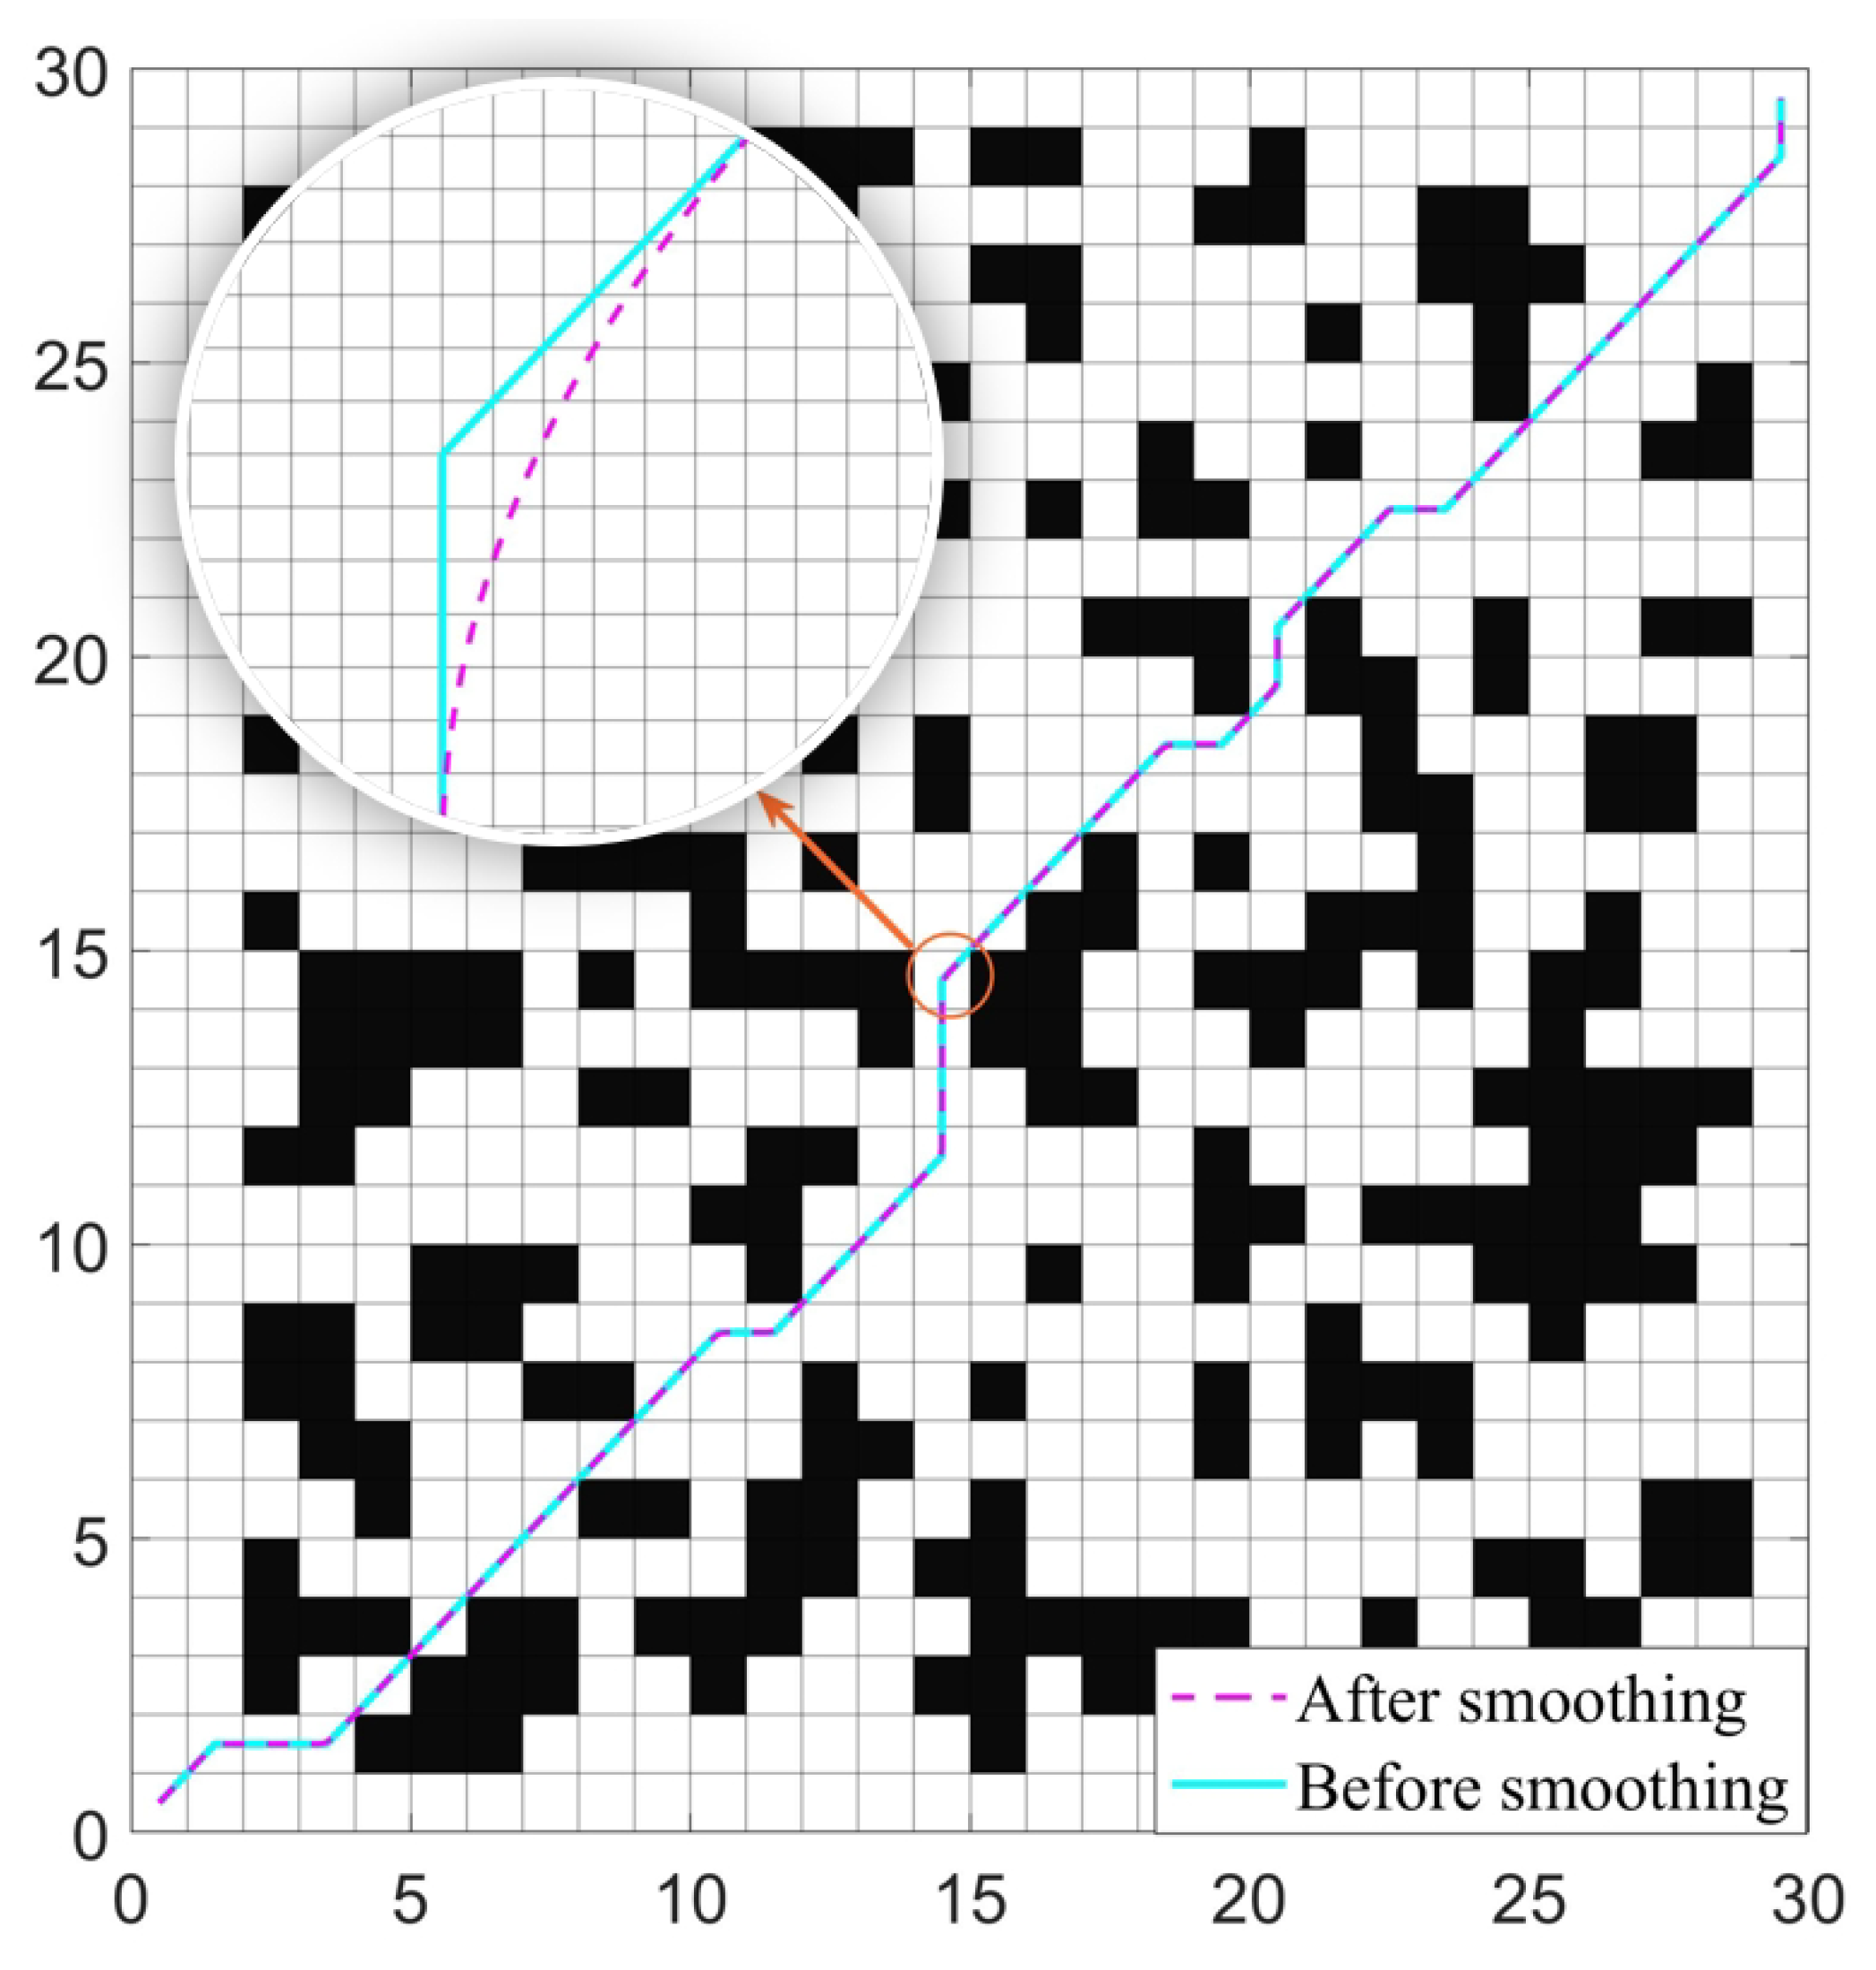
Table 9, Alg.4 and Alg.5 have comparable optimal path lengths. However, Alg.5 achieves a mean path length that is 1.53 units shorter than Alg.4, converges 5.25 iterations faster on average, less than 1.47 time units in runtime, and has a 0.7 lower standard deviation in path length, highlighting the advantages of the A*-guided heuristic function and the adaptive enhanced pheromone update rule. Moreover, the average number of turns for Alg.5 is 5.61 fewer than that of Alg.4, further demonstrating the effectiveness of the state transition probability under nonholonomic constraints and the smoothing factor. Additionally, as illustrated in
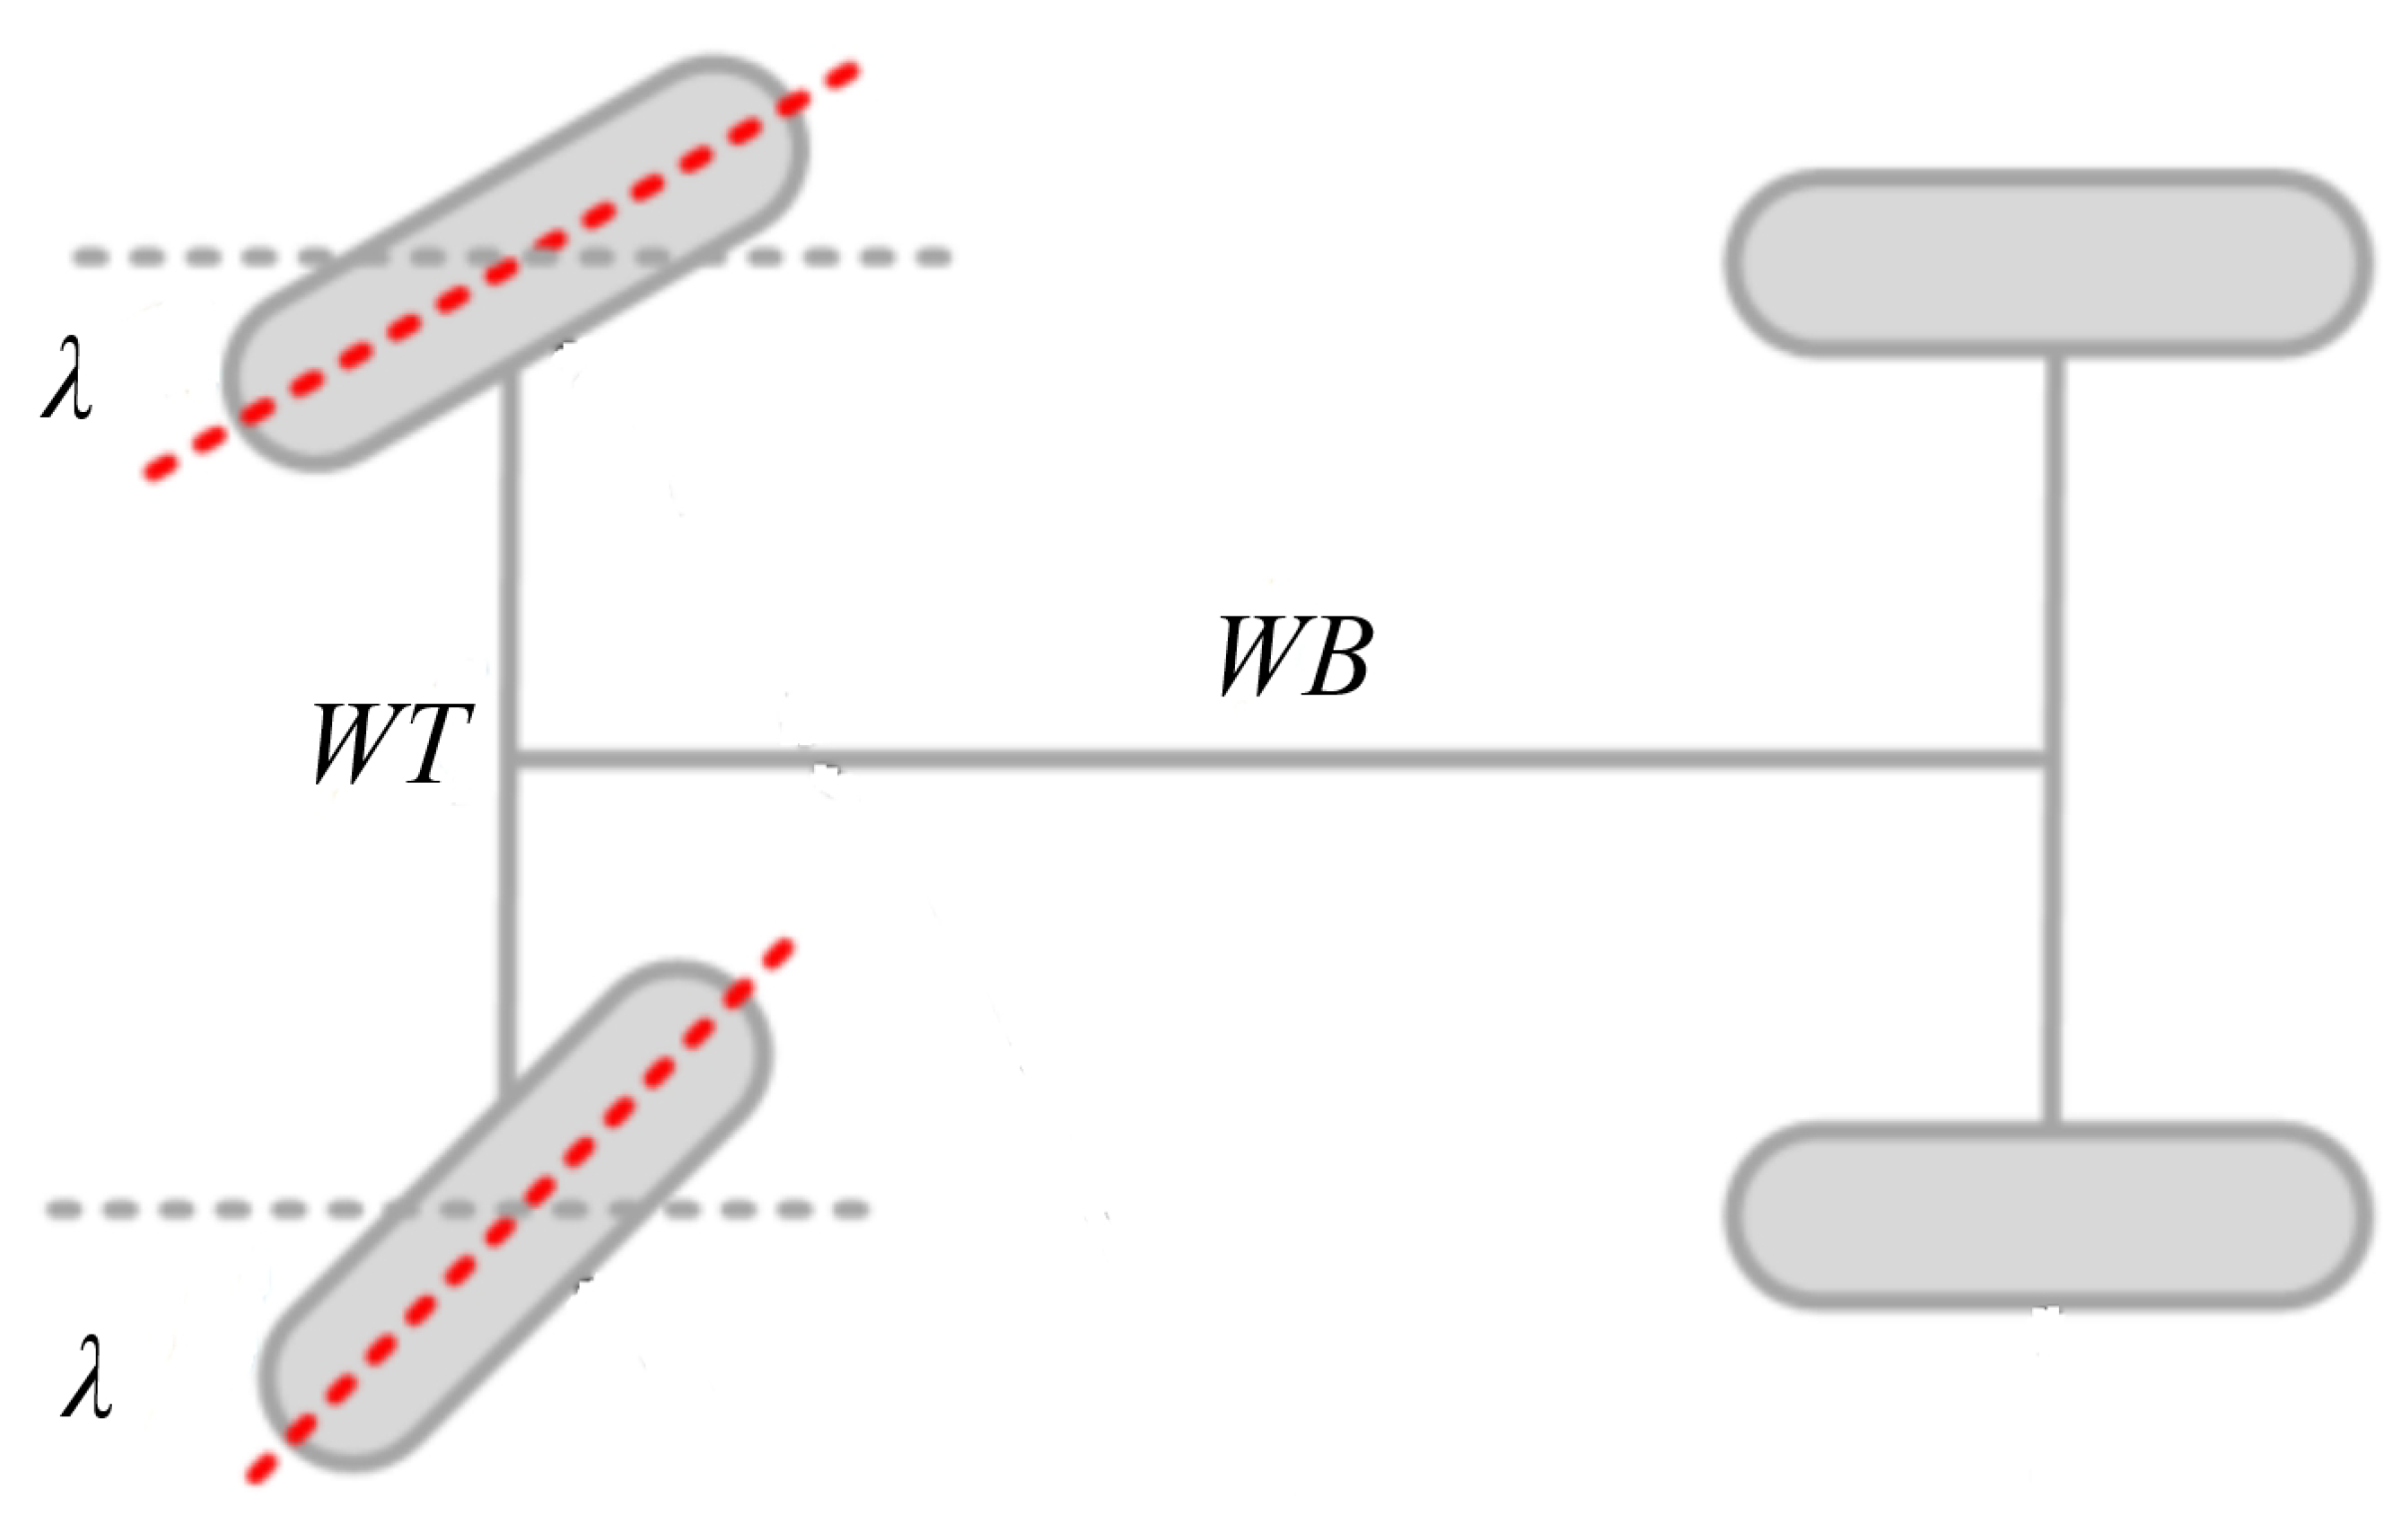
Figure 9, the path optimized using a cubic Bézier curve is smoother and better aligned with the mobile robot’s turning characteristics.
4.4. Comparison of NMS-EACO with Other Algorithms
This section uses the IGWO [
34] and A* [
9] algorithms to conduct comparative experiments with the NMS-EACO algorithm on three maps. Each algorithm runs 30 times in each map and the experimental results are shown in
Table 10 and
Figure 10.
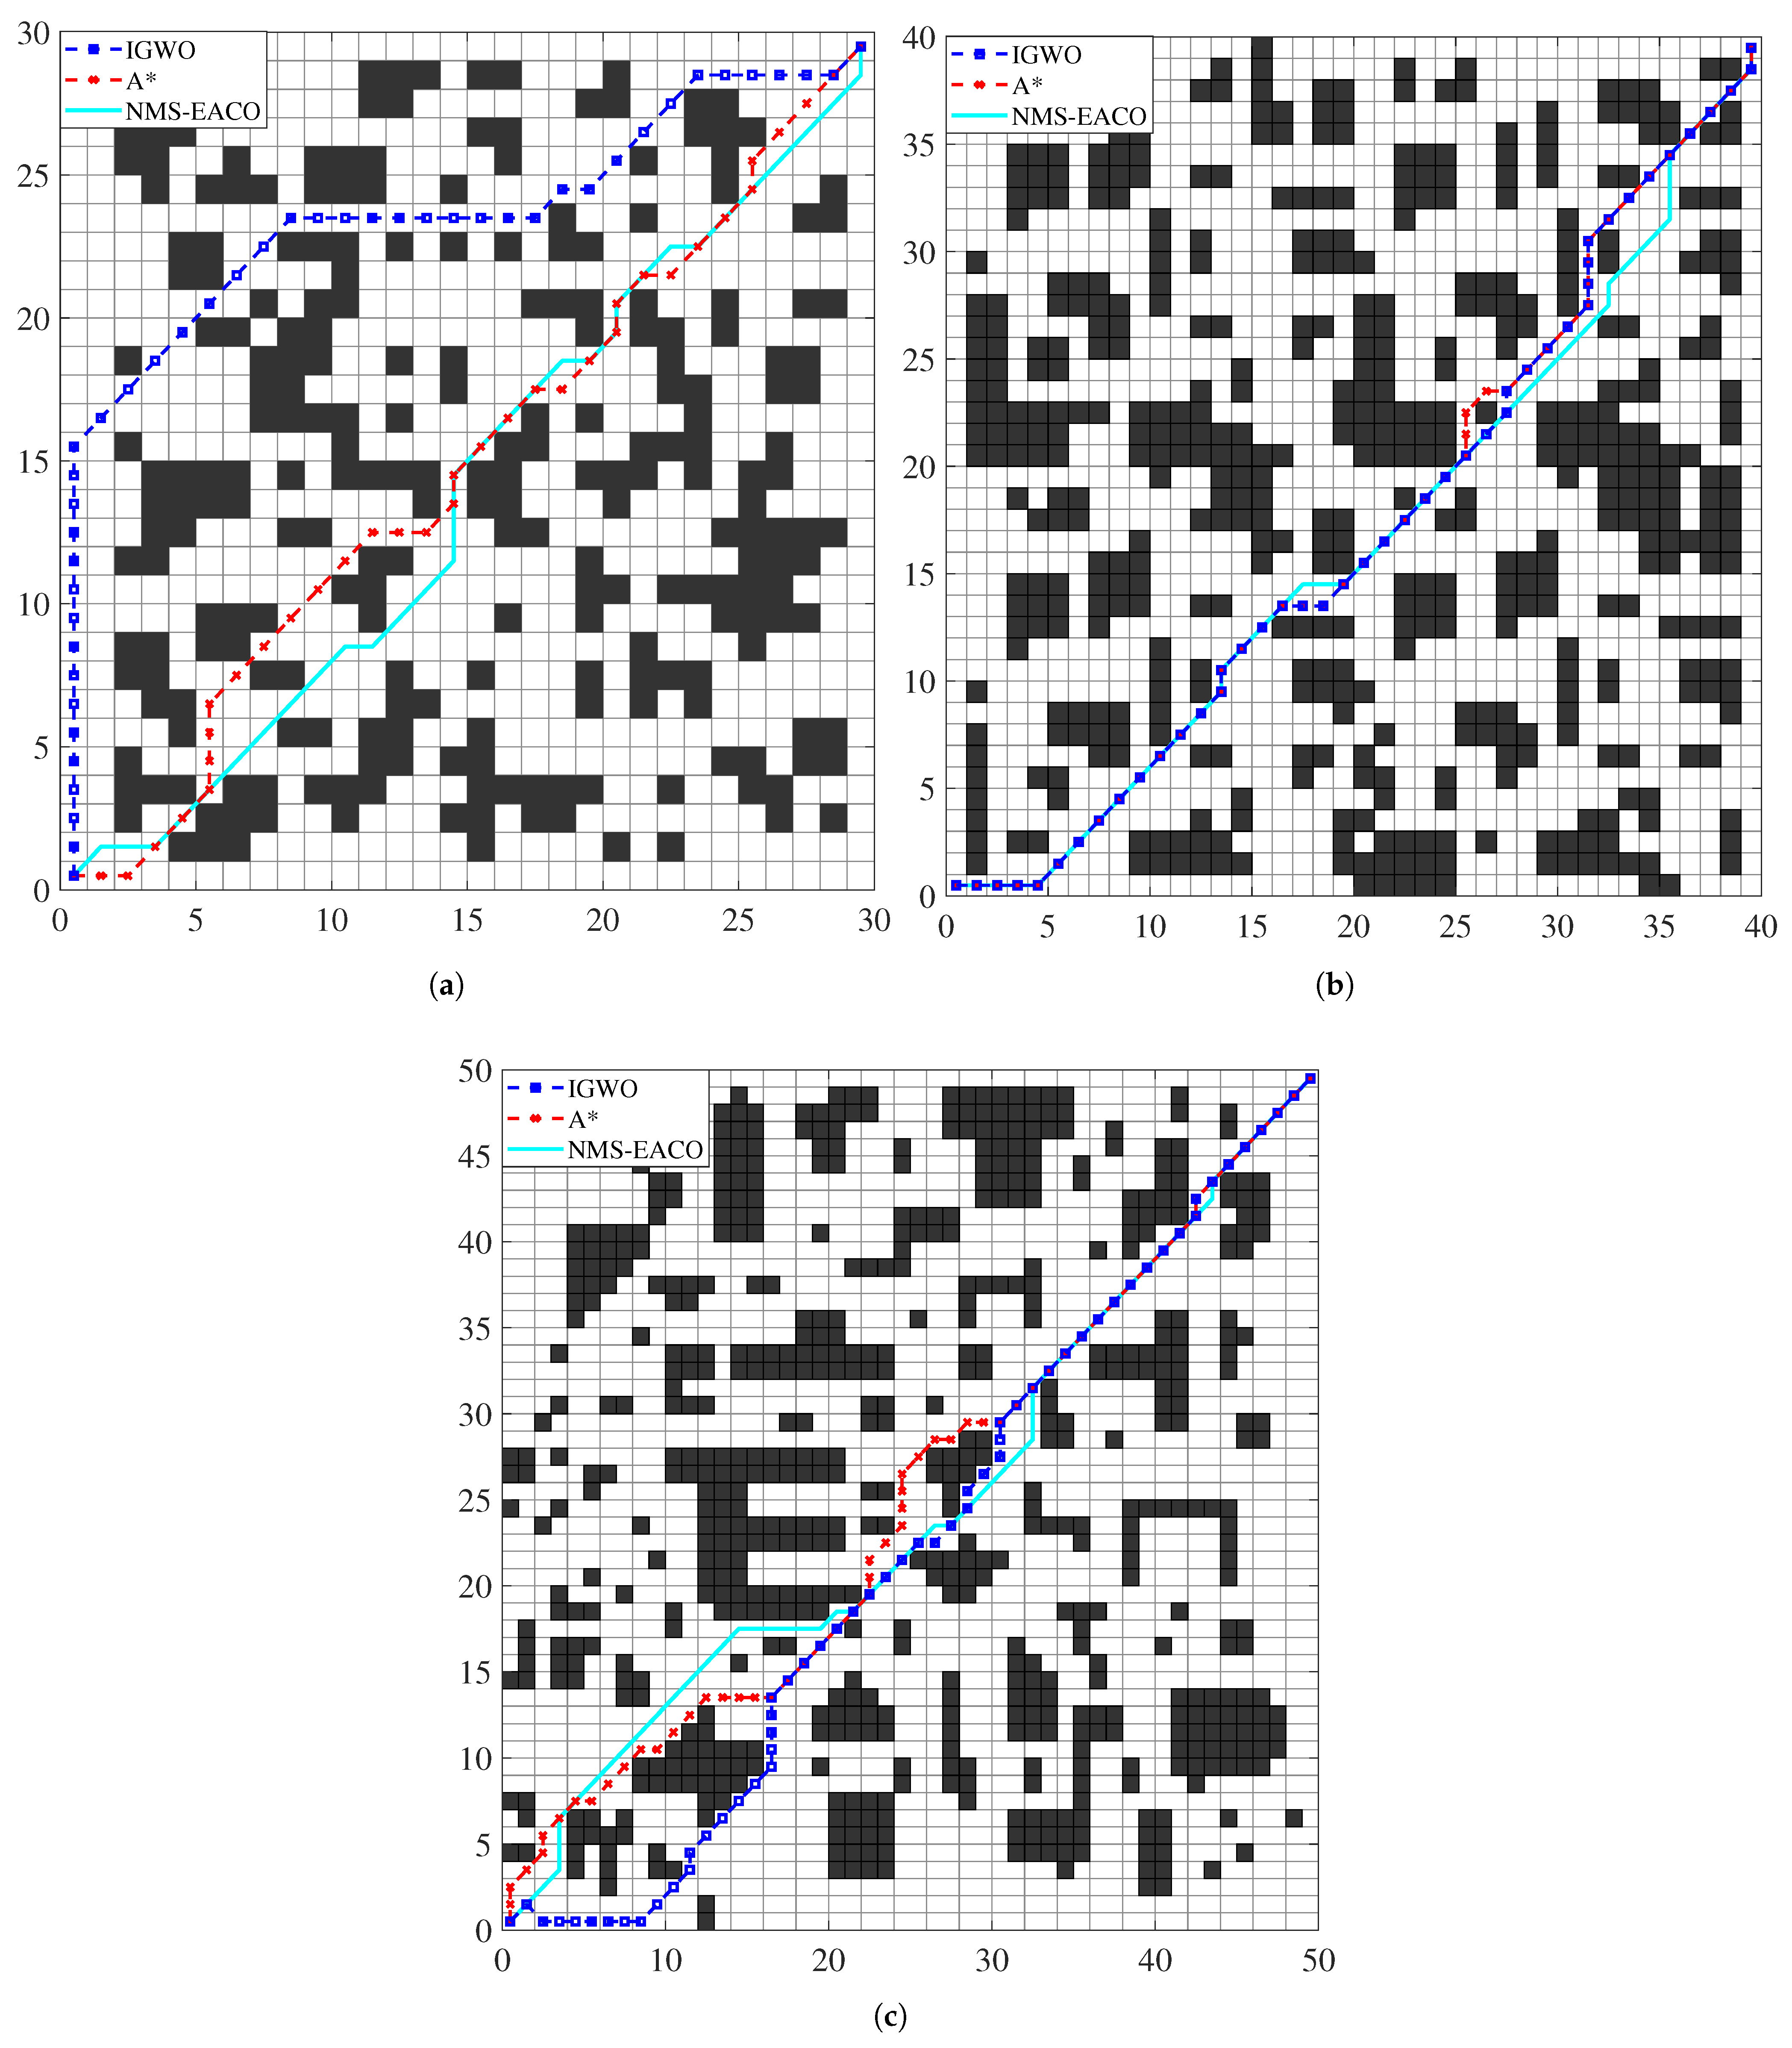
As shown in
Figure 10, the three algorithms completed the optimal path planning in each map. In map-1, the optimal paths planned by the three algorithms are quite different. The path planned by the IGWO is quite different from the paths planned by the NMS-ECAO and the A* algorithm, and the path is the longest. In map-2, the paths planned by the three algorithms are relatively close. In map-3, the optimal paths planned by the three algorithms are quite different in the first half, but basically the same in the second half.
Analyzing
Table 10, we can find that in terms of path length: in map-1, NMS-EACO (43.94) and A* (44.53) are close and better than IGWO (49.79); in map-2, NMS-EACO (58.66) and IGWO (58.67) are close and better than A* (59.25); in map-3, the path lengths of the three algorithms are close, and NMA-ECAO (73.39) is the shortest. In terms of the number of turns: in map-1, IGWO (7) is less than NMS-EACO (16.87) and A* (15); in map-2, the number of turns of the three algorithms is close; in map-3, NMS-EACO (13.33) is less than IGWO (17.34) and A* (19). In terms of running time, A* has the shortest time, followed by NMS-EACO, and IGWO has the longest time.
From the comparative experiments from map-1 to map-3, it can be found that the length and number of turns of the path planned by NMS-ECAO are better than those of IGWO and A* algorithms.
4.5. Simulation Experiments in Complex Environments
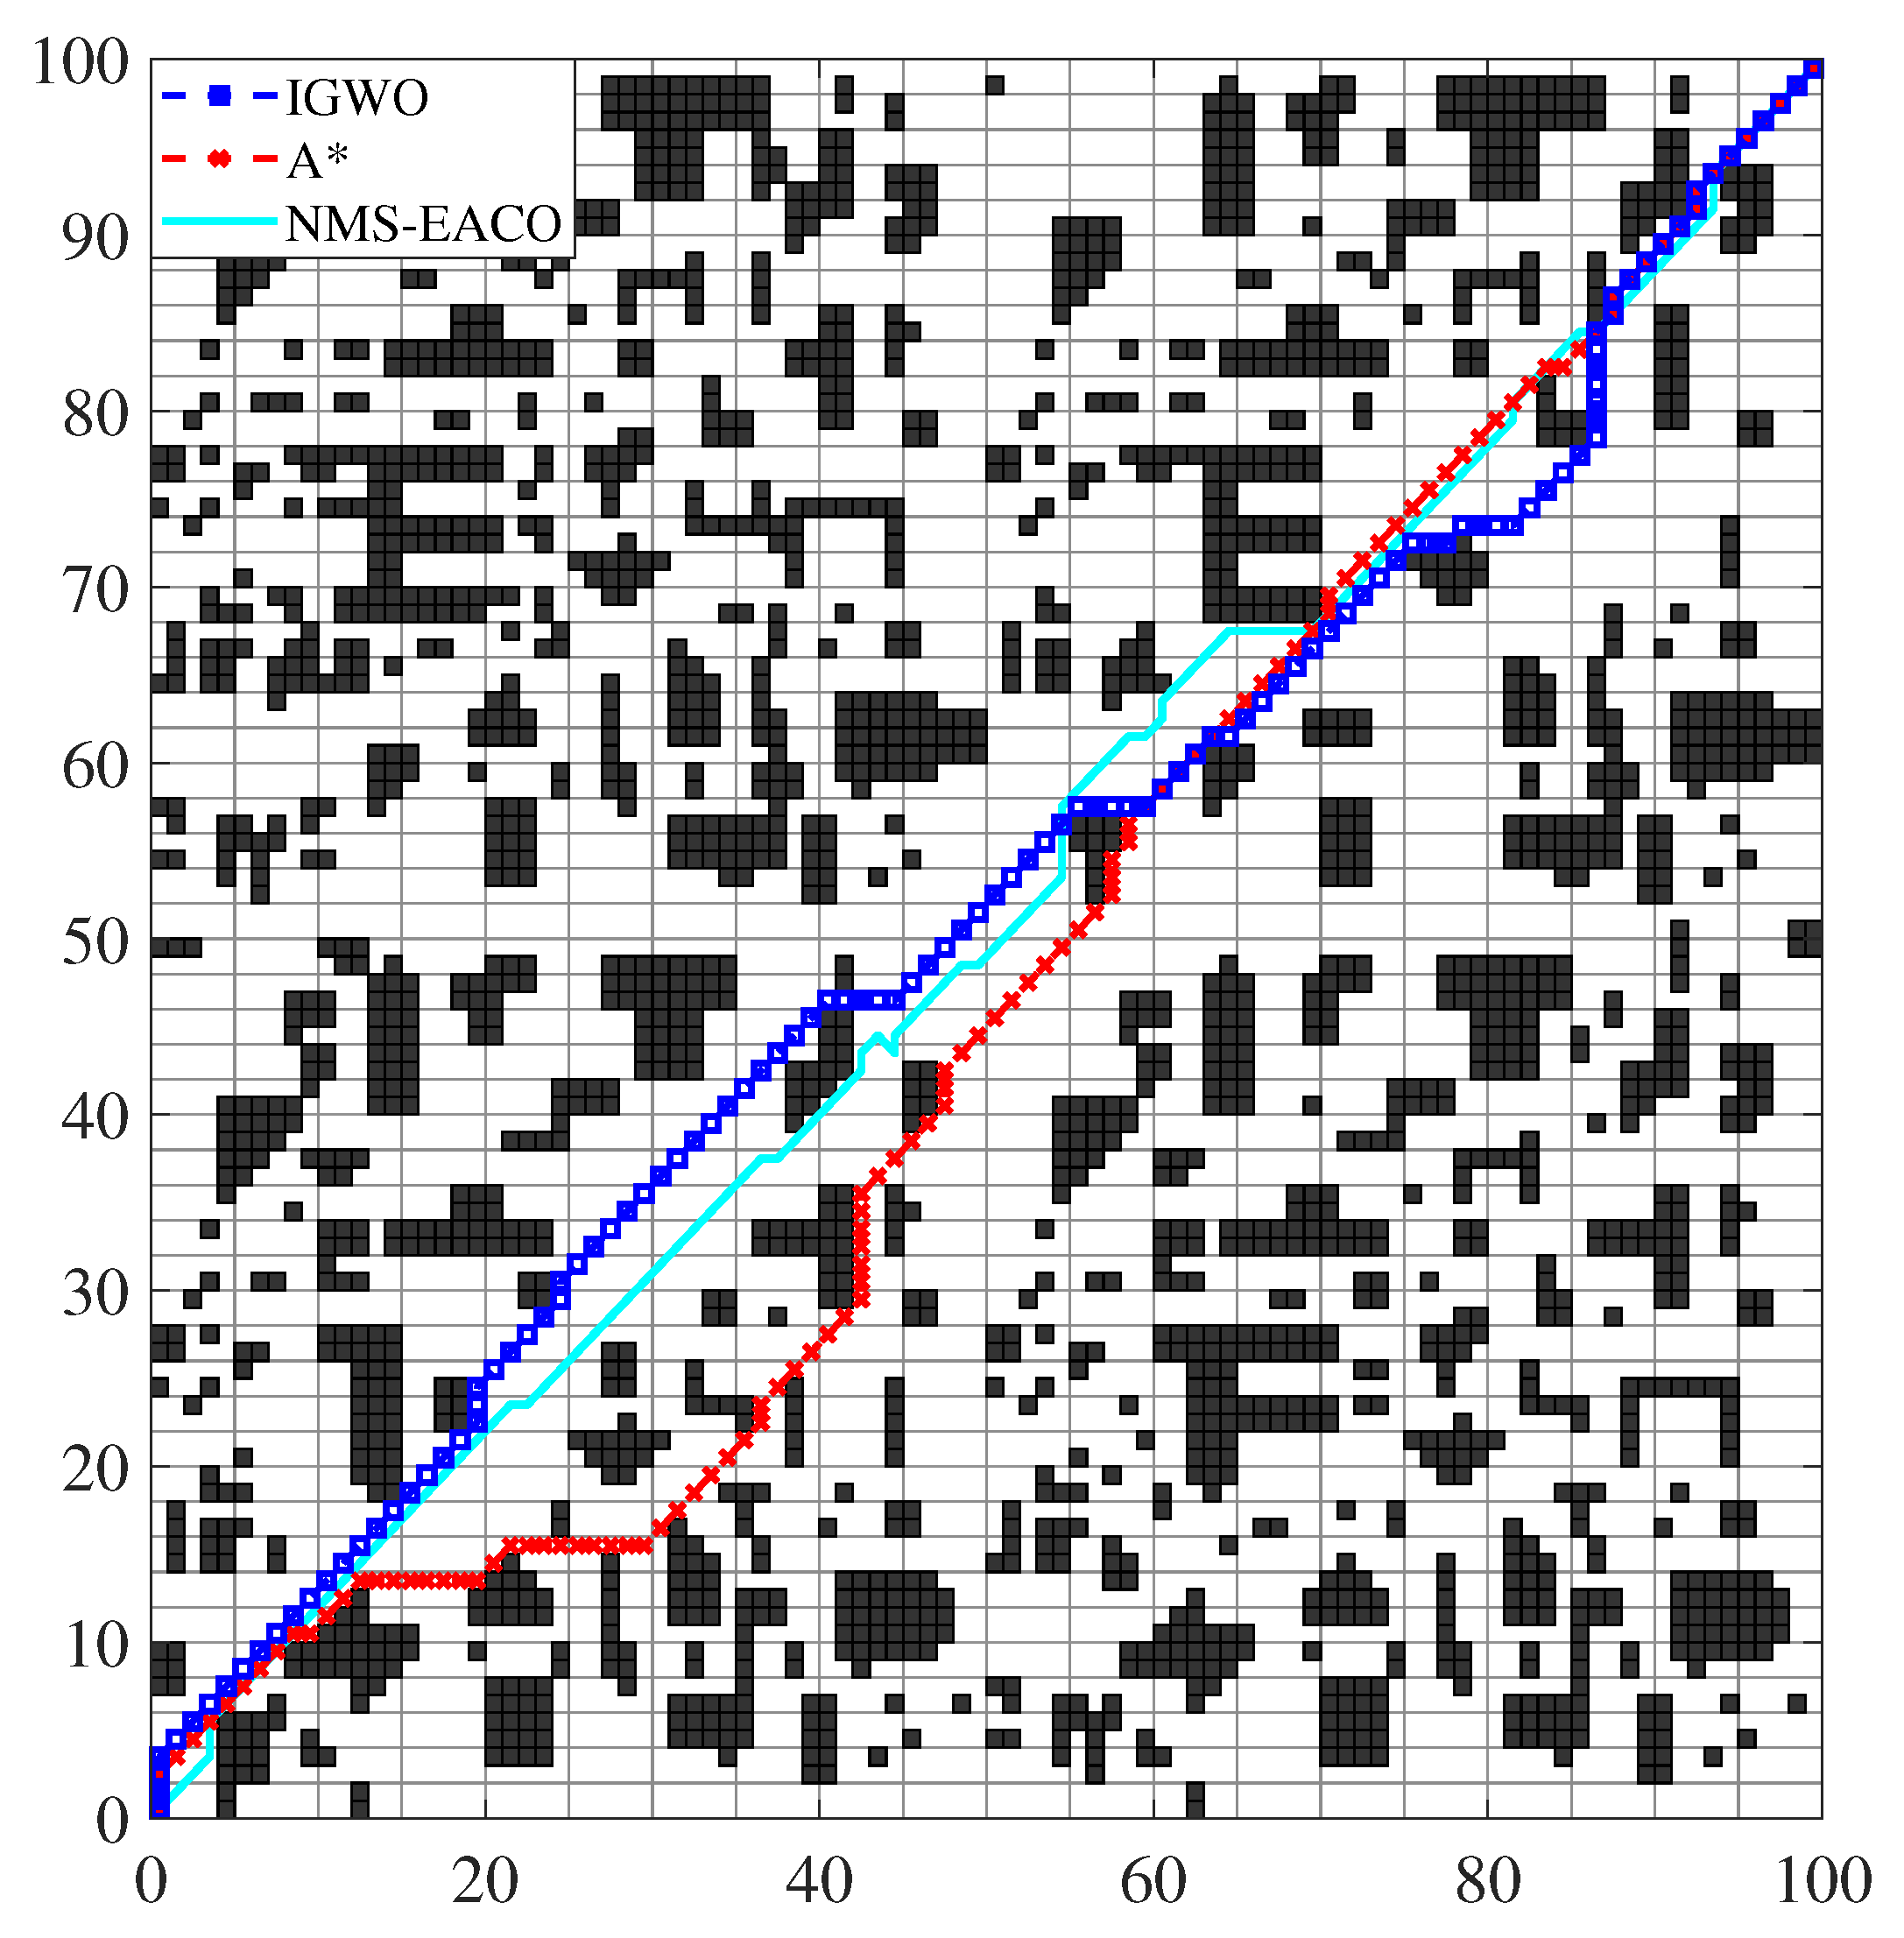
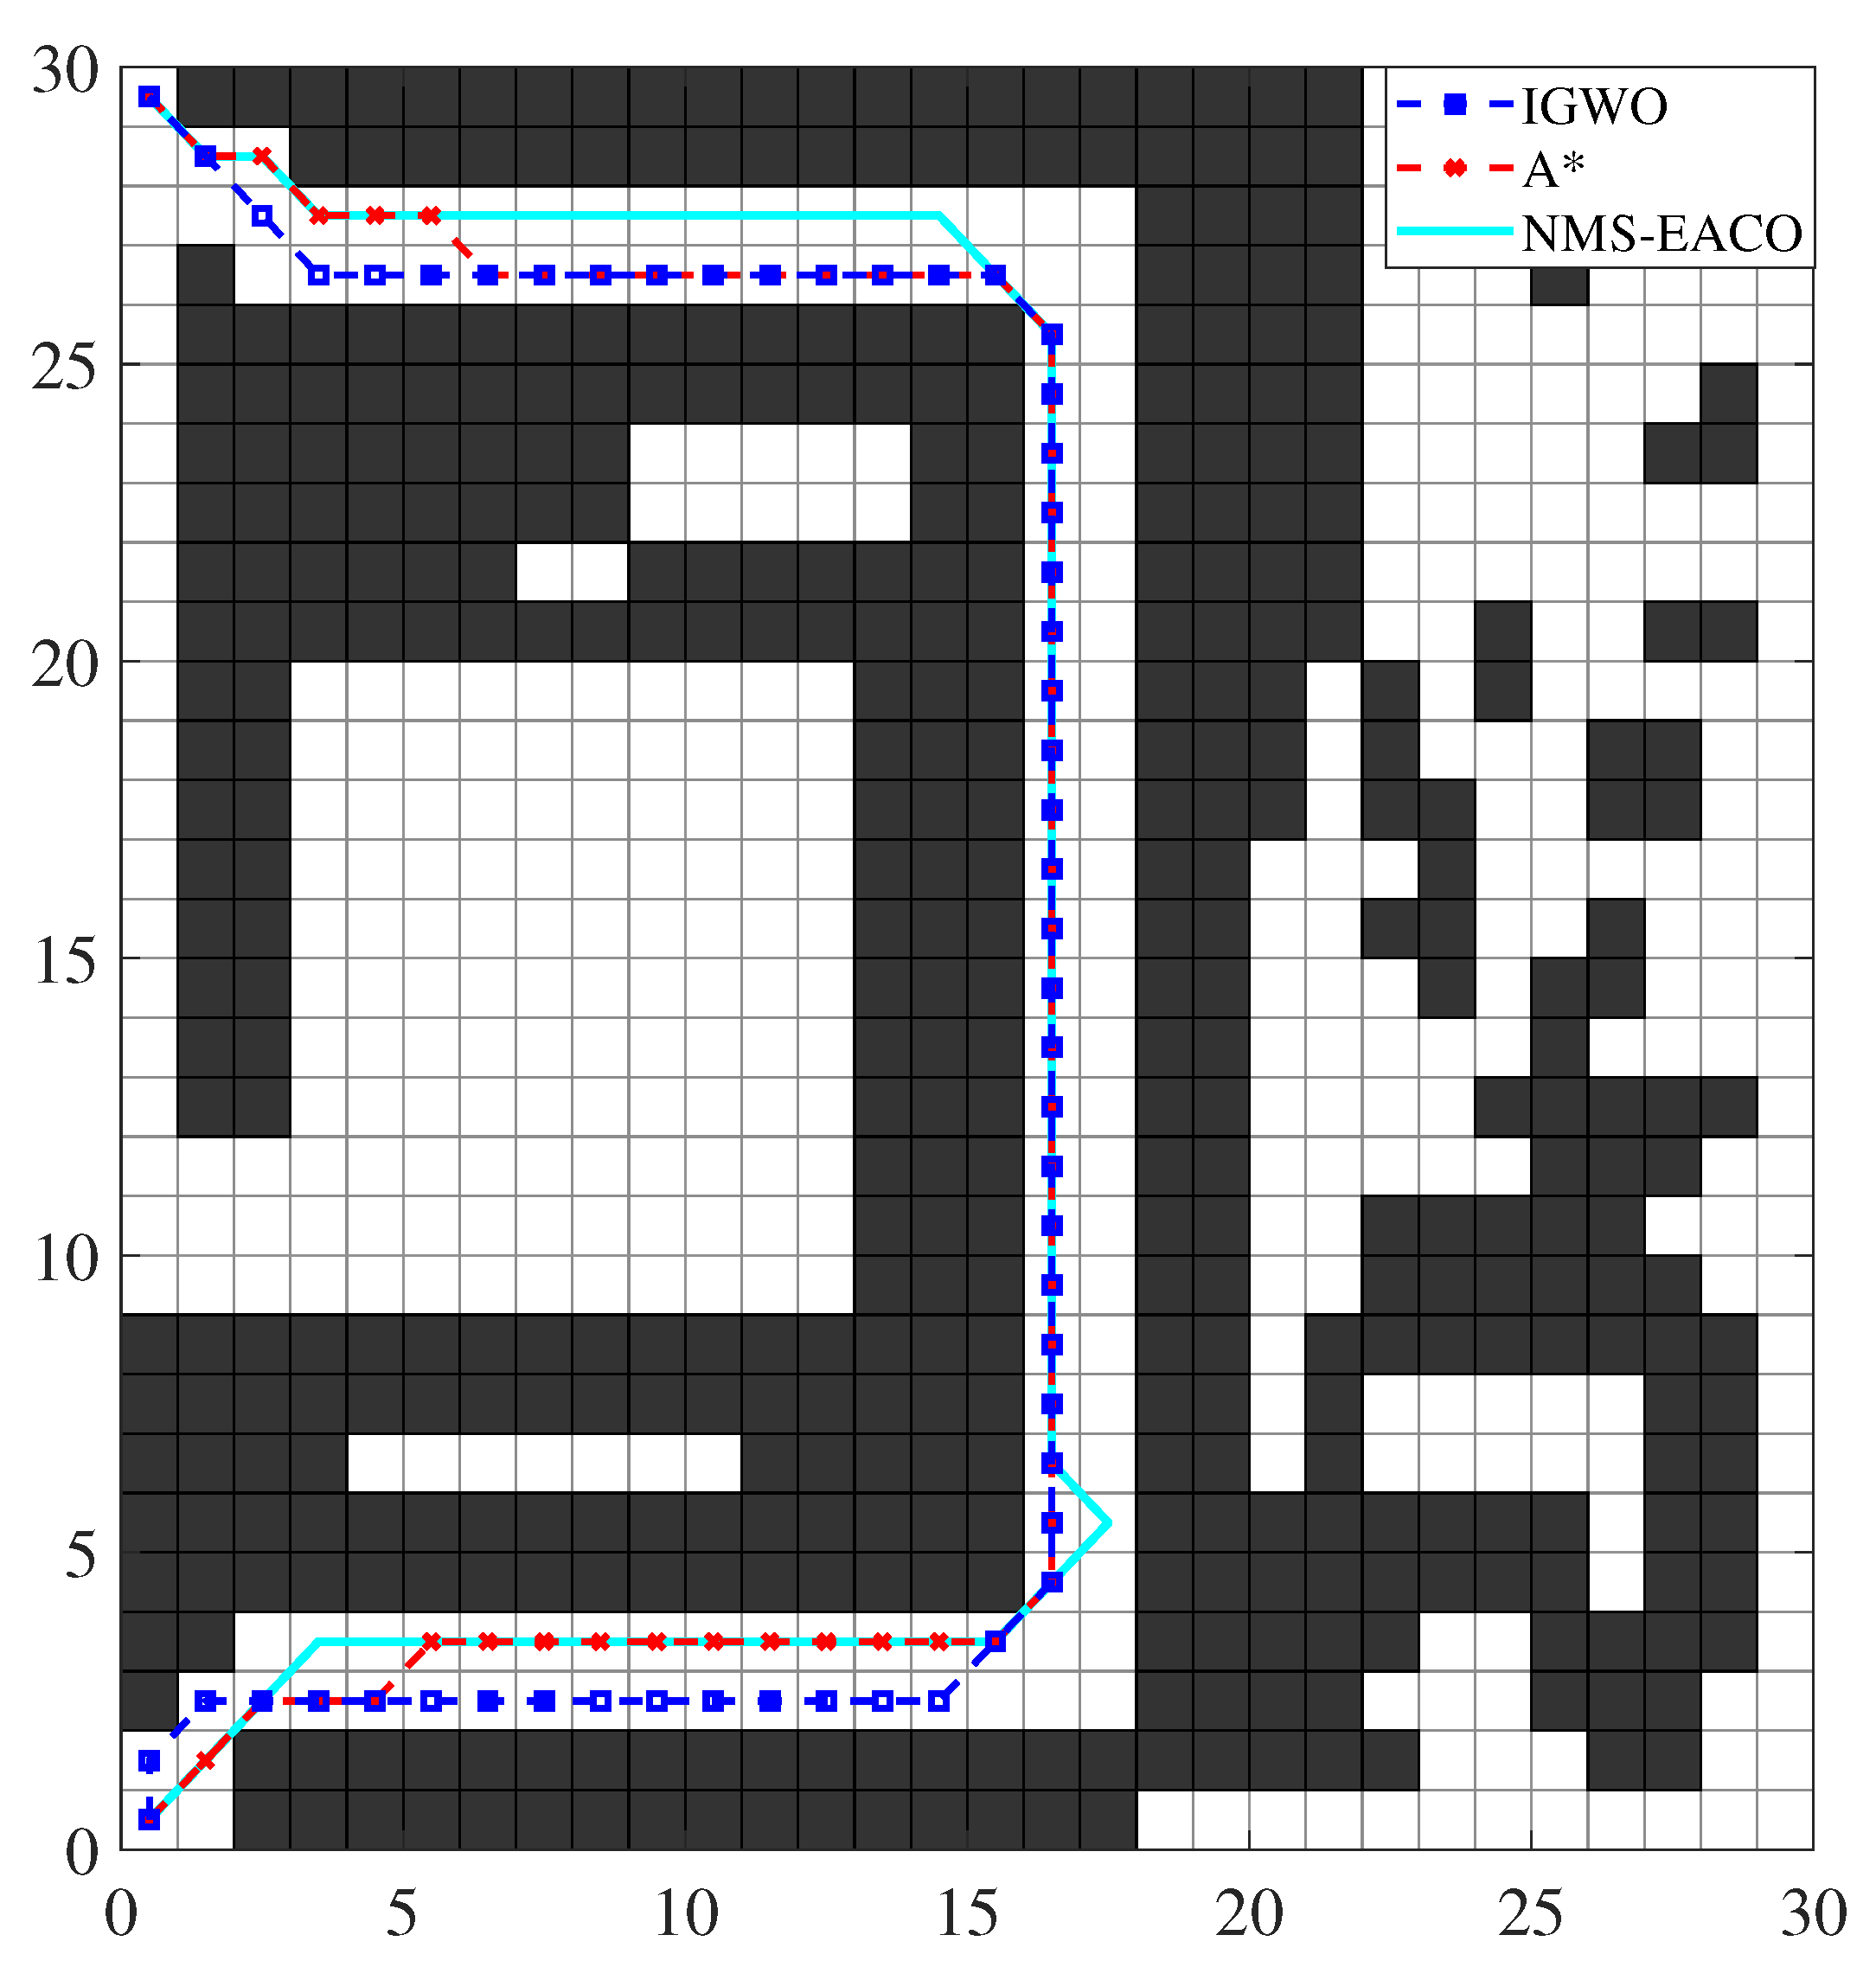
To verify the effectiveness of the NMS-EACO algorithm in path planning in complex environments, this section simulates two typical environments: 100 × 100-sized map, U-shaped map. The IWOT and A* algorithms are used to compare with NMS-ECAO, and each algorithm is run 10 times. The experimental results are shown in
Figure 11,
Figure 12 and
Table 11,
Table 12.
4.5.1. Simulation Experiments of Three Algorithms in Large Map
Figure 11 shows that all three algorithms completed the path planning task, and their optimal paths are similar. Analyzing
Table 11, we can see that in terms of optimal path, the length of the three algorithms is similar, and NMS-ECAO (147.86) is shorter than IGWO (148.21) and A* (149.97) algorithms. In terms of the number of turns, NMS-ECAO (20.38) is less than IGWO (22.13) and A* (25) algorithms; however, in terms of runtime, the A* (4.38) algorithm is the shortest, followed by IWGO (62.34), and NMS-EACO (232.41) takes the longest.
4.5.2. Simulation Experiments of Three Algorithms in a U-Shaped Map
Figure 12 shows that all three algorithms achieve optimal path planning, and their optimal paths are similar. Furthermore, it can be seen that the path planned by the A* algorithm has too many turns in this map, while the path planned by the NMS-EACO algorithm has a single bump.
Analyzing
Table 12, in terms of optimal path, the lengths of the three algorithms are similar; in terms of the number of turns, NMS-ECAO (7.02) and IGWO (7.46) are close, which is less than the A* (12) algorithm; in terms of running time, A* (0.15) is the shortest, followed by NMS-ECAO (1.27), and IGWO (4.82) is the longest.
In summary, whether on regular maps or complex maps, NMS-ECAO outperforms IGWO and A* algorithms in terms of optimal path length and number of turns; however, in terms of running time, it is not as fast as the A* algorithm, and further improvements are needed.
4.6. Simulation Experiments of NMS-EACO in a Dynamic Environment
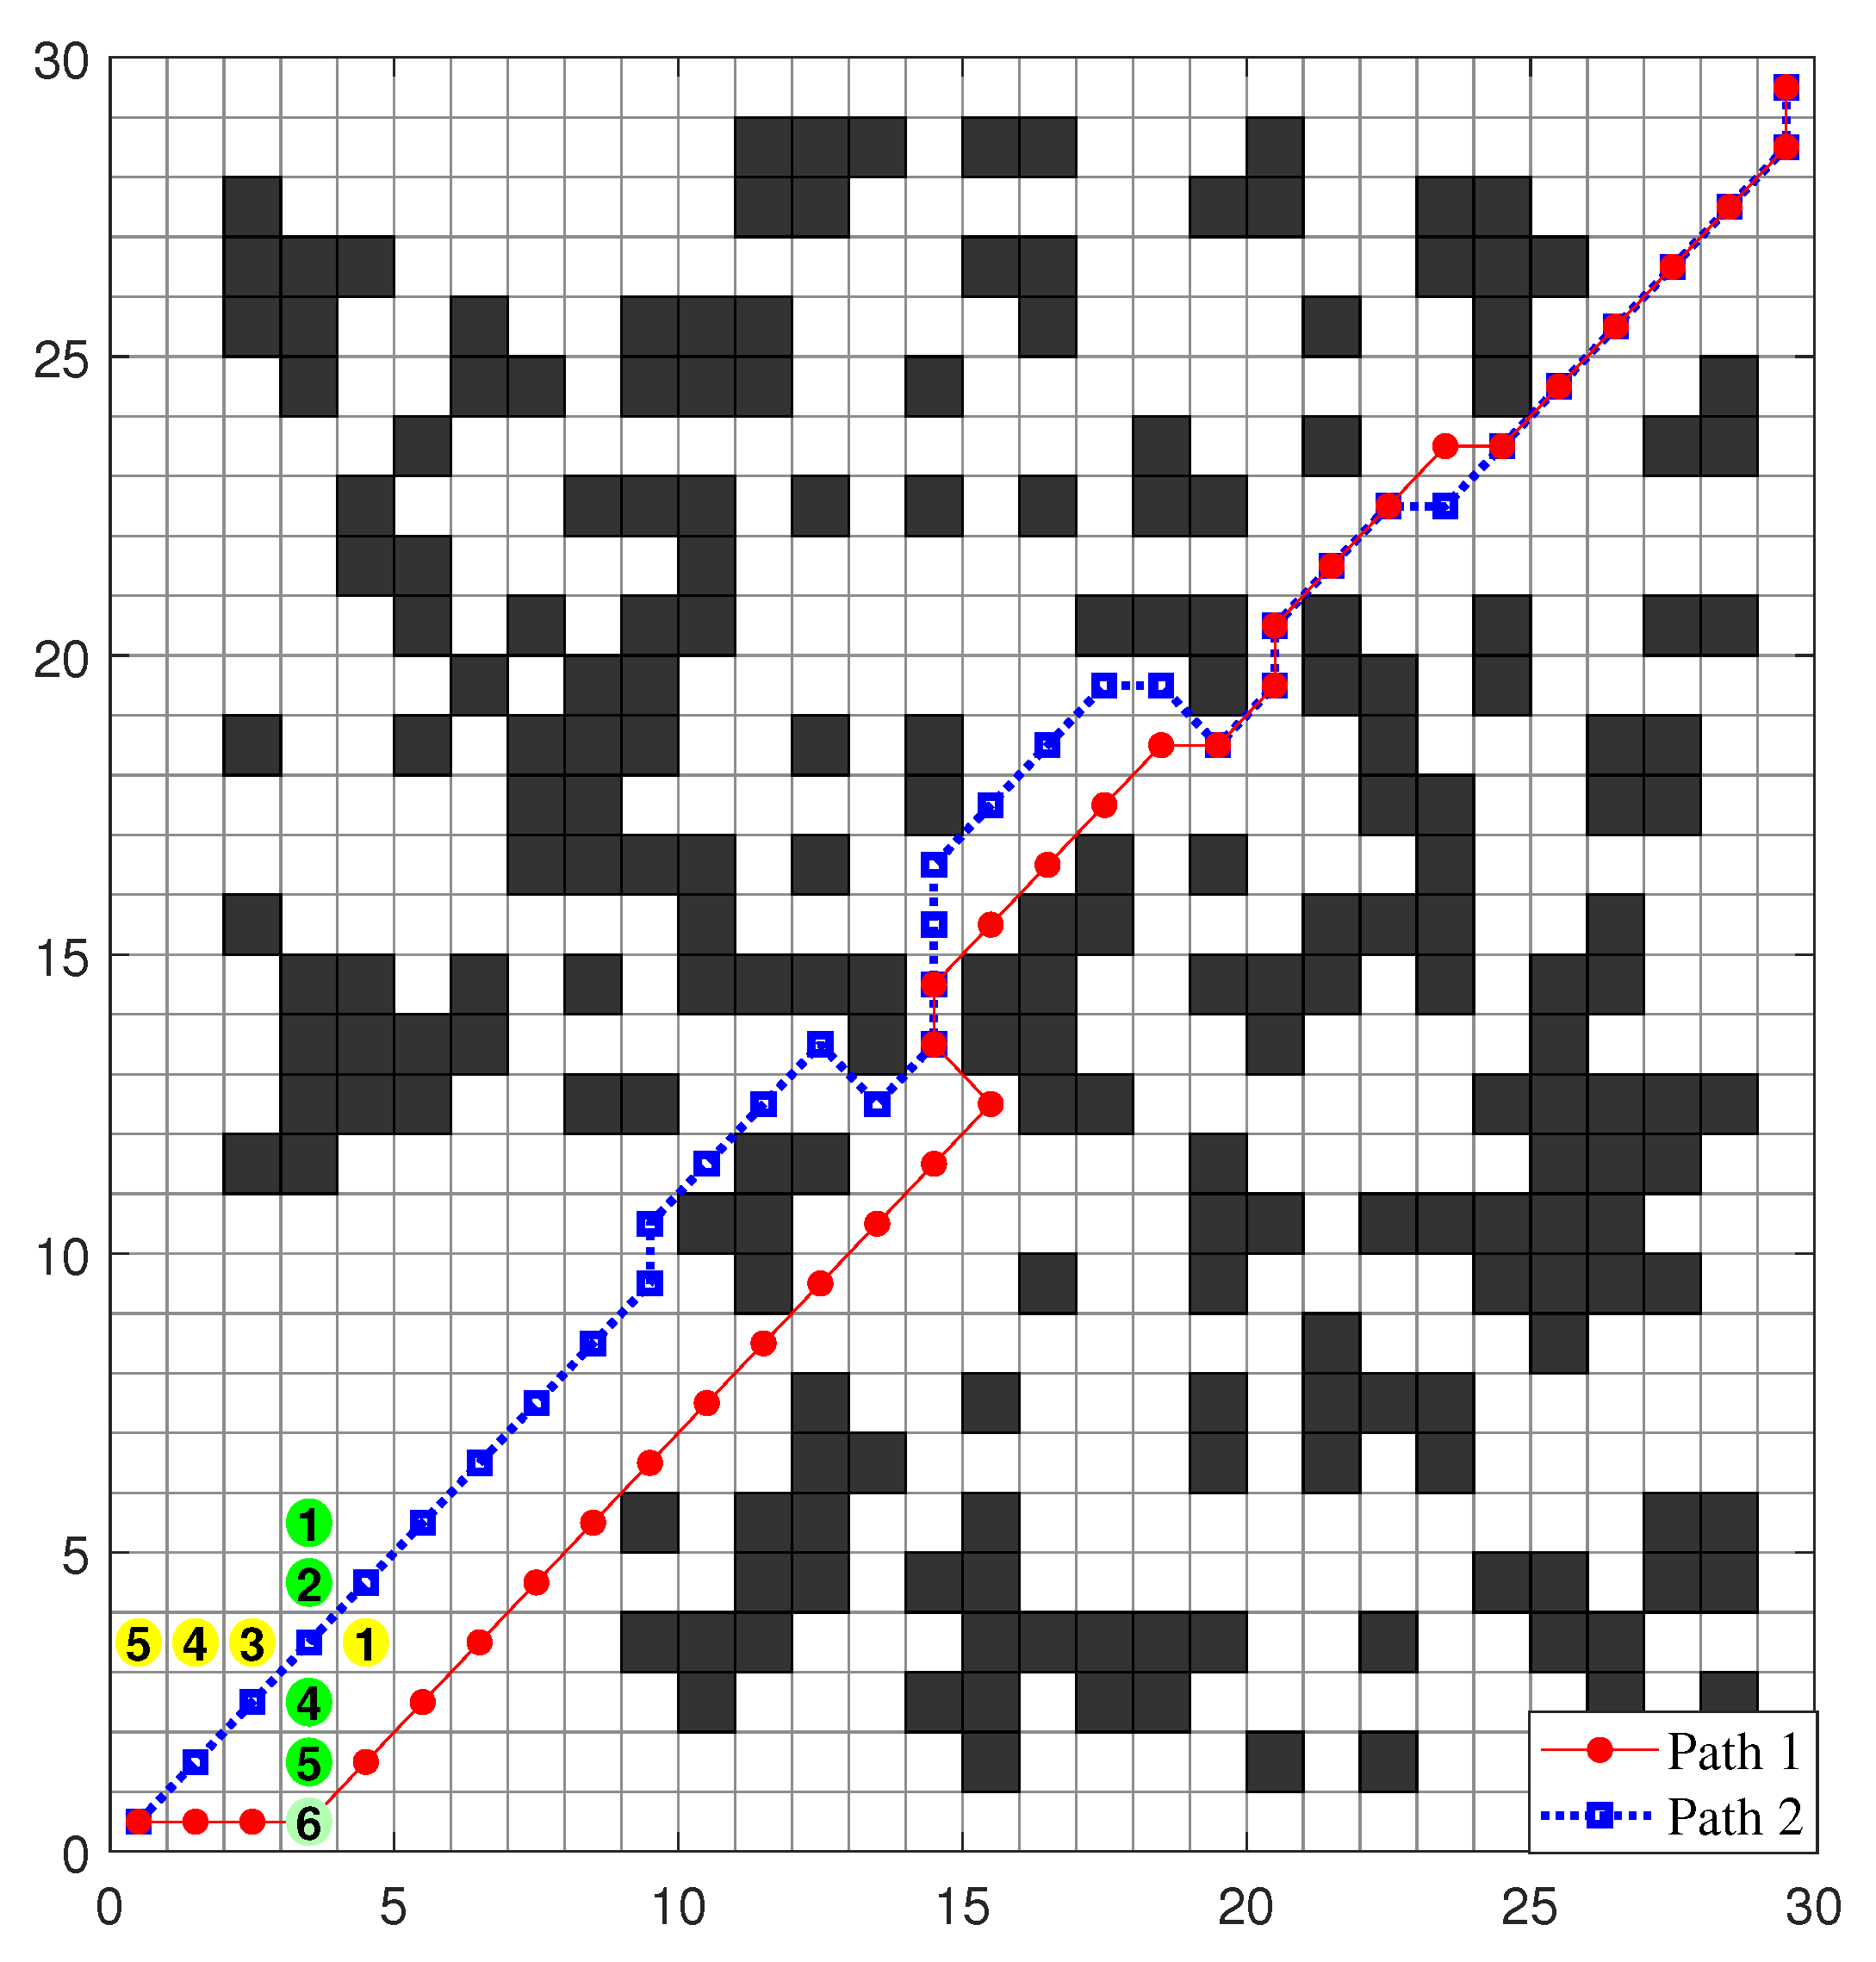
To verify the dynamic adaptability of NMS-EACO, this section designed a dynamic experiment map. As shown in
Figure 13, two dynamic obstacles are placed on the map, represented by yellow and green circles. The mobile robot moves from the lower left corner of the map to the upper right corner. The yellow obstacle starts at position 1 and moves leftward, while the green obstacle starts at position 1 and moves downward. The mobile robot and the two obstacles start moving simultaneously, and each movement of the mobile robot and the obstacle consumes one unit of time.
As shown in
Figure 13, path 2 is the path planned by the mobile robot in a map without obstacles, while path 1 is the path planned in a dynamic map. It can be seen that the moving obstacle changes the path planned by NMS-ECAO. Furthermore, after the green obstacle reaches the fifth step, NMS-ECAO chooses to move to the upper right, avoiding a collision and shortening the path, demonstrating the dynamic adaptability of the algorithm in this paper.

