Article

An Energy-Saving Clustering Algorithm for Wireless Sensor Networks Based on Multi-Objective Walrus Optimization

School of Artificial Intelligence and Software Engineering, Nanyang Normal University, Nanyang 473061, China
*
Author to whom correspondence should be addressed.
Electronics 2025, 14(17), 3421; https://doi.org/10.3390/electronics14173421
Submission received: 6 August 2025 / Revised: 24 August 2025 / Accepted: 25 August 2025 / Published: 27 August 2025

Abstract

Wireless sensors serve as a critical means of information perception and collection, profoundly influencing human life and production. In order to optimize the problem of excessive energy drain caused by the selection of cluster heads and the transmission of paths in the network, this study proposes an energy-efficient clustering–routing algorithm that combines K-means++ initialization with the multi-objective Chaotic Mapping Walrus Optimization Algorithm (CM-WaOA). The CM-WaOA employs chaotic mapping and Pareto front optimization to balance node residual energy, cluster-head-to-base-station distance, inter-cluster-head distance, and intra-cluster node count variance when selecting cluster heads. Subsequently, the Sparrow Search Algorithm (SSA) refines routing paths through adaptive population sizing and elite retention, thereby reducing transmission path loss. The simulation results over 1000 rounds demonstrate that the CM-WaOA surpasses LEACH, EEUC, CGWOA, and EBPT-CRA in terms of energy drain, node survival, and latency; it achieves the highest average residual energy, the fewest dead nodes, the most surviving nodes, and the shortest network delay. These findings confirm that the CM-WaOA can still maintain good energy utilization and low-latency characteristics under different sensor densities, effectively extending the network lifetime.

1. Introduction

With the rapid development of technologies such as the Internet of Things (IoT), smart cities, and environmental monitoring, wireless sensor networks (WSN), as the core technology for information collection and transmission, have played a significant role in various fields. In the Internet of Things and drone swarm networks, energy consumption and communication efficiency are key issues affecting the network [1]. WSN consist of numerous sensor nodes that work together; their main function is to monitor the information of the target area and transmit the information to the base station [2]. It can deploy humans via unmanned aircraft to areas that are inaccessible to regular vehicles [3,4]. During the process of data collection and transmission, sensors are prone to external interference [5]. Some researchers employ heuristic algorithms to address the security issues of wireless sensors [6]. The energy of the sensor nodes is fixed. The research focuses on using clustering methods to extend the lifespan of the network [7]. Selecting cluster heads by clustering nodes provides an effective method to prolong the lifetime of wireless sensor networks [8]. Cluster head selection algorithms generally employ three key technologies.
The first method involves using the traditional threshold protocol to select the cluster head. W.R. Heinzelman proposed the LEACH protocol, which selects cluster heads based on a certain threshold. Then, nodes choose the cluster heads to conduct data transmission, thereby avoiding excessive energy drain and prolonging the network’s lifespan [9]. S. Madhvi improved the LEACH protocol, thereby obtaining the CHME-LEACH algorithm and the CHP-LEACH algorithm, which reduced energy drain and extended the network’s lifespan [10]. J. Suman proposed MAX LEACH, which can sense energy and reduce the energy drain of nodes, thereby extending the network’s lifespan [11]. These researchers aggregated data to reduce the energy drain of the nodes, thereby extending the network’s usage time.
Second, the application of swarm intelligence algorithm technology in the selection of cluster heads in wireless sensor networks can effectively improve energy utilization efficiency. As a result, G. Gülbaş and colleagues introduced the LEACH-SA algorithm, incorporating the simulated annealing technique to optimize cluster head selection and extend the network’s lifetime [12]. R. Mishra and others used the Butterfly Optimization Algorithm to select the optimal number of cluster heads in dense networks, while the Ant Colony Optimization Algorithm was employed to determine the next-hop node during data transmission [13]. Muntather et al. combined the chaotic algorithm with the grey wolf optimization algorithm and proposed the CGWOA, which reduces the distance of the data transmission to enhance energy utilization [14]. The introduction of intelligent algorithms allows for more efficient cluster head selection, optimizing energy drains and enhancing the operational time of the network.
Third, non-uniform clustering algorithm technology has been applied to cluster head selection in heterogeneous networks. C. Li proposed the EEUC protocol, which addresses the issue of excessive disparity in the remaining energy of nodes by employing clusters of different sizes [15]. V. Akshay and others introduced the ECSSEEC protocol, which is based on enhanced cost and sub-era principles. In the ECSSEEC protocol, the optimal number of clusters is selected by modeling the cost function, and the previously selected cluster heads are rotated again as normal sensing nodes in the future rounds of the sub-cycle [16]. B. Fan proposed an Energy-Balancing Path Tree-Based Clustering and Routing Algorithm (EBPT-CRA) for wireless sensor networks (WSN), aiming to address the energy-saving and balance issues in large-scale WSN [17].
These researchers applied different optimization algorithms to the selection of sensor nodes, aiming to optimize the energy utilization of the nodes and thereby extend the lifespan of the network. Table 1 presents a comparison of various algorithms.
The algorithm proposed by the aforementioned researchers has indeed improved energy efficiency and extended the network’s lifespan. However, there is still no reasonable approach to the selection of cluster heads and the transmission of data. This study introduces the Chaotic Mapping Walrus Optimization Algorithm (CM-WaOA) to reduce energy drain, enhance clustering efficiency, and prolong the network’s lifespan. Recent studies have integrated chaotic mapping to enhance exploration [18]. First, the Chaotic Mapping Algorithm’s randomness and ergodicity are utilized to search for the global optimal solution. The core of the Chaotic Mapping Algorithm is the chaotic mapping, which is a discrete nonlinear dynamic system that can generate seemingly random state changes. The Chaotic Mapping Algorithm can effectively search in the solution space to find the optimal solution or near-optimal solution to the problem. Second, by utilizing the Walrus Optimization Algorithm, the balance between local and global optimization is effectively achieved. This allows for the identification of optimal or near-optimal solutions, enabling the selection of the most suitable nodes as cluster heads. Finally, by comparing the Euclidean distance from nodes to the base station with that of the cluster head, as well as the energy of the cluster head itself, ordinary nodes select their corresponding cluster head for clustering. If a node’s distance to the base station is shorter than the cluster head’s, it transmits data directly to the base station. During the data transmission process, we will adopt the Sparrow Search Algorithm (SSA) for route selection, which imitates the foraging and alert behavior of sparrows to optimize path efficiency. The SSA will optimize the route path by selecting the next-hop node to maximize the utilization rate of energy and reduce the delay caused by distance, while ensuring that the path can reach the base station or cluster head. The hybrid optimization method is used to combine K-means++, the Walrus Optimization Algorithm (WaOA), and the Sparrow Search Algorithm (SSA) for cluster head selection and multi-hop path optimization in WSN. The significance of this method lies in dynamically selecting energy-rich and location-optimized cluster heads and optimizing multi-hop routes, significantly reducing node energy drain, delaying the node death time, and improving the overall network lifespan.

2. System Model

2.1. Sensor Network Structure Model

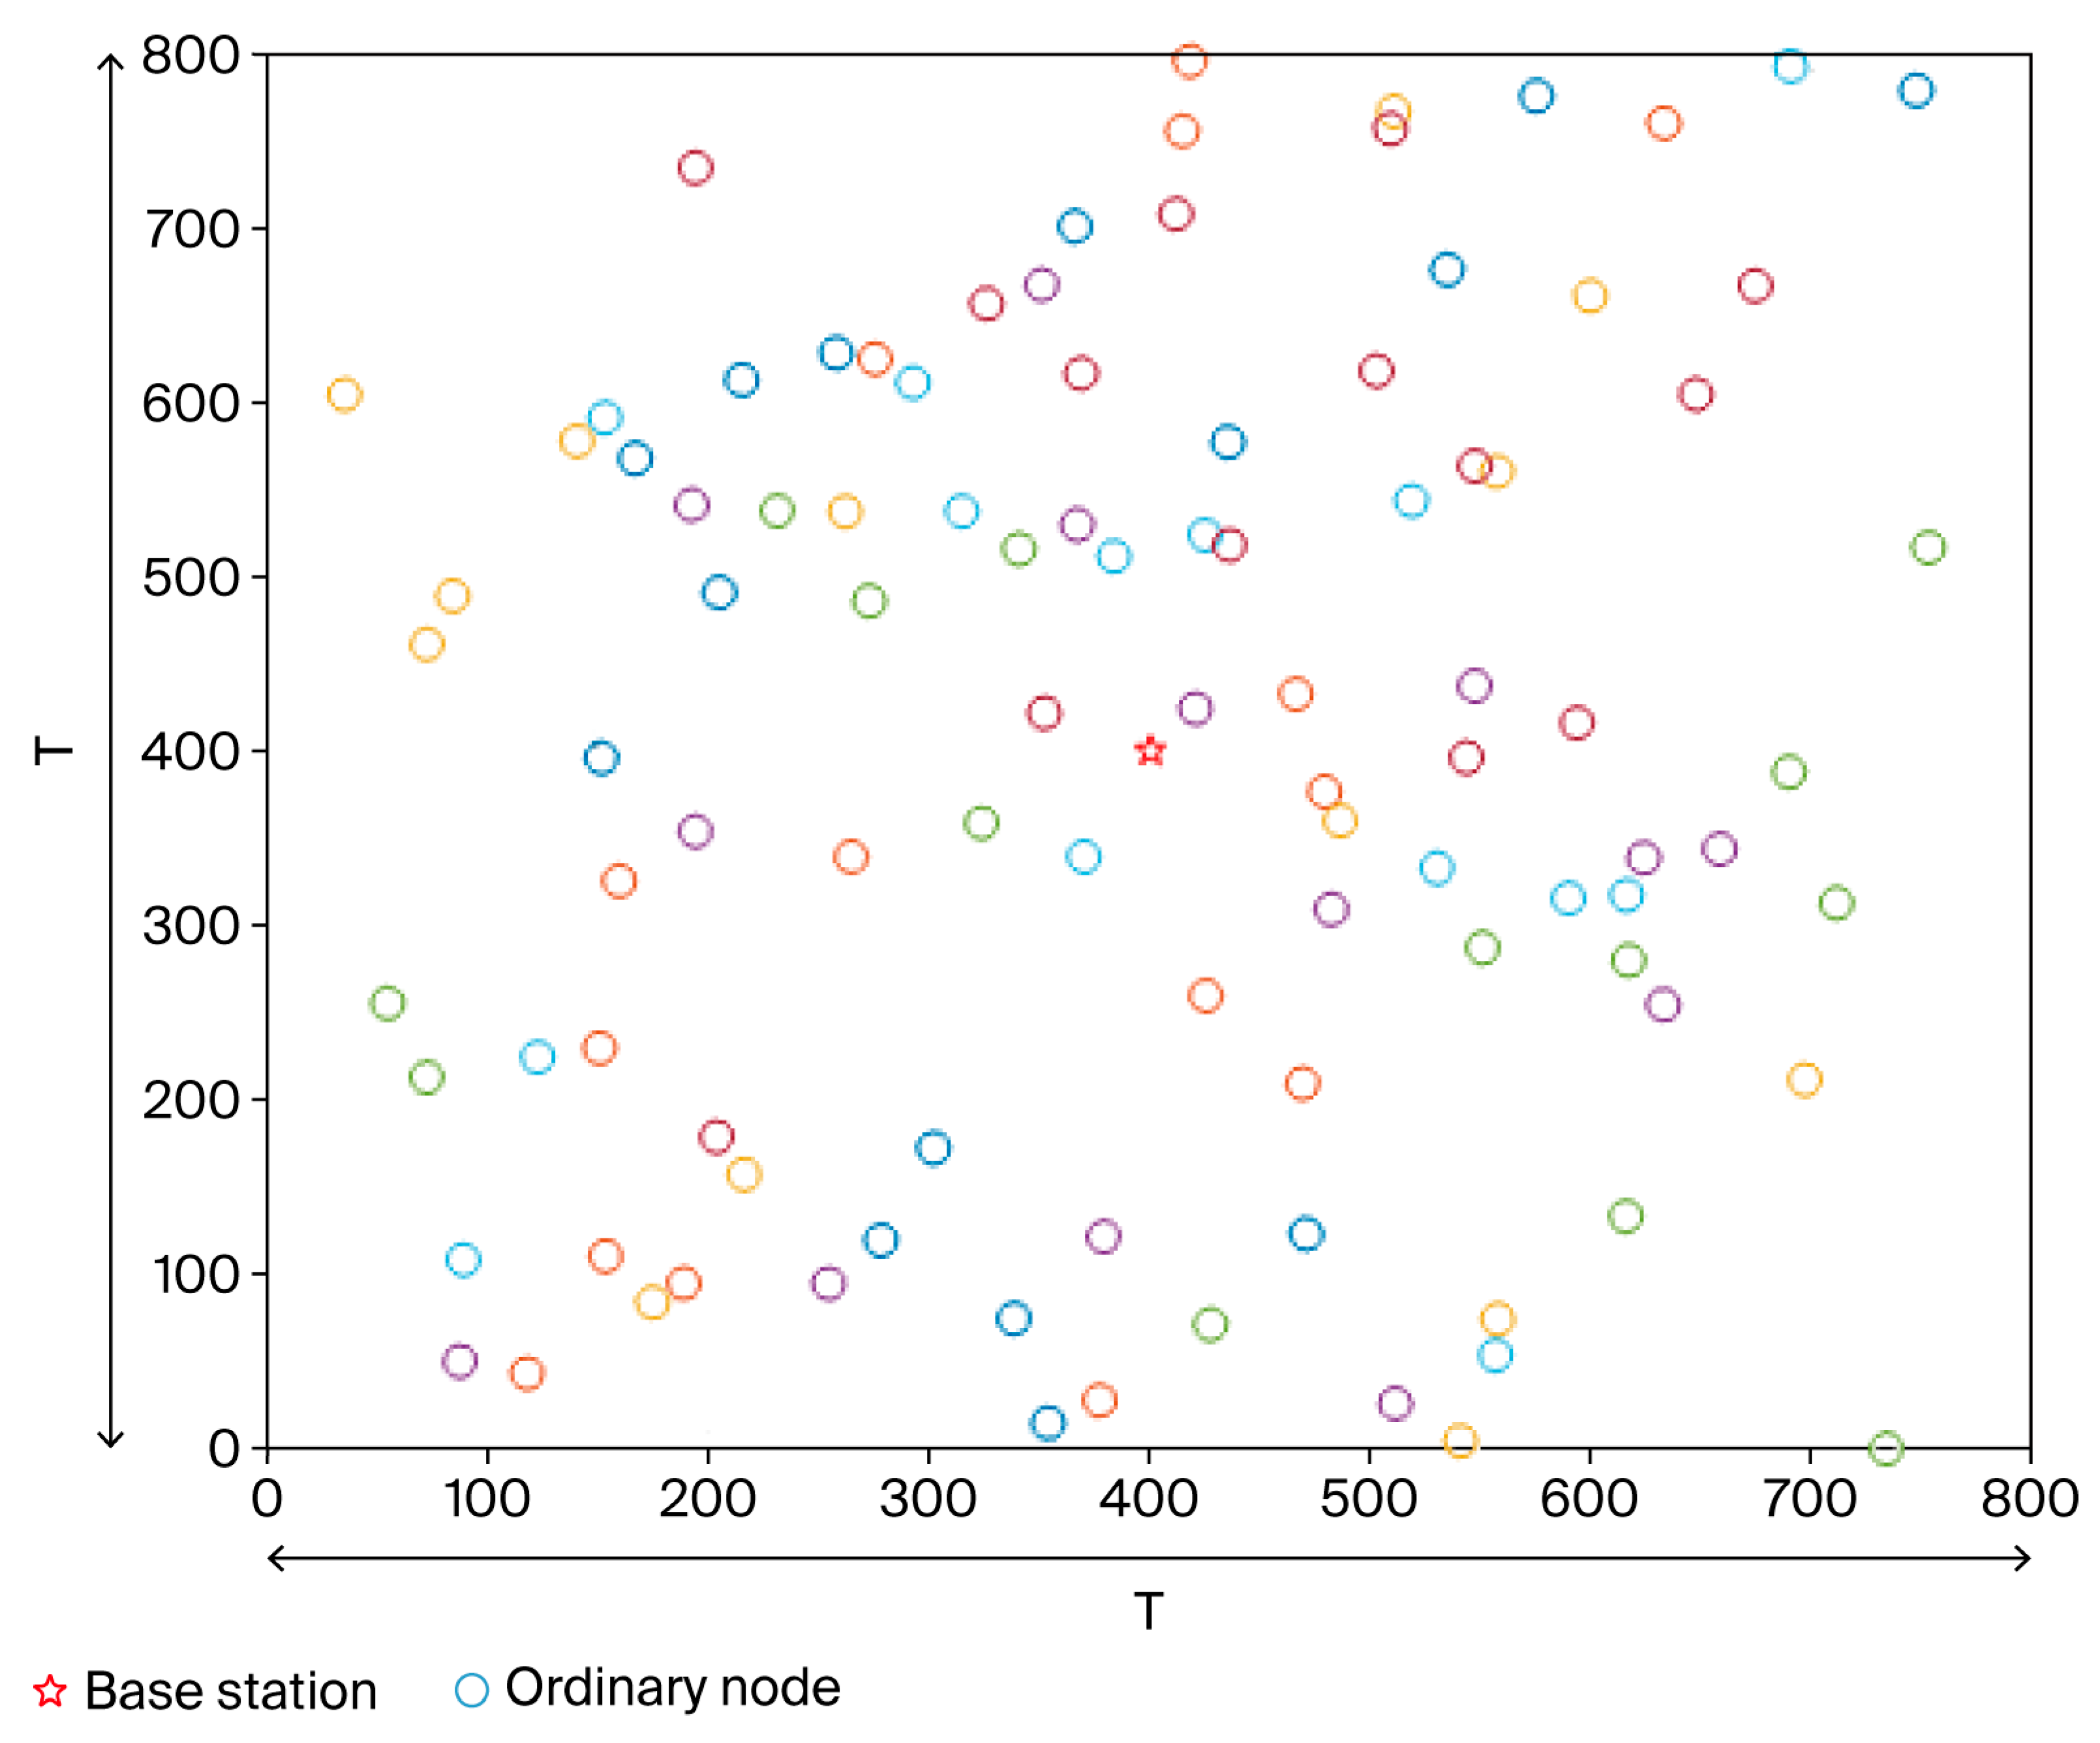
The topology structure of the wireless sensor network (WSN) in this article is shown in Figure 1. Figure 2 illustrates the corresponding network simulation scenario, where N sensors of the same type are randomly distributed within a T × T range. Each circle represents a sensor, and the five-pointed star in the center represents the base station. The color of the circles in Figure 2 carries no significance. Wireless sensor networks are extensively utilized in industrial applications of the Internet of Things to precisely process node information and ensure continuous and stable data transmission between the base station and the nodes [19,20]. Nodes can independently select appropriate transmission power levels based on the energy drain model. To mitigate the impact of adverse weather conditions and external factors such as human activities, network nodes must meet certain requirements, and the following statements must be true:
  • N sensors are randomly deployed within a T × T area, and their positions remain fixed after deployment.
  • Each sensor has a unique and distinct ID.
  • It is assumed that there is no signal interference within the coverage area of the base station, and the energy supply of the base station can be used indefinitely.
  • The power for each sensor node to send and receive data can be controlled.
  • All sensor nodes share identical characteristics, and their locations relative to the base station remain fixed.
The emergency communication network is mainly divided into three communication modes: First, intra-cluster communication involves data exchange within the same cluster. Since transmission is limited to cluster members, this approach reduces energy drain in wireless sensor networks [21]. Second, during inter-cluster communication, when users belong to different clusters, shared intermediate nodes forward the data to their corresponding cluster heads, which then transmit the messages to the destination cluster head. Third, in the case of communication between nodes in different clusters, data are transmitted hierarchically; ordinary nodes report upward through the cluster hierarchy and ultimately communicate via the base station [22].
Among the three communication processes in the WSN, the third requires data exchange across the entire network. In this mode, the nodes transmit information not only to the base station but also to other nodes, which leads to the premature death of the nodes [23]. Thus, this study investigates the energy drain of this communication mode.

2.2. Energy Drain Model

This study employs the first-order wireless communication energy drain model, which depends on the distance between nodes. This distance can be divided into the short-distance free-space model and the long-distance multipath model [24]. It can be expressed by Equations (1)–(3):
E T x K , L = K E e l e c + K ε f s L 2 , L < D 0 K E e l e c + K ε m p L 4 , L D 0
D 0 = ε f s ε m p ,
E R x K , L = K · E e l e c ,
In Equations (1)–(3), E T x   denotes the energy required to transmit K bits of data, while E R x represents the energy needed to receive the same amount. E e l e c refers to the energy drained per bit for transmission or reception. ε f s and ε m p are the energy loss coefficients for the free-space and multipath fading models, respectively. L indicates the transmission distance.

3. Network Energy Drain Analysis

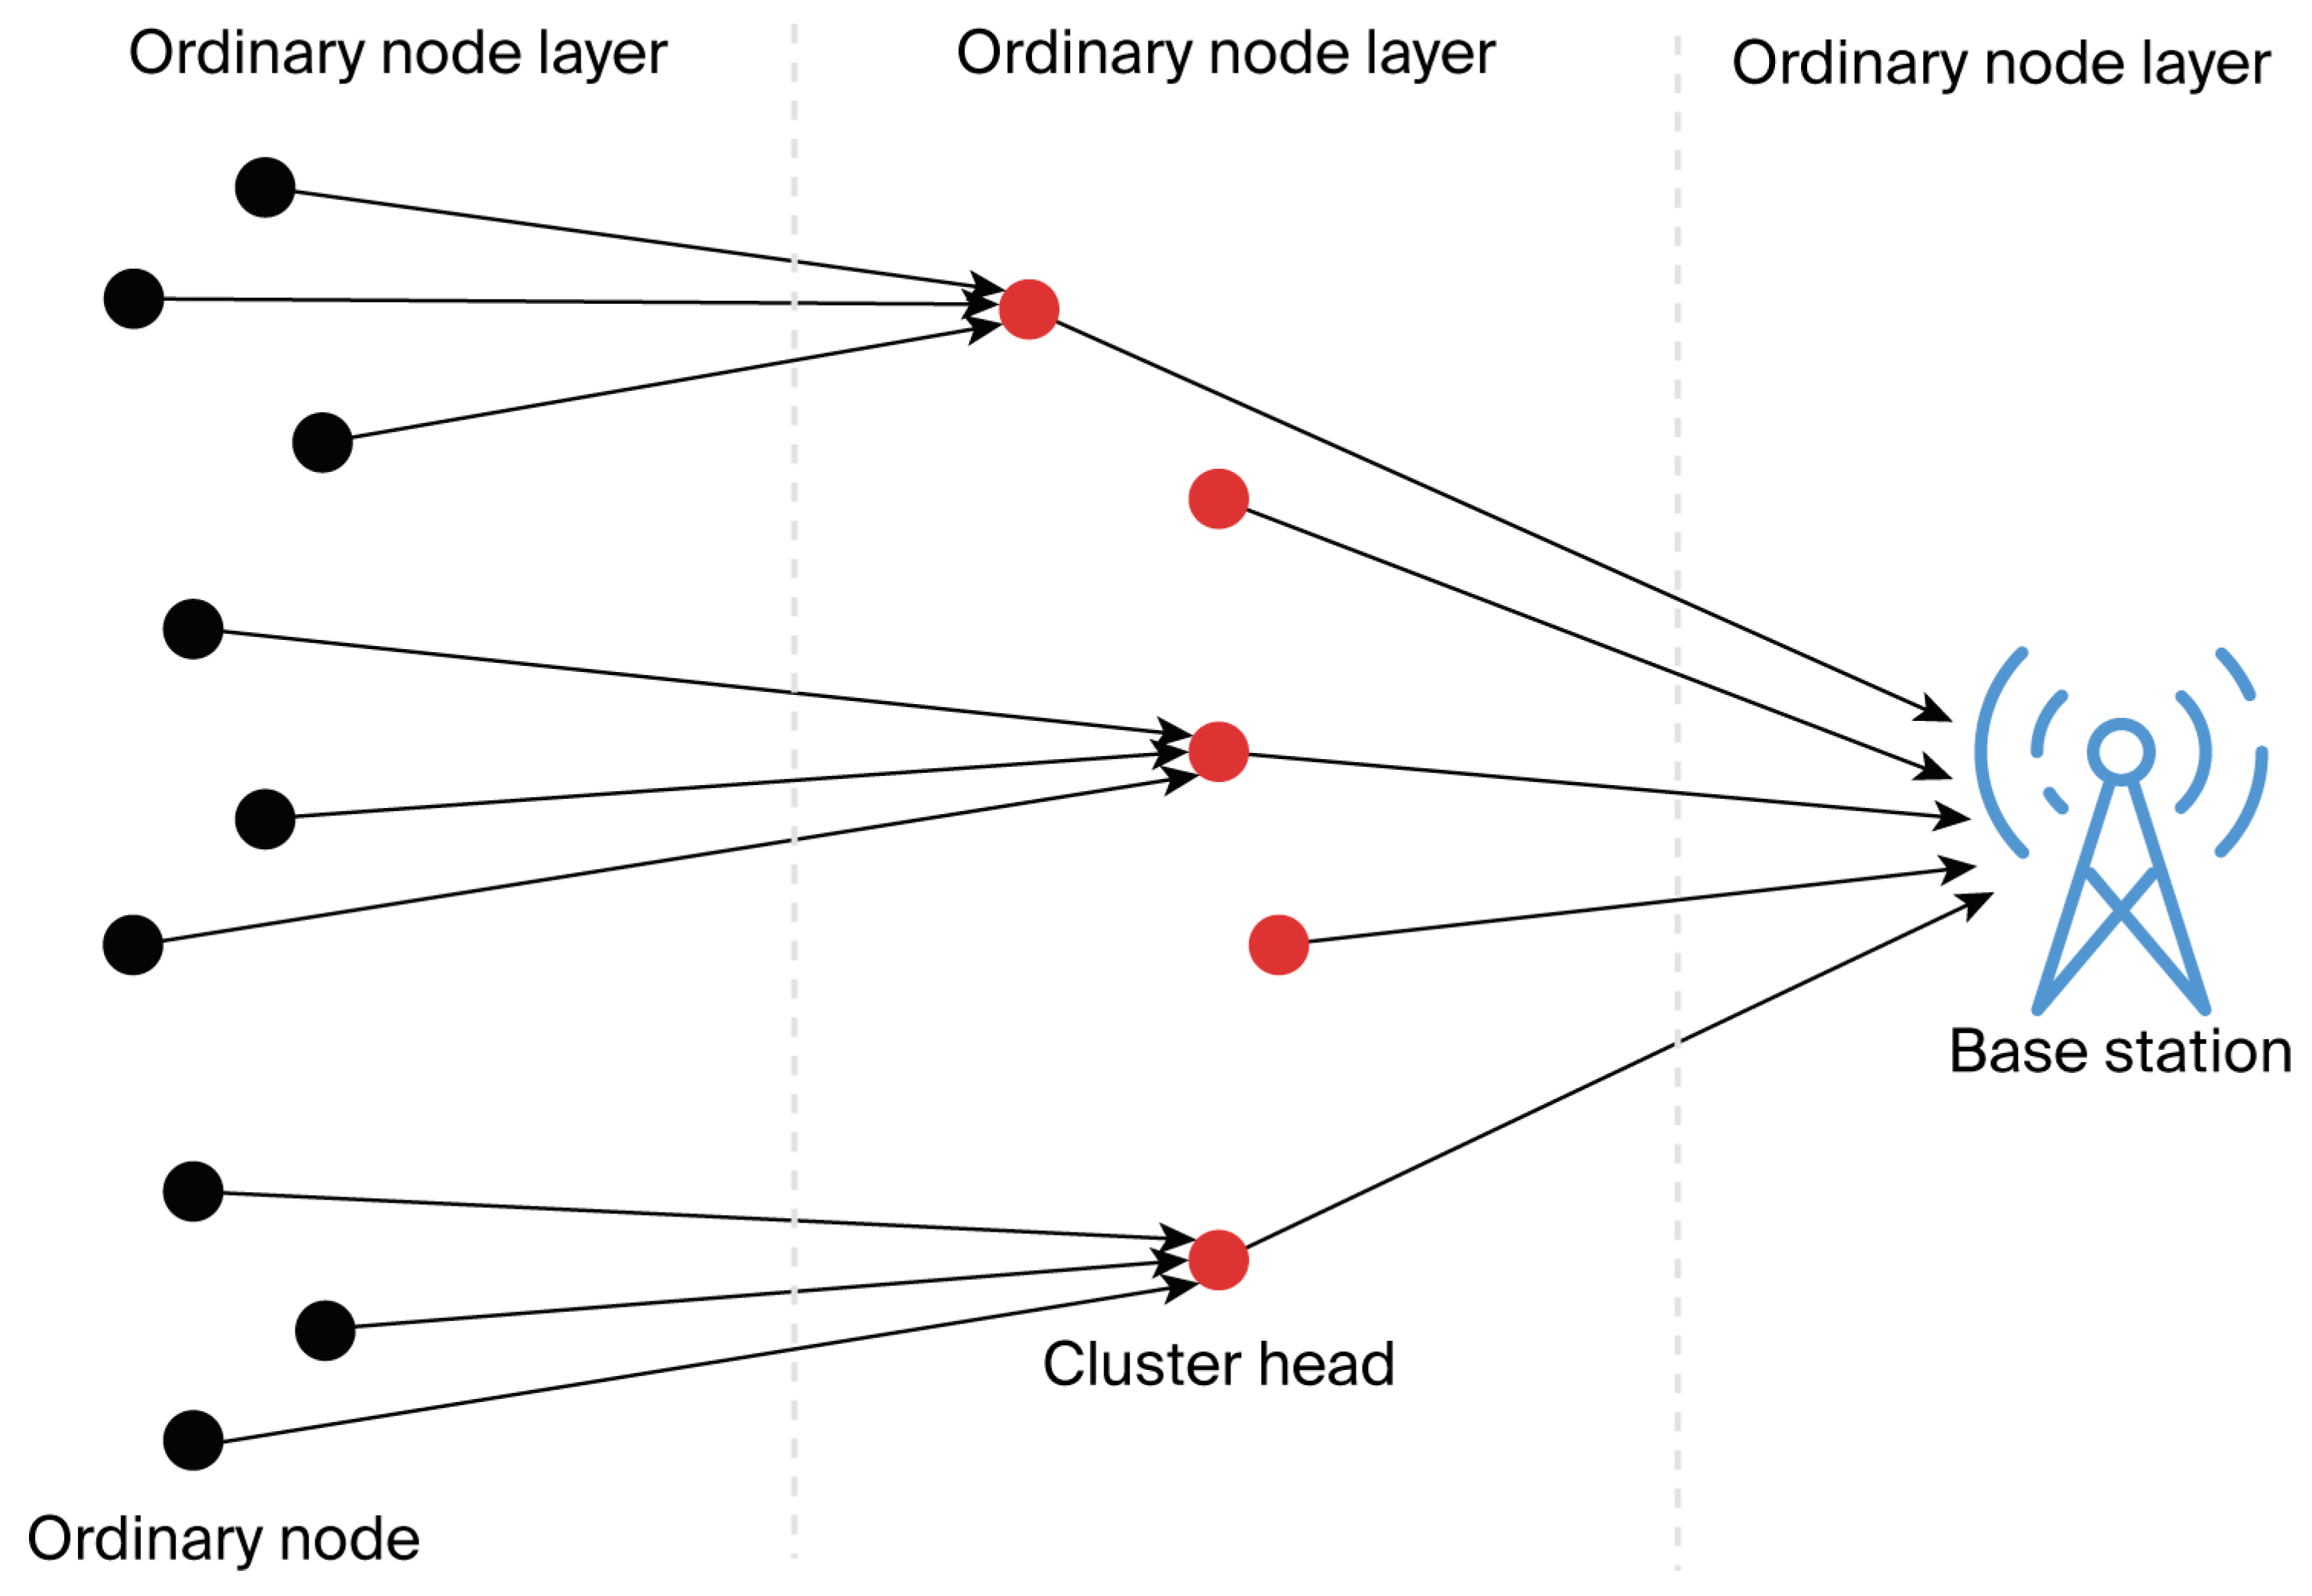
From the perspective of network topology, the WSN is composed of three tiers: sensor nodes, cluster heads, and the base station, as depicted in Figure 3.
Based on Equations (1)–(3) of the energy drain model, it can be determined that distance is the factor that has the greatest impact on the energy of the node. When the distance is greater than D 0 , the node will require more energy when transmitting data. Therefore, selecting optimal cluster heads is crucial, and data transmission paths during the clustering process must also be accounted for. However, member nodes near the base station often suffer from the “hotspot effect”, leading to excessive energy drain and the premature energy depletion of sensors. To reduce energy drain and prolong the network lifetime, multi-hop communication is employed to avoid long-distance transmissions. Therefore, to prolong the network lifetime, the following three key issues need to be addressed:
  • Selection of the appropriate cluster heads for data collection and aggregation.
  • Mitigation of the hotspot effect to prevent the premature death of nodes near the base station.
  • Choice of suitable nodes to perform multi-hop data transmission.
Analysis of the three-layer network model reveals that some studies have randomly selected cluster head combinations, resulting in suboptimal assignments and unnecessary energy drain. Since data ultimately need to reach the base station, transmission should be directed accordingly. However, many researchers have neglected to consider how the clustering of common nodes influences transmission direction. As a result, all nodes are involved in clustering, causing some to send data away from the base station, which leads to inefficient energy use in the wrong direction. Additionally, while some researchers have adopted multi-hop transmission for long-distance communications, they have not considered the number of times a next-hop node is used for forwarding. This factor is critical to node longevity and cannot be ignored.
To address the above three issues, this section analyzes the causes of energy drain in each layer of the network and proposes solutions from an energy efficiency perspective. These aspects encompass optimal cluster head selection, data transmission direction planning, the optimal next-hop node, and the development of algorithms to tackle these challenges.

3.1. Reasonable Cluster Head Combination

During the cluster head selection process, different cluster heads form different clusters. The varying distances from common nodes to their respective cluster heads result in a different energy drain for data transmission. Therefore, the choice of cluster heads significantly impacts the overall energy drain of the network. It is essential to select the most appropriate cluster heads to minimize the energy drained by nodes due to data transmission over distance.
The “Walrus Optimization Algorithm” determines the most suitable position for walruses by updating their positions and comparing the fitness function values of each individual’s position [25]. When combining K-means++ and chaotic mapping to generate the initial walrus population, the resulting output simulates the process of node selection. Table 2 is a comparison between the two.
Effective population initialization enables the CM-WaOA to begin its search from multiple diverse starting points, enhancing its ability to explore the solution space and increasing the probability of locating the global optimum. Therefore, this study adopts two methods for initializing the algorithm’s population.

3.1.1. K-Means++ Clustering Algorithm

Population initialization is a crucial step in the CM-WaOA. This algorithm employs the K-means++ clustering method to achieve higher-quality results. The initial node set is selected based on the center position of each cluster. The determination of cluster centers relies on the application of Equations (4) and (5):
X m = i = 0 t X / t ,
Y m = i = 0 t Y / t ,
Here, X m and Y m represent the horizontal and vertical coordinates of the initial cluster center, respectively.

3.1.2. Chaotic Mapping Optimization

Using logistic chaotic mapping to initialize the population enhances the search efficiency of the CM-WaOA, helping it avoid entrapment in local optima. The inherent randomness and unpredictability of chaotic mapping reduce the likelihood of premature convergence. Additionally, logistic chaotic mapping is highly adaptable to various search spaces and optimization problems, offering strong generalizability. As a result, we integrate it with the Walrus Optimization Algorithm to construct the CM-WaOA, effectively integrating the strengths of both approaches to address complex optimization tasks. The corresponding chaotic mapping is defined in Equation (6):
X i + 1 = α X i 1 X i ,
In this equation, α serves as the control parameter and ranges between 0 and 4. X i denotes the initial value derived by converting the initial population’s coordinates into polar angles.

3.1.3. The CM-WaOA Follows the Procedure Outlined Below

Step 1: Population Initialization.
The walrus positions are initialized by integrating K-means++ and chaotic mapping.
Step 2: Walrus Population Initialization Utilizing a Position-Mapping Approach.
The initialized walrus population generates virtual positions, and actual sensor nodes in the wireless network are mapped to these positions based on their distance d to the virtual location and their respective energy levels e. The walrus population is initialized as Matrix (7):
X = X 1 X i X N N × m = x 1 , 1 x 1 , j x 1 , m x i , 1 x i , j x i , m x N , 1 x N , j x N , m N × m ,
Here, X represents the scale of the walrus population; X i   denotes the i -th walrus (candidate solution); x i , j represents the value of the j -th decision variable suggested by the i -th walrus. N is the total number of walruses, and m is the number of decision variables.
Step 3: Fitness Function Calculation.
Each walrus corresponds to a candidate solution, and the objective function is evaluated based on its decision variable values. The estimated objective function value for a walrus is given by Equation (8):
F = F 1 F i F N N × 1 = F X 1 F X i F X N N × 1 ,
where F represents the vector of the optimization function, with F i denoting the optimization function value for the i -th walrus in the CM-WaOA. This optimization function value acts as the key indicator for evaluating the quality of potential solutions. The solution yielding the most favorable optimization function value is designated as the optimal candidate, while the solution with the least favorable value is termed the suboptimal candidate. During each iteration within the WSN, the optimal and suboptimal candidates are updated according to the recalculated optimization function values to enhance cluster head selection and energy efficiency.
Step 4: Feeding Strategy (Exploration).
When walruses forage underwater, they swim around using their strong flippers and rely on their sensitive whiskers to locate and detect food. During underwater foraging, the walrus with the largest tusks acts as the leader, directing the group to locate food. This mechanism facilitates the traversal of varied regions in the solution space, thus enhancing the global optimization performance of the CM-WaOA.
The feeding behavior is mathematically modeled to update the positions of walruses, directed by the leading candidate of the population, as defined in Equations (9) and (10). In this process, new positions for the walruses are first generated according to Equation (9). If the objective function value shows improvement, the new position is adopted in place of the previous one. This concept is formalized in Equation (10):
x i , j p 1 = x i , j + r a n d i , j S W j I i , j x i , j ,
X i = X i p 1 , F i p 1 < F i X i , e l s e , ,
Step 5: Migration.
A natural behavior of walruses involves migrating to haul-out sites or rocky shores as air temperatures rise toward the end of summer. In the WaOA, this relocation strategy directs walruses to traverse high-potential regions in the solution space, as formalized in Equations (11) and (12). The model posits that each walrus adjusts its position toward that of a stochastically chosen counterpart from a distinct region. A new candidate position is first generated using Equation (11), and, if it results in an improved optimization function value, it updates the prior location in accordance with Equation (12):
x i , j P 2 = x i , j + rand i , j x k , j I i , j x i , j , F K < F i , x i , j + rand i , j x i , j x k , j , else ,   ,
X i = X i P 2 , F i P 2 < F i X i , else ,   ,
Here, X i P 2 signifies the updated location of the i -th walrus computed during the second stage, with x i , j P 2 representing its value in the j -th dimension. F i P 2 is the corresponding optimization function value. x k (where k { 1,2 , 3 , N } and k i ) indicates the position of the walrus chosen as the migration target for the i -th walrus, with x k , j being its j -th dimension and F K signifying its optimization function value.
Step 6: Escaping and Confronting Predators (Exploitation).
Walruses are constantly threatened by predators such as polar bears and orcas. To escape and defend themselves, walruses adjust their positions within their immediate surroundings. By mimicking this natural behavior within the solution space, the WaOA strengthens its local search capability around candidate solutions.
To capture this behavior in the WaOA, each walrus is assumed to possess a defined neighborhood surrounding its current position. A new position within this neighborhood is randomly generated using Equations (13) and (14). If the optimization function value enhances, the updated location supersedes the prior one in accordance with Equation (15):
x i , j P 3 = x i , j + l b l o c a l , j t + u b l o c a l , j t r a n d l b l o c a l , j t ,
Local   bounds : l b local , j t = l b j t u b local , j t = u b j t ,
X i = X i P 3 , F i P 3 < F i X t , else ,   ,
In this context, X i P 3 signifies the updated location of the i -th walrus generated in Phase 3, with x i , j P 3 representing its j -th dimensional component and F i P 3 being the corresponding optimization function value. The variable t signifies the ongoing iteration count. The terms l b j and u b j specify the global minimum and maximum limits for the j -th dimension, respectively, whereas l b local , j t and u b local , j t delineate the localized bounds employed to model the vicinity of a candidate solution for localized exploration.
Step 7: Algorithm Termination Condition.
Steps 3 to 7 are repeated. The non-dominated solution set is iteratively derived from the locations of the walruses and their associated optimization function metrics. This set is iteratively refined and updated until the predefined iteration limit is attained. At that point, the algorithm terminates.
Step 8: Algorithm Output.
The final best non-dominated solution is taken as the solution to the given problem. This corresponds to the optimal walrus position, i.e., the optimal cluster head combination.
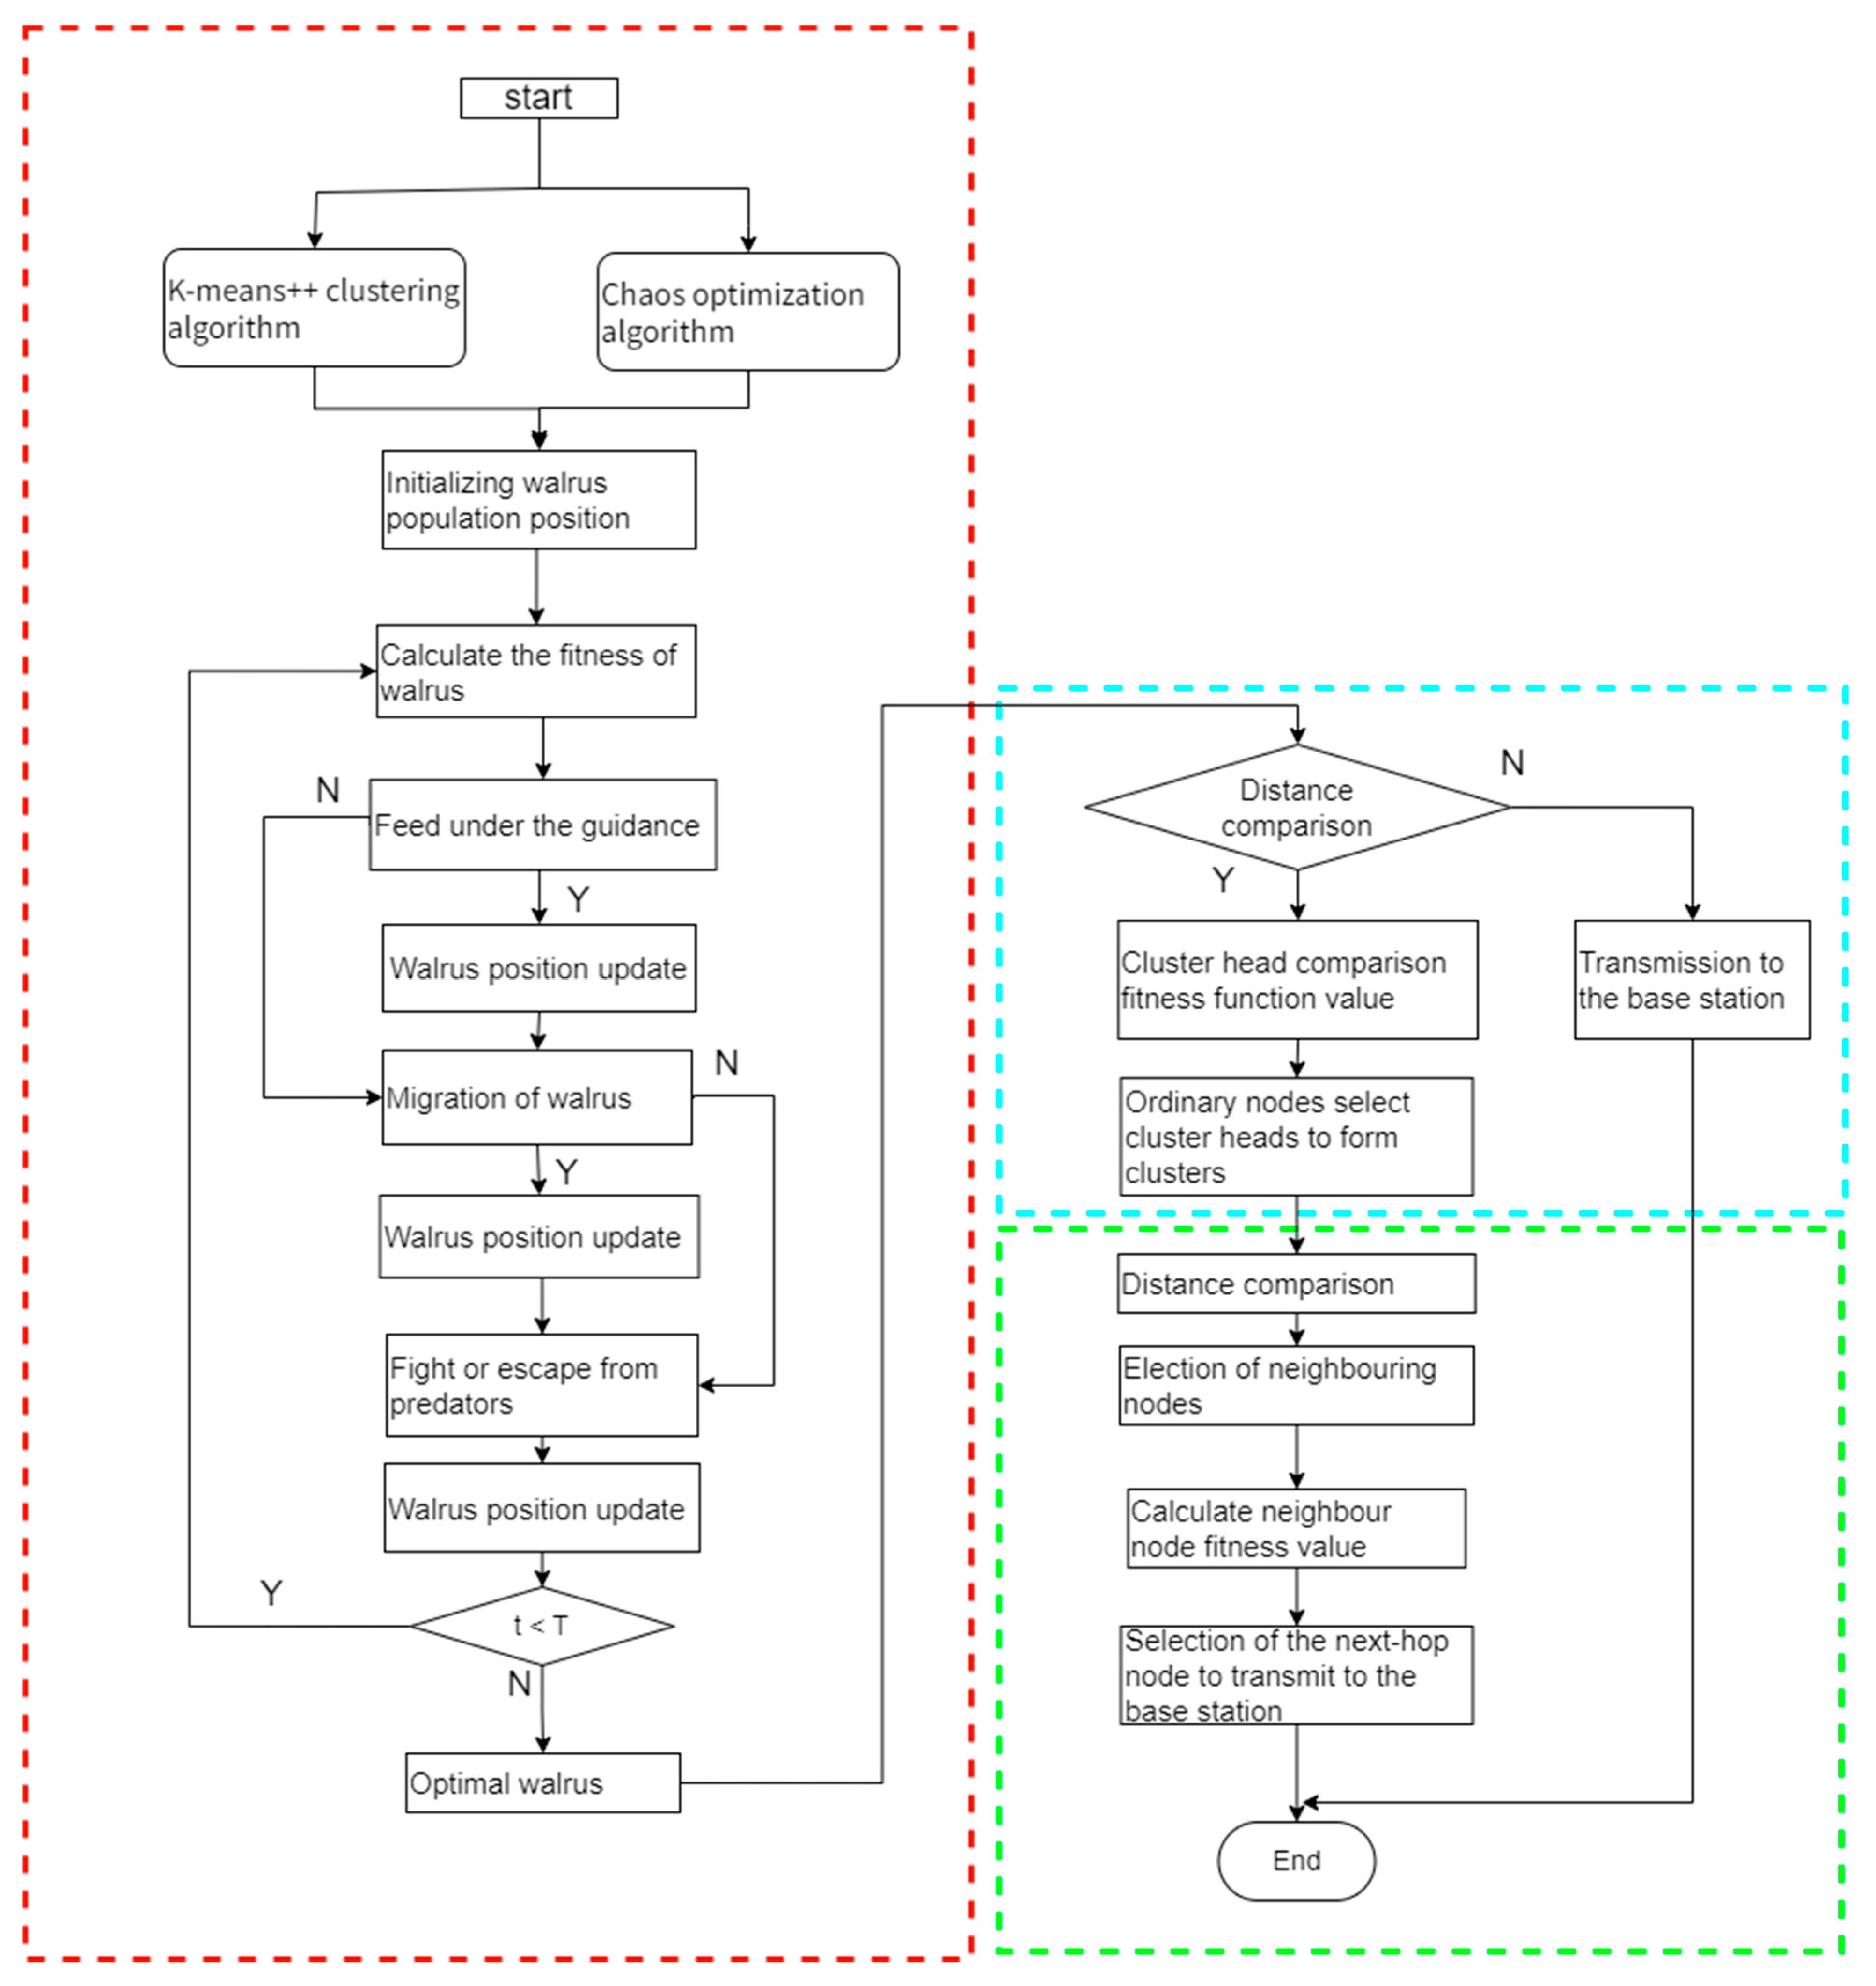
Based on the above steps, a flowchart is created, as shown in Figure 4. The CM-WaOA iteratively updates the positions of individuals in the walrus population and compares their fitness values to select the individual with the lowest fitness value, which represents the best location of the walrus. Subsequently, common nodes join clusters by evaluating and comparing the fitness values of available cluster heads. Inter-cluster routing and data transmission are then carried out using the SSA. The complete workflow of the CM-WaOA is shown below.

3.2. Data Transmission Direction Planning

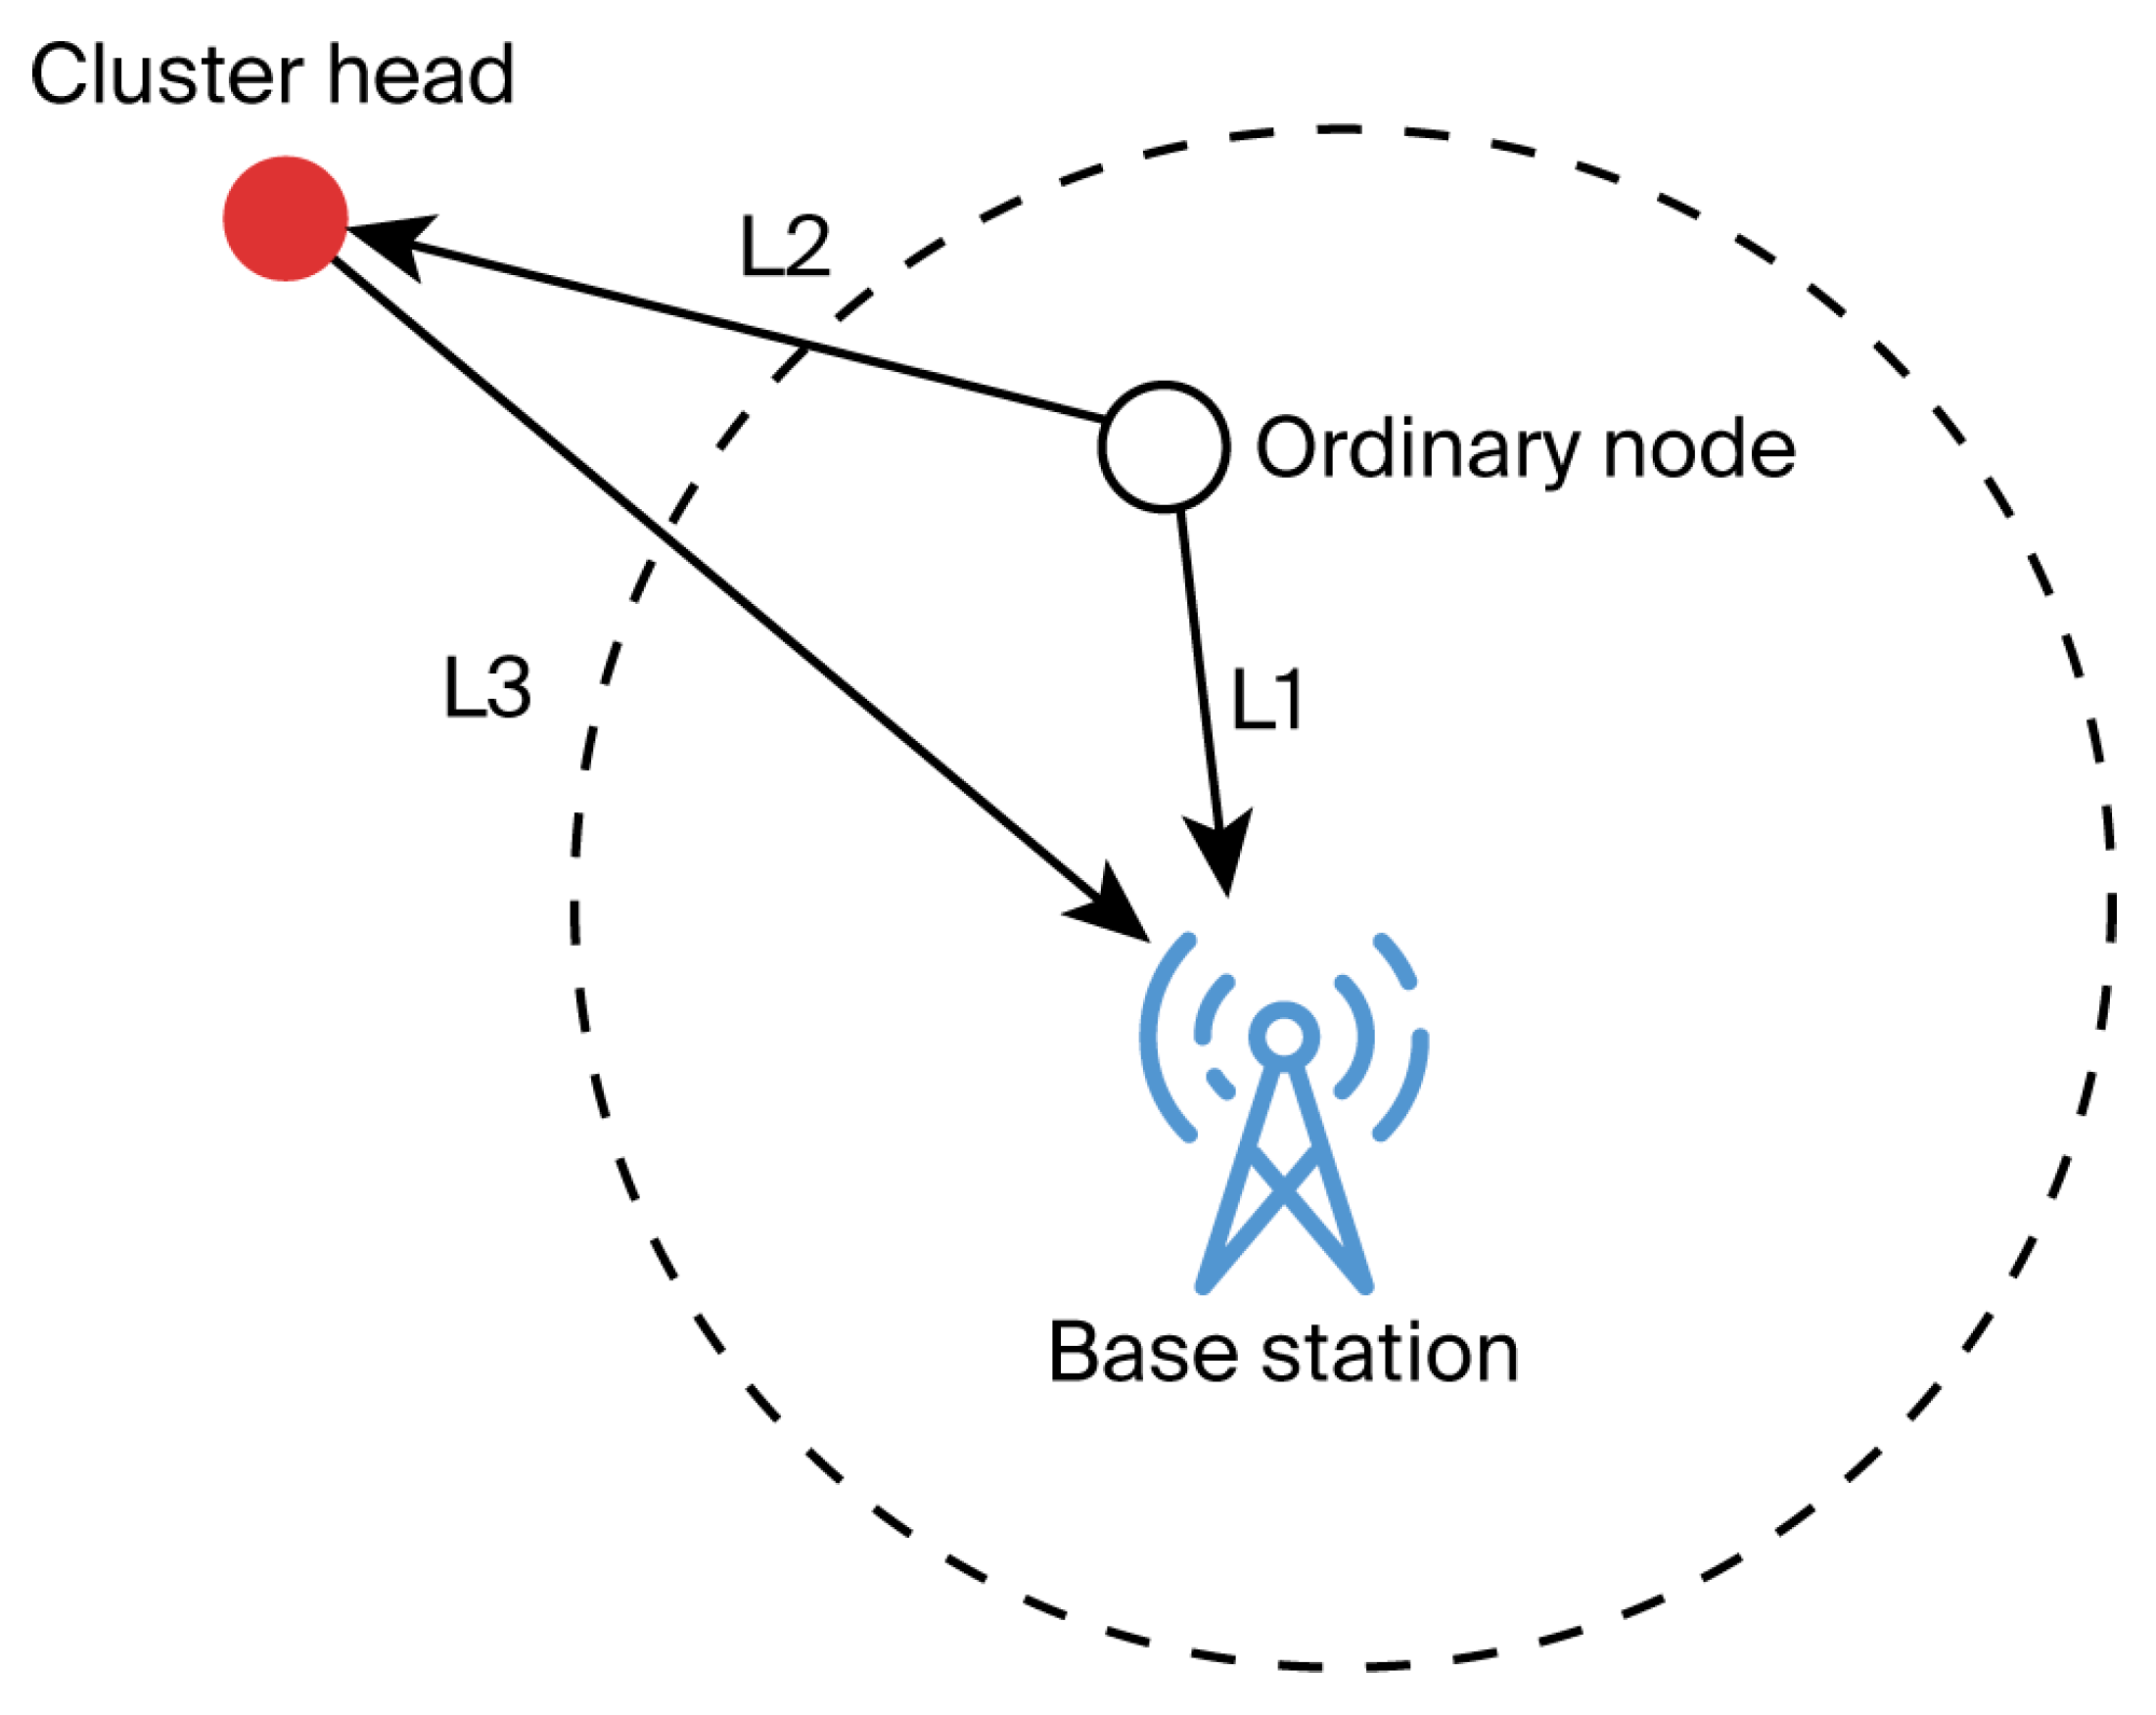
All nodes can receive data sent by other nodes—even those located near the base station. As presented in Figure 5, nodes transmit data to their respective cluster heads, which then perform data aggregation and forward the information to the base station. This results in an inefficient data flow pattern; data are initially transmitted outward before being rerouted back toward the base station.
According to the energy drain model, the total energy drained by nodes operating in clustering mode is represented by E 2 , while the energy drained in the direct transmission mode is denoted as E 1 . From Equations (16) and (17), it can be concluded that, for certain nodes, direct transmission incurs a lower energy drain:
E 1 = K ×   E e l e c + K ×     ε f s   ×   L 1 2 ,
E 2 = 2 ×   K ×   E e l e c + K ×   ε f s ×   ( L 2 + L 3 ) 2 ,
This discrepancy leads to unnecessary energy loss. To mitigate this problem, ordinary nodes situated near the base station should transmit data directly to it, avoiding the cluster head.
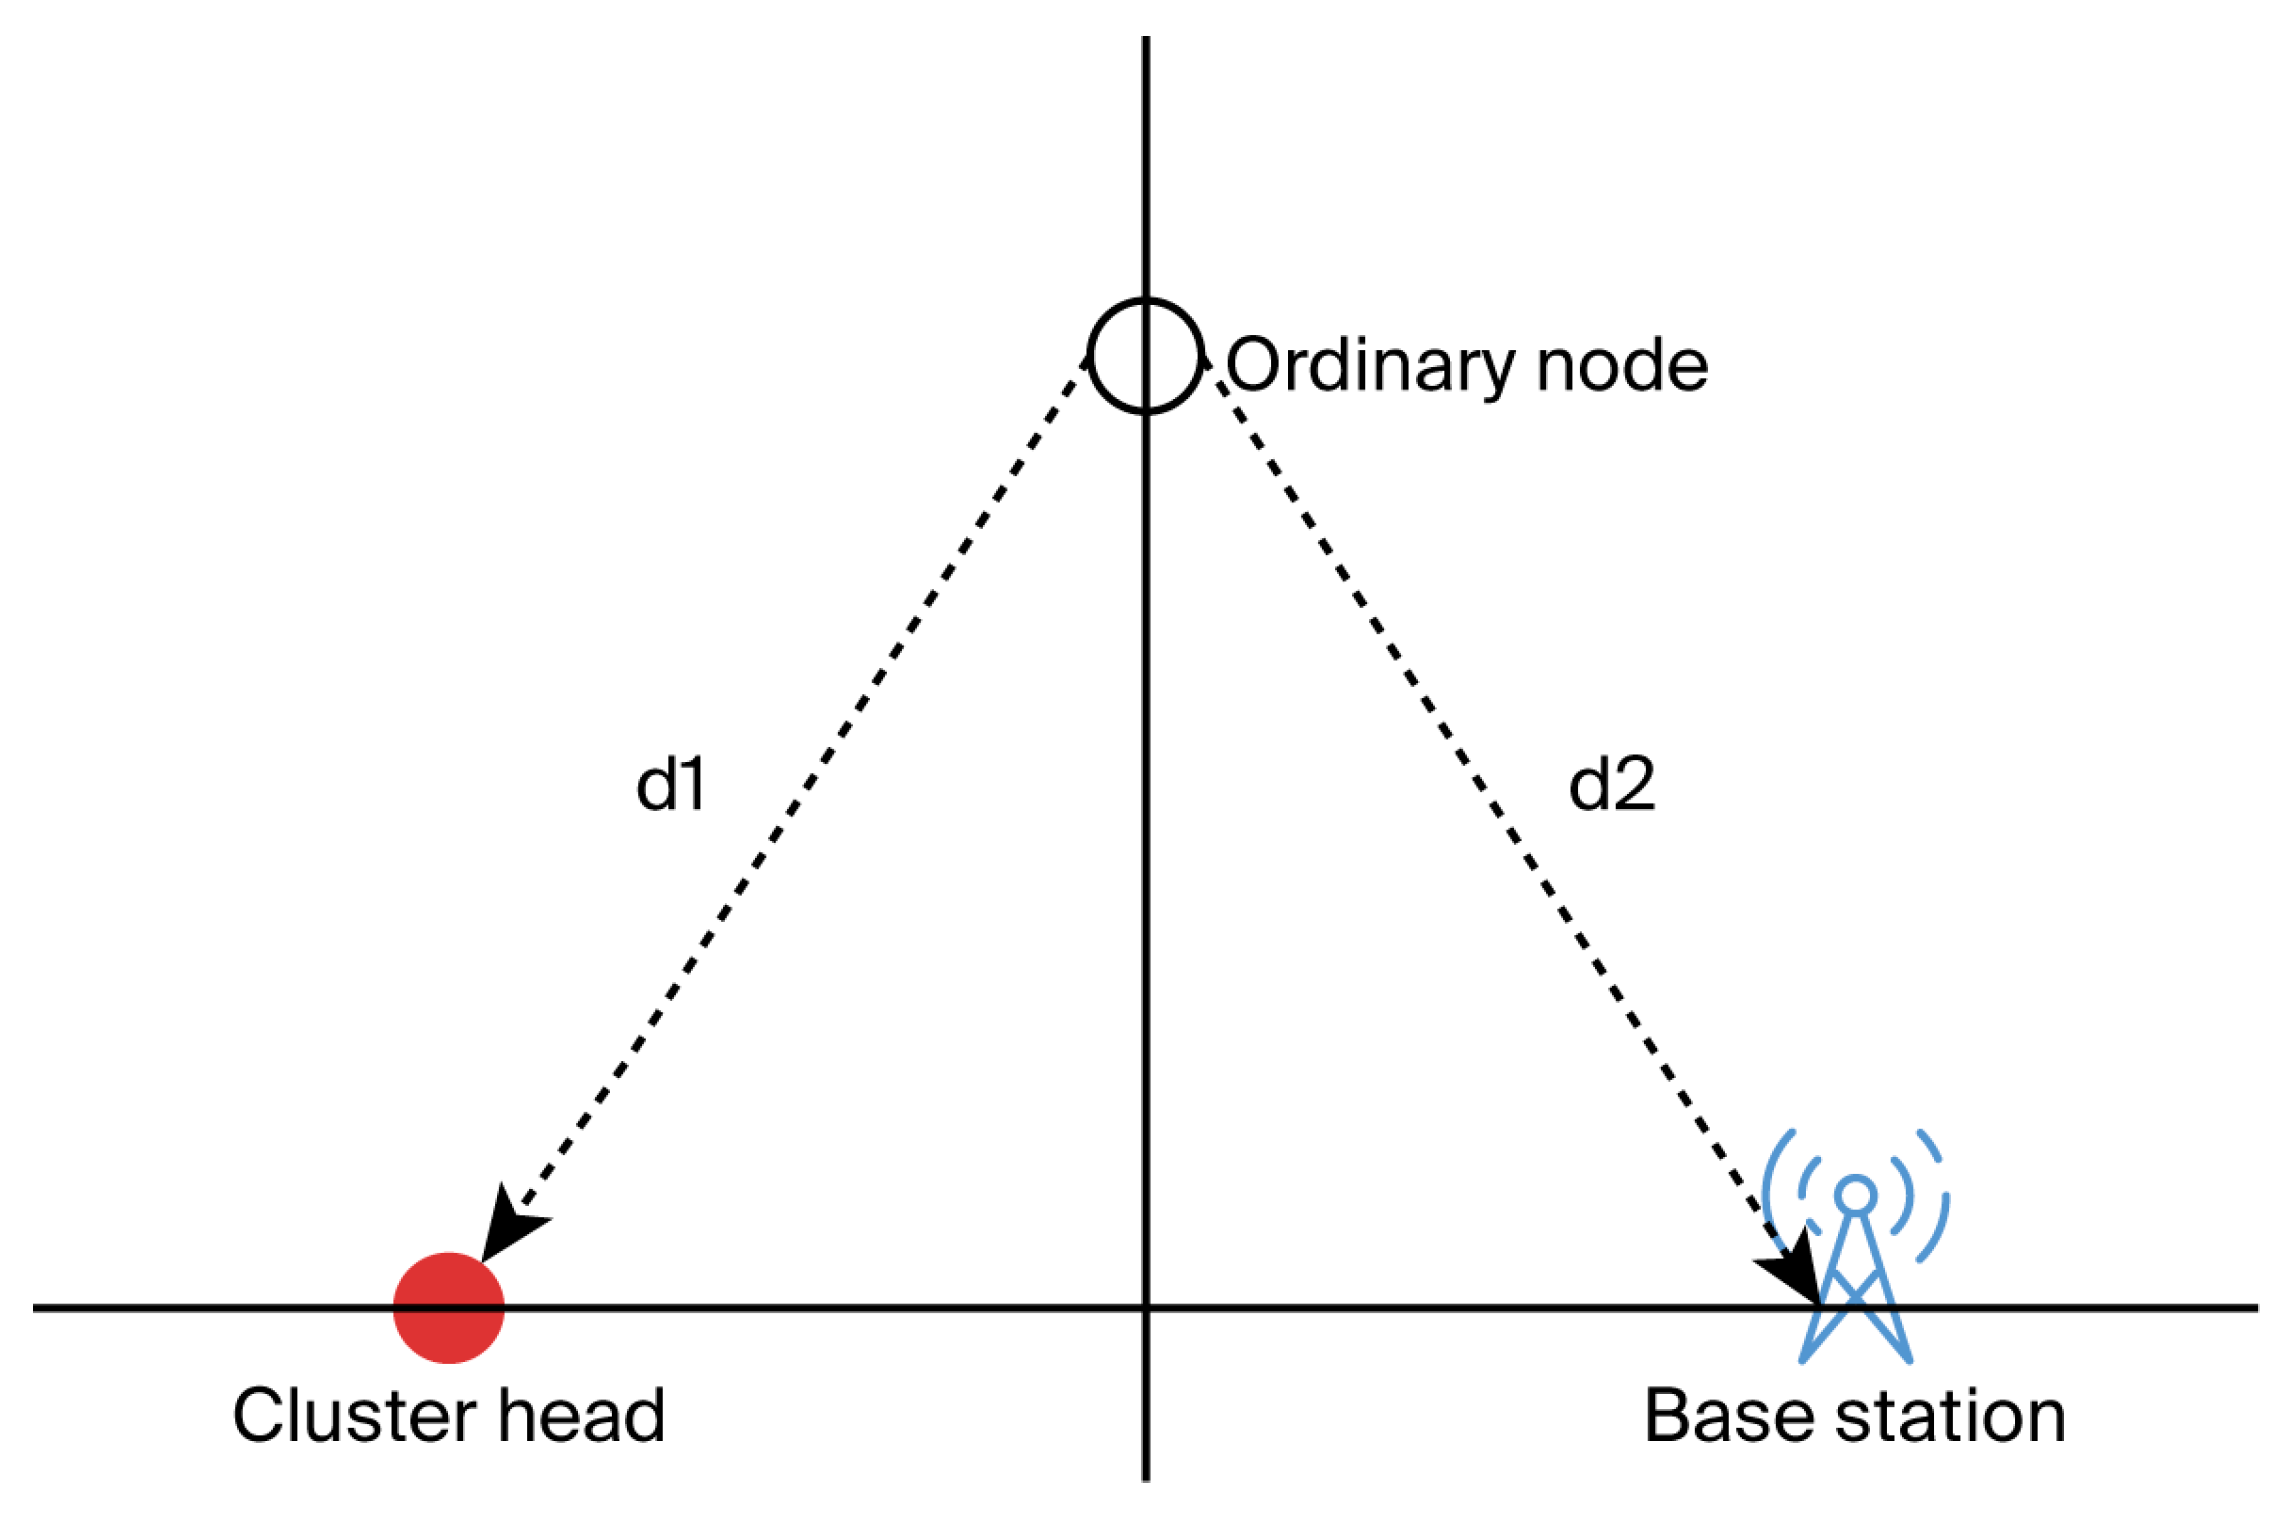
In Figure 6, the median line theorem is used to determine whether the nodes will transmit the data to the base station or to other nodes. If a node lies on the equidistant line between the cluster head and the base station, its distances to both are equal [26]. In this scenario, if d2 ≤ d1, the nodes will directly send data to the base station. Conversely, if d2 > d1, the common node joins a cluster and transmits data to the designated cluster head, which subsequently consolidates and relays the information to the base station.

3.3. Optimal Next-Hop Node

According to Equation (1), the greater the distance, the more energy is required for data transmission. Therefore, distance is the main factor determining the energy usage of the nodes [27]. This study adopts a multi-hop transmission mode. During multi-hop transmission, the Sparrow Search Algorithm (SSA) efficiently optimizes pathways from regular nodes to designated cluster heads, and subsequently to the base station, utilizing multi-objective optimization and swarm intelligence techniques.
The SSA combines the cooperative roles of producers, followers, and scouts with chaotic mapping to enhance global search capability and optimize the multi-hop routes. The fitness function is designed by considering five objectives comprehensively. Objectives include maximizing the residual energy of path nodes, minimizing overall path length, shortening the distance between the final node and the base station, reducing energy variance, and ensuring balanced load distribution.
Via iterative calculations, the SSA finds the optimal next-hop node, adaptively adjusting as the number of iterations increases to accommodate network energy decay. The algorithm uses dynamic population and adaptive weights to optimize next-hop node selection, balancing energy drain and transmission distance, thereby improving network efficiency.
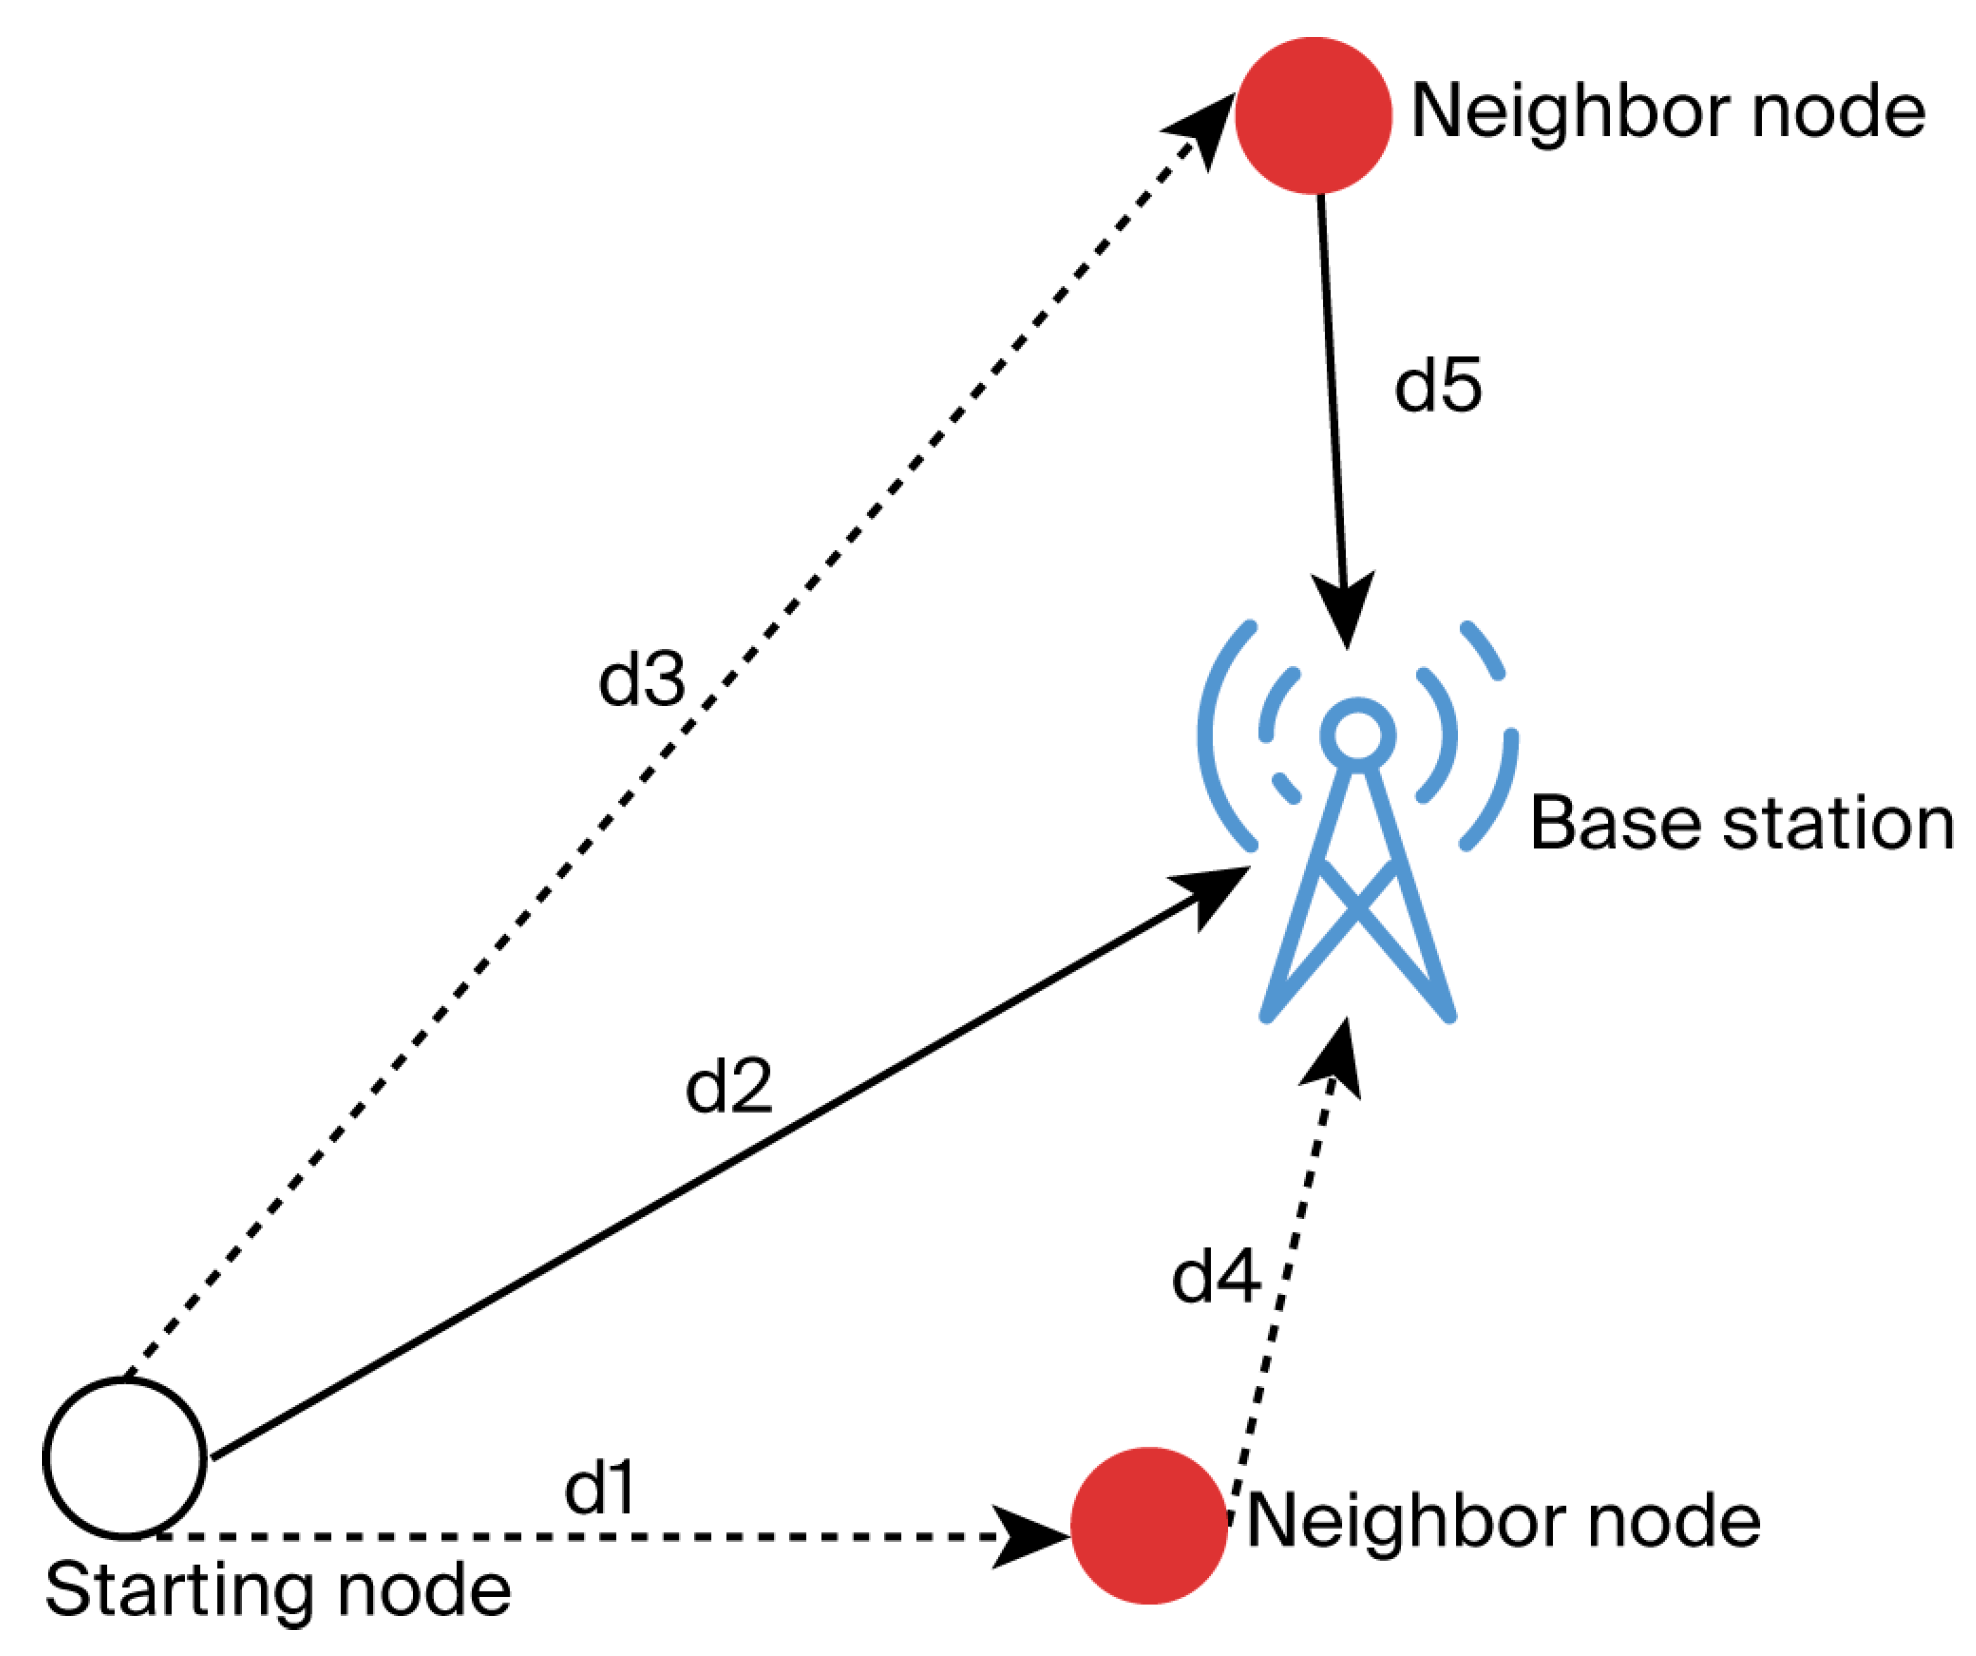
As shown in Figure 7, when d1 < d2 < d3, the originating node sends data to the neighbor node along path d1. Then, the neighbor node selects the next hop along path d4, continuing until the data reach the base station.

4. Design and Implementation of the CM-WaOA

This study presents a detailed energy consumption analysis for a three-tier network and integrates the Chaotic Mapping Walrus Optimization Algorithm (CM-WaOA) for cluster head selection with direction-aware data transmission planning and optimal next-hop strategies. The CM-WaOA clustering scheme comprises three key stages: cluster head designation, cluster establishment, and data transfer. The algorithm flowchart is presented in Figure 8. Firstly, the CM-WaOA is used to select cluster heads. Then, in the second step, clustering operations are performed based on the location of the nodes. Finally, the SSA is used to select the data transmission path and transmit the data received by the sensor nodes to the base station. The base station uploads the data to the network and then transmits them to the mobile terminal device.

4.1. Cluster Head Selection

The first step is to determine the number of cluster heads and then use the CM-WaOA to select the most reasonable and effective cluster heads.

4.1.1. Optimal Number of Cluster Heads

The selection of cluster heads can affect the lifespan of the entire network. Therefore, it is necessary to select reasonable cluster heads to facilitate data transmission between nodes [28,29]. The energy of the nodes is mainly used for the ordinary nodes to send data to the cluster head and the base station. Cluster head nodes receive data from members, aggregate these data, and transmit them to the base station.
Within the T × T area, the nodes are randomly distributed. ( N n ) nodes are distributed across K clusters, and n nodes send data to the base station. Therefore, after one round of data transmission, the energy drained is as follows:
E A L L = K × E p t + E c n + E r + E c j + E c p ,
The energy loss of the ordinary nodes within the cluster is as follows:
E p t = k × E e l e c + k × ε f s × d c n t o C H 2 × N n K 1 ,
The energy drained by ordinary nodes that communicate directly with the base station is as follows:
E c p = k × E e l e c + k × ε f s × d c n t o C H 2 × n ,
The energy drained by designated cluster head nodes during data reception from intra-cluster nodes is as follows:
E c n = k × E e l e c N n K 1 ,
The energy drained by cluster head nodes during data aggregation from intra-cluster nodes is as follows:
E r = k × E D A N n K ,
The energy required by designated cluster head nodes to transmit data to the base station is as follows:
E c j = k × E e l e c + k × ε f s × d C H t o B S 2 ,
In Equation (23), d C H t o B S represents the distance from the cluster head to the base station.
The distance from an ordinary node within the cluster to the cluster head is expressed as follows:
d c n t o C H = ρ × x 2 + y 2 d x d y = T 2 2 π × K ,
By organizing Equations (18)–(24), the total network energy consumption E-ALL for each round is derived as shown in Equation (25):
E A L L = K × ( k × E e l e c + k × ε f s × d c n t o C H 2 × n + k × E e l e c N n K 1                                       + k × E D A N n K + k × E e l e c + k × ε f s × d C H t o B S 2 )                                       + k × E e l e c + k × ε f s × d c n t o C H 2                                       × n ,
In order to find the minimum value of E, the derivative of E is taken to be equal to 0, and then the equation for K is obtained. The value of K at this point is the number of cluster heads that consume the minimum energy after running one round. The obtained K is shown in Equation (26):
K = N × ε f s × T 2 2 π × ( ε f s × d C H t o B S 2 E e l e c ) ,

4.1.2. Population Initialization

In order to accelerate the convergence speed and local optima in the Walrus Optimization Algorithm, chaotic mapping is employed for population initialization. Algorithm 1 shows the steps of this algorithm.
  • Algorithm 1: Pseudo-code of circular symmetric chaotic mapping algorithm.
Algorithm 1: Initialization of Walrus Population by the Chaotic Mapping Algorithm
 input:
   The relative positions of the computing nodes and the base stations
   Acquire the relative positions and transform it into the initial value for mapping
   Logistic mapping is applied in Equations (9)–(15) to introduce chaotic behavior
   This chaotic output is then inversely transformed to generate a new relative position, which is subsequently used to calculate a new position that does not exist.
 output

4.1.3. Position Mapping

In wireless sensor networks, node coordinates are usually random; however, after applying the CM-WaOA, node positions undergo random adjustments. Because the transformed coordinates generated by the CM-WaOA (along the X and Y axes) may not match actual node locations, the algorithm employs a position-mapping function that considers the Euclidean distance to the virtual position and the energy levels of real nodes [30].
In each position update round, a random number is generated. Depending on its value, the population is updated using chaotic mapping and guidance from the best solution to optimize the cluster head combination, balancing global exploration and local convergence.
Chaotic Mapping Update (with a 50% Probability): The coordinates of the virtual positions are mapped to nodes in the actual coordinate space. Based on polar coordinate transformations and nonlinear iterations, pseudo-random positions are generated according to Equations (27)–(29):
θ = a r c t a n y 100 x 100 , z = z r 1 c o s θ , z = z r a 1 a z ,
θ new = a r c s i n z z r , N x = z r c o s θ new + 100 , N y = z r s i n θ new + 100 ,
z r = 20 1 r / r m a x , a = 3 ,
In Equation (29), as the number of rounds r increases, a = 3 maintains chaos, enhances global search capability, and enables the algorithm to escape from local optima.
For each candidate position ( N x , N y ), the node with the best overall performance among the surviving nodes is selected as the cluster head according to Equation (30). The overall performance is evaluated by the fitness function:
f j = 0.5 d j + 0.4 1 E j + ϵ + 0.1 l o a d j r + 1 ,
Weight 0.5 prioritizes selecting cluster heads that are closer in distance to reduce node energy consumption. Weight 0.4 emphasizes the selection of high-energy cluster heads to prevent early failure. The combination of weight 0.1 (decreasing with each round) achieves load balancing, with minimal impact on early loads and a tendency towards smoothness in later stages.
Best Solution Guidance (50% Probability): The best solution guidance is to move toward the current optimal solution X best .
X new = X current + rand X best X current ,
In Equation (31), X current represents the position of the current population individual (i.e., a specific cluster head combination).
  • Algorithm 2: Pseudo-code of position mapping algorithm.
Algorithm 2: Obtain the Actual Position Using the Mapping Function
 input:
   Calculate the distance from the computing node to the virtual location
   Retrieve the energy of each node
   Compute the position mapping function using Equations (4) and (5)
   Select the node indices corresponding to the virtual coordinates projected onto the real network by comparing the function values
 output

4.1.4. Design of the CM-WaOA Functions

To improve cluster head selection and extend the network’s operational lifetime, this study formulates a fitness function for selecting cluster heads for non-cluster-head nodes following the determination of the optimal cluster count [31]. These designated cluster heads manage the consolidation of data from regular nodes and their subsequent relay to the base station, so they should exhibit high residual energy, favorable locations, and low reselection frequency.
The CM-WaOA formulates an objective function based on four key factors: node energy, the distance between cluster heads and the base station, inter-cluster head distances, and the variance in the number of nodes per cluster. Then, cluster heads are generated by combining them with the Pareto front for multi-objective optimization.
The objective function is designed considering the following four aspects:
Node Energy: The reciprocal of the current remaining energy of the node. Cluster head nodes are critical for maintaining network operation. The more remaining energy a node has, the smaller its reciprocal will be. Under the same conditions, if the remaining energy is higher and the position is more reasonable, the probability of acting as a cluster head is also greater, because such nodes can forward data more effectively.
f 1 = 1 h = 1 k E h + ϵ ,   ϵ = 10 10 ,
Euclidean Distance from Cluster Head to Base Station: Data transmission by cluster heads represents the second major source of energy drain in each network cycle, and the energy cost is largely influenced by the distance between a cluster head and the base station [32]. Thus, the shorter this distance, the less energy is required to relay data to the base station.
f 2 = h = 1 k x h x s 2 + y h y s 2 ,
Distance Between Cluster Heads: If cluster heads are too concentrated, nodes in certain areas may have to transmit over longer distances, increasing energy drain and potentially causing load imbalance. Maximizing the distance between cluster heads can optimize network coverage and reduce the transmission energy drain from cluster members to their cluster heads.
f 3 = 1 o = 1 k 1 l = o + 1 k x o x l 2 + y o y l 2 + ϵ ,
Variance in Cluster Sizes: Cluster heads are tasked with collecting and aggregating data from the nodes within their respective clusters. Uneven distribution of nodes can cause some cluster heads to consume energy excessively and fail prematurely. Minimizing the variance in the number of nodes per cluster balances the node distribution across clusters, preventing overload on certain cluster heads. The smaller the variance, the more balanced the cluster sizes and the more evenly distributed the cluster head workloads.
f 4 = v a r n o d e c o u n t s ,
Pareto Front Optimization Design begins with non-dominated sorting, where each individual’s objective values f 1 , f 2 ,   f 3 ,   f 4 are calculated to generate the first Pareto front (the non-dominated solution set). These solutions balance the objectives without using explicit weights by applying Pareto optimization. Non-dominated sorting identifies solutions that do not worsen any objective while improving others.
Normalization of objective values is performed using Equation (35) to balance differences in scale among objectives. The crowding distance is calculated using Equation (36) to select diverse solutions; for each solution in the first front, the crowding distance is computed, and solutions with the largest crowding distance are chosen as the final cluster head combinations. This approach ensures a uniform distribution of solutions, avoiding concentration in any particular region and maintaining diversity in objective trade-offs. Based on this objective function design, the algorithm flow is presented in Algorithm 3.
f m n o r m i = f m i f m m i n f m m a x f m m i n ,
d i = m = 1 4 f m i + 1 f m i 1 f m m a x f m m i n ,
  • Algorithm 3: Pseudo-code of cluster head node selection algorithm.
Algorithm 3: CM-WaOA Cluster Head Optimization Algorithm
 input
   Initialize the network nodes to determine the positions of the walrus population
   Compute the objective function value for each walrus individual, and retain the position and corresponding value of the one with the lowest function value
   By comparing the function values of the walrus population, a new walrus population was generated
    While   t   <   t m a x :
     Feeding strategy: When walruses forage on the seabed, they create a new position for themselves. If the optimization function metric enhances, the updated location supersedes the prior one
     If migration results in a new location that yields a better objective function value, it replaces the walrus’s previous position
     Avoiding and resisting predators has created new positions for the walruses. If the objective function value improves, the previous position is updated with the new one
     Based on the sea elephant’s position and the objective function defined by Equations (32)–(35), the set of non-dominated solutions is calculated:
      t   =   t   + 1
     The best non-dominated solution obtained serves as the solution for the given problem, and the optimal position of the sea lion is obtained, which is the optimal cluster head combination
 output
At this point, we can obtain the time complexity of the CM-WAOA as O ( m a x I t e r · n P o p 2 · k + n P o p · k · n ) . The population size determines the exploration and convergence ability of the algorithm. N P o p = 30 provides sufficient diversity, initializes 30 individuals through chaotic mapping, enhances global search, and avoids local optima.

4.2. Cluster Formation Stage

During the cluster formation stage, ordinary nodes calculate the fitness function of the cluster heads using Equation (38) to select the most suitable cluster head. Then, these nodes transmit data to the designated cluster head, which consolidates the information and relays it to the base station. To prevent the hotspot effect, the nodes close to the base station will directly send the data to the base station. The clustering algorithm is outlined in Algorithm 4.
f c l u s t e r = 0.5 d n o d e , C H + 0.4 1 E C H + 10 10 + 0.1 l o a d C H r + 1 ,
Here, d n o d e , C H denotes the Euclidean distance between an ordinary node and its cluster head, E C H represents the residual energy of the cluster head, and l o a d C H refers to the cluster head’s historical load, defined as the cumulative count of assigned nodes, which increases over successive iterations. Weight 0.5 prioritizes selecting cluster heads that are closer in distance to reduce node energy consumption. Weight 0.4 emphasizes the selection of high-energy cluster heads and prolongs the lifespan of the network. Weight 0.1 considers load balancing, which decreases with the number of rounds. The early load impact is small, and it tends to be balanced in the later stage.
  • Algorithm 4: Selecting the cluster head for ordinary nodes.
Algorithm 4: Network Node Cluster Establishment
 input
   Select the appropriate cluster head
   If the ordinary nodes satisfy the operation of joining a cluster
   Calculate the fitness function of each common node to every cluster head using Equation (38). Ordinary nodes perform clustering operations
   Else
   Ordinary nodes directly establish links with the base station
   End
 output

4.3. Node Data Transmission Based on the SSA

The Sparrow Search Algorithm (SSA) is a swarm intelligence optimization technique inspired by the foraging and anti-predation behaviors of sparrows. It features fewer parameters, enhanced search robustness, and faster convergence [33]. In this study, the network employs a multi-hop transmission scheme. The SSA simulates sparrow behaviors such as foraging (exploration), following (exploitation), and vigilance (avoidance), which provide strong global search and local convergence capabilities. Nodes are divided into three roles: producers, which explore high-quality paths, prioritizing cluster heads closer to the base station; followers, which exploit these paths to refine local routes; and scouts, which introduce random perturbations to escape local optima. The fitness function, which considers both distance and cluster head residual energy, is defined in Equation (39):
f path = 0.7 d CH , BS + 0.3 1 E CH + 10 10 ,
In Formula (39), optimizing distance with a higher weight of 0.7 is prioritized to reduce transmission energy consumption and extend network lifespan. Distance is the primary goal of path optimization, especially in multi-hop paths where shortening the distance from the cluster head to the base station significantly reduces energy consumption. Weight 0.3 ensures the selection of high-energy cluster heads to prevent early node failures. Energy is a secondary but non-negligible factor, and a smaller weight of 0.3 balances distance optimization and network stability.
The SSA path optimization is embedded within the CM-WaOA process and executed after each round of cluster head selection and node clustering. The following are the steps for path selection:
Step 1: Population Initialization.
After each round of cluster head selection and node clustering, initialize the population and assign roles: 20% as producers, 50% as followers, and 30% as scouts. Generate candidate paths for each cluster head through random perturbations.
Step 2: Producer Update.
For producer individuals, update their positions based on the current best path (with the minimum f path ):
X i , t + 1 = X i , t e x p i α T , if   R 2 < S T X i , t + randn L , otherwise ,
In Equation (40), X i , t signifies the location of the i -th producer during iteration t , with T representing the predefined iteration limit, α indicating a stochastic parameter ranging from 0 to 1, and R 2 representing the vigilance level, also within [0, 1]. S T = 0.8 is the safety threshold, L refers to the random step size, and randn denotes a normally distributed random number. The closest active node is chosen, and the fitness f path is evaluated accordingly.
Step 3: Follower Update.
Followers update their positions by following the producer’s best path:
X i , t + 1 = Q e x p X worst , t X i , t i 2 , if   i > n Pop S S A / 2 X best , t + rand X i , t X best , t , otherwise ,
In Equation (41), X best , t denotes the best producer position at iteration t , X worst , t represents the worst position, and Q is a random number. Surviving nodes are selected, and the fitness f path is evaluated accordingly.
Step 4: Scout Update.
Scouts randomly adjust their paths to prevent becoming trapped in local optima:
X i , t + 1 = X best , t + randn X i , t X best , t , if   f path X i , t > f path X best , t X i , t + K X i , t X worst , t f path X i , t f path X worst , t + 10 10 , otherwise ,
In Equation (42), K ∈[−1, 1] is used to control the transmission direction, enhancing the flexibility of path search. As shown in Table 3:
Step 5: Pre-Update of Path Selection.
Calculate the fitness f path for all individuals and select the path with the minimum f path as the best path for the current round. If this path is better than the cluster head combination in the CM-WaOA, update BestX to optimize inter-cluster transmission.
Step 6: Algorithm Termination.
Upon reaching the maximum number of iterations, the optimized cluster head combination and data transmission paths are output.
The data transmission algorithm is shown in Algorithm 5.
Algorithm 5: Network Data Transmission
 input
   Obtain cluster heads and clusters from Algorithm 3 and Algorithm 4
   If ordinary nodes link to the cluster head
     Selecting the path through the sparrow search algorithm
     The node transmits data to the cluster head
     After receiving the data, the cluster head performs fusion and then transmits the data to the base station via a single hop or multiple hops
   Else
   Ordinary nodes relay data directly to the base station
 output
At this point, we can obtain the time complexity of the SSA as O T n P o p S S A k m a x H o p s + n P o p S S A k n .

5. Simulation Study and Performance Comparison

5.1. Parameter Configuration for Experiments

In order to assess how effectively the CM-WaOA extends the network lifetime, comparative simulations were conducted on the MATLAB R2024a platform. The proposed algorithm was evaluated against LEACH, EEUC, CGWOA, and EBPT-CRA by analyzing network-wide energy drain and the count of dead and alive nodes. The four algorithms LEACH, EEUC, CGWOA, and EBPT-CRA are all replications based on the original ideas. For the purpose of experimental comparison and analysis, the basic parameters of the sensors have been changed to be consistent. Energy usage resulting from the data aggregation process is disregarded, as only one direction of bidirectional communication is accounted for in the energy calculations. Since the user is relatively close to the node, energy drain is considered minimal [34]. An 800 × 800 simulation environment is established based on the Euclidean distance and hop count between nodes, cluster heads, and base stations, where 100 nodes are randomly generated by combining 100 x-coordinates and 100 y-coordinates. The base station is located at coordinates (400, 400). According to Equation (26), the number of cluster heads is K = 0.04 × n. Table 4 shows the settings of the experimental parameters. After multiple experiments, the error in the comparison results is very small and can be ignored. Therefore, one of the experimental results is selected as the subsequent comparison for presentation and explanation.

5.2. Energy Fluctuations in WSNs

The remaining energy of the WSN directly affects the operational duration of the entire system [35,36]. Figure 9 shows a comparison of the remaining energy of these five algorithms, where more remaining energy indicates longer communication sustainability.
As shown in the graph, all the nodes in the LEACH network have died by the 343rd round. The CGWOA consumes 70.75% of the energy by round 1000, EEUC consumes 79.50%, and EBPT-CRA consumes 89.08%. In contrast, the CM-WaOA only consumes 40.00% of the total energy by round 1000. Moreover, it exhibits a slower energy drain rate throughout rounds 0 to 1000 compared to the other algorithms. The CM-WaOA primarily considers node energy and transmission distance when selecting optimal cluster heads via Chaotic Walrus Optimization. Furthermore, during the clustering phase, it selects preliminary clusters based on transmission distance and node energy, rather than relying solely on node energy, forwarding frequency, and distances between initial and neighboring nodes and from neighbors to the base station. By integrating the SSA to optimize data transmission paths, the CM-WaOA significantly reduces energy drain and extends the operating time of the network.

5.3. Evaluation of Dead Node Count in the WSN

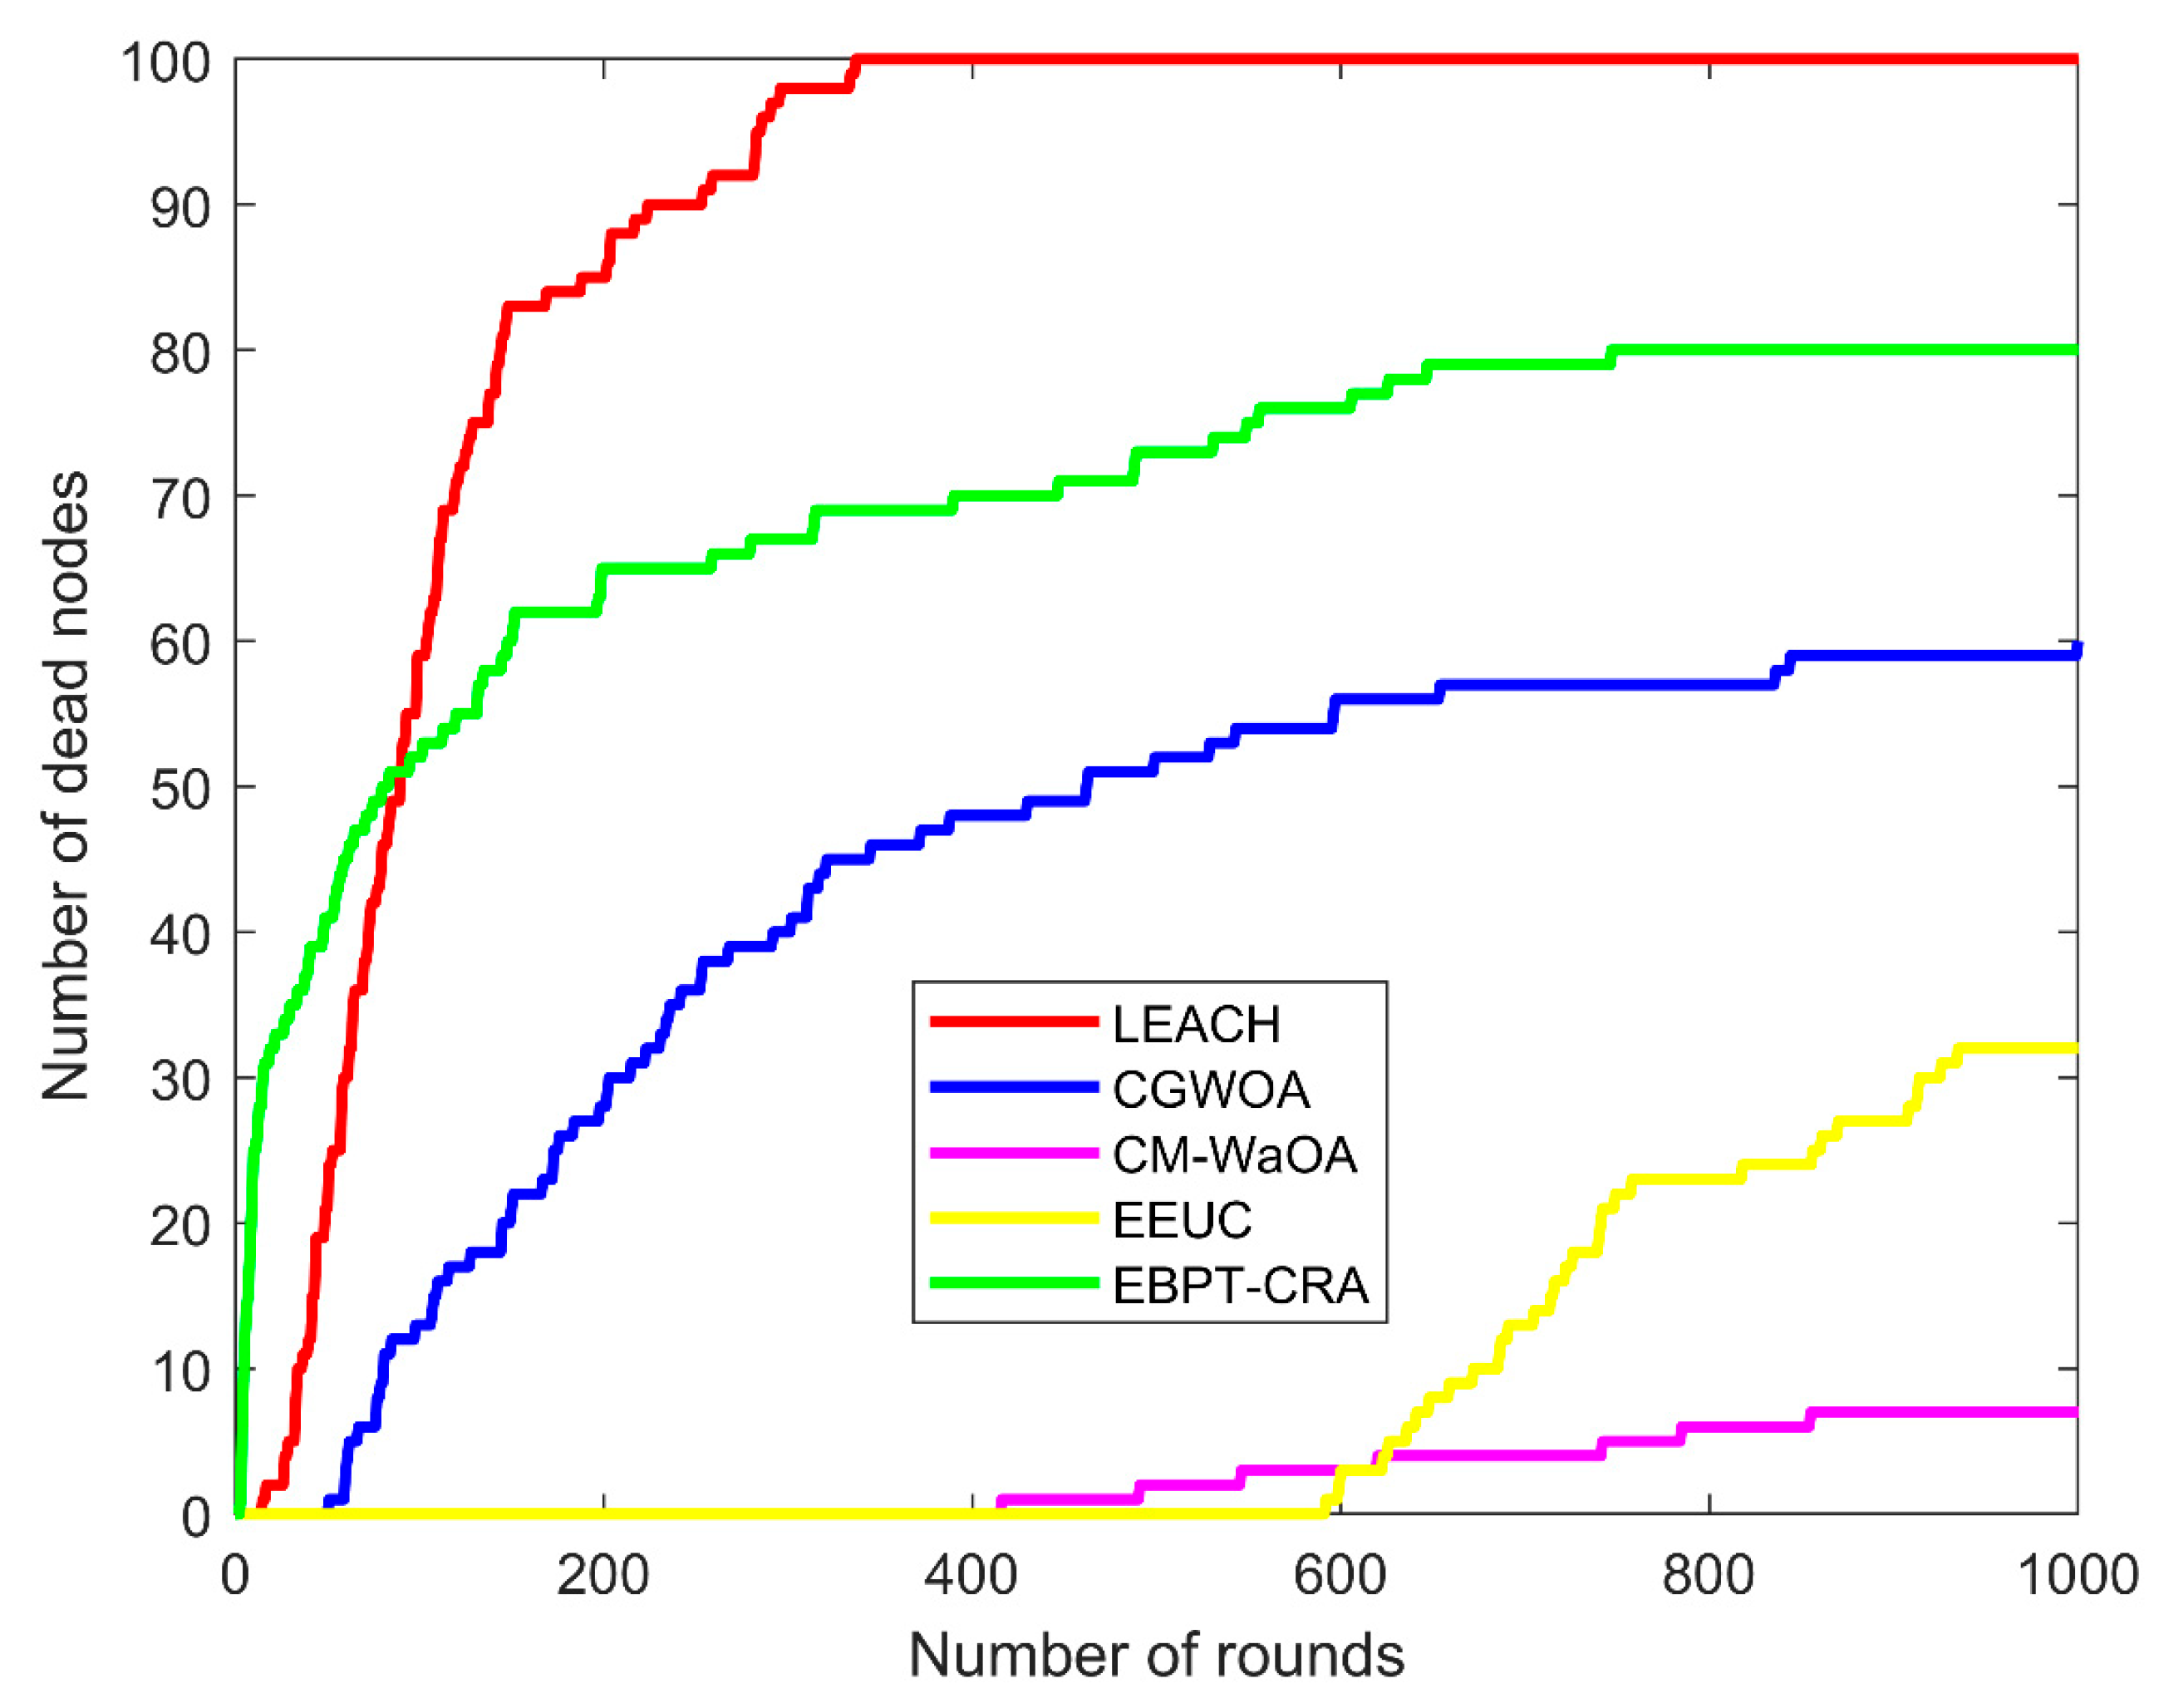
The number of dead nodes in a wireless sensor network serves as an indicator of overall network stability. A higher number of dead nodes results in reduced network coverage and a faster node death rate, thereby significantly affecting the performance of the emergency communication system [37]. In Figure 10, the variations in the number of dead nodes for these five algorithms can be observed.
As shown in Figure 10, all algorithms begin to exhibit node death shortly after the simulation starts. Notably, the LEACH algorithm shows the first dead nodes around the 14th round, with nearly all nodes becoming non-functional by approximately the 343rd round. The EBPT-CRA experiences dead nodes earlier, but its death rate gradually becomes slower than that of LEACH after multiple iterations. The overall effectiveness of the CGWOA is better than both LEACH and the EBPT-CRA, but its death rate is significantly higher than that of EEUC and the CM-WaOA. Although the EEUC algorithm shows dead nodes later than the CM-WaOA, its local node death rate accelerates more rapidly in the later stages as iterations increase, which cannot be overlooked. Comparatively, the overall performance of EEUC surpasses LEACH, EBPT-CRA, and CGWOA, but its death rate still exceeds that of the CM-WaOA. The CM-WaOA demonstrates a relatively slow increase in dead nodes, with only 7% dead nodes after 1000 rounds. This algorithm balances overall network energy drain by distributing energy loss evenly among all nodes, preventing localized node deaths and thereby extending the overall lifetime of the emergency communication network.

5.4. Evaluation of Surviving Node Count in the WSN

In emergency scenarios such as rescue operations and disaster relief surveys, wireless sensor network (WSN) nodes are typically not replaced frequently due to the hazardous environment and are also constrained by limited energy resources [38]. Therefore, under identical environmental conditions, a higher number of surviving nodes and fewer dead nodes indicate a longer network communication duration. In Figure 10, the variations in the number of surviving nodes for these five algorithms can be observed.
As shown in Figure 11, almost all nodes in the LEACH algorithm have died by round 343 of 1000 rounds of operation. The EBPT-CRA retains only about 20% active nodes after 1000 rounds. The CGWOA experiences a gradual decline and stabilizes around round 650, maintaining about 40% active nodes by round 1000. Although the EEUC algorithm shows no dead nodes in the first 590 rounds, a significant number of nodes begin to die in the later stages, leaving 68% of nodes alive after 1000 rounds. In contrast, the CM-WaOA keeps 93% of nodes alive after 1000 rounds, significantly extending the communication time and demonstrating strong stability. The CM-WaOA fully utilizes its advantages in selecting cluster heads. Additionally, the SSA reduces energy drain during inter-cluster routing construction, preventing premature cluster head death and maximizing sensor capabilities for network-wide data transmission.

5.5. Transmission Delay Comparison

Transmission delay is also an important factor in evaluating the quality of a WSN. This article compares transmission delay based on distance, as shown in Figure 12, which compares five algorithms from round 0 to round 1000.
According to Figure 12, the LEACH protocol exhibits a larger transmission distance relative to the other protocols. After round 343, since all nodes have died, the transmission distance drops to zero. The EBPT-CRA, being a clustering routing protocol based on an energy-balanced routing tree, initially exhibits relatively large transmission distances. However, as the energy-balanced routing tree is established, the transmission distance gradually decreases and eventually stabilizes. The EEUC algorithm shows transmission distances slightly larger than those of the CGWOA. Figure 12 shows that the distance delay of the CM-WaOA remains below that of the other protocols throughout.

5.6. Comparative Analysis of Surviving Nodes Across Different Network Scales

This experiment was conducted under three different conditions, and the remaining number of nodes after different iterations was compared. The results are presented in Table 5. Increasing the size of the wireless sensor network’s operational area results in a decrease in the overall network lifetime. As the area expands, the rate of node death also increases. This phenomenon occurs because, as the area grows, the distance between nodes also increases. These factors lead to a significant increase in transmission-related energy drain, which grows exponentially with distance. The number of active nodes serves as a direct indicator of the network’s lifetime. In larger-area deployments, the energy of cluster head nodes further from the base station is often consumed more rapidly, leading to earlier failure.
The experimental results obtained in these three regions were analyzed. When the number of nodes remains constant, as the area increases, the energy consumption of nodes becomes faster, and the number of dead nodes increases sharply. In a 600 × 600 m2 area with 100 uniformly deployed nodes, the CM-WaOA maintains 100 active nodes after 1000 cycles of data transfer. Relative to the CGWOA, it achieves a 33% higher node survival rate, and, compared to the EBPT-CRA, the improvement reaches 73%. When 100 nodes are randomly deployed in an 800 × 800 m2 area, the number of surviving nodes after 1000 data transmission rounds declines by 100%, 60%, 32%, and 80% for the LEACH, CGWOA, EEUC, and EBPT-CRA protocols. However, the CM-WaOA maintains a stable performance, still retaining 93% of the nodes after 1000 rounds. In a larger 1000 × 1000 m2 area, with 100 nodes randomly distributed, even after 1000 data transmission cycles, the CM-WaOA maintains 62 functioning nodes within the network, which is significantly higher than the other four algorithms. This result is due to the selection of cluster head nodes and transmission paths optimized by the CM-WaOA, which effectively prolongs the network lifespan. Consequently, the CM-WaOA achieves the longest network lifetime, highlighting its advantages in energy efficiency and stability compared to the alternative protocol.

6. Conclusions and Future Work

This article proposes a CM-WaOA optimization method that extends the running time of WSNs by reducing the consumption of data transmission. The fitness function is enhanced by integrating factors such as node energy, distances among cluster heads, distances from cluster heads to the base station, and the count of nodes within clusters. The CM-WaOA updates optimal individual positions according to fitness values, effectively utilizing its global search and convergence strengths to balance energy usage across clusters. During the inter-cluster routing phase, the SSA is applied to lower transmission energy drain for both cluster heads and ordinary nodes. This results in more efficient cluster head placement and reduced energy use along data transmission paths. Compared to LEACH, EEUC, CGWOA, and EBPT-CRA, the proposed method notably decreases overall network energy drain and achieves the highest count of active nodes, thereby significantly extending the lifespan of the WSN.
The CM-WaOA developed here focuses solely on energy drain within two-dimensional emergency communication scenarios and does not address three-dimensional emergency network models. Moreover, aspects such as data collection and transmission security have not been further addressed. Due to the lack of analysis on security, reliability, and QoS, further research will be conducted in this area in the future to increase the comprehensiveness of experiments. We will continue to optimize the algorithm with a focus on reducing energy drain and enhancing data security through encryption techniques to prevent data corruption and leakage. In addition, no simulation experiments were conducted on the NS-3/OMNeT++real test bench, and there were no radio measurements (packet loss, retransmission, collision). Due to simple path loss, the energy model cannot capture the behavior of lower layers. In the future, simulation experiments will also be conducted on the NS-3/OMNeT++real test bench to increase the comprehensiveness of the experiments.

Author Contributions

Conceptualization, S.J.; methodology, Y.Y. and S.J.; software, Y.Y. and W.S.; validation, W.S. and S.J.; writing—original draft preparation, S.J. and Y.Y.; writing—review and editing, Y.Y. and W.S. All authors have read and agreed to the published version of the manuscript.

Funding

This research study is supported by the Undergraduate Industry Education Integration Research Project in Henan Province (2023-28), the Graduate Education Reform Project in Henan Province (2023SJGLX300Y), the Graduate Education Reform and Quality Improvement Project of Nanyang Normal University (2023ZLGC06), and the Research Projects of Nanyang Normal University (2025STP009, 2025STP010).

Data Availability Statement

The data presented in this study are available on request from the corresponding author.

Conflicts of Interest

The authors declare no conflicts of interest.

Abbreviations

The following abbreviations are used in this manuscript:
WSNWireless sensor networks
LEACHLow-energy adaptive clustering hierarchy
EEUCEnergy-efficient unequal clustering
CGWOAChaotic Grey Wolf Optimization Algorithm
EBPT-CRAClustering and routing algorithm based on an energy-balanced path tree
CM-WaOAChaotic Mapping Walrus Optimization Algorithm
SSASparrow Search Algorithm

References

  1. Tang, M.; Cai, S.; Lau, V.K.N. Radix-partition-based over-the-air aggregation and low-complexity state estimation for IoT systems over wireless fading channels. IEEE Trans. Signal Process 2022, 70, 1464–1477. [Google Scholar] [CrossRef]
  2. Ranjan Kumar, M.; Yajunath, K.; Shet, N.S.V.; Ranjan, M.S.; Swarnadh, S.G.; Bhanjan, P.S.; Shivalal, P.B. A survey on wireless sensor network (applications and architecture). Int. J. Commun. Netw. Distrib. Syst. 2024, 30, 136–201. [Google Scholar]
  3. Sourav, R.; Dipnarayan, D.; Bibhash, S. Secure and lightweight authentication protocol using PUF for the IoT-based wireless sensor network. ACM J. Emerg. Technol. Comput. Syst. 2023, 20, 1–17. [Google Scholar]
  4. Kubra, G.; Nuri Alperen, K.; Damilola, O.; Fan, L. A dynamic wireless sensor network deployment algorithm for emergency communications. In Proceedings of the 2023 IEEE/ACIS 21st International Conference on Software Engineering Research, Management and Applications (SERA), Orlando, FL, USA, 23–25 May 2023; pp. 28–34. [Google Scholar]
  5. Hudda, S.; Haribabu, K. A review on WSN based resource constrained smart IoT systems. Discov. Internet Things 2025, 5, 56. [Google Scholar] [CrossRef]
  6. Shiyang, W.; Andrew, A.C.M.; Ameer, I.; Akshat, B.; Wang, K.I.-K. Long range wide area network for agricultural wireless underground sensor networks. J. Ambient Intell. Humaniz. Comput. 2023, 14, 4903–4913. [Google Scholar]
  7. Adil, K.O.; Nawaf, A.; Alaa, K.O.; Mohammed, A.; Ayman, F.G.; Mahmoud, R. Efficient key distribution for secure and energy-optimized communication in wireless sensor network using bioinspired algorithms. Alex. Eng. J. 2024, 92, 63–73. [Google Scholar] [CrossRef]
  8. Yuki, N.; Aoto, H.; Chihiro, Y.; Kyohei, T.; Tetsuya, O.; Leonard, B. Experimental results of a wireless sensor network testbed for monitoring a water reservoir tank considering multi-flows. Lect. Notes Data Eng. Commun. Technol. 2023, 161, 331–340. [Google Scholar]
  9. Heinzelman, W.R.; Chandrakasan, A.; Balakrishnan, H. Energy-efficient communication protocol for wireless microsensor networks. In Proceedings of the Hawaii International Conference on System Sciences, Maui, HI, USA, 7 January 2000; p. 10. [Google Scholar]
  10. Madhvi, S.; Aarti, S.; Shefali, R. An approach to increase the lifetime of traditional LEACH protocol using CHME-LEACH and CHP-LEACH. In Fourth Congress on Intelligent Systems; Springer: Berlin/Heidelberg, Germany, 2024; Volume 868, pp. 133–145. [Google Scholar]
  11. Suman, J.; Shyamala, K.; Roja, G.; Pranay, N. Testbed Implementation of MAX LEACH Routing Protocol and Sinkhole Attack in WSN. In Proceedings of Third International Conference on Advances in Computer Engineering and Communication Systems; Springer: Berlin/Heidelberg, Germany, 2023; Volume 612, pp. 153–162. [Google Scholar]
  12. Gülbaş, G.; Çetin, G. Lifetime Optimization of the LEACH Protocol in WSNs with Simulated Annealing Algorithm. Wirel. Pers. Commun. 2023, 132, 2857–2883. [Google Scholar] [CrossRef]
  13. Mishra, R.; Yadav, R.K. Energy efficient cluster-based routing protocol for WSN using nature inspired algorithm. Wirel. Pers. Commun. 2023, 130, 2407–2440. [Google Scholar] [CrossRef]
  14. Almusawi, M.; Ravindran, G.; Bhasker, B.; NL, L. Chaotic Grey Wolf Optimization for Energy-Efficient Clustering and Routing in Wireless Sensor Networks. In Proceedings of the 2024 International Conference on Integrated Circuits and Communication Systems (ICICACS), Raichur, India, 23–24 February 2024; pp. 1–8. [Google Scholar]
  15. Li, C.; Ye, M.; Chen, G.; Wu, J. An energy-efficient unequal clustering mechanism for wireless sensor networks. In Proceedings of the IEEE International Conference on Mobile Adhoc and Sensor Systems Conference, Washington, DC, USA, 7 November 2005; pp. 597–604. [Google Scholar]
  16. Akshay, V.; Sunil, K.; Prateek Raj, G.; Tarique, R.; Arvind, K. Enhanced Cost and Sub-epoch Based Stable Energy-Efficient Clustering Algorithm for Heterogeneous Wireless Sensor Networks. Wirel. Pers. Commun. 2023, 131, 3053–3072. [Google Scholar]
  17. Fan, B.; Xin, Y. EBPT-CRA: A clustering and routing algorithm based on energy-balanced path tree for wireless sensor networks. Expert Syst. Appl. 2025, 259, 125232. [Google Scholar] [CrossRef]
  18. Li, B.; Wang, H.; Liu, Y.; Zhang, X. Chaos-based optimization in WSNs. IEEE Trans. Wirel. Commun. 2016, 15, 2145–2156. [Google Scholar]
  19. Shahid, I.M.; Faiyaj Ahmed, L.M.; Monirul, K.M.; Khurram Monir, R.M. A hybrid optimization algorithm for improving load frequency control in interconnected power systems. Expert Syst. Appl. 2024, 249, 695–701. [Google Scholar] [CrossRef]
  20. Jasim, K.M.O.; Salih, B.M. Improving Task Scheduling in Cloud Datacenters by Implementation of an Intelligent Scheduling Algorithm. Informatica 2024, 48, 77–88. [Google Scholar] [CrossRef]
  21. Suhag, S.; Aarit. Challenges and Potential Approaches in Wireless Sensor Network Security. J. Electr. Eng. Technol. 2024, 19, 2693–2700. [Google Scholar] [CrossRef]
  22. Heidari, E. A novel energy-aware method for clustering and routing in IoT based on whale optimization algorithm & Harris Hawks optimization. Computing 2024, 106, 1013–1045. [Google Scholar]
  23. Funaki, M.; Tanaka, Y.; Murata, D.; Yamamoto, T. Wireless Sensor System, Wireless Terminal Device, Communication Control Method and Communication Control Program. U.S. Patent 11930431, 12 March 2024. [Google Scholar]
  24. Jae Young, J.; Boun, S.; Young Jin, H. Optimal design method of a wireless charging system for HTS magnets using a genetic algorithm. IEEE Trans. Appl. Supercond. 2024, 34, 4901806. [Google Scholar] [CrossRef]
  25. Trojovský, P.; Dehghani, M. A new bio-inspired metaheuristic algorithm for solving optimization problems based on walruses behavior. Sci. Rep. 2023, 13, 8775. [Google Scholar] [CrossRef]
  26. Dinesh, K.; Santhosh Kumar, S.V.N. GWO-SMSLO: Grey wolf optimization-based clustering with secured modified Sea Lion optimization routing algorithm in wireless sensor networks. Peer-to-Peer Netw. Appl. 2024, 17, 585–611. [Google Scholar] [CrossRef]
  27. Sakhri, A.; Arsalan, M.; Maimour, M.; Kherbache, E.; Rondeau, E.; Doghmane, N. A digital twin-based energy-efficient wireless multimedia sensor network for waterbirds monitoring. Future Gener. Comput. Syst. 2024, 155, 146–163. [Google Scholar] [CrossRef]
  28. Preethi, R. Assault Type Detection in WSN Based on Modified DBSCAN with Osprey Optimization Using Hybrid Classifier LSTM with XGBOOST for Military Sector. Opt. Mem. Neural Netw. (Inf. Opt.) 2024, 33, 53–71. [Google Scholar] [CrossRef]
  29. Qader, K.B.A.; Mezaal, H.D.; Abdulwahab, K.Y.; Alkenani, J.; Alshawi, I.S. Lifetime Maximization Using Grey Wolf Optimization Routing Protocol with statistical Technique in WSNs. Informatica 2023, 47, 75–82. [Google Scholar] [CrossRef]
  30. Deena, S.; Suganthi, D.S.; Nalini, T. Energy aware clustering protocol using chaotic gorilla troops optimization algorithm for Wireless Sensor Networks. Multimed. Tools Appl. 2024, 83, 23853–23871. [Google Scholar]
  31. Vikhyath, V.K.; Prasad, A.P. Optimal Cluster Head Selection in Wireless Sensor Network via Combined Osprey-Chimp Optimization Algorithm: CIOO. Int. J. Adv. Comput. Sci. Appl. 2023, 14, 401–407. [Google Scholar] [CrossRef]
  32. Fransen, K.; Van Eekelen, J. Efficient path planning for automated guided vehicles using A (Astar) algorithm incorporating turning costs in search heuristic. Int. J. Prod. Res. 2023, 61, 707–725. [Google Scholar] [CrossRef]
  33. Soleimanian Gharehchopogh, F.; Namazi, M.H.; Ebrahimi, L.; Abdollahzadeh, B. Advances in Sparrow Search Algorithm: A comprehensive survey. Arch. Comput. Methods Eng. 2022, 30, 427–455. [Google Scholar] [CrossRef]
  34. Dinesh, K.; Kumar, S.V.N.S. Energy-efficient trust-aware secured neuro-fuzzy clustering with sparrow search optimization in wireless sensor network. Int. J. Inf. Secur. 2024, 23, 199–223. [Google Scholar] [CrossRef]
  35. Ikkurthi Bhanu, P.; Saumitra, G.; Yogita; Singh, Y.S.; Pal, V. HCM: A hierarchical clustering framework with MOORA based cluster head selection approach for energy efficient wireless sensor networks. Microsyst. Technol. 2024, 30, 393–409. [Google Scholar]
  36. Alhijaj, A.; Khuder, B.A.Q.; Alshawi, I. Fuzzy Data Aggregation Approach to Enhance Energy-Efficient Routing Protocol for HWSNs-Efficient Routing Protocol for HWSNs. Informatica 2022, 46, 45–47. [Google Scholar]
  37. Ustun, D.; Erkan, U.; Toktas, A.; Lai, Q.; Yang, L. 2D hyperchaotic Styblinski-Tang map for image encryption and its hardware implementation. Multimed. Tools Appl. 2024, 83, 34759–34772. [Google Scholar] [CrossRef]
  38. Meenakshi, N.; Ahmad, S.; Prabu, A.V.; Rao, J.N.; Othman, N.A.; Abdeljaber, H.A.M.; Sekar, R.; Nazeer, J. Efficient Communication in Wireless Sensor Networks Using Optimized Energy Efficient Engroove Leach Clustering Protocol. Tsinghua Sci. Technol. 2024, 29, 985–1001. [Google Scholar] [CrossRef]
Figure 1. Network topology model.
Electronics 14 03421 g001
Figure 2. Emergency communication network mode.
Electronics 14 03421 g002
Figure 3. Three-layer network model.
Electronics 14 03421 g003
Figure 4. Flowchart of cluster head selection using the CM-WaOA.
Electronics 14 03421 g004
Figure 5. Comparison of data flow directions.
Electronics 14 03421 g005
Figure 6. Midline theorem model diagram.
Electronics 14 03421 g006
Figure 7. Multi-hop transmission node selection model.
Electronics 14 03421 g007
Figure 8. Flowchart of the CM-WaOA.
Electronics 14 03421 g008
Figure 9. Variation in residual energy in the emergency communication network.
Electronics 14 03421 g009
Figure 10. Variations in the number of dead nodes.
Electronics 14 03421 g010
Figure 11. Variations in the number of surviving nodes.
Electronics 14 03421 g011
Figure 12. Change in the transmission distance of nodes.
Electronics 14 03421 g012
Table 1. Evaluation of distinct categories of agreement.
ModelAlgorithmAdvantagesDisadvantages
Threshold protocolLEACH.2000 [9]The algorithm is relatively simple, and it selects the coarse head by calculating the threshold.The selection of cluster heads through the calculation of thresholds, with a random selection probability, will lead to an unreasonable distribution of cluster heads.
CHP-LEACH.2024 [10]
MAX LEACH.2023 [11]
Machine learning protocolLEACH-SA.2023 [12]Selecting the appropriate cluster heads through swarm intelligence algorithms.Using swarm intelligence algorithms to select cluster heads may result in uneven distribution of cluster head positions, which can lead to excessive energy drain during transmission.
Mishra Rashmi.2023 [13]
CGWOA.2024 [14]
Non-uniform protocolEEUC.2005 [15]Different numbers of nodes and cluster heads within the cluster can prevent the cluster head nodes from dying prematurely.The difference in the number of nodes within a cluster may result in significant variations in energy drain among different clusters.
ECSSEEC.2023 [16]
EBPY-CRA.2024 [17]
Table 2. Wireless sensor network and Walrus Optimization Algorithm comparison.
WSNCM-WaOA
Number of sensor nodesSize and position
Node groupsAll combinations of preselected cluster heads
Cluster head node combinationsBest positions of walrus individuals
All combinations of preselected cluster headsAll positions in the walrus population
Table 3. Data parameters.
K Transmission Direction
K > 0 Move away from the best solution toward X worst , t , exploring new paths.
K < 0 Move   closer   to   the   best   solution   toward   X worst , t , fine-tuning the path.
K = 0 Make no directional change, relying solely on random perturbations.
Table 4. Data parameters.
ParameterValue
Total number of sensor nodes100
Network coverage area800 × 800 m2
Base station coordinates(400,400)
Energy loss coefficient (free-space model) 10   p J /bit/m2
Energy loss coefficient (multipath model) 0.0013   p J /bit/m2
Initial node energy4 J
Number of network operation rounds1000 rounds
Table 5. Analysis of the count of active nodes across various iterations.
Area SizeRoundLEACHCGWOAEEUCEBPT-CRACM-WaOA
1000 × 10000r100100100100100
500r03379993
1000r0253562
800 × 8000r100100100100100
500r04810027100
1000r040682093
600 × 6000r100100100100100
500r318010042100
1000r26710027100
Disclaimer/Publisher’s Note: The statements, opinions and data contained in all publications are solely those of the individual author(s) and contributor(s) and not of MDPI and/or the editor(s). MDPI and/or the editor(s) disclaim responsibility for any injury to people or property resulting from any ideas, methods, instructions or products referred to in the content.