Article

Resilience Enhancement for Power System State Estimation Against FDIAs with Moving Target Defense

1
Information Center, Guizhou Power Grid Co. Ltd., Guiyang 550002, China
2
School of Big Data and Software Engineering, Chongqing University, Chongqing 400044, China
3
Zhejiang Institute of Industry and Information Technology, Hangzhou 310012, China
4
State Key Laboratory of Public Big Data, College of Computer Science and Technology, Guizhou University, Guiyang 550025, China
*
Author to whom correspondence should be addressed.
Electronics 2025, 14(17), 3367; https://doi.org/10.3390/electronics14173367
Submission received: 14 July 2025 / Revised: 18 August 2025 / Accepted: 20 August 2025 / Published: 25 August 2025

Abstract

False data injection attack (FDIA) by tampering with the sensor measurements is a big threat to the system’s observability. Power system state estimation (PSSE) is a critical observing function challenged by FDIAs in terms of its resiliency. Therefore, in this paper, we analyze the effectiveness of moving target defense (MTD) in enhancing the resiliency of PSSE against FDIAs. To begin with, the resiliency factor of PSSE against FDIAs is quantified using the relative estimation error against the injected measurement error. Then, the MTD is strategically designed to improve the resiliency factor by changing the line parameter and measurement case, for which the analytical results are provided. Furthermore, the infrastructure and operation costs caused by MTD are optimized to construct a cost-effective MTD. Finally, extensive simulations are conducted to validate the effectiveness of MTD in enhancing PSSE’s resiliency against FDIAs, which show that the MTD can improve the system’s resiliency factor by 10–20% and the generation cost can be reduced by about 10 USD/MWh after MTD.

1. Introduction

Power system state estimation (PSSE) is a critical function for the efficient operation and control of the modern power system. It is supported by the wide area monitoring system that is realized through the information and communication infrastructure. A typical example is supervisory control and data acquisition (SCADA), which monitors and controls the modern power system. However, the vulnerabilities exposed in the network and devices make the power system prone to cyberattacks [1]. Recent attack events (such as the BlackEnergy [2] and cyberattack during the two-country war (Pak military says it “paralyzed 70% of India’s power grid,” with further verification needed, but power facilities are vulnerable targets: expert, https://www.globaltimes.cn/page/202505/1333740.shtml (accessed on 19 August 2025))) have demonstrated the cyber risk of power systems. Therefore, a natural derivation is that PSSE can be attacked by cyber intrusions.
False data injection attack (FDIA) is a typical cyberattack that has attracted attention for more than a decade [3]. The attacker injects malicious errors into the sensor measurements to cause biases in the state estimates of PSSE [4]. As the data authenticity is destroyed, the downstream functions are affected. The typical FDIAs include error injection [5,6], load-altering attack [7], stealthy attack [8,9], and adversarial attack [10]. For the error injection attack, the attacker injects errors into the measurements or control commands with the goal to affect the system operation and control. Zhang et al. [11] proposed an attack that targets the load frequency control system by injecting errors into the control command of the capacitor compensation device. For the load-altering attack, the attacker modifies the load measurements to cause an increase in generation cost and/or nodal prices. Alaa and Zhao [12] developed a testbed with a cyber–physical setting and a real-time digital simulator to evaluate the impact of load-altering attack on the topology control. For the stealthy attack, the attacker aims to coordinate multiple attacks to bypass the anomaly detector. Zhang et al. [13] coordinated the time-delay and false data injection attacks to conceal the impact of either attack on the frequency control system. For the adversarial attack, the attacker aims to thwart machine-learning-based power system applications. Therefore, the power system is vulnerable to FDIAs. The attack can cause economic loss by injecting false consumption and generation information [14]. The resiliency of PSSE against FDIAs must be investigated for enhancing the system’s security.
Moving target defense (MTD) is a typical defense approach against FDIAs. The MTD can be designed by perturbing the physical parameters of the system topology [15] and the communication channels of the communication network [16]. PSSE is a typical protection target with MTD [17]. The basic insight of MTD is to change the attack space and increase the information uncertainty for potential attackers. It enables the defender to create, analyze, evaluate, and deploy mechanisms and strategies that are diverse and that continually shift and change over time to increase the complexity and cost for attackers, limit the exposure of vulnerabilities and opportunities for attack, and increase system resiliency. However, most existing studies focus on the design of MTD for detecting FDIAs from the information layer. Since MTD changes the power network and/or communication network, it also induces an intrinsic enhancement of defense capability (i.e., resiliency) against FDIAs. In our opinion, the related investigation is necessary and worthy for the further implementation of MTD.
Therefore, in this paper, we analyze the effectiveness of MTD in enhancing the resiliency of PSSE, aiming to minimize its deployment cost. Although the deployment cost of MTD has been discussed in [18], the performance constraints are different since the existing studies mainly consider the attack detection constraint. The resiliency is a new metric for quantifying the effectiveness of MTD. Our idea is to analyze the sensitivity of PSSE against FDIAs before and after MTD. The upper bound is derived to measure the change in the relative error against the injection error. The deployment cost of MTD considers two aspects: infrastructure cost and operation cost. The infrastructure cost acts as the constraint for optimizing the operation cost. Overall, the contributions are fourfold:
  • First, we use a new metric (i.e., resiliency) to quantify the effectiveness of MTD in defending against FDIAs.
  • Second, the analytical upper bounds for the resiliency of PSSE against FDIAs under different MTD scenarios are derived.
  • Third, the deployment cost of MTD is optimized to realize a cost-effective defense strategy.
  • Fourth, extensive simulations are conducted to validate the performance of MTD in enhancing the resiliency of PSSE against FDIAs.
The remainder of this paper is organized as follows. We introduce the system model and attack model in Section 2. The resiliency enhancement and cost optimization for MTD are analyzed in Section 3. The simulation results are provided in Section 4. Section 6 concludes the paper. The abbreviations used in this paper are given in the Abbreviations list.

2. System Model and Attack Model

PSSE is introduced for the background knowledge, and the attack model can help the following derivations. The model is constructed according to the power transmission network, which is formed by transmission lines (shortened by “line”) and buses. PSSE is used to estimate the voltage phase angles of buses.

2.1. System Model

With the DC model [19], the power flow equations are usually modeled as
F i j = B i j ( β i β j ) , P i = j F i F i j ,
where F i j is the power flow from bus i to bus j, B i j is the equivalent susceptance (reciprocal of the reactance) of line { i , j } , β i are the voltage phase angles of bus i, P i is the power injection of bus i, and F i are neighboring buses connected to bus i. Suppose that the lines form a set L { l 1 , l 2 , , l n } and the buses form a set M { 1 , 2 , , m + 1 } by making bus 1 the reference bus. The remaining n voltage phase angles are β 1 , β 2 , , β n . These variables are denoted by X R n and estimated by PSSE. The line l k = { i , j } forms the connection between bus i and bus j. The measurement function is formulated as
Z = M X + ζ .
where M is the measurement matrix and Z are measurements of power injections and/or power flows.

2.2. Formulation of the Measurement Matrix

The measurement matrix is constructed according to the line–bus incidence matrix and the diagonal line susceptance matrix. The line–bus incidence matrix E R n × ( m + 1 ) is formed by
E k i = 1 , start from bus i ; 1 , end at bus i ; 0 , otherwise ,
where E k i is the element at position ( k , i ) of the matrix E and k is the index of the transmission line. Normally, by selecting the first bus as the reference bus, the size of the matrix E is n × m . For the diagonal line susceptance matrix S R n × n , its element S k k is B i j for line l k = { i , j } . Thus, we can derive the following matrices:
B = E T S E , H = S E ,
where B is an m × m matrix and H is an n × m matrix. Actually, we have
F = H X , P = B X ,
in which F and P are vectors of power flows and power injections, respectively. Suppose that all transmission lines and buses are measured; then, we have a measurement matrix like
M full = B H H T .
It should be noted that any measurement matrix M is extracted from the measurement matrix M full by selecting some rows. The measurement matrix M usually has a full column rank. In other words, the measurement matrix M is formed by choosing a measurement set M ; that is,
M = M M full .
For example, there are some transmission lines being monitored while others are not. The vector of power flows F is not fully formed. If only the power flows are measured, then we have
M = M L full .

2.3. Power System State Estimation

PSSE is computed based on the measurement model (2) with the least square method. The voltage phase angles are estimated as
X ^ = M T Q M 1 M T Q Z ,
where Q is covariance matrix of the measurement noise. Here, we give the definition of the resiliency of PSSE.
Definition 1. 
The resiliency of PSSE is computed according to the estimation error Δ X ^ caused by the disturbance Δ Z injected by the attacker, i.e.,
Δ X ^ X ^ = σ Δ Z Z ,
where σ ( ) is a function of the relative error and is any norm of the vector.

2.4. Attack Model

Before introducing the attack model, we introduce the attack on the Ukrainian power grid [2]. The details of the attack are as follows:
  • Initial Access: The attackers gained access to the corporate networks of three Ukrainian energy distribution companies through spear-phishing emails containing the BlackEnergy 3 malware. This initial compromise occurred months before the actual attack, allowing the hackers to conduct reconnaissance.
  • Reconnaissance and Planning: Over several months, the attackers used the malware to map out the networks, steal credentials, and identify vulnerabilities. They moved from the corporate IT networks to the operational technology (OT) networks that control the power grid’s physical components.
  • The Attack Phase: On the day of the attack, the hackers remotely took control of the supervisory control and data acquisition (SCADA) systems at the utility companies’ control centers. They used the operators’ human–machine interfaces (HMIs) to open circuit breakers at about 30 substations, causing a blackout for over 230,000 customers in the Ivano-Frankivsk region.
  • Other coordinated attacks: The attacker wiped data from servers and workstations using KillDisk malware and flooded the customer service call centers with fake calls in a denial-of-service (DoS) attack, preventing customers from reporting the outage.
The attack resulted in a power outage that lasted from one to six hours, affecting hundreds of thousands of people during the holiday season. From this attack example, we find that the attacker has the capability of executing the FDIA. As modern power systems integrate solar photovoltaics (PVs), wind farms, fuel cells (FCs), and battery chargers (BCs), Kamel et al. [20] proposed a two-control system approach to manage uncertainty and maintain the system’s stability. On the other hand, in this paper, our goal is to enhance the resiliency of power system state estimation against FDIAs.
As given in [21], the vulnerability of the communication network always exists due to the unavoidable flaws in the digital devices and systems. The cyberattack event that happened in Ukraine demonstrates the weakness of the grid’s information and communication infrastructure against attacks. In this paper, we mainly consider that the sensor measurements are targeted and modified by the attacker. As for the typical FDIA, it is formulated into three types:
  • Random FDIA (R-FDIA): A random error ω r is injected into the measurement, i.e.,
    Z a = Z + ω r .
  • Noise-based FDIA (N-FDIA): A very small error ω s is injected into the measurement with the attempt to avoid being detected, i.e.,
    Z a = Z + ω s .
  • Stealthy FDIA (S-FDIA): A strategically designed error M ω d is injected into the measurement with the attempt to bypass the bad data detector (BDD), i.e.,
    Z a = Z + M ω d .
For the random FDIA, the attacker has the capability of compromising the sensor measurements; however, they do not know how to modify the measurement due to the limited knowledge of the system. For the noise-based FDIA, the attacker has the capability of compromising the sensor measurement and observing that the measurement has noise. The attacker can manipulate the sensor measurement by injecting the error following the noise distribution. For the stealthy FDIA, the attacker not only has the capability of compromising the sensor measurement but also has full knowledge of the system parameters. This is a powerful attack that can hide the abnormal measurement in the normal measurements. Therefore, these three attacks indicate that the attacker has stronger and stronger capabilities.

3. Resiliency Enhancement for PSSE with Moving Target Defense

In this section, we prove that the moving target defense (MTD) can enhance the resiliency of PSSE. Zhao et al. [22] improved the resilience of the renewable-energy-integrated system by protecting critical nodes and deploying energy storage nodes. However, our goal is to improve PSSE’s resiliency by strategically designing the MTD.

3.1. Moving Target Defense

The main function of MTD is to increase uncertainty for attackers. The unexpected change can make the attacker lose invisibility after MTD. In power systems, there are two types of MTD: physical MTD (pMTD) and network MTD (nMTD). These two kinds of MTD are introduced as follows.
pMTD: The flexible alternating current transmission system (FACTS) is usually used to eliminate the electricity transmission constraints and bottlenecks, which works by modifying the reactances of transmission lines [23]. It is used to construct the MTD by changing the line susceptance [24]. The MTD is used for defending against S-FDIAs based on the idea that the attacker can only know the old measurement matrix while the new one is created by MTD and not expected by the attacker [15]. Suppose that the susceptance of line l k = { i , j } is modified. Then, the parameters are changed successively; that is,
Choose l k for MTD B i j is changed M is changed correspondingly M pMTD
nMTD: The network traffic can be controlled and redirect in a dynamic manner. As the measurements are collected from RTUs, IEDs, and/or PMUs, these communication traffic flaws can be periodically selected and forwarded to the control center for PSSE. In that case, the measurement set M can be changed by the defender to enhance the resiliency of PSSE. By denoting the measurement set M MTD for N-MTD, the measurement matrix is constructed as
M nMTD = M M MTD full .
With the change in the measurement set, the unexpected changes cause the attack to fail or be detected.

3.2. Resiliency Enhancement with MTD

According to Definition 1, the resiliency of PSSE is considered as the relative error against the error injected into the measurement. Here, we consider two cases to enhance the resiliency of PSSE with MTD.

3.2.1. Fully Measured Power Injections

First, we consider that the power injections of buses are fully measured. In other words, the vector of power injections P is complete. Therefore, we have
P = B X .
Since the matrix B is symmetric invertible (can be proved using (3) to (5)), we can estimate the state variables as
X ^ = B 1 P .
Considering that the power injections are measurements, the estimation results are sensitive to the measurement error. Supposing that the error of FDIA injected into the measurement of power injection is Δ P , we have
P att = P + Δ P .
In the following, we analyze the resiliency of PSSE against the general FDIA (including R-FDIA, N-FDIA, and S-FDIA). Suppose that the estimation error caused by FDIA is Δ X ^ ; then, we have
P + Δ P = B ( X + Δ X ^ ) .
Thus, we can derive that
Δ X ^ = B 1 Δ P .
With (16) and (20), we can use the norm compatibility to obtain
P π B π X ^ π , Δ X ^ π B 1 π Δ P π ,
where π can be 0, 1, 2, and ∞; actually, it can be any norm. Hence, we can further derive that
Δ X ^ X ^ π B 1 π B π Δ P π P π .
From Definition (10), the resiliency of PSSE against FDIAs is closely related to the factor η = B 1 π B π : the smaller the factor η , the more resilient PSSE is against FDIAs. Therefore, we define η as the resiliency factor.
For the construction of matrix B = E T S E , we find that it is related to the system topology (the matrix E represents the connection relationship between transmission buses) and line parameters (the matrix S is formed by the line susceptance). According to Section 3, pMTD can change the line parameter and hence change the resiliency factor η ; that is, we have
Choose l k from a line set L pMTD for MTD B i j for all l k L pMTD is changed B is changed correspondingly The resiliency factor η is changed .
By denoting the measurement matrix and resiliency factor after pMTD as B ˜ and η pMTD , respectively, we have
η pMTD = B ˜ 1 π B ˜ π .
To enhance the resiliency of PSSE against FDIAs, we need to guarantee that
η pMTD < η .
Therefore, the effectiveness of pMTD for improving the resiliency of PSSE is given by
Δ η = η η pMTD < 0 .
The smaller the Δ η , the better designed the pMTD. Δ η is used as an indicator for the performance of the designed pMTD to defend against FDIAs. Given the first ( π = 1 ), second ( π = 2 ), and infinity ( π = ) norm as examples, we have
B 1 = max 1 j m i = 1 n B i j , B = max 1 i n j = 1 m B i j , B 2 = Trace ( B T B ) = Trace ( B B ) .
Suppose that the system topology is not changed; then, we can see that the resiliency factor is related to the line parameters (i.e., susceptance). If the line parameters are smaller after pMTD, then the resiliency of PSSE against FDIAs can be improved; that is, the pMTD should be designed as
B i j for l k = { i , j } L pMTD is reduced η pMTD < η Δ η < 0

3.2.2. Partially Measured Measurements

In a general case, the power flows and injections are partially measured. The measurement function refers to (2). Given a measurement set M , we have
Z = M M full X .
Similarly, we can derive the following resiliency results. Suppose that the measurement error caused by FDIAs is denoted by Δ Z and the estimation error is Δ X ^ ; then, we have
Z + Δ Z = M M full ( X + Δ X ^ )
Hence, by using the Moore–Penrose pseudoinverse of M M full , we can derive that
Δ X ^ = M ̲ M full Δ Z ,
where M ̲ M full is the Moore–Penrose pseudoinverse. Moore–Penrose pseudo-inverse is the most widely known generalization of the inverse matrix. The advantage of using the Moore–Penrose pseudo-inverse is that it can compute a “best fit” (least squares) approximate solution to a system of linear equations that lacks an exact solution [25]. From (29)–(31), we have
Z π M M full π X π , Δ Z π M M full π Δ X ^ π , Δ X ^ π M ̲ M full π Δ Z π .
Further, the resiliency of PSSE against FDIAs is given by
Δ X ^ π X π M ̲ M full π · M M full π · Δ Z π Z π .
From Definition 1, the resiliency factor in this measured case is
η = M ̲ M full π · M M full π .
Since M M full is constructed according to the line parameters and system topology, the pMTD and nMTD can be used to enhance the resiliency of PSSE. For the pMTD, it works similarly to the case given in Section 3.2.1. By changing the line parameters, the measurement matrix is changed accordingly. Thus, the resiliency factor is made smaller than that before pMTD. For the nMTD, it works by changing the measurement set. Suppose that the measurement set after nMTD is M nMTD ; then, the resiliency factor after nMTD is
η nMTD = M ̲ M nMTD full π · M M nMTD full π .
Therefore, the goal of designing an effective nMTD is to make the following term satisfied:
η nMTD < η .
By coordinating the pMTD and nMTD, we construct an MTD strategy to improve the resiliency of PSSE against FDIAs. In other words, the coordinated pMTD and nMTD results in the resiliency factor being
η MTD = M ˜ ̲ M nMTD full π · M ˜ M nMTD full π ,
where M ˜ M nMTD full denotes the measurement matrix in which the line parameters are changed. Therefore, our goal is to make
η MTD < η .
The effectiveness of the coordinated pMTD and nMTD is quantified as
Δ η = η η MTD < 0 .

3.3. Optimal MTD for Enhancing the Resiliency of PSSE

With the foregoing analysis, we have proved that the resiliency of PSSE against FDIAs can be enhanced by MTD. However, the deployment cost must be considered due to the impact of MTD on the system’s operation [26]. Typically, the deployment cost of MTD includes two parts: infrastructure cost and operation cost. For the infrastructure cost of pMTD, it is defined as the sum of the relative injected error of the line parameter; that is,
{ i , j } L pMTD Δ B i j B i j .
The line parameter of line { i , j } after pMTD is B ˜ i j = B i j + Δ B i j . For the infrastructure cost of nMTD, it is defined as the change in the measurement set; that is,
Δ M = M / M nMTD M nMTD / M ,
where the operation M / M nMTD means that the measurements are in M but not in M nMTD .
To economically operate the power system, the generation cost is minimized by solving the optimal power flow (OPF) problem with given loads. The OPF problem is usually formulated as
U 0 = min G U ( G )
s . t . G min G G max
G = D
F max S E B 1 P ˜ F max ,
in which, G is a vector of generations, D is a vector of loads, U 0 is the optimal generation cost, and U ( G ) represents a convex function of power generations, which is
G ( g ) = i = 1 q c i G i 2 + c i G i + c i ,
in which q is the number of generators and c i , c i , and c i are cost coefficients. If the i t h element of G is 0, it means that the corresponding bus does not connect to a generator. If the i t h element of D is 0, it means that the corresponding bus does not connect to any load. G min and G max are lower and upper limits of generation outputs. F max is a vector of positive congestion power flows. F = S E B 1 P ˜ is a vector of power flows. P ˜ is obtained by maintaining all but the first element of the vector P = G D . The constraint (43) denotes the generation limits. The constraint (44) represents the power balance between power generation and load. The constraint (45) indicates the transmission limits. We recognize that the change caused by MTD will affect the generation cost. Since U 0 is the minimum generation cost before MTD, the optimization of MTD can be formulated as
Δ U * = min G , B ˜ i j , { i , j } L pMTD U ( G ) U 0 s . t . ( 43 ) , ( 44 )
v min B ˜ i j / B i j v max , { i , j } L pMTD
F max S ˜ E ˜ B ˜ 1 P ˜ F max ,
{ i , j } L pMTD Δ B i j B i j ψ ,
Δ M γ ,
Δ η < 0 ,
in which Δ U * is the operation cost spent for deploying MTD, v min and v max are the limits for the susceptance change, ψ and γ are infrastructure costs, respectively, S ˜ , E ˜ , and B ˜ are matrices formed after pMTD and/or nMTD, and | Δ M | is the size of Δ M . The constraint (48) represents the limits of the line parameter change (in this paper, v min = 0.2 and v max = 0.2 ). The constraint (50) represents the limit of the infrastructure cost of pMTD. The constraint (51) represents the limit of the infrastructure cost of nMTD. The constraint (52) indicates the effectiveness of MTD. Therefore, the overall deployment cost for the optimal MTD is computed by
U MTD = C Δ U * , { i , j } L pMTD Δ B i j B i j , Δ M ,
in which C ( · ) is a function used to merge these costs with different units into one cost. To solve this problem, we use the q u a d p r o g and f m i n c o n packages in MATLAB (R2019b). However, the change in measurement set does not impact the generation cost. Therefore, the constraint (51) can be ignored for computing the optimization problem.

4. Simulation Results

Next, extensive simulations are conducted to validate the resiliency of PSSE and the effectiveness of MTD. The IEEE standard power systems are used to evaluate the theoretical results. The settings of the system topology, line parameters, and distribution of buses are extracted from MATPOWER (https://matpower.org/ (accessed on 19 August 2025)).

4.1. Resiliency Enhancement of PSSE After pMTD and nMTD

Here, we take the IEEE 30-bus power system as an example. The system is shown in Figure 1. The line parameters are given in Table 1, which provides two cases (case 1 is before pMTD and case 2 is after MTD).
First, the performance of pMTD is evaluated. The original susceptance values and those after pMTD are presented. Considering the 1-norm, 2-norm, and , the resiliency factors before pMTD and after pMTD are given in Table 2. With these two cases, the norm of the relative estimation error with respect to the norm of the measurement injection error is shown in Figure 2 before and after pMTD. From the second row of Table 2, the resiliency factor after pMTD is smaller than that before pMTD, while the results presented in Figure 2 show that the relative estimation error is smaller after pMTD, which is consistent with the indicator of the resiliency factors before and after pMTD. We can see that the designed pMTD can improve the resiliency of PSSE against FDIAs. The theoretical results in Section 3.2 are validated.
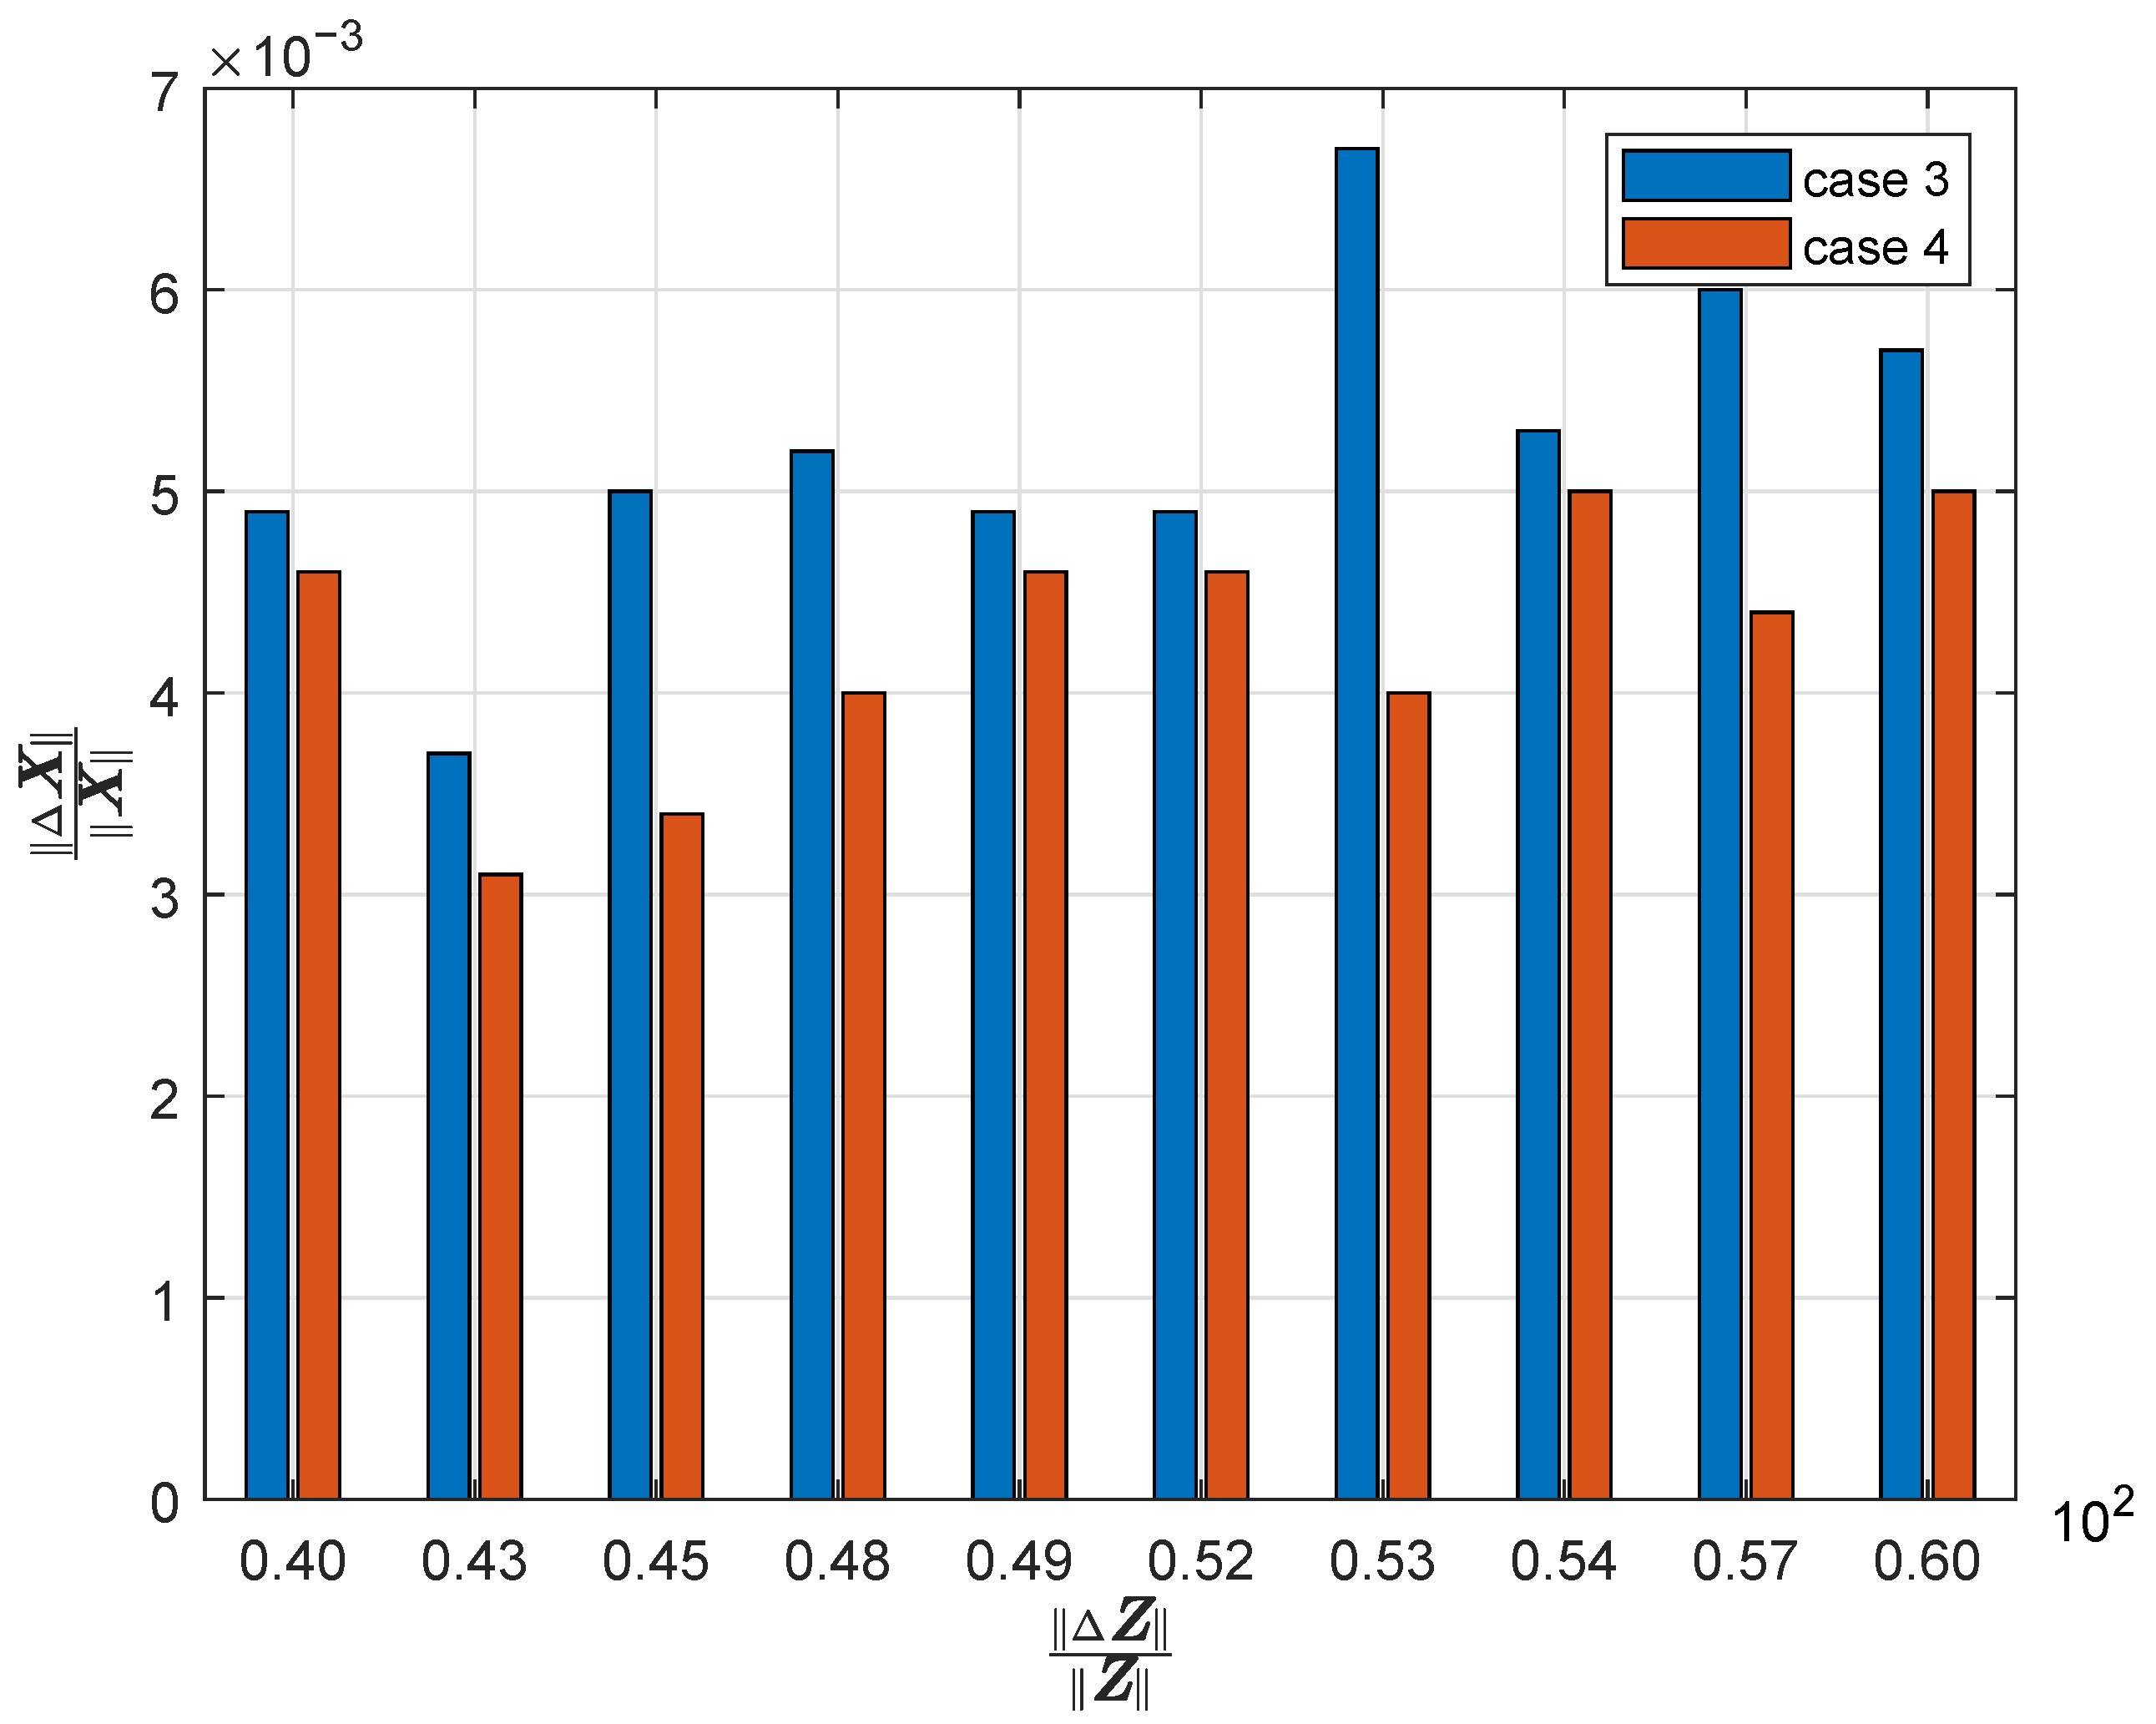
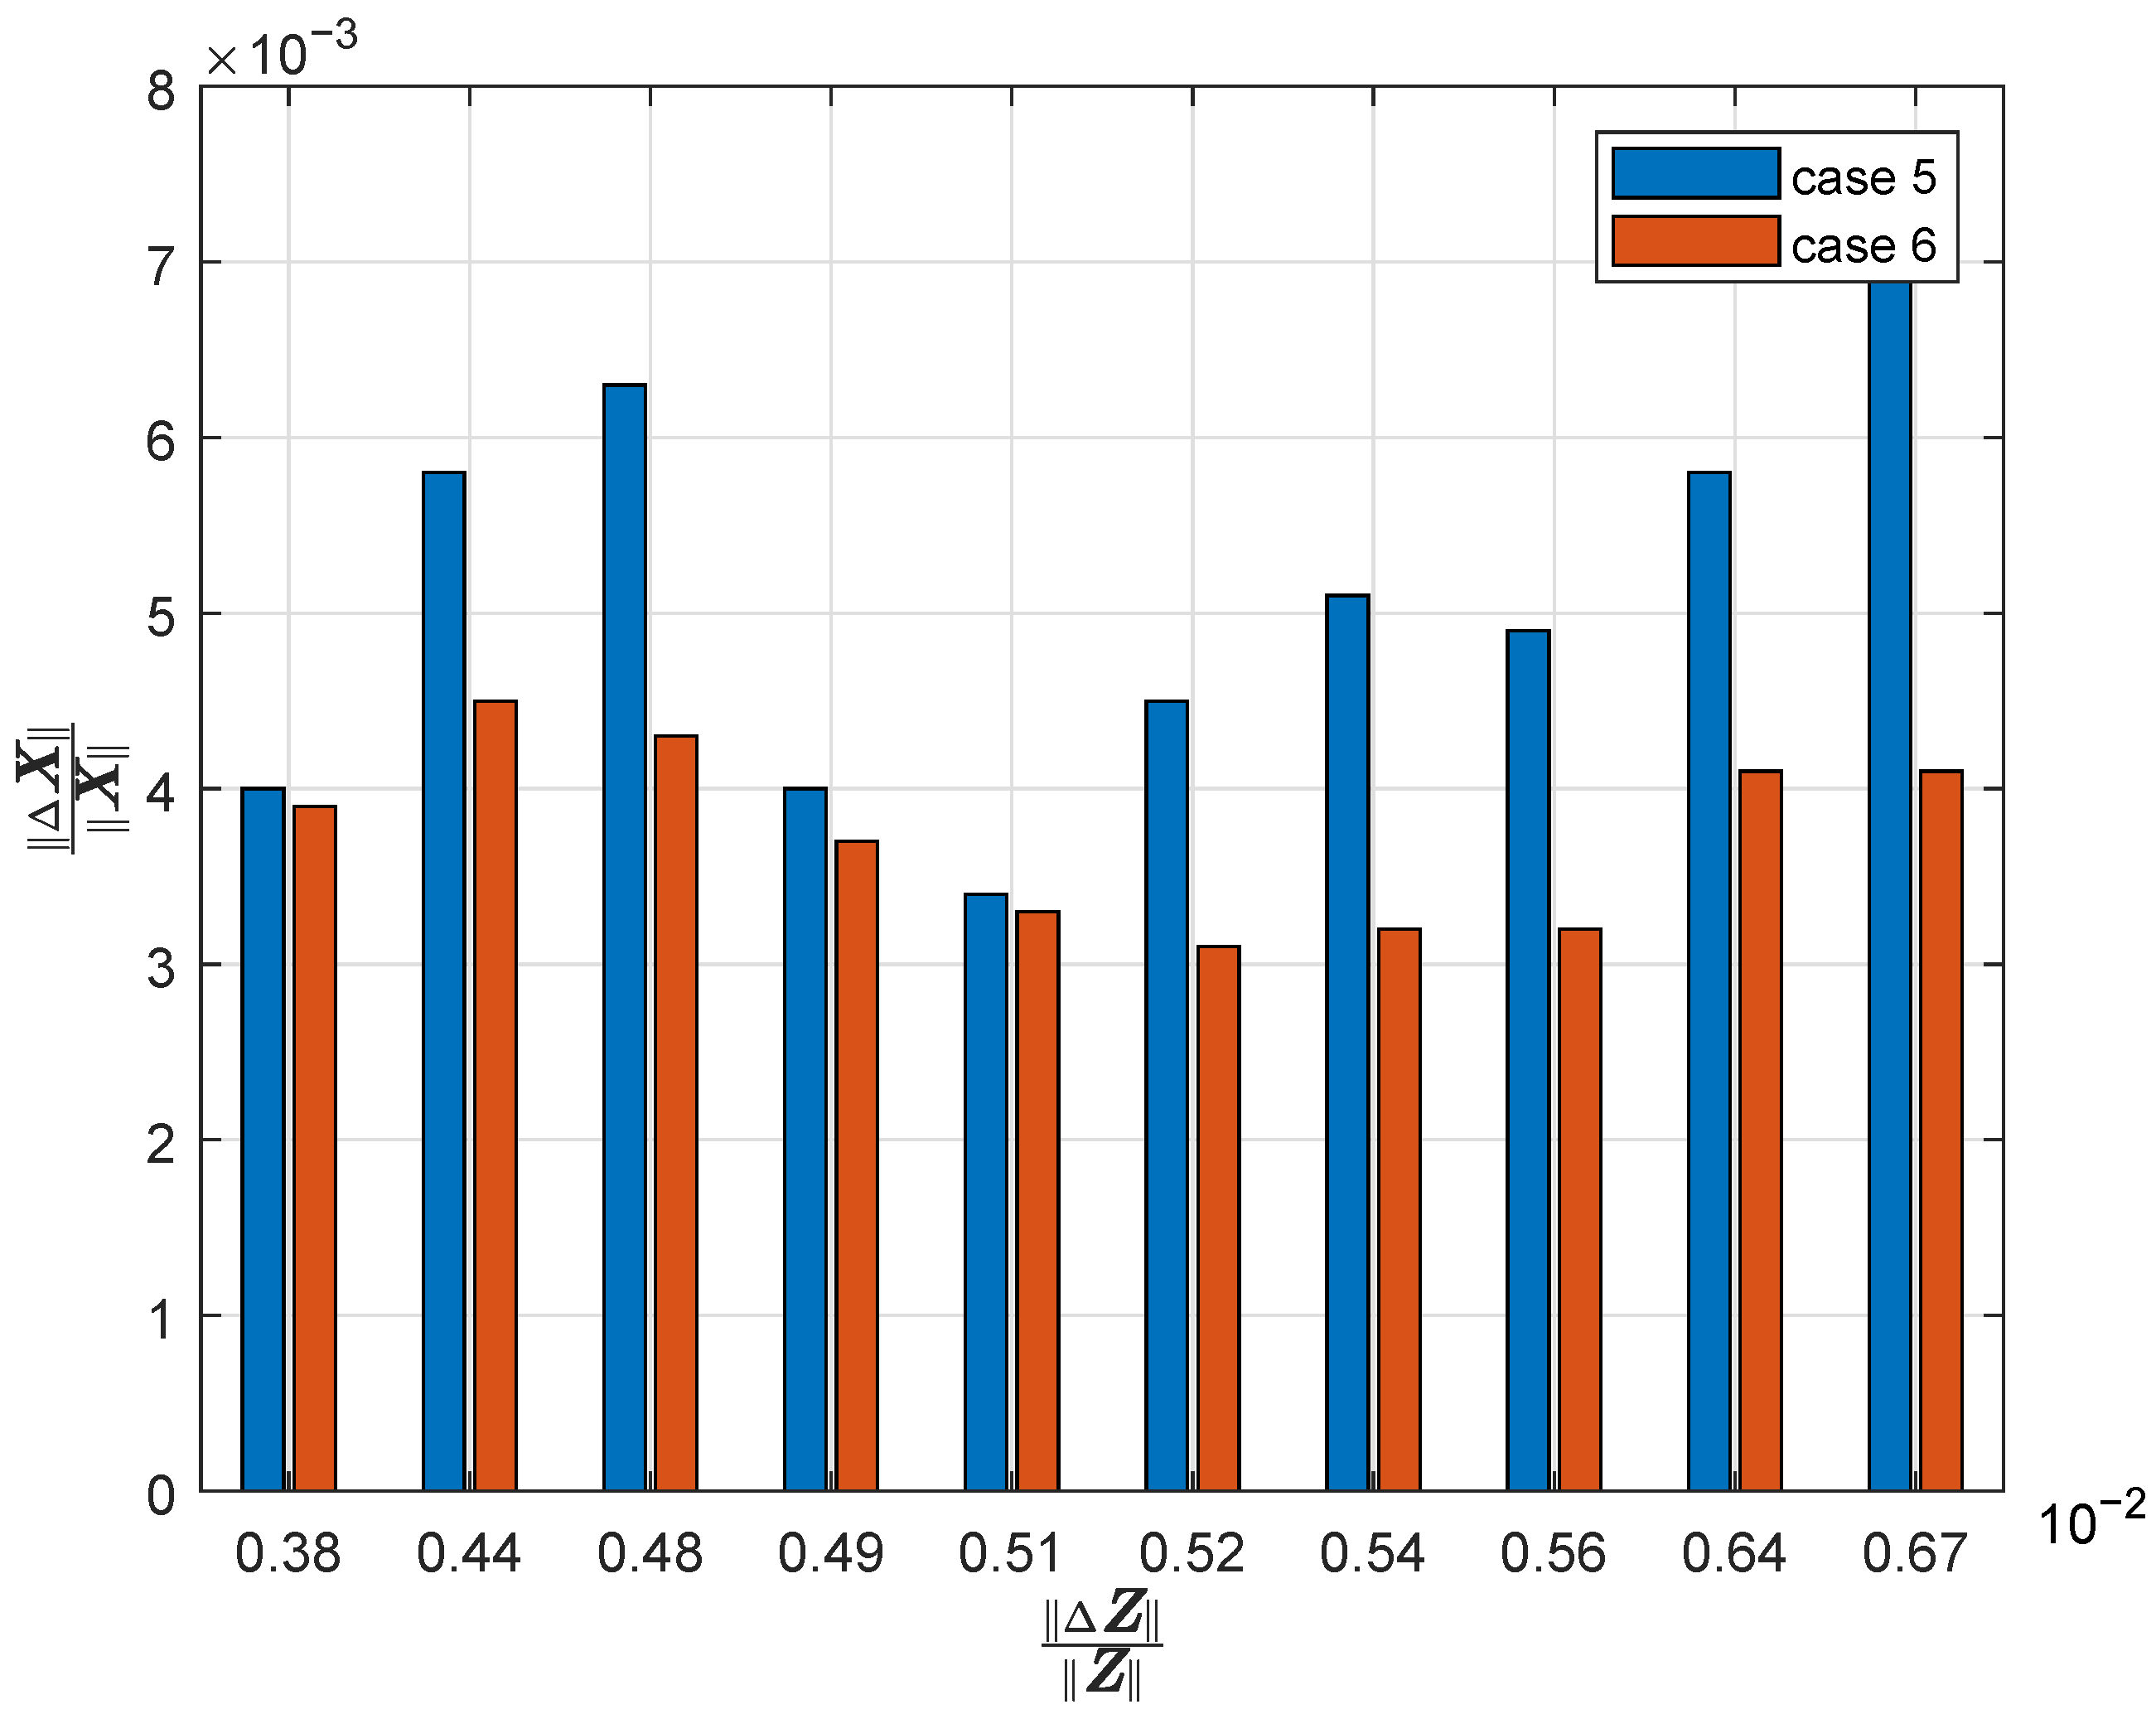
Second, the performance of nMTD is evaluated. The original measurement case is that all power flows and power injections are measured. The measurement set includes the set of power flows and the set of power injections. For designing the nMTD, the measurement set includes the set of all power flows and the measurements of power injections of buses 13, 18, 20, and 23. The resiliency factor before and after nMTD is 110.1516 and 103.0243, respectively. The resiliency factor after nMTD is smaller than that before nMTD. The norm of the relative estimation error with respect to the norm of the measurement injection error is shown in Figure 3 before and after nMTD. We can see that the relative estimation error is smaller after nMTD, which is consistent with the indicator of the resiliency factors before and after nMTD. We can see that the designed nMTD can improve the resiliency of PSSE against FDIAs. The theoretical results in Section 3.2 are validated.
Third, the performance of the coordinated pMTD and nMTD is evaluated. The parameters of these two MTDs are consistent with the above. The resiliency factors before and after the coordinated MTD are 110.1516 and 102.583, respectively. The resiliency factor after nMTD is smaller than that before MTD. The norm of the relative estimation error with respect to the norm of the measurement injection error is shown in Figure 4 before and after MTD. We can see that the relative estimation error is smaller after MTD, which is consistent with the indicator of the resiliency factors before and after MTD.
Moreover, the resiliency factors after the pMTD, nMTD, and coordinated pMTD and nMTD are shown in Table 3. We find that the resiliency factor after the coordinated pMTD and nMTD is the smallest. These results indicate that the coordinated pMTD and nMTD achieves the best performance in enhancing PSSE’s resiliency against FDIAs.

4.2. Optimal MTD for Enhancing the Resiliency of PSSE

Next, we evaluate the optimization performance for deploying the MTD. The IEEE 14-bus power system from MATPOWER is used. The line parameters and system topology are default settings. For constructing the pMTD, the susceptances of the 10th, 18th, and 19th transmission lines are changed. The parameter ψ is set as 0.15. The real-world data from the New York ISO (https://www.nyiso.com/load-data (accessed on 19 August 2025)) is adopted. The MTD is designed under different load scenarios. For the nMTD, the measurements are only power flows after nMTD, while those before nMTD are a fully measured case where all power flows and power injections are measured. Therefore, the resiliency factor before MTD is 39.7088.
The load change and resiliency factor after MTD are shown in Figure 5. We can see that although the load changes, the resiliency factor after MTD is always smaller than that before MTD. Actually, the resiliency factor is not affected by loads. Since the resiliency difference Δ η is smaller than 0, the designed MTD is effective.
The cost reduction is also shown in Figure 5. We find that although the infrastructure cost must be spent, the generation cost can be reduced. In other words, we can save the deployment costs by using the saved generation cost to pay for the infrastructure cost. For example, the generation cost can be maximally reduced −17.18 USD/MWh for all our tests. Therefore, we can design a cost-effective MTD for optimizing the defense and deployment cost.

5. Discussion

In this paper, we do not propose a new defense mechanism to replace MTD but rather introduce a novel framework to analyze, quantify, and optimize MTD from a resilience and cost-effectiveness standpoint. The advantages lie in shifting the security paradigm from reactive detection to proactive resilience, providing a new analytical metric for evaluation, and integrating economic optimization to ensure practical viability. We believe that these dimensions highlight the significant contributions of our study to the field. We will be sure to emphasize these comparisons more explicitly in a revised version of the manuscript. The comparison of the proposed method with existing methods is given in Table 4.

6. Conclusions

In this paper, we mainly analyzed the MTD’s capability in enhancing the resiliency of PSSE against FDIAs. First, we defined the resiliency of PSSE by measuring the sensitivity of the estimation error against the injection error. Second, we derived the upper bounds of the resiliency of PSSE against FDIAs before and after MTD, respectively, which were used to quantify the effectiveness of MTD. Third, the generation cost was optimized after MTD to realize a cost-effective MTD. Finally, we conducted extensive simulations to evaluate the performance of MTD in enhancing PSSE’s resiliency against FDIAs. Evidence has shown that the MTD can improve the system’s resiliency factor by 10–20% and the generation cost can be reduced by about 10 USD/MWh after MTD.

Author Contributions

Conceptualization, Z.Z. (Zeyuan Zhou) and J.B.; methodology, Z.Z. (Zeyuan Zhou) and Z.Z. (Zhenyong Zhang); software, Z.Z. (Zeyuan Zhou) and Z.Z. (Zhenyong Zhang); validation, Z.Z. (Zeyuan Zhou) and Z.Z. (Zhenyong Zhang); formal analysis, Z.Z. (Zeyuan Zhou) and Z.Z. (Zhenyong Zhang); investigation, Z.Z. (Zeyuan Zhou) and Z.Z. (Zhenyong Zhang); resources, Z.Z. (Zeyuan Zhou) and Z.Z. (Zhenyong Zhang); data curation, Z.Z. (Zeyuan Zhou) and Z.Z. (Zhenyong Zhang); writing—original draft preparation, Z.Z. (Zeyuan Zhou) and Z.Z. (Zhenyong Zhang); writing—review and editing, Z.Z. (Zeyuan Zhou) and Z.Z. (Zhenyong Zhang); visualization, Z.Z. (Zeyuan Zhou) and Z.Z. (Zhenyong Zhang); supervision, Z.Z. (Zeyuan Zhou) and Z.Z. (Zhenyong Zhang); project administration, Z.Z. (Zeyuan Zhou) and Z.Z. (Zhenyong Zhang); funding acquisition, Z.Z. (Zhenyong Zhang). All authors have read and agreed to the published version of the manuscript.

Funding

This work was funded by Major Scientific and Technological Special Project of Guizhou Province ([2024]014), by the National Natural Science Foundation of China under Grant 62302069, and by the Zhejiang Provincial Natural Science Foundation of China under Grant No. LQ24F030015.

Data Availability Statement

The original contributions presented in this study are included in the article. Further inquiries can be directed to the corresponding author.

Conflicts of Interest

Author Zeyuan Zhou was employed by the company Guizhou Power Grid Co. The remaining authors declare that the research was conducted in the absence of any commercial or financial relationships that could be construed as a potential conflict of interest.

Abbreviations

The following abbreviations are used in this manuscript:
FDIAfalse data injection attack
PSSEpower system state estimation
MTDmoving target defense
R-FDIArandom false data injection attack
N-FDIAnoise-based false data injection attack
S-FDIAstealthy false data injection attack
pMTDphysical moving target defense
nMTDnetwork moving target defense
OPFoptimal power flow
ISOindependent system operation
FACTSflexible alternating current transmission system

References

  1. Illera, A.G.; Vidal, J.V. Lights Off! The Darkness of the Smart Meters. 2014. Available online: http://youtube.be/Z_y_vjYtAWM (accessed on 19 August 2025).
  2. Geiger, M.; Bauer, J.; Masuch, M.; Franke, J. An Analysis of Black Energy 3, Crashoverride, and Trisis, Three Malware Approaches Targeting Operational Technology Systems. In Proceedings of the 25th IEEE International Conference on Emerging Technologies and Factory Automation, Vienna, Austria, 8–11 September 2020; pp. 1537–1543. [Google Scholar]
  3. Liang, G.; Zhao, J.; Luo, F.; Weller, S.R.; Dong, Z.Y. A Review of False Data Injection Attacks Against Modern Power Systems. IEEE Trans. Smart Grid 2017, 8, 1630–1638. [Google Scholar] [CrossRef]
  4. Yang, Q.; Yang, J.; Yu, W.; An, D.; Zhang, N.; Zhao, W. On false data-injection attacks against power system state estimation: Modeling and countermeasures. IEEE Trans. Parallel Distrib. Syst. 2014, 25, 717–729. [Google Scholar] [CrossRef]
  5. Usama, M.; Aman, M.N. Command Injection Attacks in Smart Grids: A Survey. IEEE Open J. Ind. App. 2024, 5, 75–85. [Google Scholar] [CrossRef]
  6. Zhang, Z.; Liu, M.; Sun, M.; Deng, R.; Cheng, P.; Niyato, D. Vulnerability of Machine Learning Approaches Applied in IoT-Based Smart Grid: A Review. IEEE Internet Things J. 2024, 11, 18951–18975. [Google Scholar] [CrossRef]
  7. Sayed, M.A.; Ghafouri, M.; Atallah, R.; Debbabi, M.; Assi, C. Grid Chaos: An uncertainty-conscious robust dynamic EV load-altering attack strategy on power grid stability. Appl. Energy 2024, 363, 122972. [Google Scholar] [CrossRef]
  8. Liu, Y.; Ning, P.; Reiter, M.K. False data injection attacks against state estimation in electric power grid. ACM Trans. Inform. Syst. Secur. 2011, 14, 13. [Google Scholar] [CrossRef]
  9. Rahman, M.A.; Datta, A. Impact of Stealthy Attacks on Optimal Power Flow: A Simulink-Driven Formal Analysis. IEEE Trans. Dependable Secur. Comput. 2020, 17, 451–464. [Google Scholar] [CrossRef]
  10. Huang, R.; Li, Y. Adversarial Attack Mitigation Strategy for Machine Learning-Based Network Attack Detection Model in Power System. IEEE Trans. Smart Grid 2023, 14, 2367–2376. [Google Scholar] [CrossRef]
  11. Zhang, Z.; Deng, R.; Tian, Y.; Cheng, P.; Ma, J. SPMA: Stealthy physics-manipulated attack and countermeasures in cyber-physical smart grid. IEEE Trans. Inf. Forensics Secur. 2022, 18, 581–596. [Google Scholar] [CrossRef]
  12. Selim, A.; Zhao, J. Cyber-Physical Testbed Integrating RTAC with RTDS for Game-Theoretic Topology Control Under Load Altering Attacks. In Proceedings of the 2024 IEEE Texas Power and Energy Conference, College Station, TX, USA, 12–13 February 2024; pp. 1–6. [Google Scholar]
  13. Zhang, Z.; Deng, R.; Cheng, P.; Wei, Q. On Feasibility of Coordinated Time-Delay and False Data Injection Attacks on Cyber–Physical Systems. IEEE Internet Things J. 2022, 9, 8720–8736. [Google Scholar] [CrossRef]
  14. Tang, D.; Fang, Y.-P.; Zio, E. Vulnerability analysis of demand-response with renewable energy integration in smart grids to cyber attacks and online detection methods. Reliab. Eng. Syst. Saf. 2023, 235, 109212. [Google Scholar] [CrossRef]
  15. Tian, J.; Tan, R.; Guan, X.; Liu, T. Enhanced Hidden Moving Target Defense in Smart Grids. IEEE Trans. Smart Grid 2018, 10, 2208–2223. [Google Scholar] [CrossRef]
  16. Hu, Y.; Zhu, P.; Xun, P.; Liu, B.; Kang, W.; Xiong, Y.; Shi, W. CPMTD: Cyber-physical moving target defense for hardening the security of power system against false data injected attack. Comput. Secur. 2024, 111, 102465. [Google Scholar] [CrossRef]
  17. Deng, R.; Xiao, G.; Lu, R.; Liang, H.; Vasilakos, A.V. False Data Injection on State Estimation in Power Systems Attacks, Impacts, and Defense: A Survey. IEEE Trans. Ind. Infrom. 2017, 13, 411–423. [Google Scholar] [CrossRef]
  18. Lakshminarayana, S.; Yau, D.K.Y. Cost-Benefit Analysis of Moving-Target Defense in Power Grids. IEEE Trans. Power Syst. 2021, 36, 1152–1163. [Google Scholar] [CrossRef]
  19. Wang, Z.-Y.; Chiang, H.-D. On the Feasibility of AC and DC Optimal Power Flow Models: Analytics and Comparison. In Proceedings of the IEEE Power Energy Society General Meeting, Washington, DC, USA, 26–29 July 2021; pp. 1–5. [Google Scholar]
  20. Kamel, O.M.; Elzein, I.; Mahmoud, M.M.; Abdelaziz, A.Y.; Hussein, M.M.; Diab, A. Effective energy management strategy with a novel design of fuzzy logic and JAYA-based controllers in isolated DC/AC microgrids: A comparative analysis. Wind Eng. 2024, 49, 199. [Google Scholar] [CrossRef]
  21. Ericsson, G.N. Cyber Security and Power System Communication—Essential Parts of a Smart Grid Infrastructure. IEEE Trans. Power Deliv. 2010, 25, 1501–1507. [Google Scholar] [CrossRef]
  22. Zhao, T.; Tu, H.; Jin, R.; Xia, Y.; Wang, F. Improving resilience of cyber–physical power systems against cyber attacks through strategic energy storage deployment. Reliab. Eng. Syst. Safety 2024, 252, 110438. [Google Scholar] [CrossRef]
  23. Divan, D.; Johal, H. Distributed FACTs: A new concept for realizing grid power flow control. IEEE Trans. Power Electron. 2007, 22, 2253–2260. [Google Scholar] [CrossRef]
  24. Liu, C.; Tang, Y.; Deng, R.; Zhou, M.; Du, W. Joint Meter Coding and Moving Target Defense for Detecting Stealthy False Data Injection Attacks in Power System State Estimation. IEEE Trans. Ind. Inform. 2024, 20, 3371–3381. [Google Scholar] [CrossRef]
  25. Penrose, R. On best approximate solution of linear matrix equations. Proc. Camb. Philos. Soc. 2008, 52, 17–19. [Google Scholar] [CrossRef]
  26. Condren, C.; Gedra, T.W.; Damrongkulkamjorn, P. Optimal power flow with expected security costs. IEEE Trans. Power Syst. 2006, 21, 541–547. [Google Scholar] [CrossRef]
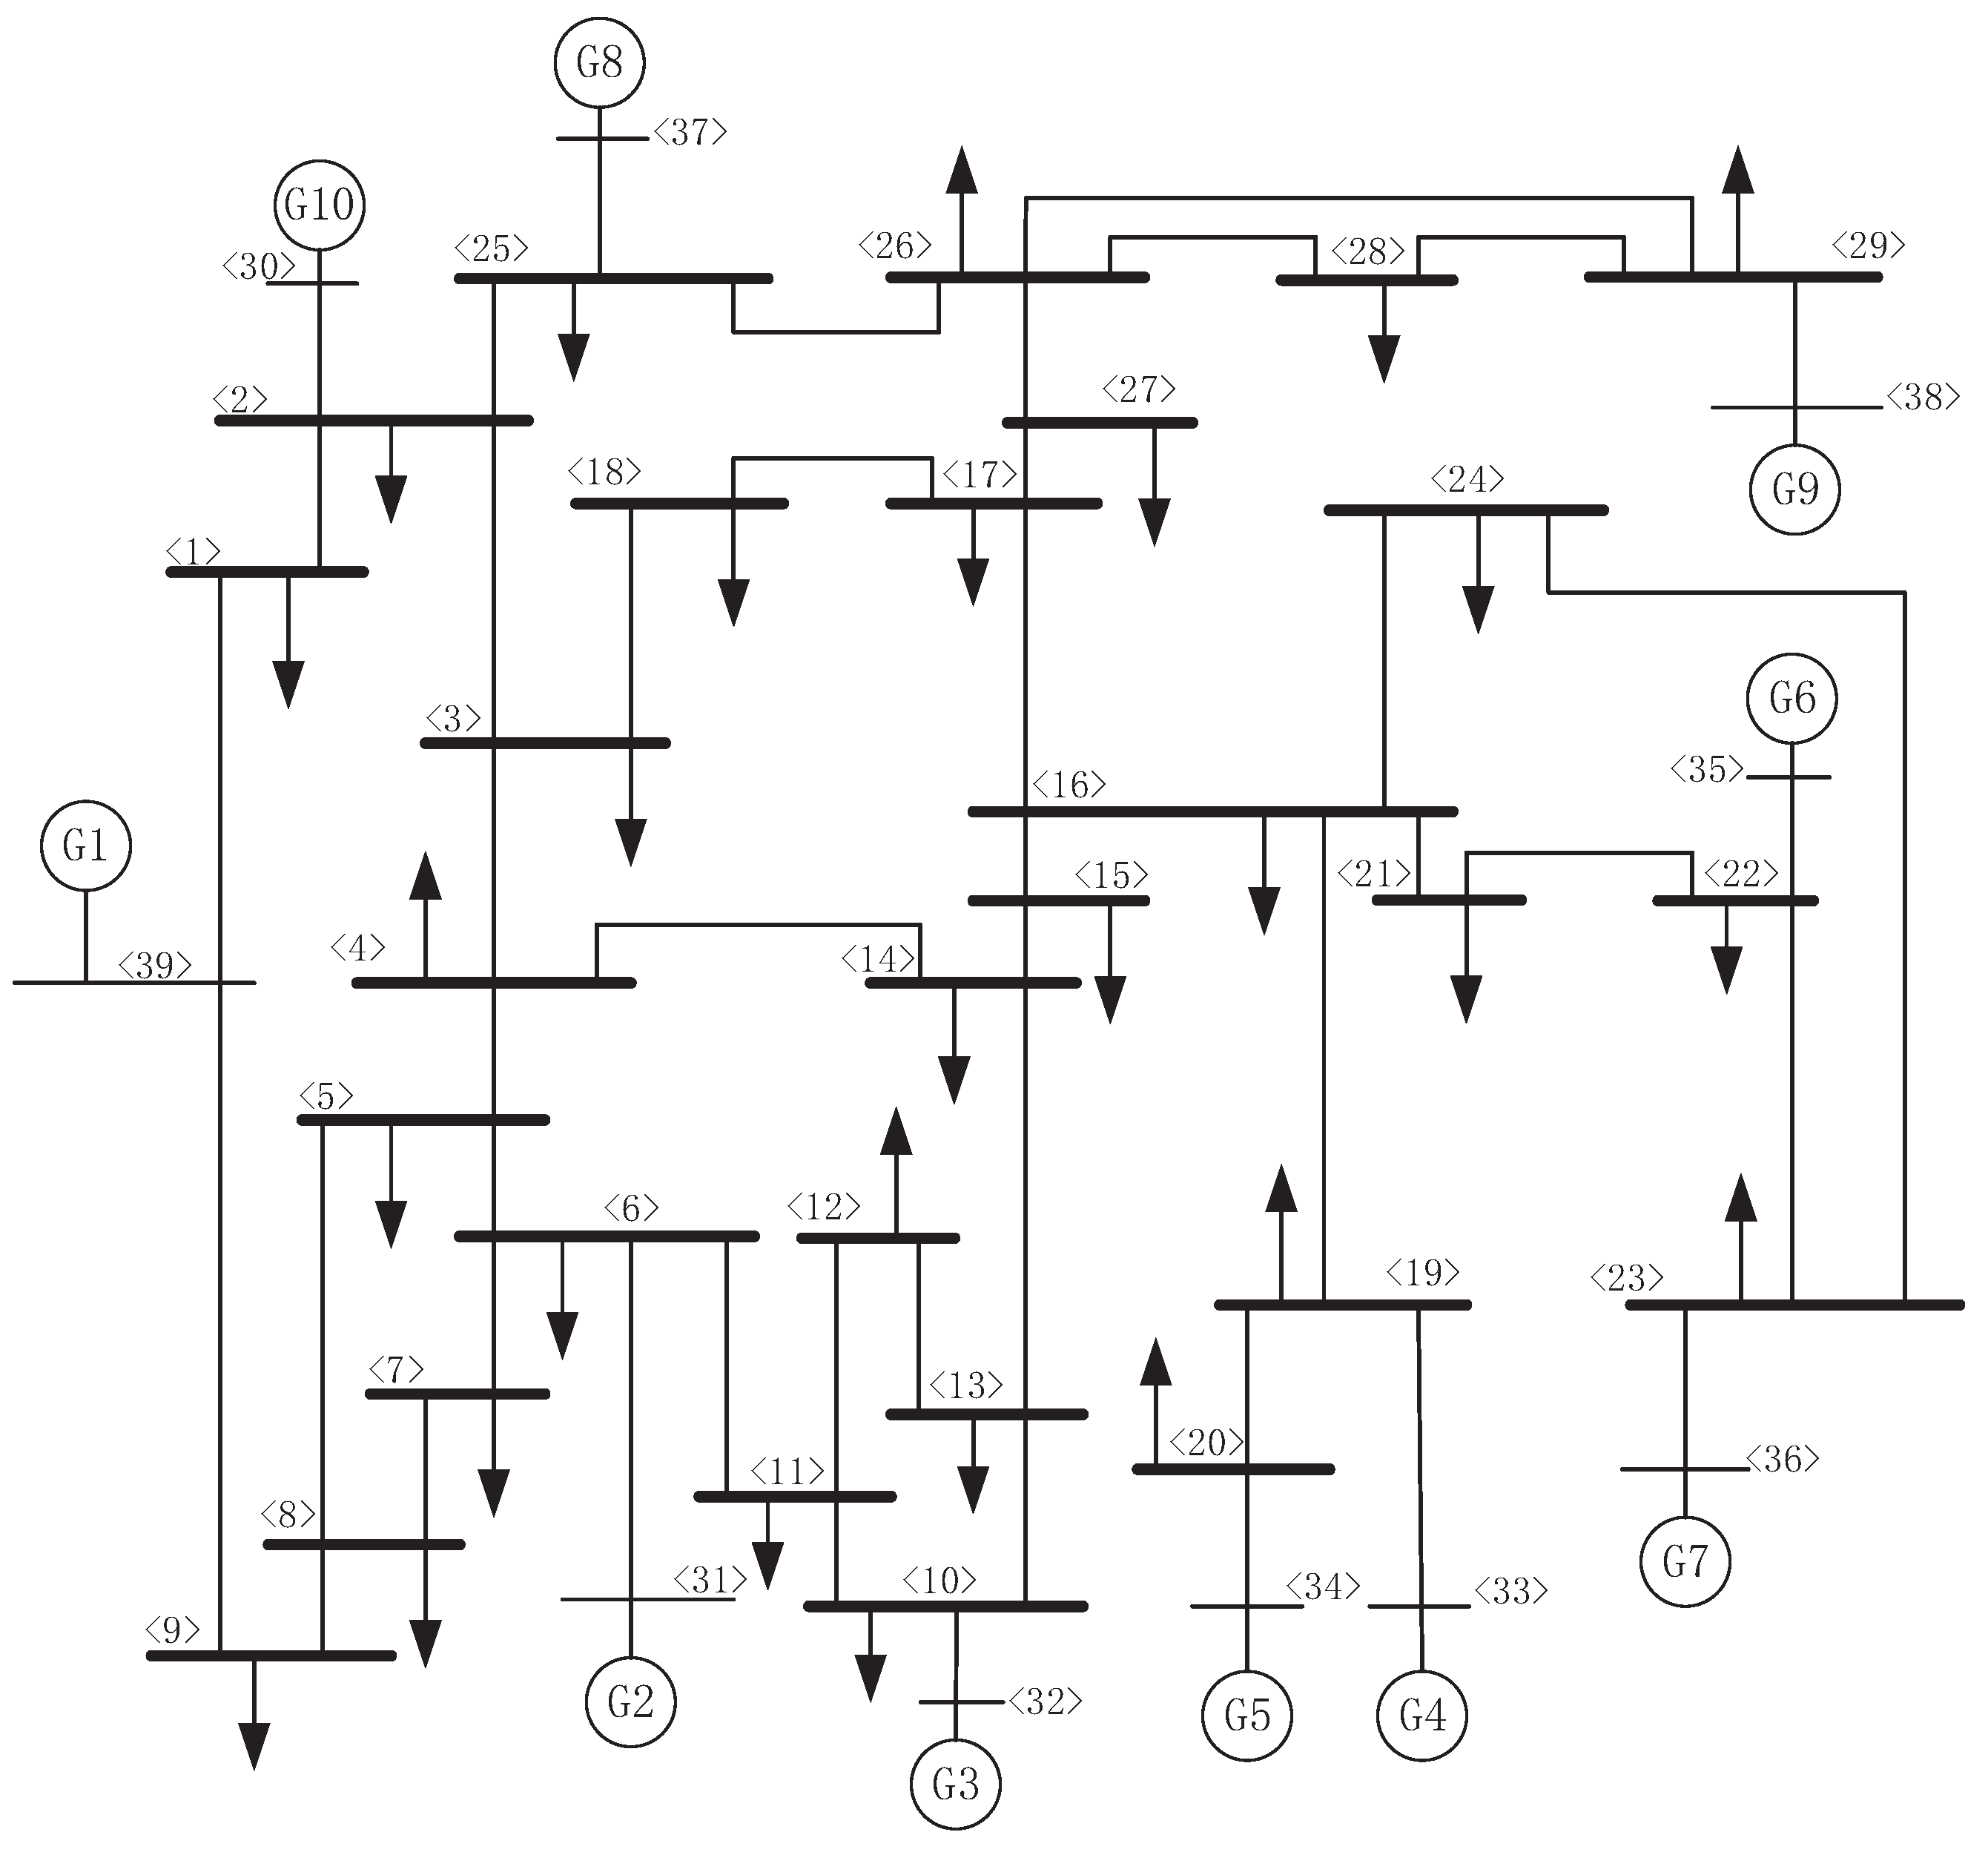
Figure 1. The IEEE 39-bus power system.
Electronics 14 03367 g001
Figure 2. Resiliency enhancement with the pMTD.
Electronics 14 03367 g002
Figure 3. Resilience enhancement with the nMTD.
Electronics 14 03367 g003
Figure 4. Resilience enhancement with the coordinated nMTD and pMTD.
Electronics 14 03367 g004
Figure 5. The resiliency factor before MTD, the resiliency factor after MTD, the load change, and the cost reduction after MTD with the IEEE 14-bus power system.
Electronics 14 03367 g005
Table 1. The branch susceptances in two different configuration cases.
LineSusceptances in Case 1 (Before pMTD)Susceptances in Case 2 (After pMTD)
l 1 16.6720
l 2 5.267.37
l 3 5.888.24
l 4 2525
l 5 55
l 6 5.565.56
l 7 255
l 8 8.331.67
l 9 12.512.5
l 10 2525
l 11 4.764.76
l 12 1.791.79
l 13 4.765.24
l 14 9.109.10
l 15 3.853.85
l 16 7.147.14
l 17 3.853.85
l 18 7.697.69
l 19 55
l 20 55
l 21 5.265.26
l 22 4.544.54
l 23 7.697.69
l 24 14.2911.43
l 25 4.764.76
l 26 12.512.5
l 27 14.2914.29
l 28 6.676
l 29 5050
l 30 55
l 31 5.565.56
l 32 3.703.70
l 33 3.033.03
l 34 2.632.63
l 35 4.764.76
l 36 2.52.5
l 37 2.382.38
l 38 1.671.67
l 39 2.222.22
l 40 55
l 41 16.677
Table 2. The resiliency factors before and after pMTD.
Resiliency FactorCase 1Case 2
π = 1 961.5342961.5342
π = 2 110.1516105.7965
π = 961.5342961.5342
Table 3. The resiliency factors before and after pMTD, nMTD, and the coordinated pMTD and nMTD.
Before MTDAfter pMTDAfter nMTDAfter the Coordinated pMTD and nMTD
110.1516105.7965103.0243102.583
Table 4. Comparing the proposed method with existing methods.
DimensionExisting MethodsProposed Method
Primary ObjectiveAttack detectionResilience enhancement
Evaluation MetricDetection Rate,
False alarm rate
“Resiliency Factor”
(quantifies system robustness)
Core ConceptMake attacks visible
to detectors
Minimize the impact of undetected attacks
Economic FocusCost as a constraint
(if considered)
Cost as an optimization objective
(cost-effective design with potential savings)
Disclaimer/Publisher’s Note: The statements, opinions and data contained in all publications are solely those of the individual author(s) and contributor(s) and not of MDPI and/or the editor(s). MDPI and/or the editor(s) disclaim responsibility for any injury to people or property resulting from any ideas, methods, instructions or products referred to in the content.