Article

Fast Identification of Series Arc Faults Based on Singular Spectrum Statistical Features

1
State Grid Hunan Electric Power Company Limited Power Supply Service Center (Metrology Center), Changsha 410000, China
2
Hunan Province Key Laboratory of Intelligent Electrical Measurement and Application Technology, Changsha 410004, China
3
China Electric Power Research Institute, Beijing 100048, China
4
College of Electrical and Information Engineering, Hunan University, Changsha 410082, China
*
Author to whom correspondence should be addressed.
Electronics 2025, 14(16), 3337; https://doi.org/10.3390/electronics14163337
Submission received: 13 July 2025 / Revised: 13 August 2025 / Accepted: 20 August 2025 / Published: 21 August 2025
(This article belongs to the Special Issue Data Analytics for Power System Operations)

Abstract

Series arc faults are a major cause of electrical fires, posing significant risks to life and property. Their negative-resistance characteristics make fault features difficult to detect, and the existing methods often suffer from high false-alarm rates, poor adaptability, and reliance on high sampling rates and long sampling windows. To enhance the accuracy and efficiency of series AC arc fault detection, this paper proposes a rapid identification method based on singular spectrum statistical features and a differential evolution-optimized XGBoost classifier. The approach first constructs the singular spectrum of current waveforms via a Hankel matrix singular value decomposition and extracts nine statistical features. It then optimizes seven XGBoost hyperparameters using differential evolution to build an efficient classification model. The experiments on 18,240 current samples covering 16 load conditions (including eight arc fault types) show that the method achieves an average identification accuracy of 98.90% using only three nominal cycles (60 ms) of current waveform. Even with a training set ratio as low as 5%, it maintains 97.11% accuracy, outperforming Back-propagation Neural Network, Support Vector Machine, and Recurrent Neural Network methods by up to three percentage points. The method avoids the need for high sampling rates or complex time–frequency transformations, making it suitable for resource-constrained embedded platforms and offering a generalizable solution for series arc fault detection.

1. Introduction

Electrical fires pose severe threats to life and property, garnering global concern. According to statistics, China alone recorded over 85,000 electrical fire incidents in 2020, accounting for 33.6% of total fire accidents [1]. With increasing electricity consumption and aging cable infrastructure, the incidence of electrical fires continues to rise [2]. Among all contributing factors, fault arcs are the primary cause—their extreme temperatures readily ignite surrounding combustibles (e.g., wooden structures or insulation materials), subsequently triggering fires [3,4]. Therefore, arc fault detection and identification are critical for electrical safety, playing vital roles in hazard prevention and fire risk mitigation.
The detection of series arc faults is still highly challenging. This is mainly because their negative-resistance characteristics cause a decrease in the current (rather than an increase) and an increase in the impedance [5,6], resulting in extremely subtle fault features. Moreover, the current amplitude of series arcs is much smaller than that of parallel arcs. These characteristics make traditional overcurrent-based protection devices (such as fuses and molded case circuit breakers) ineffective for their detection [7]. More critically, the weak current signatures of series arc faults are easily masked by the normal current characteristics of loads, further increasing the difficulty of accurate identification. Nevertheless, despite being difficult to detect, series arcs can quickly generate localized hot spots, leading to rapid temperature rises and posing a serious fire hazard, highlighting the urgency of addressing their detection challenges.
To address the challenges of series arc fault identification, researchers have proposed various methods, which can be broadly categorized into time-domain approaches, frequency-domain approaches [8,9], and machine learning-based algorithms. Time-domain methods detect faults by analyzing the voltage/current waveform characteristics [10,11], including the current amplitude, rate of change, derivatives, and Tsallis entropy [12,13,14,15], as well as statistical measures (e.g., standard deviation), distribution shapes (e.g., skewness, kurtosis), zero-crossing detection, mean square error, and mean energy density [16,17,18,19,20]. Frequency-domain methods, on the other hand, utilize spectral distribution information—such as harmonic and interharmonic parameters—for detection. Feature extraction techniques primarily include Fast Fourier Transform (FFT) [21,22,23], Wavelet Transform [16,17,24,25,26], Hilbert–Huang Transform [27], and Chirp Z-Transform [28]. However, these methods are often effective only under specific operating conditions, require preset thresholds, and lack a universal standard for determining the optimal feature set, which limits their applicability.
With the rapid development of artificial intelligence, machine learning-based methods have become a research hotspot in arc fault detection. These methods train classification models to adaptively distinguish between normal and fault states and can integrate multiple feature parameters to enhance reliability. Classical approaches, such as Support Vector Machines (SVMs) [29,30], offer good robustness and are well suited for small sample sizes; for example, [31] combined an SVM with the current’s kurtosis features to achieve 97.17% accuracy. However, SVMs are limited in handling multi-class problems and high-dimensional features [32]. Decision trees, as used in [33], exploit their ability to process high-dimensional features, achieving 97.81% detection accuracy. An advanced variant, the Random Forest (RF) [34], performs excellently on complex feature classification and has been applied to fault pattern recognition. In [35], an RF was employed for feature selection in combination with XGBoost for fault identification, yielding high accuracy and demonstrating RF’s strong applicability and robustness in multi-class problems. Neural network-based algorithms, such as Backpropagation Neural Networks (BPNNs) [36,37], Convolutional Neural Networks (CNNs) [7,38,39], and Recurrent Neural Networks (RNNs) [40], also perform well for complex pattern recognition. They can extract distribution features and even process waveform images directly; however, they suffer from long training times, weak generalization, and high computational resource consumption in real-time detection.
Despite notable progress, current series arc fault detection methods still face several critical limitations. Many time-domain and frequency-domain techniques exhibit strong dependence on specific operating conditions, require carefully tuned thresholds, or lack a unified standard for optimal feature selection, leading to reduced robustness under complex and variable loads. Machine learning approaches, although capable of integrating multiple features, often demand extensive training data, incur high computational costs, and may struggle with generalization in real-time applications. Moreover, a common drawback across the existing methods is the reliance on high sampling rates and long observation windows, which hinders their deployment on low-cost embedded platforms. These challenges underscore the need for a lightweight, fast, and accurate identification solution with strong adaptability to diverse load conditions.
To address the aforementioned challenges, this work develops a fast series AC arc fault identification approach that leverages singular spectrum statistical features combined with a differential evolution-optimized XGBoost classifier. Unlike mainstream techniques, the proposed method extracts the statistical features from the singular spectrum of current waveforms under diverse fault conditions, capitalizing on the rich frequency components and high amplitudes of arc currents while eliminating the dependencies on long sampling windows for time–frequency transforms. This enables its effective adaptation to varied load scenarios and delivers rapid, precise identification. The experimental results demonstrate that the method achieves high recognition accuracy (98.90% with only 60 ms of data) and maintains robust performance even with minimal training samples, thereby addressing key gaps in current research. The main contributions of this work are listed as follows.
(1) A novel feature extraction method for fault arcs is proposed. This method constructs a Hankel matrix from the sampled current sequence of a fault arc and extracts nine singular spectrum statistical features from the matrix. In contrast to traditional feature extraction approaches based on time–frequency transforms or modal decomposition, the proposed method demonstrates advantages, including fewer required features and computational simplicity.
(2) A fast and accurate fault arc identification solution is designed. Operating at a sampling frequency of 5 kHz, this solution achieves the precise identification of eight types of fault arcs using only three nominal cycles (i.e., 60 ms). Its exceptional real-time performance gives it significant potential for application in low-cost, resource-constrained embedded hardware platforms.
(3) The effectiveness of the proposed solution is validated using real-world data from a fault arc experimental platform. The experimental results demonstrate that the solution offers the advantages of requiring fewer training samples and achieving high fault arc recognition accuracy.

2. Feature Extraction from Singular Spectrum Statistical Features

When a series arc fault occurs, the current waveform becomes distorted, increasing the harmonic and interharmonic components. For a Hankel matrix constructed from current sampling sequences, the singular values in its singular spectrum are proportional to the amplitudes of these harmonic components [41]. Different arc fault conditions produce distinct harmonic characteristics in terms of frequency, quantity, and amplitude, which are reflected in the singular values and manifest as unique singular spectrum patterns. Consequently, statistical features of a singular spectrum can effectively extract the signal characteristics for various arc faults.
The series fault arc identification method proposed in this paper is established based on the singular spectrum features of current waveforms. Its statistical feature extraction primarily consists of two parts: (1) constructing the singular spectrum and (2) extracting the statistical feature indices from the singular spectrum.

2.1. Singular Spectrum Construction

For a time-domain sampling sequence of fault arc current waveforms, denoted as y = [y(1), y(2), y(3), …, y(n), …, y(N)], an (NL) × (L) Hankel matrix can be constructed as follows:
Y = y ( 1 ) y ( 2 ) y ( L ) y ( 2 ) y ( 3 ) y ( L + 1 ) y ( N L ) y ( N L + 1 ) y ( N )
where N denotes the number of sampling points in the current sequence, and N/3 ≤ LN/2. For simplicity, this paper adopts the configuration L = fix(N/2), where fix(·) is the rounding operation. The Hankel matrix Y undergoes singular value decomposition as follows:
Y = U S all V H
where U(N − L) × (NL) and V(L) × (L) are unitary matrixes, and Sall is an (NL) × (L) diagonal matrix whose diagonal elements are the singular values of Y, expressed as
S all = S 1 S 2 N L × L
where S2 is an (N − 2L) × (L) zero matrix, and S1 is an L × L diagonal matrix.
S 1 = σ 1 σ 2 σ l σ L
where σ1 > σ2 > … > σl > … ≥ σL. For notational simplicity, the collection of singular values along the diagonal of S1 may be reformulated as a singular spectral representation:
S = σ 1 , σ 2 ,     , σ l , σ L

2.2. Statistical Feature Extraction

During fault arc incidents, the current waveform exhibits numerous high-amplitude harmonics and interharmonics. Since singular values positively correlate with the amplitudes of multifrequency signal components, the statistical features of the singular energy spectrum can serve as the key identifiers for fault arcs. The proposed identification method extracts nine statistical features (a–i) from the singular energy spectrum as follows:
(a) Energy:
E = l = 1 L σ l 2
(b) Mean:
M = 1 L l = 1 L σ l
(c) Standard Deviation:
S td = 1 L l = 1 L σ l M 2
(d) Skewness:
S kew = 1 6 L l = 1 L σ l M S td 3
(e) Shannon Entropy:
S E = l = 1 L σ l 2 log σ l 2
(f) RMS:
R ms = 1 L l = 1 L σ l 2
(g) Kurtosis:
K RT = L 24 1 L l = 1 L σ l M S td 4 3
(h) Log-energy Entropy
L OE = l = 1 L log σ l 2
(i) Norm Entropy:
N E = l = 1 L σ l p ,   1 p
The nine extracted singular spectrum statistical features are arranged into the following feature vector form:
F set = E , M , S td , S kew , S E , R ms , K TR , L OE , N E

3. Series Arc Fault Rapid Identification

3.1. XGBoost Classifier

XGBoost is a highly efficient machine learning algorithm based on distributed gradient boosting, belonging to the scalable tree boosting systems family [42]. It is primarily designed for supervised learning tasks. For a given classification task, its dataset D can be represented as follows:
D = x i , y i i = 1 n , x i m , y i Y
where n denotes the number of records in the dataset and xi is composed of the singular spectrum feature set (Fset) derived from the fault arc current waveform. Thus, it follows that
x i = x i ( 1 ) , x i ( 2 ) , , x i ( m )
where x i ( j ) F set and m denotes the number of the extracted statistical features from the singular spectrum. When integer labels are applied, then Y = 1 , 2 , , 16 . Y refers to the label space, corresponding to 16 categories of fault arc current waveforms. For detailed information, refer to the dataset description in Section 4.
Taking the dataset D = {(x1, y1), (x2, y2), …, (xi, yi), …, (xN, yN)} as an example, the output of the tree ensemble model based on T prediction functions fₜ can be expressed as follows:
y ^ i = t = 1 K f t ( x i ) , f t F
where F is the function space containing all classification trees; K denotes the total number of training rounds, which is a hyperparameter set prior to training.
XGBoost employs additive learning rather than weight learning as in traditional tree models, with its objective function formulated as
Obj = i = 1 n l y i , y ^ i + t = 1 K Ω f t
where
Ω f t = γ T f t + 1 2 λ j = 1 T f t w j 2
where t = 1, 2, …, K, denotes the t-th tree in the boosting sequence; l(·) is the loss function quantifying the model’s fit to the training data, with multi-class cross-entropy adopted as the loss function in this work; Ω(·) represents the regularization term assessing model complexity; T(ft) indicates the number of leaf nodes in the current tree ft; and wj corresponds to the weight value of the j-th leaf node. Note that T(ft) explicitly signifies the leaf count determined by the structure of the t-th tree, where ft also denotes the tree function under construction, which inherently encapsulates the sample-to-leaf mapping structure and splitting paths. Building upon gradient-boosted decision trees (GBDTs), XGBoost incorporates L1 and L2 regularization terms to effectively suppress model overfitting.
The XGBoost classifier is trained in an additive manner. Let y ^ i ( t ) denote the predicted value for the i-th sample at the t-th iteration. Conditioned on the first t − 1 trees, the objective function at the t-th iteration reduces to
L ( t ) = i = 1 n l y i , y ^ i ( t 1 ) + f t x i + Ω ( f t )
Applying the second-order Taylor expansion to the loss function [42,43], one obtains
L ( t ) i n l y i , y ^ ( t 1 ) + g i f t x i + 1 2 h i f t 2 x i + Ω f t
where gi and hi are the first-order and second-order gradient statistics of the loss function, respectively, defined as
g i = y ^ ( i 1 ) l y i , y ^ ( t 1 )
h i = y ^ ( t 1 ) 2 l y i , y ^ ( t 1 )
Define q(xi) as the structure function of the current tree that assigns the input sample xi to its corresponding leaf node index. If sample xi resides in the j-th leaf node, then q(xi) = j. Accordingly, let I j = { i | q ( x i ) = j } denote the set of training sample indices assigned to leaf node j. The term l ( y i , y ^ ( t 1 ) ) in Equation (22) is a constant and independent of the tree ft added in the current iteration. It can therefore be omitted during optimization of the objective function, which simplifies to
L ( t ) i = 1 n g i f t x i + 1 2 h i f t 2 x i + Ω ( f t )
In XGBoost classifiers, the function of each tree can be reformulated as f t ( x i ) = w q x i . Substituting the definition of Ω ( f t ) into the objective function yields
L ( t ) i = 1 n g i w q ( x i ) + 1 2 h i w q ( x i ) 2 + γ T ( f t ) + 1 2 λ j = 1 T ( f t ) w j 2
Since q ( x i ) = j holds for every leaf node j, aggregating the results by leaves yields
L ( t ) i = 1 n i I j g i w j + 1 2 i I j h i w q ( x i ) 2 + γ T ( f t ) + 1 2 λ j = 1 T ( f t ) w j 2
Equation (25) becomes the optimization objective for the new decision trees. This constitutes the underlying mechanism enabling XGBoost to support custom loss functions. Its primary advantage lies in incorporating regularization terms into the loss function. Such a design yields more concise tree structures and mitigates overfitting.

3.2. Selection of Classifier Hyperparameters

The configuration strategy of classifier hyperparameters directly impacts a model’s performance and generalization capability. Notably, XGBoost involves over a dozen critical hyperparameters, making their combinatorial optimization a high-dimensional nonlinear optimization problem. Traditional grid search methods, requiring traversal of discrete parameter spaces, exhibit significant limitations in computational resource consumption and search efficiency. To balance exploration of parameter space and convergence speed, our approach employs a differential evolution algorithm implemented via the Scikit-Optimize library. This method adaptively optimizes seven core XGBoost hyperparameters through mutation and crossover mechanisms. By maintaining a dynamic parameter population, the strategy progressively approximates the global optimum, achieving ≈ 40% reduction in iterations compared to conventional methods. The search boundaries for each dimension, determined through a parameter sensitivity analysis and model convergence characteristics, yield the optimal parameter combination shown in Table 1.
It should be noted that the hyperparameter search ranges in Table 1 are determined based on the feature dimensionality (nine dimensions). This specifically references successful examples in DE-based XGBoost classification applications where the feature dimensionality is close to nine [44]. During iterative optimization, we employ a threefold cross-validation, using the mean classification error rate on the test set as the optimization objective. For the DE settings, the number of iterations is set to 40. The population size is set to 35 following the 10 × D rule (where D represents the dimensionality of hyperparameters). During each mutation operation, the mutation factor for each individual is a random number uniformly sampled from the interval [0.3, 0.9], and the mutation strategy ‘best/1/bin’ is employed. The crossover probability is fixed at 0.5.

3.3. The Proposed Arc Fault Identification Method

The proposed arc fault identification methodology and workflow are illustrated in Figure 1. The implementation comprises two key components. I. Construction and Training of Arc Fault Identification Model: The detailed implementation steps are as follows: (1) collect the current waveforms of diverse arc fault types; (2) build the arc fault dataset based on the singular spectrum statistical features from the current waveforms; (3) split the dataset into training and testing subsets by the prescribed ratio; (4) utilize the singular spectrum feature vectors (nine features) as the XGBoost input, with category labels 1–16 as the prediction outputs; (5) pre-train using the XGBoost default parameters, then apply the differential evolution algorithm for iterative hyperparameter optimization; (6) terminate the optimization when the loss function reaches its minimum, configuring the optimal parameters; and (7) validate the optimized XGBoost model with the testing set. II. Arc Fault Identification Procedure: The detailed implementation steps are as follows: (1) acquire the real-time current waveforms at the specified sampling frequency within the observation window; (2) construct Hankel matrix Y from the current sampling sequence; (3) perform a singular value decomposition (SVD) on Y and compute the singular spectrum feature set Fset; and (4) feed Fset into the trained XGBoost classifier for arc fault identification.

4. Experimental Methods and Results Analysis

4.1. Experimental Platform and Dataset

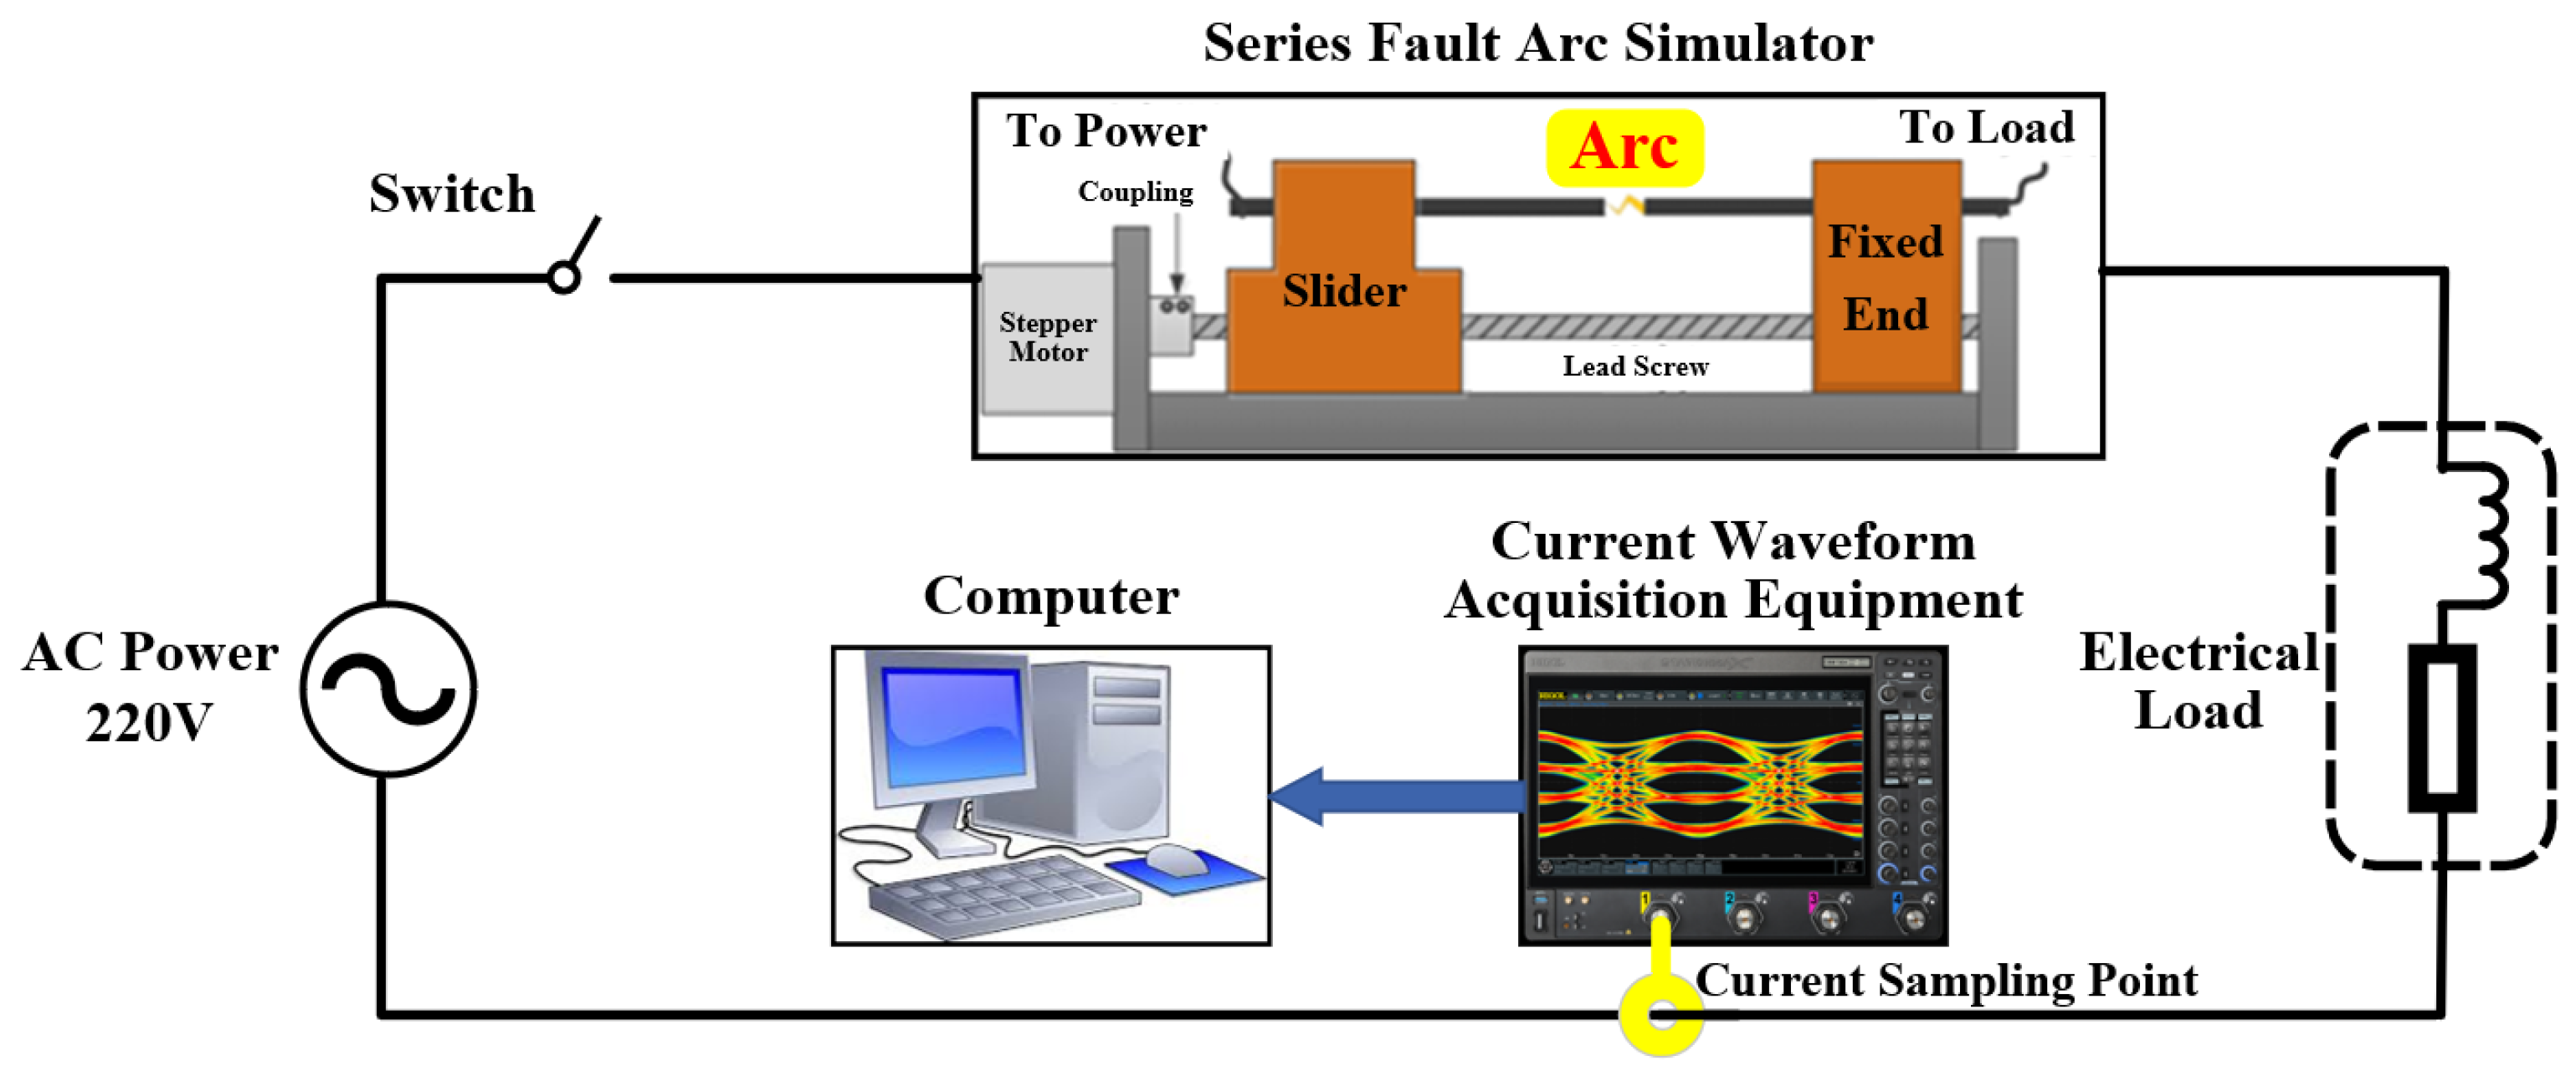
To validate the effectiveness of the proposed method, actual fault arc current waveforms [30] were analyzed using the acquisition circuit depicted in Figure 2, which comprises a 220V AC power supply, a fault arc generation apparatus, a current waveform acquisition unit, household experimental loads, and a data analysis computer. It should be noted that the proposed method was validated using a public dataset [30]. The detailed hardware parameters and experimental procedures for the fault arc experimental platform are provided in Reference [30], with only a brief summary included here to avoid redundancy.
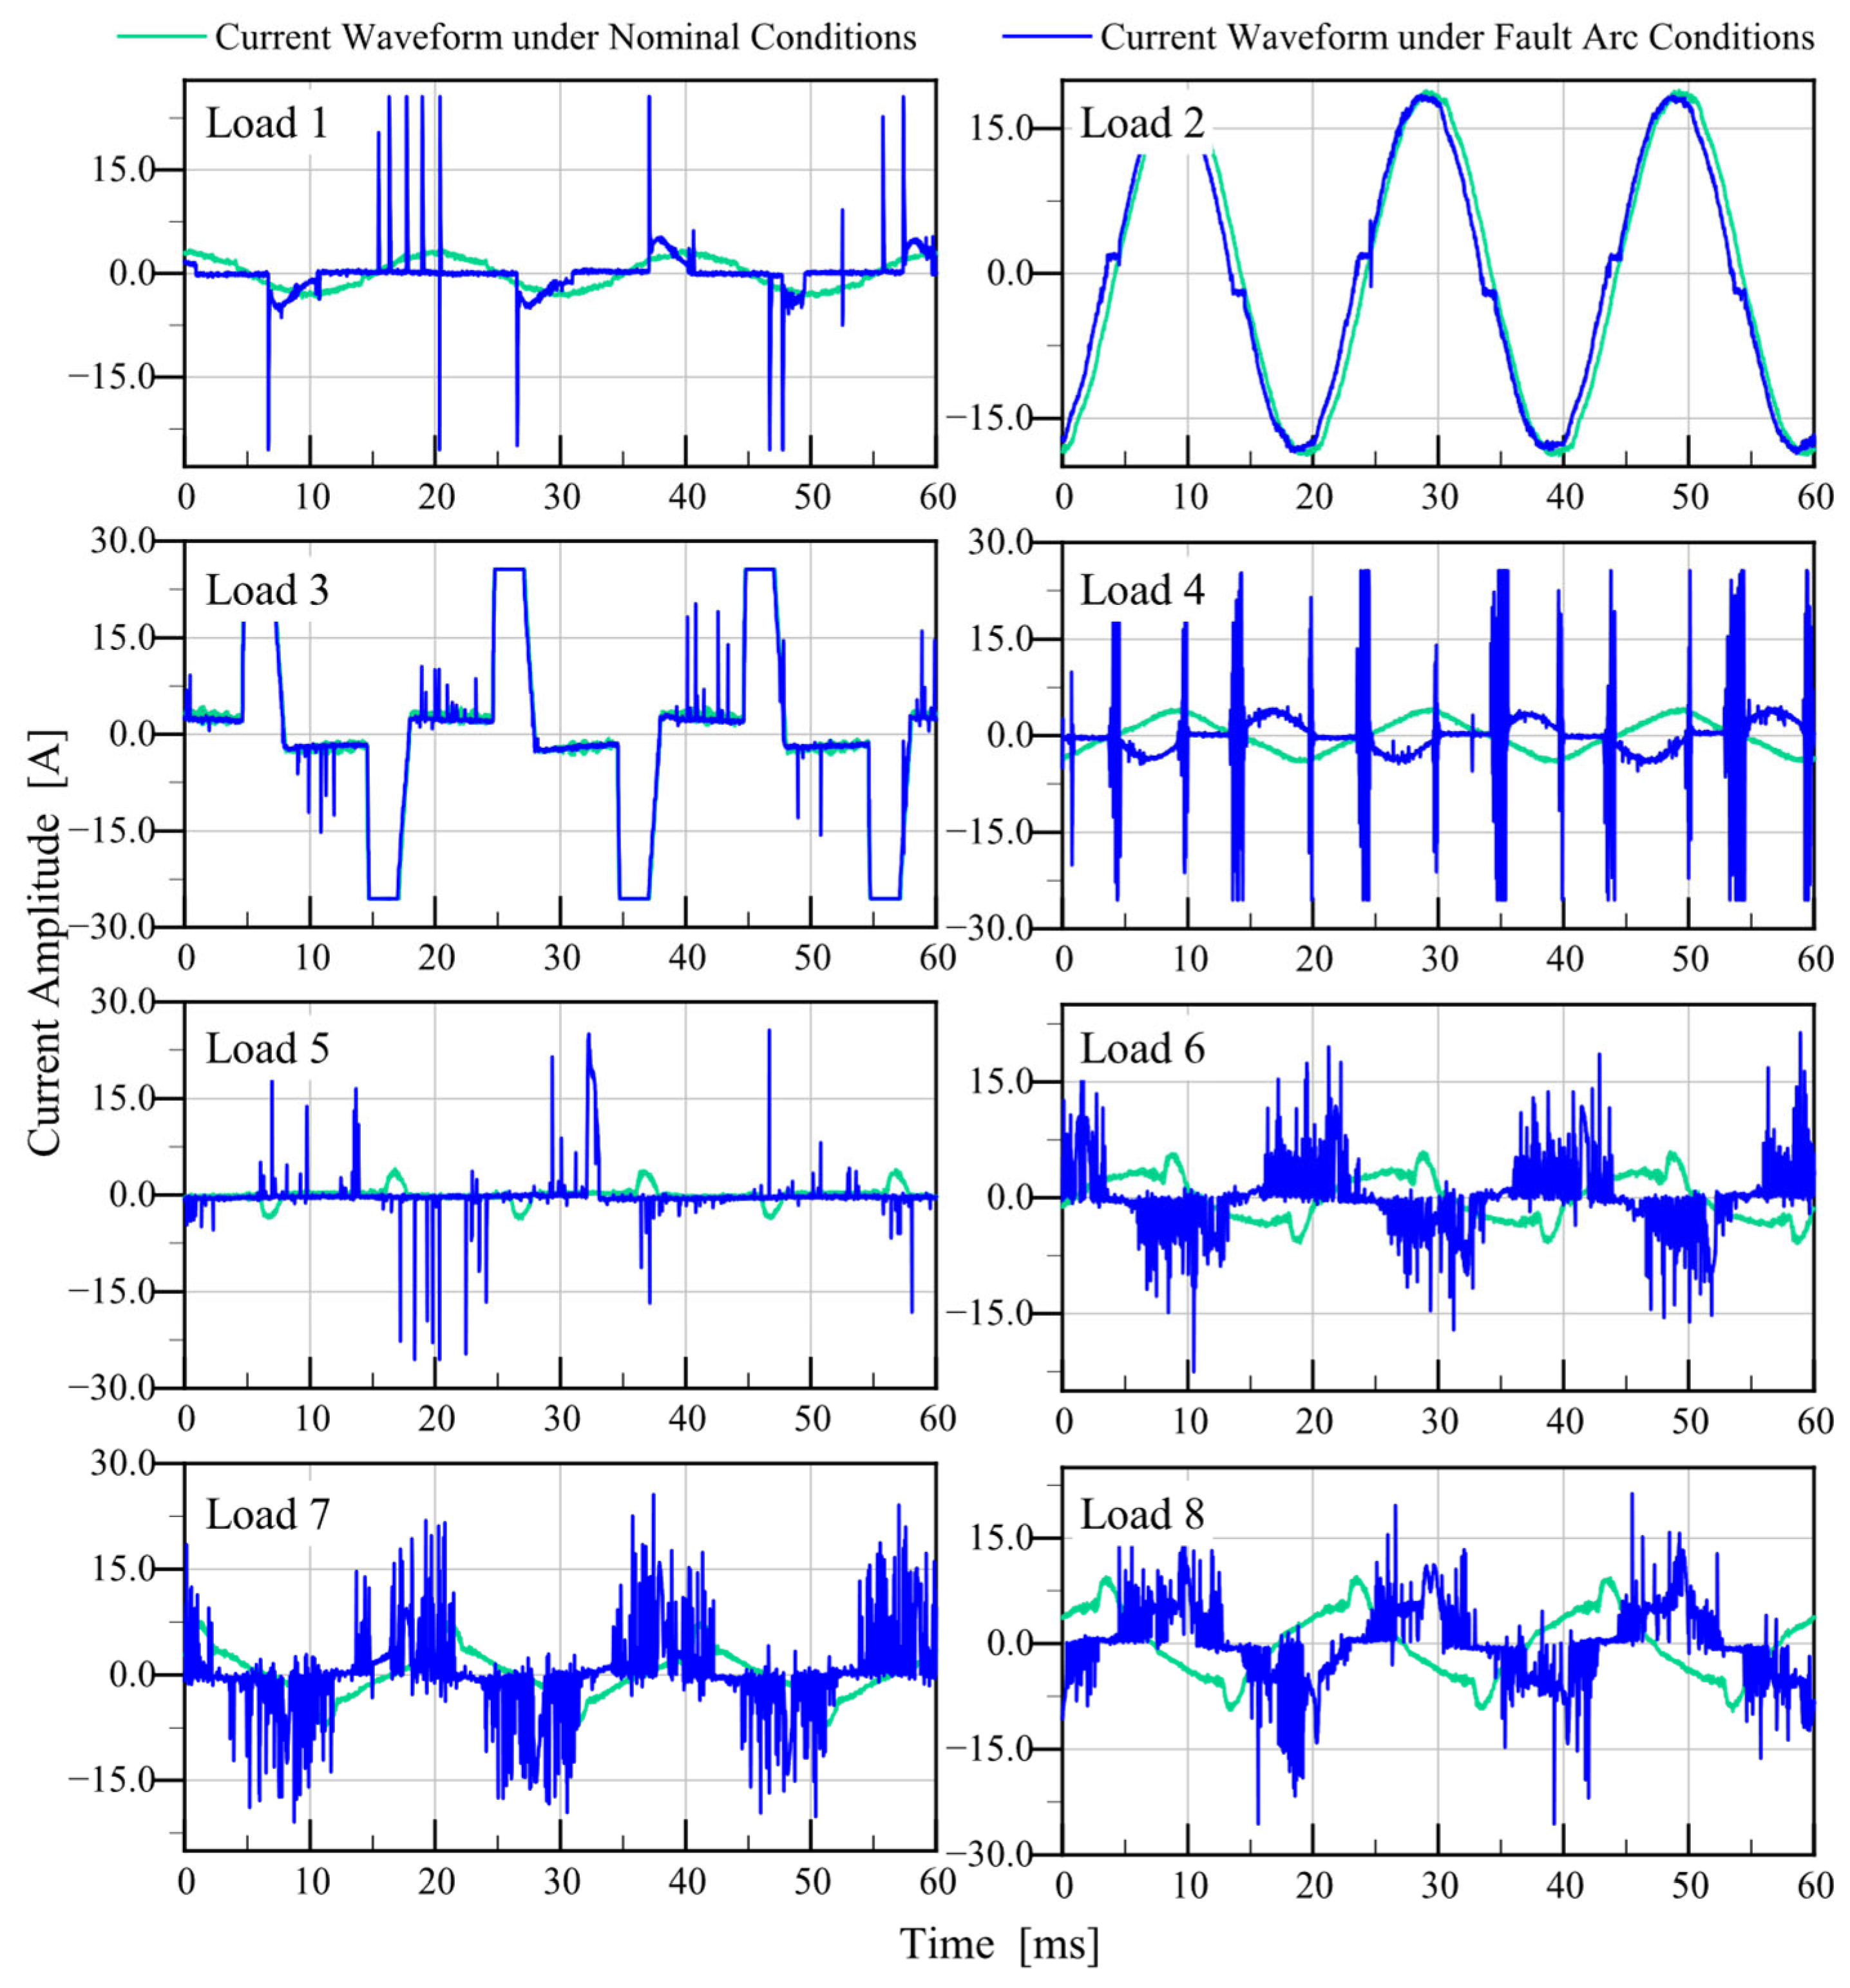
The arc fault generator comprises a fixed electrode, a movable electrode, and a stepper motor for the precision adjustment of the inter-electrode gap. Precise displacement control of the adjustable slider via the stepper motor ensures full contact between the electrodes. After circuit energization, gradual separation of electrodes is achieved through progressive slider adjustment. When the inter-electrode distance reaches a critical threshold, sustained arc discharge occurs. The experimental system employs a 50 kHz sampling frequency, corresponding to 1000 samples per cycle at a 50 Hz power frequency. Table 2 details the experimental load configurations, while Figure 3 visually contrasts the current waveforms under normal operation versus arc fault conditions. Notably, compared to regular load operations, the fault arc currents exhibit significantly elevated amplitudes and markedly complex frequency-domain components.

4.2. Evaluation Metrics

To evaluate the performance of the proposed method, we employ well-established evaluation metrics used in machine learning classification: accuracy, precision, recall, and F1-score. The accuracy measures the proportion of correctly classified instances relative to the total samples, defined as follows:
Accuracy = T P + T N T P + T N + F N + F P
where TP, TN, FP, and FN represent the counts of true positives, true negatives, false positives, and false negatives, respectively.
The F1-score is a practical metric well-suited for imbalanced data, and must be computed individually for each category of fault current. For the i-th category of fault current, its F1-score is defined as follows:
F 1 i = 2 P r e c i s i o n i R e c a l l i P r e c i s i o n i + R e c a l l i
where
P r e c i s i o n i = T P i T P i + F P i
R e c a l l i = T P i T P i + F N i

4.3. Test Results

To ensure the real-time performance and effectiveness of the proposed method, parameter configuration must be considered during deployment. The arc fault identification process involves singular spectrum feature extraction, which requires SVD computation. Given the substantial computational load of SVD, downsampling is applied to the original 50 kHz current sampling sequence. This experiment sets the signal length per extraction to 3 nominal power cycles (60 ms, 3000 samples). Through uniform decimation, the sampling frequency is reduced to 10 kHz (600 samples). Consequently, for the Hankel matrix Y constructed in real-time, the computational complexity of SVD decreases from O(15003) to O(3003), achieving significant time savings.
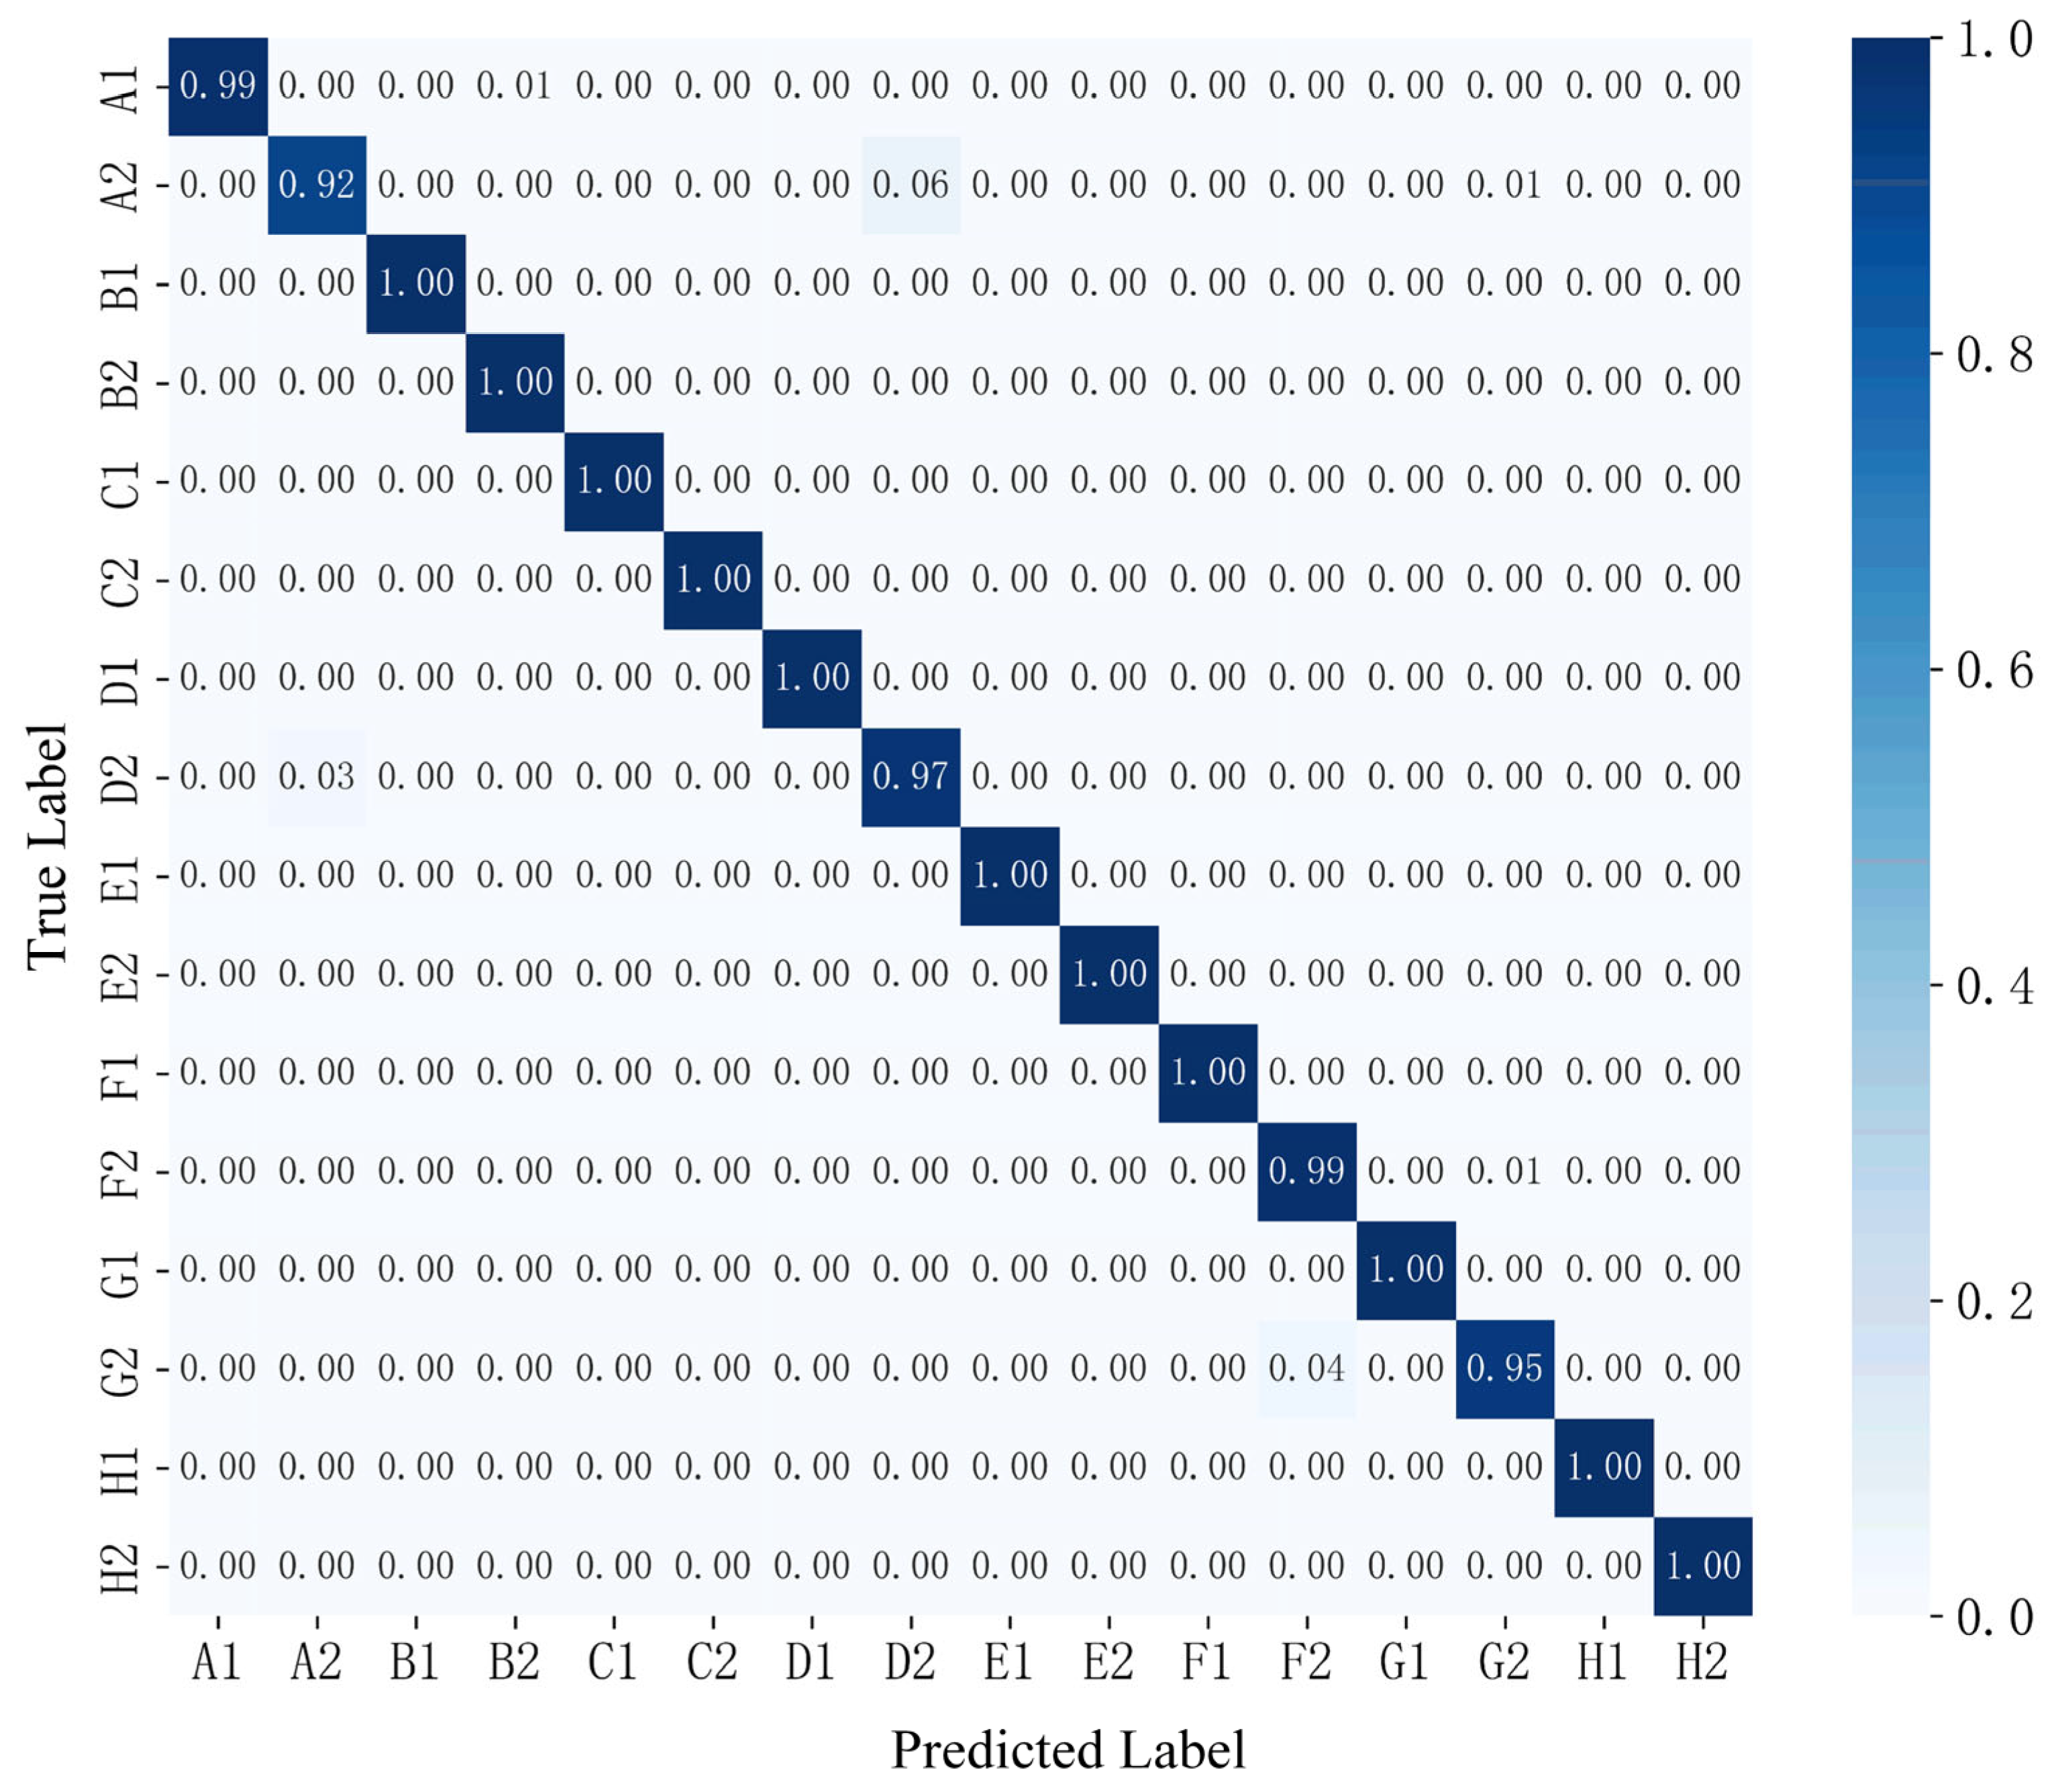
Prior to training the XGBoost classifier model, the sampled circuit current waveforms are partitioned into 16 distinct categories based on the load types and operating conditions. This classification comprises 8 classes for normal operation and 8 classes for fault arcs, with the fault arc dataset classification encoding detailed in Table 3. In this experiment, a total of 18,240 current waveform samples are categorized into 16 classes, with 1140 samples per class. The dataset is divided into training and test sets at a 7:3 ratio for experimental validation. The training set facilitates parameter learning for the XGBoost classifier model, while the test set evaluates the method’s performance. The overall confusion matrix of test results is shown in Figure 4, and Table 4 details the performance metrics per fault arc category, including accuracy, precision, recall, F1-score, and support counts.
As evidenced by the test results in Figure 4 and Table 4, the proposed method achieved exceptionally high arc fault recognition success rates, with the macro-average, weighted-average, and overall classification accuracy for precision, recall, and F1-score all reaching 99%. Notably, four fault arc classes (B2, C2, E2, and H2) achieved 100% recall rates. Among all the fault categories, class A2 exhibited the lowest performance, with the precision, recall, and F1-score at 97%, 92%, and 94%, respectively. Class G2 performed slightly better than A2, with corresponding metrics of 97%, 95%, and 96%. This indicates that the feature extraction model retains potential for improvement in characterizing A2 and G2 fault types.

4.4. Validation with Varying Training Set Proportions

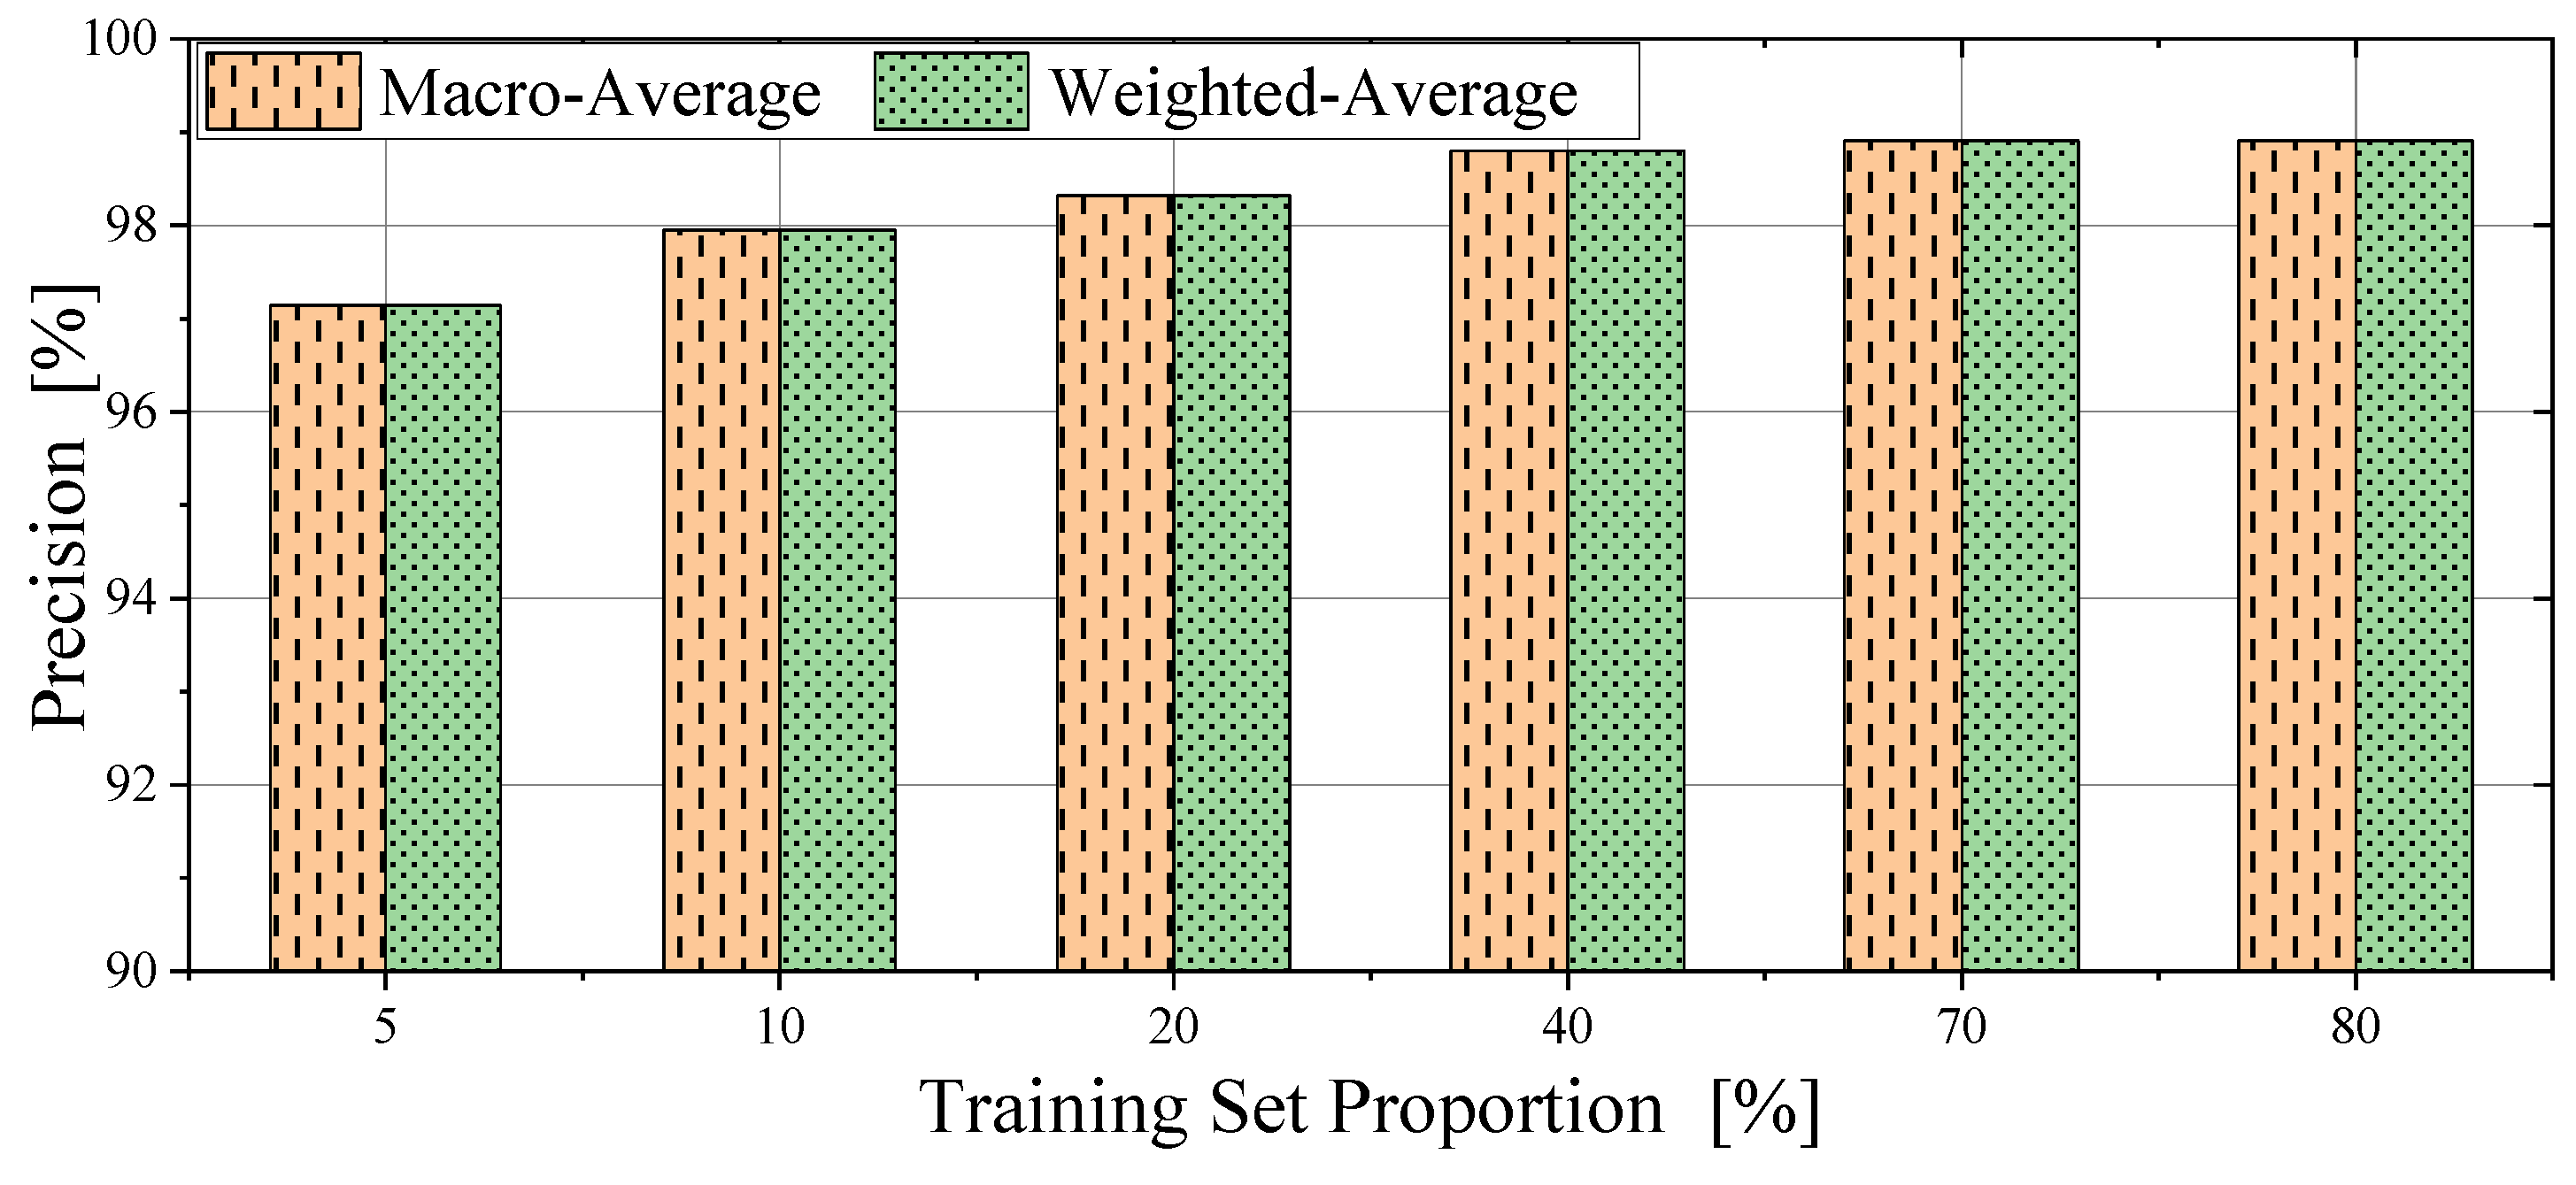
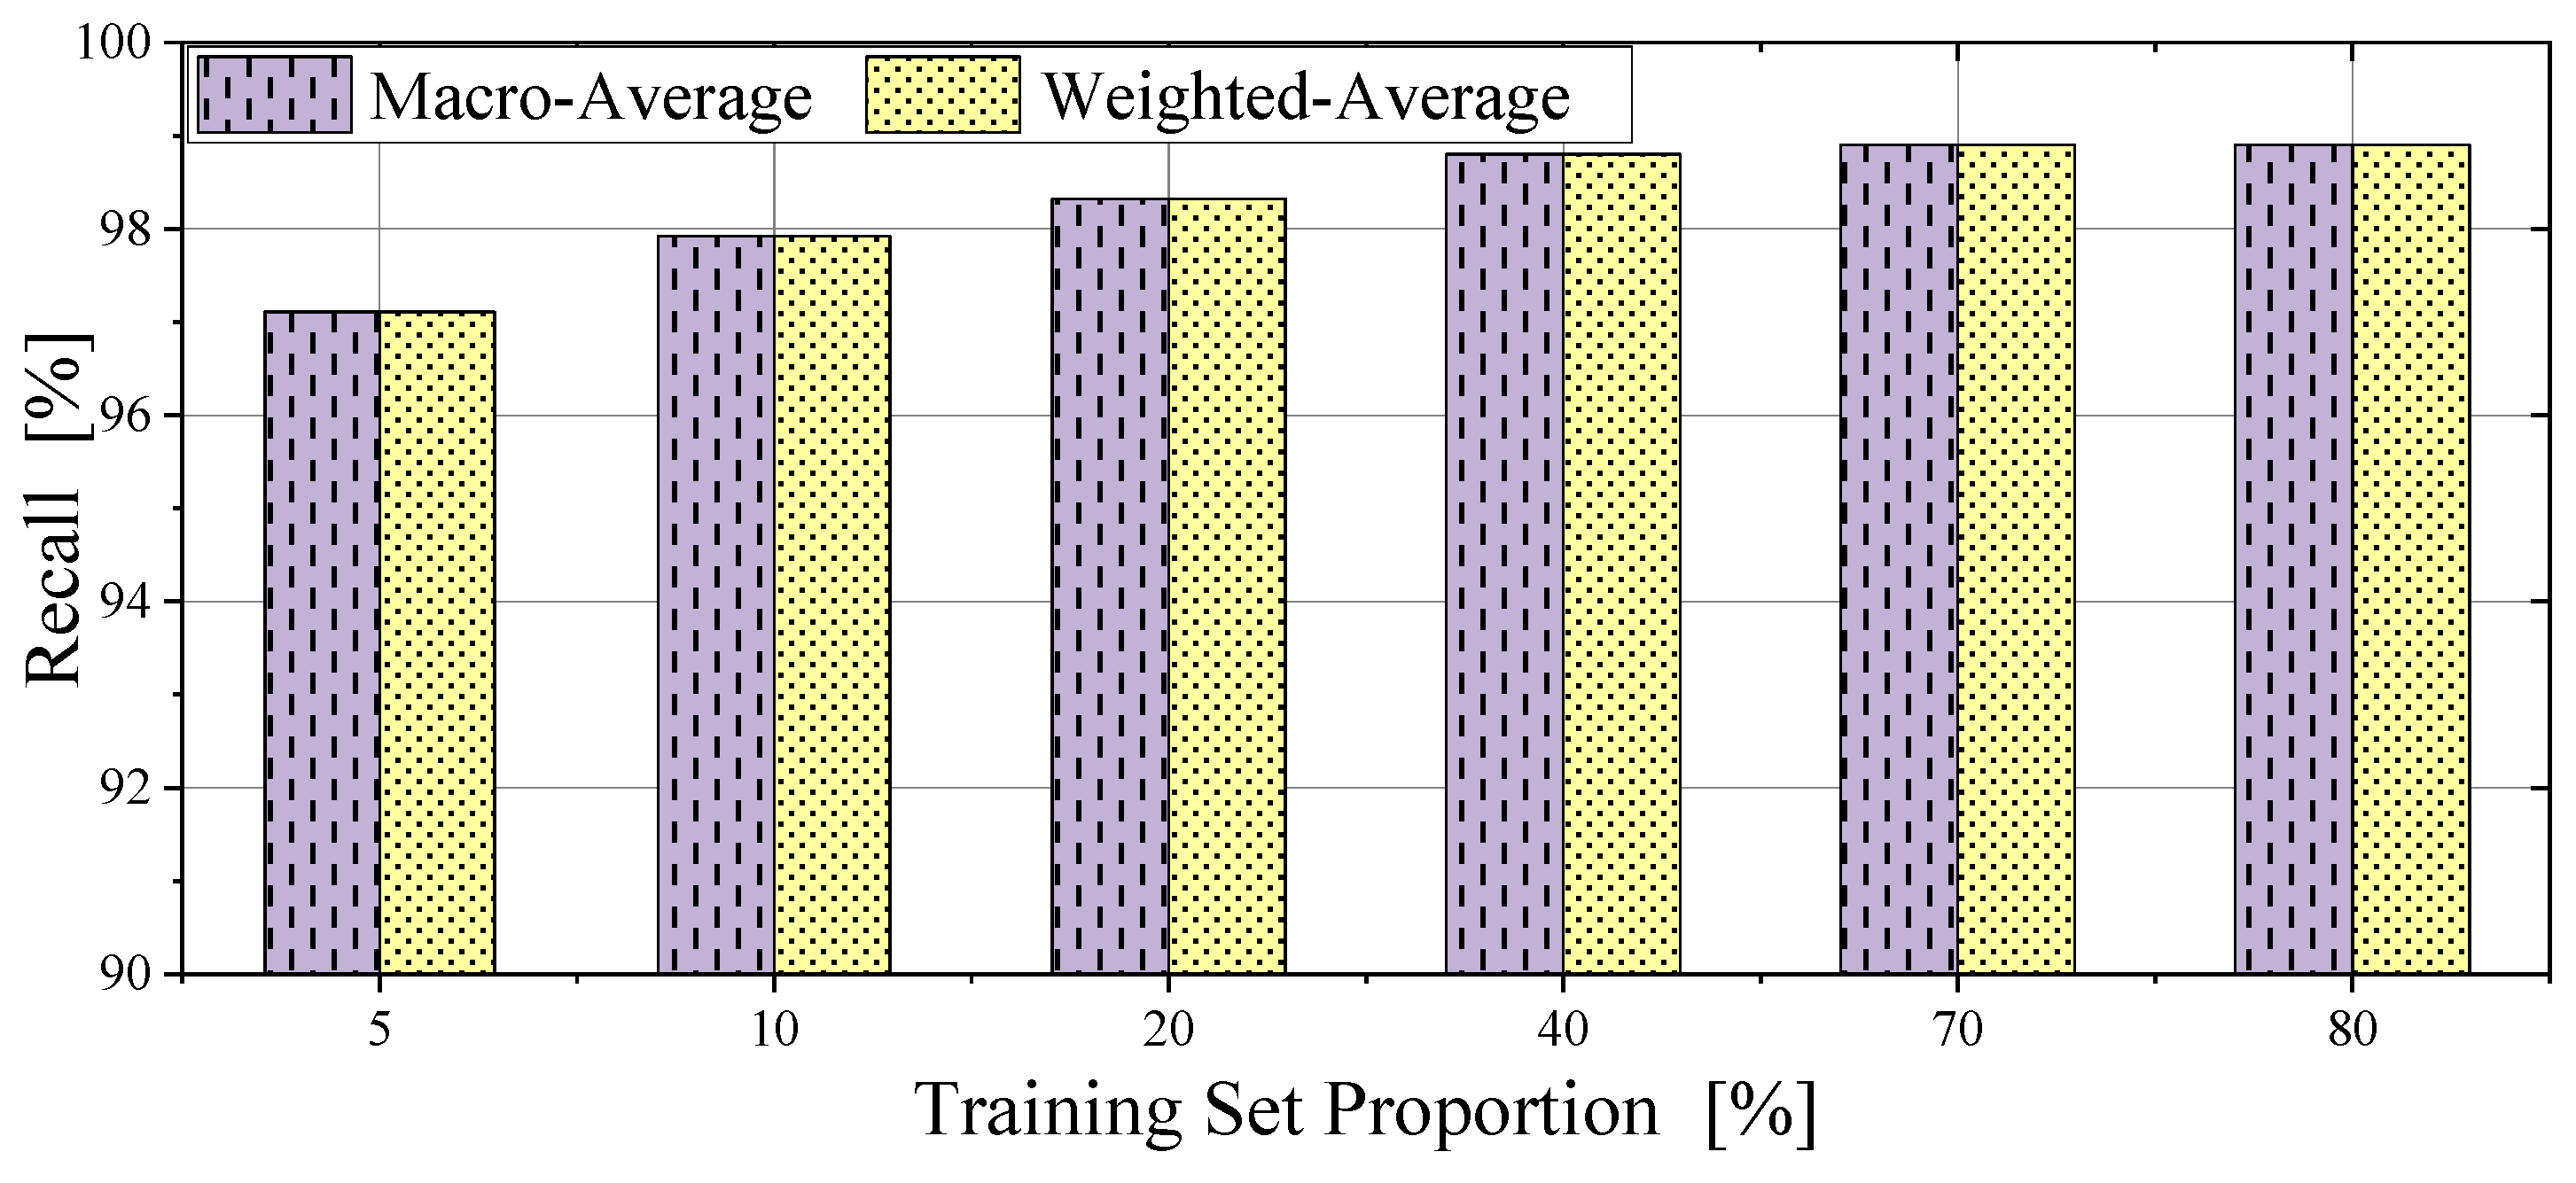
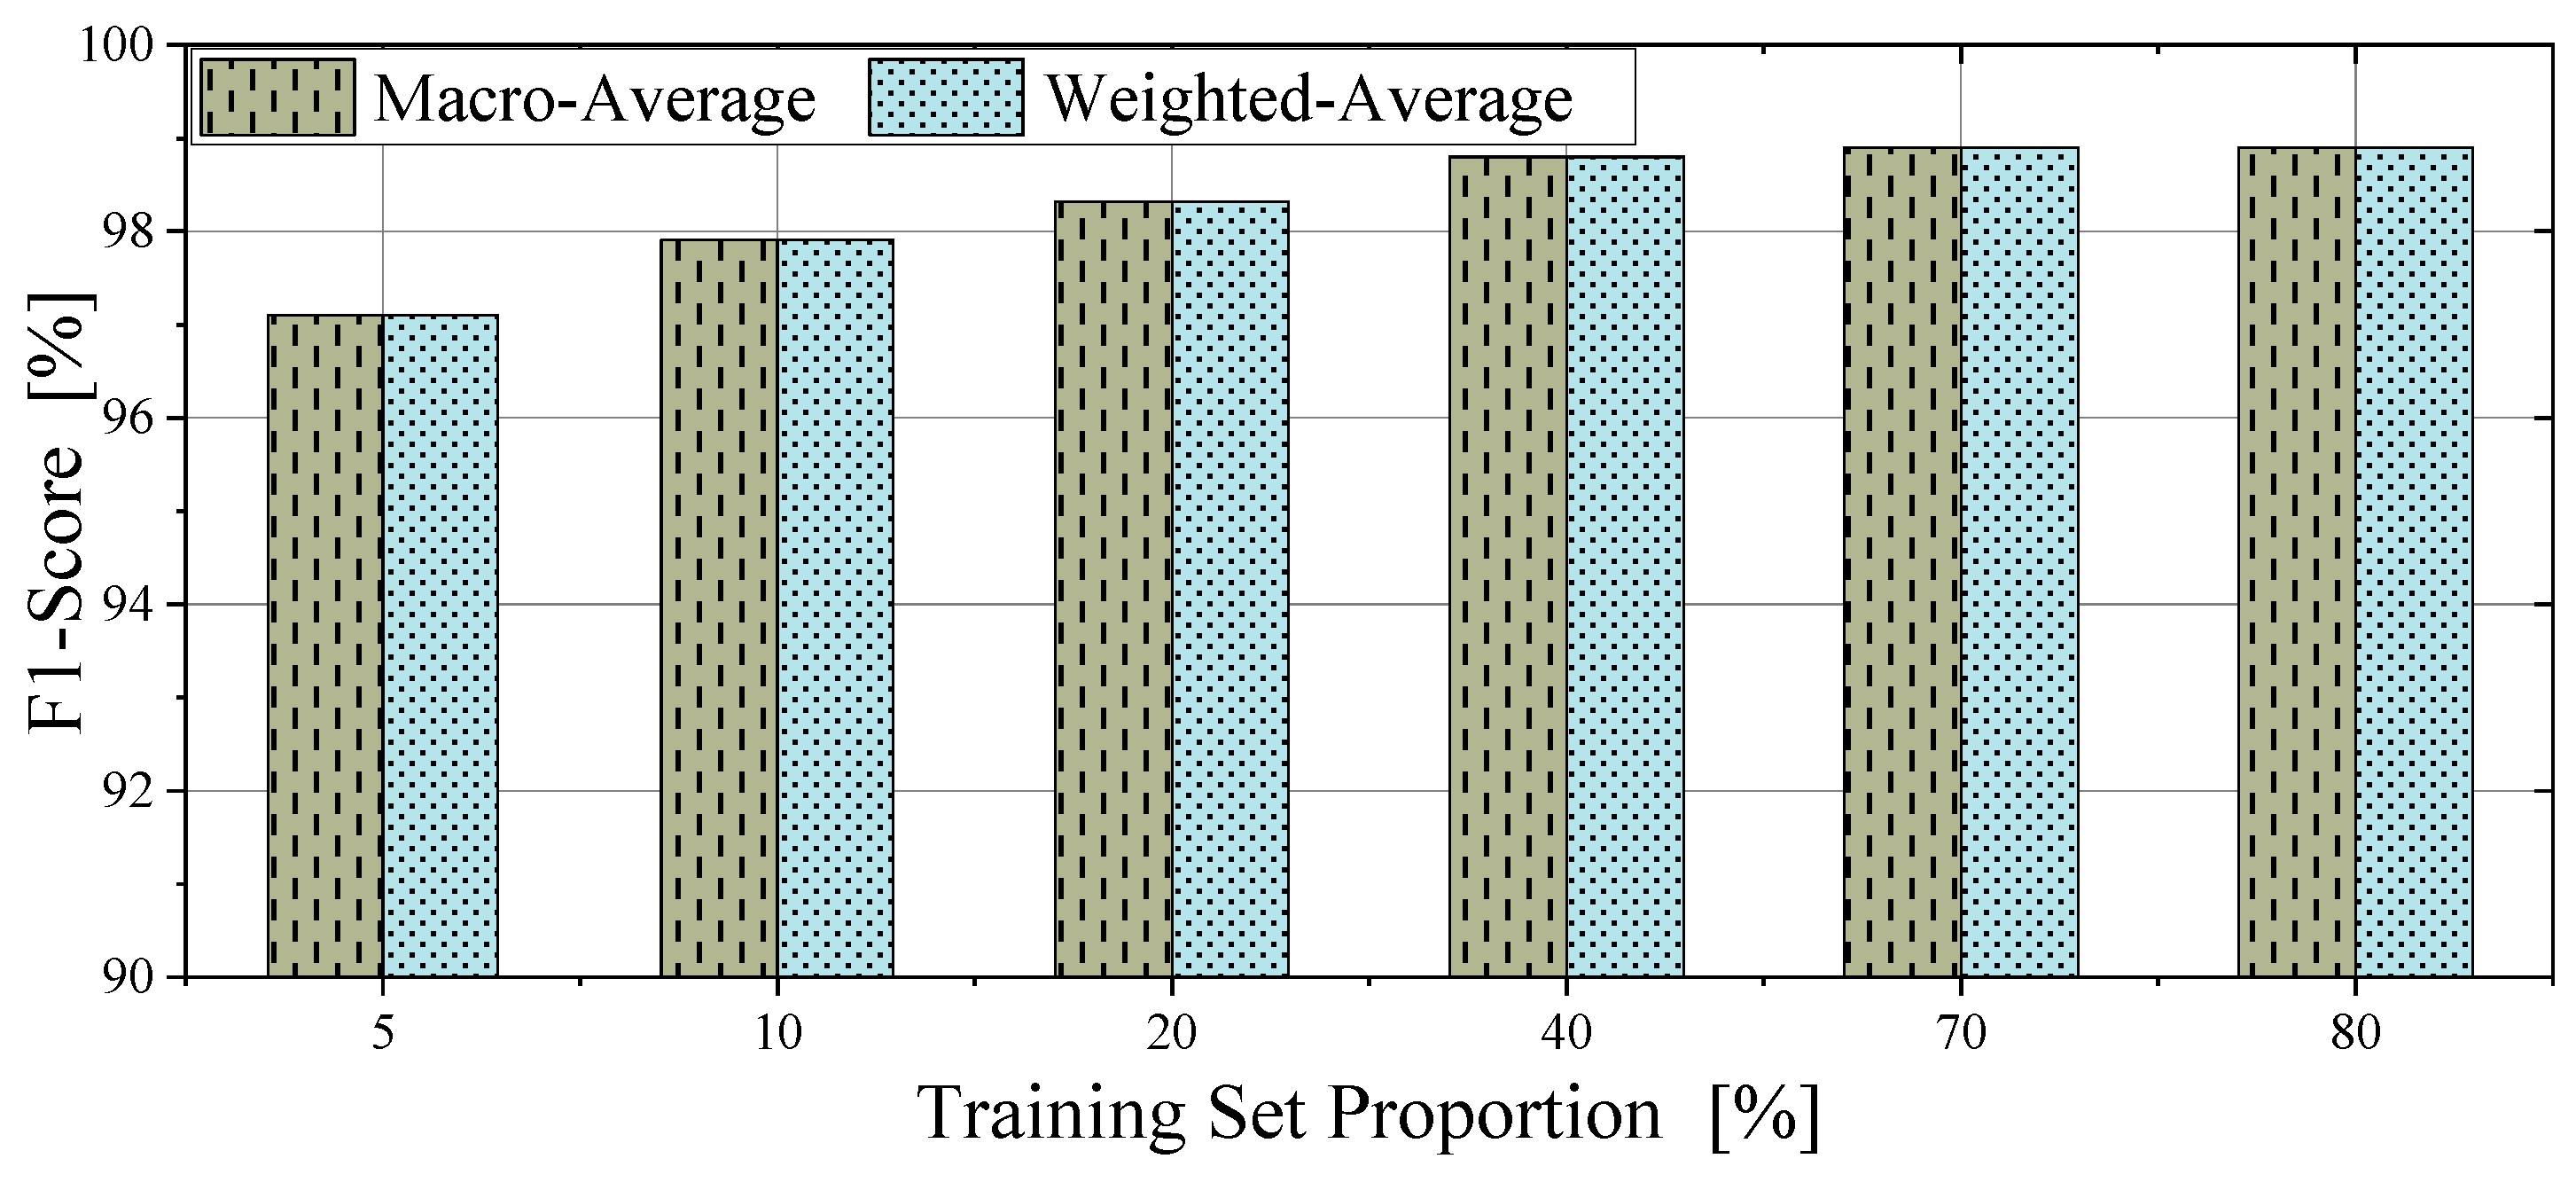
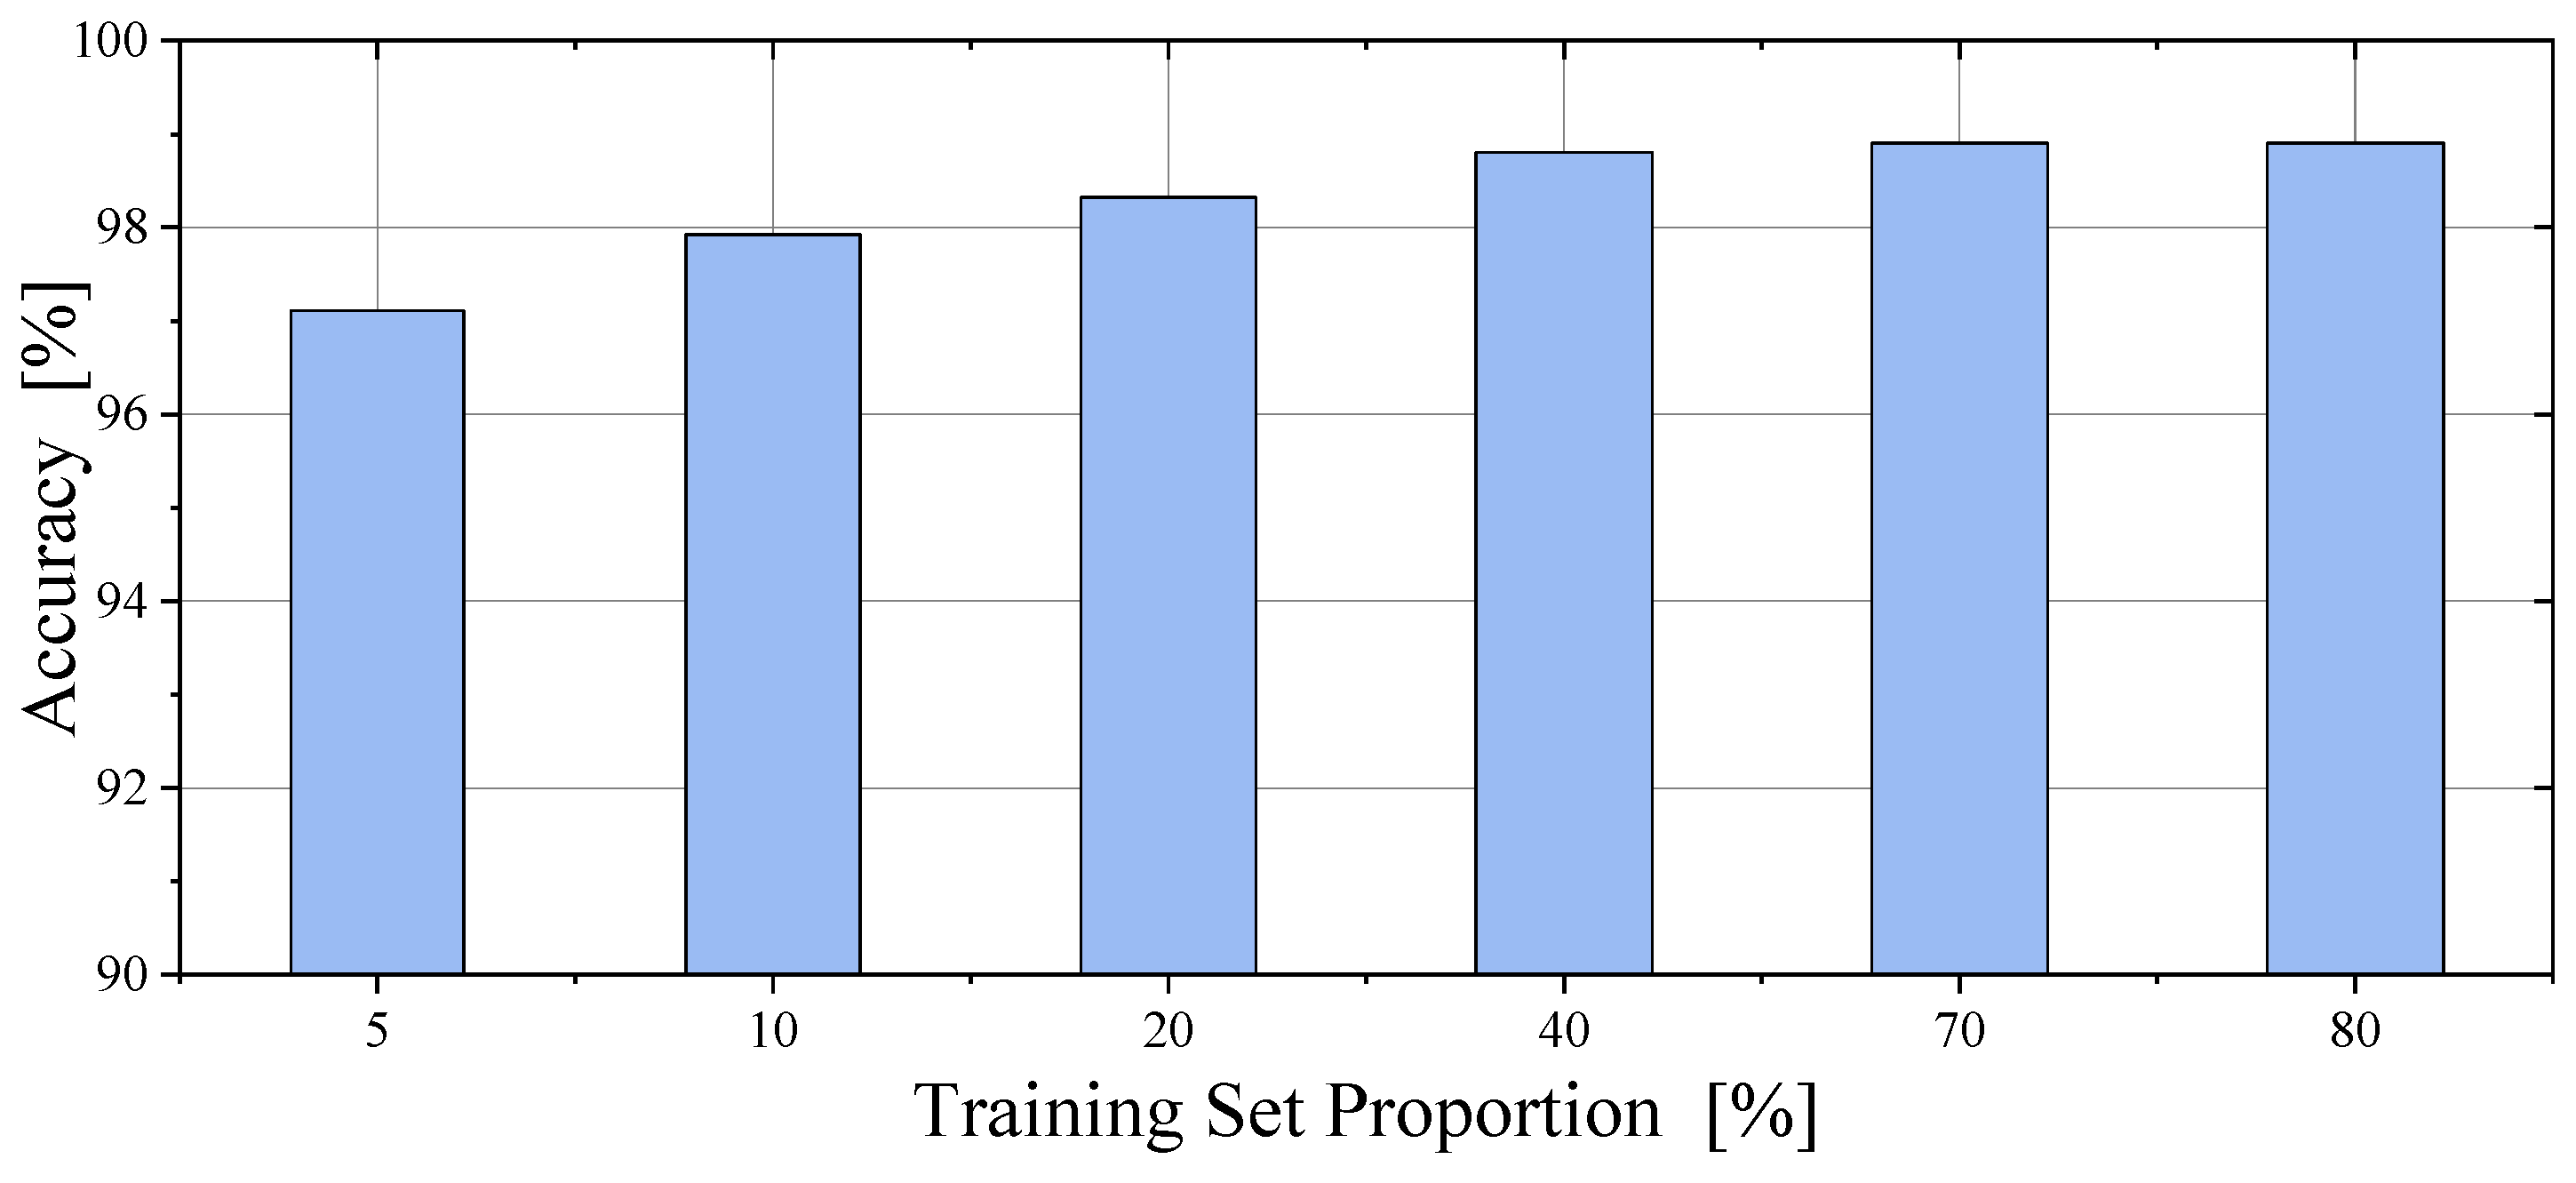
To evaluate the generalization capability of the proposed method, the dataset was partitioned into training and test sets at varying ratios, with the performance metrics analyzed across the different proportion configurations. In the experiments, the training set proportions were set at 5%, 10%, 20%, 40%, 70%, and 80%, corresponding to test set proportions of 95%, 90%, 80%, 60%, 30%, and 20%, respectively. The experimental results under each training–test set configuration are illustrated in Figure 5, Figure 6, Figure 7 and Figure 8.
As evidenced in Figure 5 through Figure 8, all the evaluation metrics for the proposed method demonstrate an upward trend with increasing test set proportions, with the precision rising from 97.14% to 98.91%, the recall improving from 97.11% to 98.90%, the F1-score increasing from 97.10% to 98.90%, and the overall recognition accuracy growing from 97.11% to 98.90%; notably, the performance metrics exhibit no further improvement when the training set proportion expands from 70% to 80%, and even with a minimal training set proportion of 5% (test set: 95%), the method maintains 97.11% overall accuracy, indicating that the singular spectrum statistical feature set captures the current characteristics of diverse fault arcs with minimal samples, exhibits a low dependence on classifier models, and demonstrates a strong generalization capability for fault arc classification applications.

4.5. Accuracy Comparison with Other Methods

To further validate the fault arc classification performance of the proposed approach, mainstream fault arc identification methods were experimentally selected as references for a comparative analysis of recognition accuracy under identical datasets and testing conditions. The reference methods encompassed three categories: Back-propagation Neural Network (BPNN), Support Vector Machine (SVM), and Recurrent Neural Network (RNN). The recognition success rates of each method across the different fault arc categories are detailed in Table 5.
As evidenced in Table 5, all four recognition methods achieved average classification success rates exceeding 90% across 16 distinct operating conditions, with the proposed method generally demonstrating the highest performance—achieving 100% recognition rates in 10 scenarios while dipping to 92.17% only under condition A2; the SVM and RNN exhibited comparable success rates ranging between 93% and 98%, while the BPNN delivered the lowest performance (89–95%); benefitting from the distinctive singular spectrum statistical characteristics of current signals across diverse fault arc scenarios, the proposed fault arc identification method demonstrated substantial advantages over the BPNN, SVM, and RNN approaches.

4.6. Computational Complexity Analysis

To evaluate the real-time identification performance of the proposed method, a computational overhead analysis experiment was conducted. The hardware configuration included an Intel Core i7-10700F processor @ 2.9 GHz, 32 GB RAM, and a 64-bit windows 10 operating system. The software environment utilized PyCharm 2020 and Python 3.8. The comparative algorithms included classifiers based on BPNN [36,37], SVM [29,30], and RNN [40]. Among them, both the BPNN and SVM employed a wavelet transform (WT) for fault arc feature extraction, with the SVM additionally incorporating a multilayer perceptron (MLP). It should be noted that these comparative methods were implemented based on the approaches described in the literature rather than replicating the original solutions, for the following reasons: (1) The fault arc categories vary across these studies and do not uniformly cover all 16 classes. (2) The original literature does not provide detailed source code. (3) The use of identical datasets and runtime environments ensures the comparability of experimental results.
The average execution times of different methods over 1000 runs are shown in Table 6, with the proposed method achieving the shortest single recognition time. Its computational overhead primarily originates from two stages:
(1) Singular spectrum feature extraction: Although the SVD computation grows drastically with the current sequence length, the proposed method’s lower sampling frequency (equivalent to downsampling, reducing the data points by tenfold, e.g., 50 kHz → 5 kHz corresponding to 3000 samples → 300 samples when 3 nominal cycles are adopted) results in a significantly lower operational overhead.
(2) Classification stage: When processing equivalently scaled data, the computational costs generally increase sequentially for XGBoost, SVM, BPNN, and RNN. XGBoost demonstrates substantial efficiency advantages since it only requires traversing a limited number of decision trees.
Furthermore, due to the significantly higher computational efficiency of WT compared to MLP, WT-SVM achieves faster recognition speeds than MLP-SVM.

5. Discussion

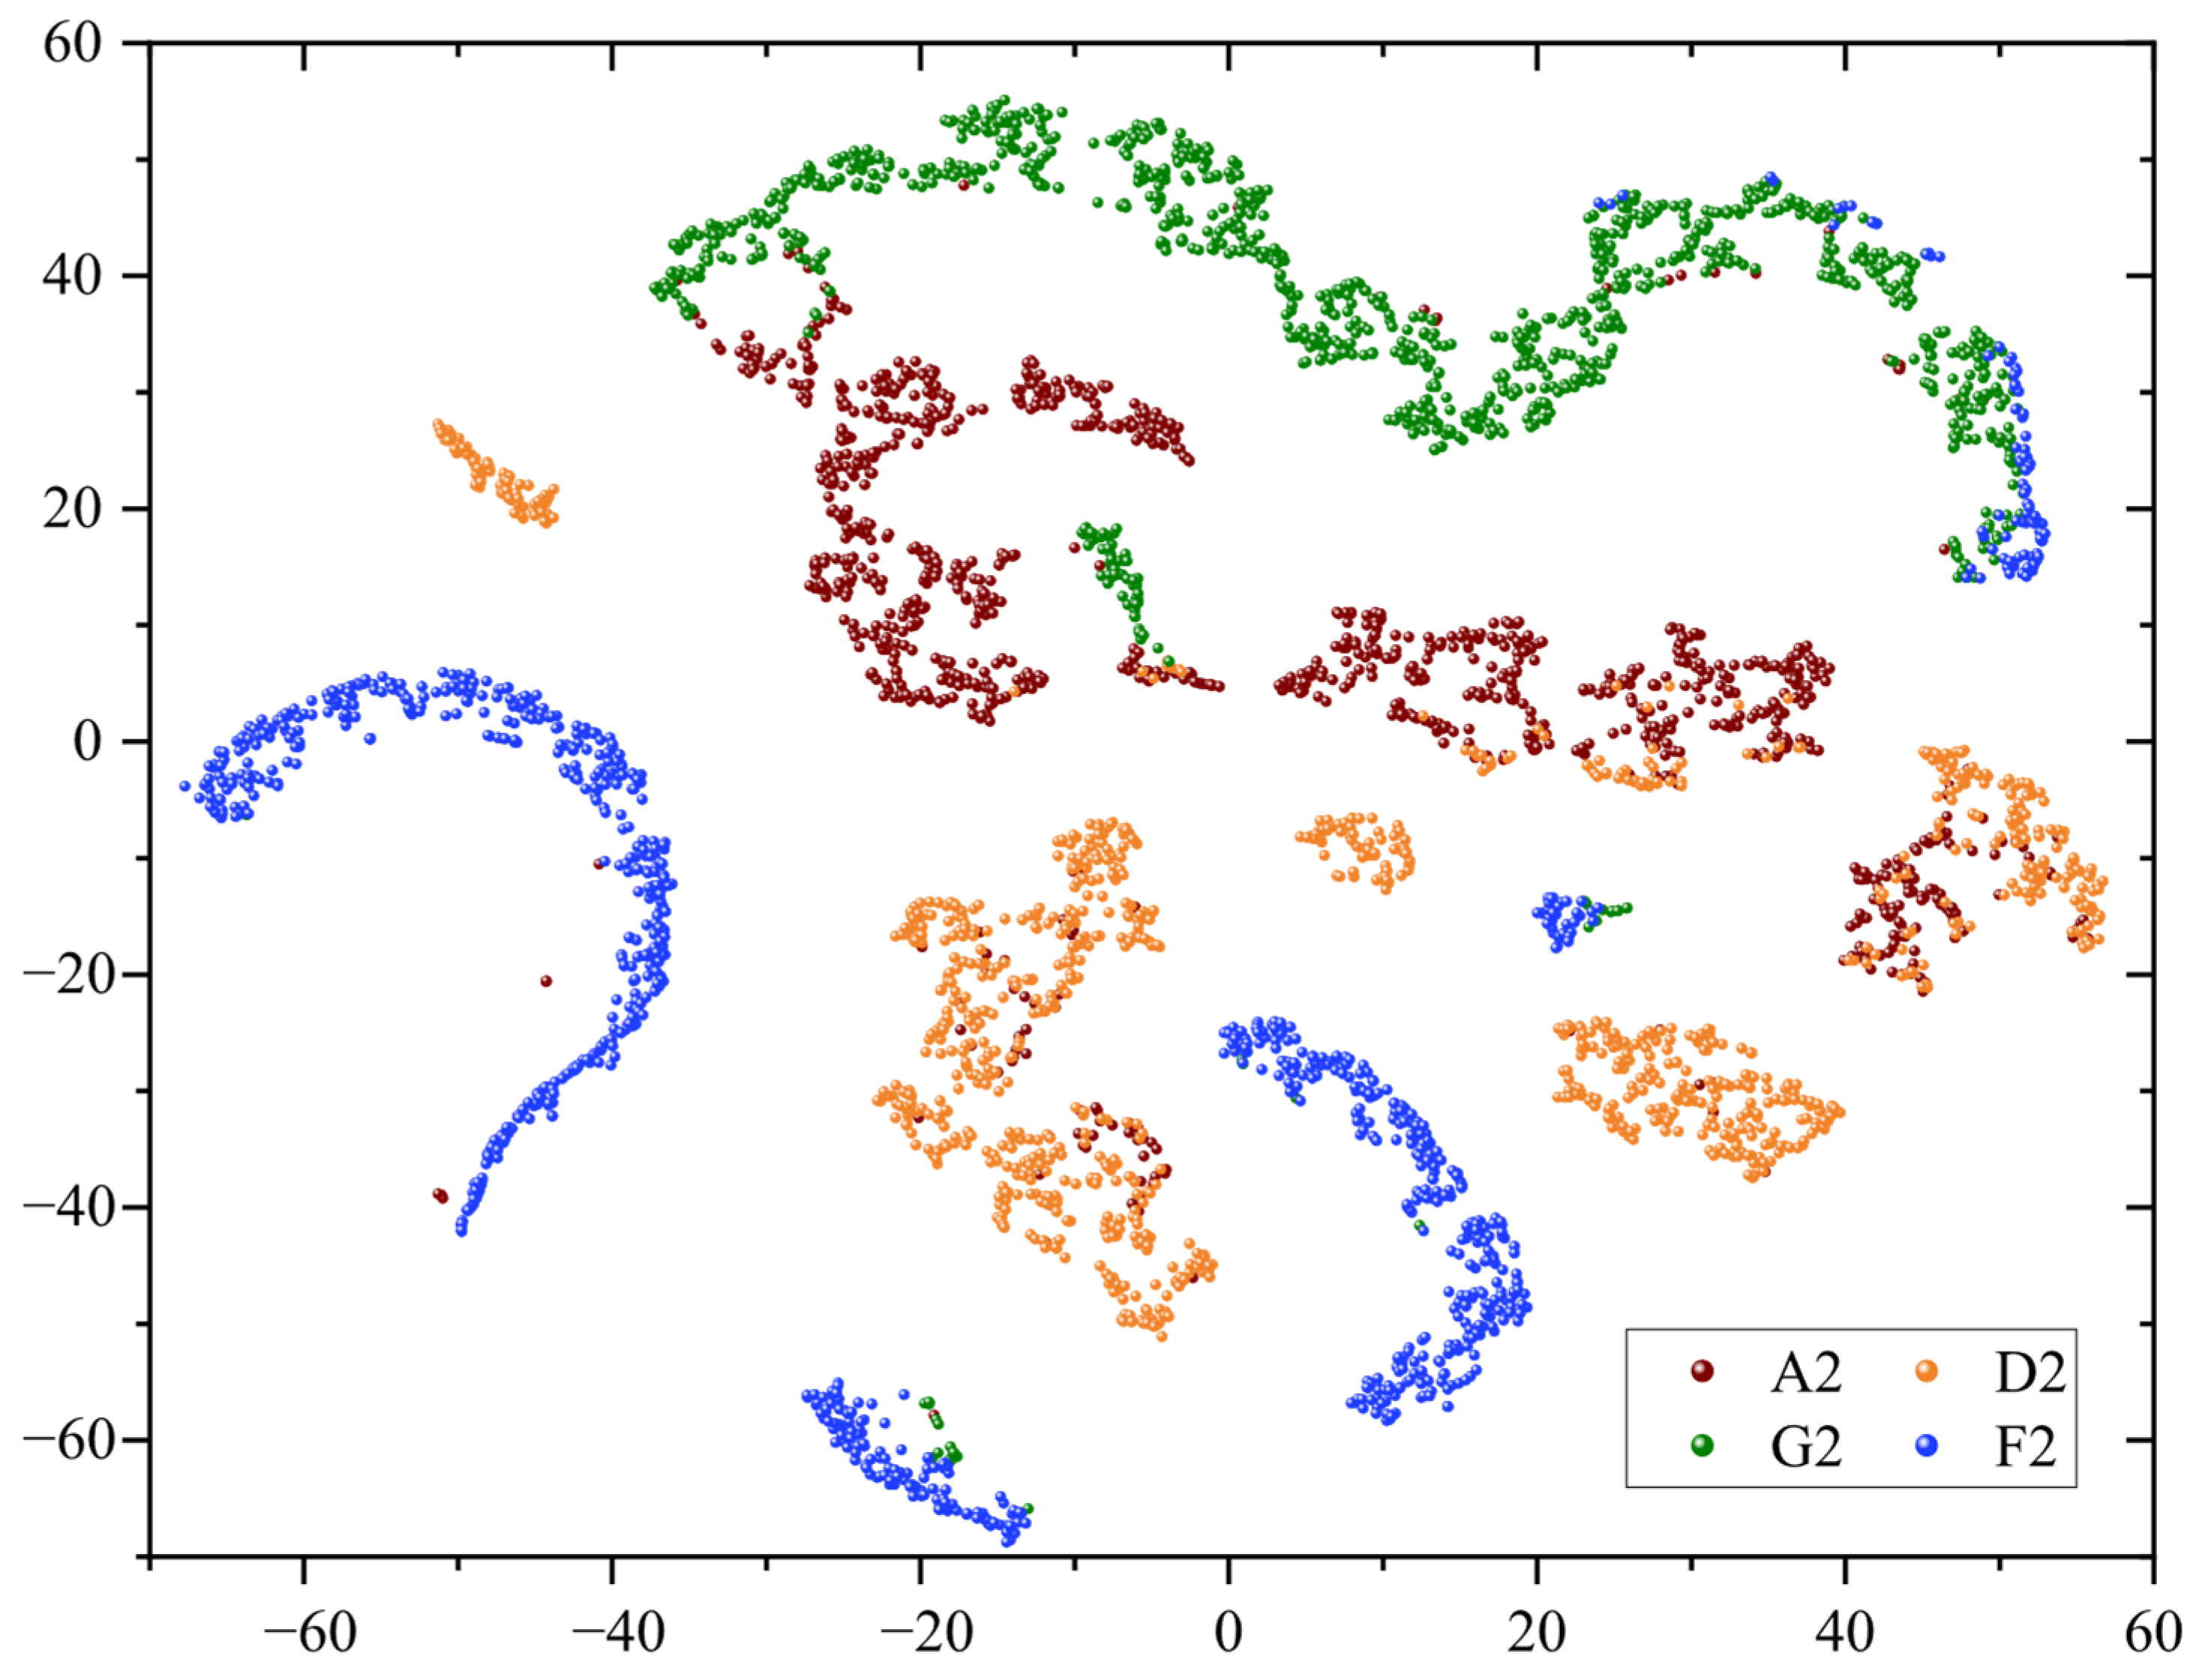
Based on the preceding experimental results, although the proposed method achieves high overall accuracy in multi-class fault arc recognition, the recognition accuracy for classes A2 and G2 is relatively lower. To investigate the underlying causes and provide directions for future research, we conducted a t-distributed Stochastic Neighbor Embedding (t-SNE) dimensionality reduction analysis on the singular spectrum statistical feature sets of fault arcs in classes A2, D2, G2, and F2, as shown in Figure 9. The visualization reveals that G2 and A2 are adjacent in the feature space with partial overlap (particularly in the central and upper-right regions), while D2 and F2 exhibit noticeable mixing in the lower and central regions. Generally, such phenomena may arise from data imbalance or quality issues, missing key discriminative features, feature redundancy, and noise interference. Since the dataset in this study is balanced and of high quality, the lower accuracy for A2 and G2 may be attributed to (i) insufficient singular spectrum feature extraction, failing to capture certain key information; (ii) redundancy in the singular spectrum and lack of noise suppression; (iii) redundancy or insufficiency in the nine statistical features; and (iv) the feature set considering only singular spectrum amplitudes without incorporating the frequency-domain distribution information. Future work will address these aspects in greater depth.

6. Conclusions

To address the insufficient identification rate of series AC fault arcs, this article proposes a novel series arc fault detection method integrating singular spectrum statistical features with an XGBoost classifier. The approach first extracts the singular spectrum statistical feature sets from current waveforms under diverse fault arc conditions. These features are then utilized as the input data for an XGBoost classifier optimized via a differential evolution algorithm, ultimately constructing an optimal arc fault identification model. The experimental results demonstrate that (1) the proposed method achieves a 98.90% success rate in identifying 16 fault scenarios using only three nominal cycles of sampling length; (2) it maintains a 97.11% recognition accuracy with merely 5% of the dataset as the training samples, showcasing exceptional generalization capability; (3) the solution operates effectively without high sampling frequencies or extended observation windows, enabling rapid response times and seamless deployment on resource-constrained embedded platforms; and (4) compared to mainstream methods (BPNN, SVM, and RNN), it outperforms by three percentage points in its overall recognition accuracy, demonstrating significant advantages.

Author Contributions

Conceptualization, D.X., J.S. and S.Y.; Methodology, J.S., D.X. and S.Y.; Writing—original draft, D.X., Y.X. and R.S.; Writing—review and editing, J.S., Y.X. and P.Z.; Supervision, S.Y. and P.Z.; Funding acquisition, S.Y. All authors have read and agreed to the published version of the manuscript.

Funding

This work was supported by the State Grid Technology Project of the Research and Application of Key Technologies for Measurement and Diagnosis of Low-Voltage Arc Fault with time–space factors from multiple Power Sources–Loads (Project No. 5700-202455276A-1-1-ZN).

Data Availability Statement

The data that support the findings of this study are available from the corresponding author upon reasonable request.

Conflicts of Interest

Dezhi Xiong and Shuai Yang were employed by State Grid Hunan Electric Power Company Limited Power Supply Service Center (Metrology Center). The remaining authors declare that the research was conducted in the absence of any commercial or financial relationships that could be construed as a potential conflict of interest.

References

  1. Zhang, Y.; Chen, H.C.; Li, Z.; Jia, C.; Du, Y.; Zhang, K.; Wei, H. Lightweight AC Arc Fault Detection Method by Integration of Event-Based Load Classification. IEEE Trans. Ind. Electron. 2024, 71, 4130–4140. [Google Scholar] [CrossRef]
  2. Zhang, J.; Li, Y.; Lin, J.; Hu, S.; Cao, Y.; He, L.; Yang, X.; Xu, Y.; Zeng, L.; Xie, L. A bi-layer coordinated power regulation strategy considering system dynamics and economics for isolated hybrid AC/DC multi-energy microgrid. Sci. China Technol. Sci. 2024, 68, 1121001. [Google Scholar] [CrossRef]
  3. Liu, B.; Zeng, X. AC Series Arc Fault Modeling for Power Supply Systems Based on Electric-to-Thermal Energy Conversion. IEEE Trans. Ind. Electron. 2023, 70, 4167–4174. [Google Scholar] [CrossRef]
  4. Ji, C.; Wang, K.; Wang, Q.; Chen, Q.; Fan, M.; Xu, B.; Wang, X.; Zhao, W.; Xiong, L. Arc Detection Method for Single-Phase AC Series Fault Based on Current Convolution. Recent Adv. Electr. Electron. Eng. 2025, 18, 991–998. [Google Scholar] [CrossRef]
  5. Dhar, S.; Patnaik, R.K.; Dash, P.K. Fault Detection and Location of Photovoltaic Based DC Microgrid Using Differential Protection Strategy. IEEE Trans. Smart Grid 2018, 9, 4303–4312. [Google Scholar] [CrossRef]
  6. Yuventi, J. DC Electric Arc-Flash Hazard-Risk Evaluations for Photovoltaic Systems. IEEE Trans. Power Deliv. 2014, 29, 161–167. [Google Scholar] [CrossRef]
  7. Wang, Y.; Hou, L.; Paul, K.C.; Ban, Y.; Chen, C.; Zhao, T. ArcNet: Series AC Arc Fault Detection Based on Raw Current and Convolutional Neural Network. IEEE Trans. Ind. Inform. 2022, 18, 77–86. [Google Scholar] [CrossRef]
  8. Zhang, J.; Zou, J.; Xu, X.; Li, C.; Song, J.; Wen, H. High accuracy DFT-based frequency estimator for sine-wave in short records. Measurement 2025, 239, 115456. [Google Scholar] [CrossRef]
  9. Wang, K.; Wang, J.; Song, J.; Tang, L.; Shan, X.; Wen, H. Accurate DFT Method for Power System Frequency Estimation Considering Multi-Component Interference. IEEE Trans. Instrum. Meas. 2023, 72, 1–11. [Google Scholar] [CrossRef]
  10. Jiang, R.; Zheng, Y. Series Arc Fault Detection Using Regular Signals and Time-Series Reconstruction. IEEE Trans. Ind. Electron. 2023, 70, 2026–2036. [Google Scholar] [CrossRef]
  11. Miao, W.; Wang, Z.; Wang, F.; Lam, K.H.; Pong, P.W.T. Multicharacteristics Arc Model and Autocorrelation-Algorithm Based Arc Fault Detector for DC Microgrid. IEEE Trans. Ind. Electron. 2023, 70, 4875–4886. [Google Scholar] [CrossRef]
  12. Saleh, S.A.; Valdes, M.E.; Mardegan, C.S.; Alsayid, B. The State-of-the-Art Methods for Digital Detection and Identification of Arcing Current Faults. IEEE Trans. Ind. Appl. 2019, 55, 4536–4550. [Google Scholar] [CrossRef]
  13. Ananthan, S.N.; Bastos, A.F.; Santoso, S.; Feng, X.; Penney, C.; Gattozzi, A.; Hebner, R. Signatures of Series Arc Faults to Aid Arc Detection in Low-Voltage DC Systems. In Proceedings of the 2020 IEEE Power & Energy Society General Meeting (PESGM), Montreal, QC, Canada, 2–6 August 2020; pp. 1–5. [Google Scholar]
  14. Tisserand, E.; Lezama, J.; Schweitzer, P.; Berviller, Y. Series arcing detection by algebraic derivative of the current. Electr. Power Syst. Res. 2015, 119, 91–99. [Google Scholar] [CrossRef]
  15. Georgijevic, N.L.; Jankovic, M.V.; Srdic, S.; Radakovic, Z. The Detection of Series Arc Fault in Photovoltaic Systems Based on the Arc Current Entropy. IEEE Trans. Power Electron. 2016, 31, 5917–5930. [Google Scholar] [CrossRef]
  16. Zhang, S.; Qu, N.; Zheng, T.; Hu, C. Series Arc Fault Detection Based on Wavelet Compression Reconstruction Data Enhancement and Deep Residual Network. IEEE Trans. Instrum. Meas. 2022, 71, 1–9. [Google Scholar] [CrossRef]
  17. He, Z.; Xu, Z.; Zhao, H.; Li, W.; Zhen, Y.; Ning, W. Detecting Series Arc Faults Using High-Frequency Components of Branch Voltage Coupling Signal. IEEE Trans. Instrum. Meas. 2024, 73, 1–13. [Google Scholar] [CrossRef]
  18. Jiang, J.; Wen, Z.; Zhao, M.; Bie, Y.; Li, C.; Tan, M.; Zhang, C. Series Arc Detection and Complex Load Recognition Based on Principal Component Analysis and Support Vector Machine. IEEE Access 2019, 7, 47221–47229. [Google Scholar] [CrossRef]
  19. Hwang, S.; Kim, B.; Kim, M.; Park, H.-P. AC Series Arc Fault Detection for Wind Power Systems Based on Phase Lock Loop with Time and Frequency Domain Analyses. IEEE Trans. Power Electron. 2024, 39, 12446–12455. [Google Scholar] [CrossRef]
  20. Cai, X.; Wai, R.-J. Intelligent DC Arc-Fault Detection of Solar PV Power Generation System via Optimized VMD-Based Signal Processing and PSO–SVM Classifier. IEEE J. Photovolt. 2022, 12, 1058–1077. [Google Scholar] [CrossRef]
  21. Song, J.; Shan, X.; Zhang, J.; Wen, H. Parameter Estimation of Power System Oscillation Signals under Power Swing Based on Clarke–Discrete Fourier Transform. Electronics 2024, 13, 297. [Google Scholar] [CrossRef]
  22. Wang, K.; Zhong, F.; Song, J.; Yu, Z.; Tang, L.; Tang, X.; Yao, Q. Power System Frequency Estimation with Zero Response Time Under Abrupt Transients. IEEE Trans. Circuits Syst. I Regul. Pap. 2025, 72, 467–480. [Google Scholar] [CrossRef]
  23. Song, J.; Mingotti, A.; Zhang, J.; Peretto, L.; Wen, H. Fast Iterative-Interpolated DFT Phasor Estimator Considering Out-of-Band Interference. IEEE Trans. Instrum. Meas. 2022, 71, 1–14. [Google Scholar] [CrossRef]
  24. Yin, Z.; Wang, L.; Zhang, B.; Meng, L.; Zhang, Y. An Integrated DC Series Arc Fault Detection Method for Different Operating Conditions. IEEE Trans. Ind. Electron. 2021, 68, 12720–12729. [Google Scholar] [CrossRef]
  25. Qi, P.; Jovanovic, S.; Lezama, J.; Schweitzer, P. Discrete wavelet transform optimal parameters estimation for arc fault detection in low-voltage residential power networks. Electr. Power Syst. Res. 2017, 143, 130–139. [Google Scholar] [CrossRef]
  26. Shi, B.; Ma, Z.; Liu, J.; Ni, X.; Xiao, W.; Liu, H. Shadow Extraction Method Based on Multi-Information Fusion and Discrete Wavelet Transform. IEEE Trans. Instrum. Meas. 2022, 71, 1–15. [Google Scholar] [CrossRef]
  27. Osman, S.; Wang, W. A Morphological Hilbert-Huang Transform Technique for Bearing Fault Detection. IEEE Trans. Instrum. Meas. 2016, 65, 2646–2656. [Google Scholar] [CrossRef]
  28. Artale, G.; Cataliotti, A.; Cosentino, V.; Di Cara, D.; Nuccio, S.; Tine, G. Arc Fault Detection Method Based on CZT Low-Frequency Harmonic Current Analysis. IEEE Trans. Instrum. Meas. 2017, 66, 888–896. [Google Scholar] [CrossRef]
  29. Da Rocha, G.S.; Pulz, L.T.C.; Gazzana, D.S. Serial Arc Fault Detection Through Wavelet Transform and Support Vector Machine. In Proceedings of the 2021 IEEE International Conference on Environment and Electrical Engineering and 2021 IEEE Industrial and Commercial Power Systems Europe (EEEIC/I&CPS Europe), Bari, Italy, 7–10 September 2021; pp. 1–5. [Google Scholar]
  30. Wu, N.; Peng, M.; Wang, J.; Wang, H.; Lu, Q.; Wu, M.; Zhang, H.; Ni, F. Research on Series Arc Fault Detection Method Based on the Combination of Load Recognition and MLP-SVM. IEEE Access 2024, 12, 100186–100199. [Google Scholar] [CrossRef]
  31. Han, C.; Wang, Z.; Tang, A.; Gao, H.; Guo, F. Recognition method of AC series arc fault characteristics under complicated harmonic conditions. IEEE Trans. Instrum. Meas. 2021, 70, 1–9. [Google Scholar] [CrossRef]
  32. Miao, W.; Xu, Q.; Lam, K.H.; Pong, P.W.T.; Poor, H.V. DC Arc-Fault Detection Based on Empirical Mode Decomposition of Arc Signatures and Support Vector Machine. IEEE Sens. J. 2021, 21, 7024–7033. [Google Scholar] [CrossRef]
  33. Jegadeeshwaran, R.; Sugumaran, V. Comparative study of decision tree classifier and best first tree classifier for fault diagnosis of automobile hydraulic brake system using statistical features. Measurement 2013, 46, 3247–3260. [Google Scholar] [CrossRef]
  34. Dong, X.; Li, G.; Jia, Y.; Xu, K. Multiscale feature extraction from the perspective of graph for hob fault diagnosis using spectral graph wavelet transform combined with improved random forest. Measurement 2021, 176, 109178. [Google Scholar] [CrossRef]
  35. Zhang, D.; Qian, L.; Mao, B.; Huang, C.; Huang, B.; Si, Y. A Data-Driven Design for Fault Detection of Wind Turbines Using Random Forests and XGboost. IEEE Access 2018, 6, 21020–21031. [Google Scholar] [CrossRef]
  36. Ma, S.; Guan, L. Arc-Fault Recognition Based on BP Neural Network. In Proceedings of the 2011 Third International Conference on Measuring Technology and Mechatronics Automation, Shanghai, China, 6–7 January 2011; pp. 584–586. [Google Scholar]
  37. Han, X.; Li, D.; Huang, L.; Huang, H.; Yang, J.; Zhang, Y.; Wu, X.; Lu, Q. Series Arc Fault Detection Method Based on Category Recognition and Artificial Neural Network. Electronics 2020, 9, 1367. [Google Scholar] [CrossRef]
  38. Yang, K.; Chu, R.; Zhang, R.; Xiao, J.; Tu, R. A Novel Methodology for Series Arc Fault Detection by Temporal Domain Visualization and Convolutional Neural Network. Sensors 2019, 20, 162. [Google Scholar] [CrossRef]
  39. Cao, Y.; Cheng, X.; Mu, J.; Li, D.; Han, F. Detection Method Based on Image Enhancement and an Improved Faster R-CNN for Failed Satellite Components. IEEE Trans. Instrum. Meas. 2023, 72, 1–13. [Google Scholar] [CrossRef]
  40. Li, W.; Liu, Y.; Li, Y.; Guo, F. Series Arc Fault Diagnosis and Line Selection Method Based on Recurrent Neural Network. IEEE Access 2020, 8, 177815–177822. [Google Scholar] [CrossRef]
  41. Song, J.; Zhang, J.; Wen, H. Accurate Dynamic Phasor Estimation by Matrix Pencil and Taylor Weighted Least Squares Method. IEEE Trans. Instrum. Meas. 2021, 70, 1–11. [Google Scholar] [CrossRef]
  42. Chen, T.; Guestrin, C. XGBoost: A Scalable Tree Boosting System. In Proceedings of the 22nd ACM SIGKDD International Conference on Knowledge Discovery and Data Mining, San Francisco, CA, USA, 13–17 August 2016; pp. 785–794. [Google Scholar]
  43. Yan, Z.; Wen, H. Electricity Theft Detection Base on Extreme Gradient Boosting in AMI. IEEE Trans. Instrum. Meas. 2021, 70, 1–9. [Google Scholar] [CrossRef]
  44. Liang, B.; Qin, W.; Liao, Z. A Differential Evolutionary-Based XGBoost for Solving Classification of Physical Fitness Test Data of College Students. Mathematics 2025, 13, 1405. [Google Scholar] [CrossRef]
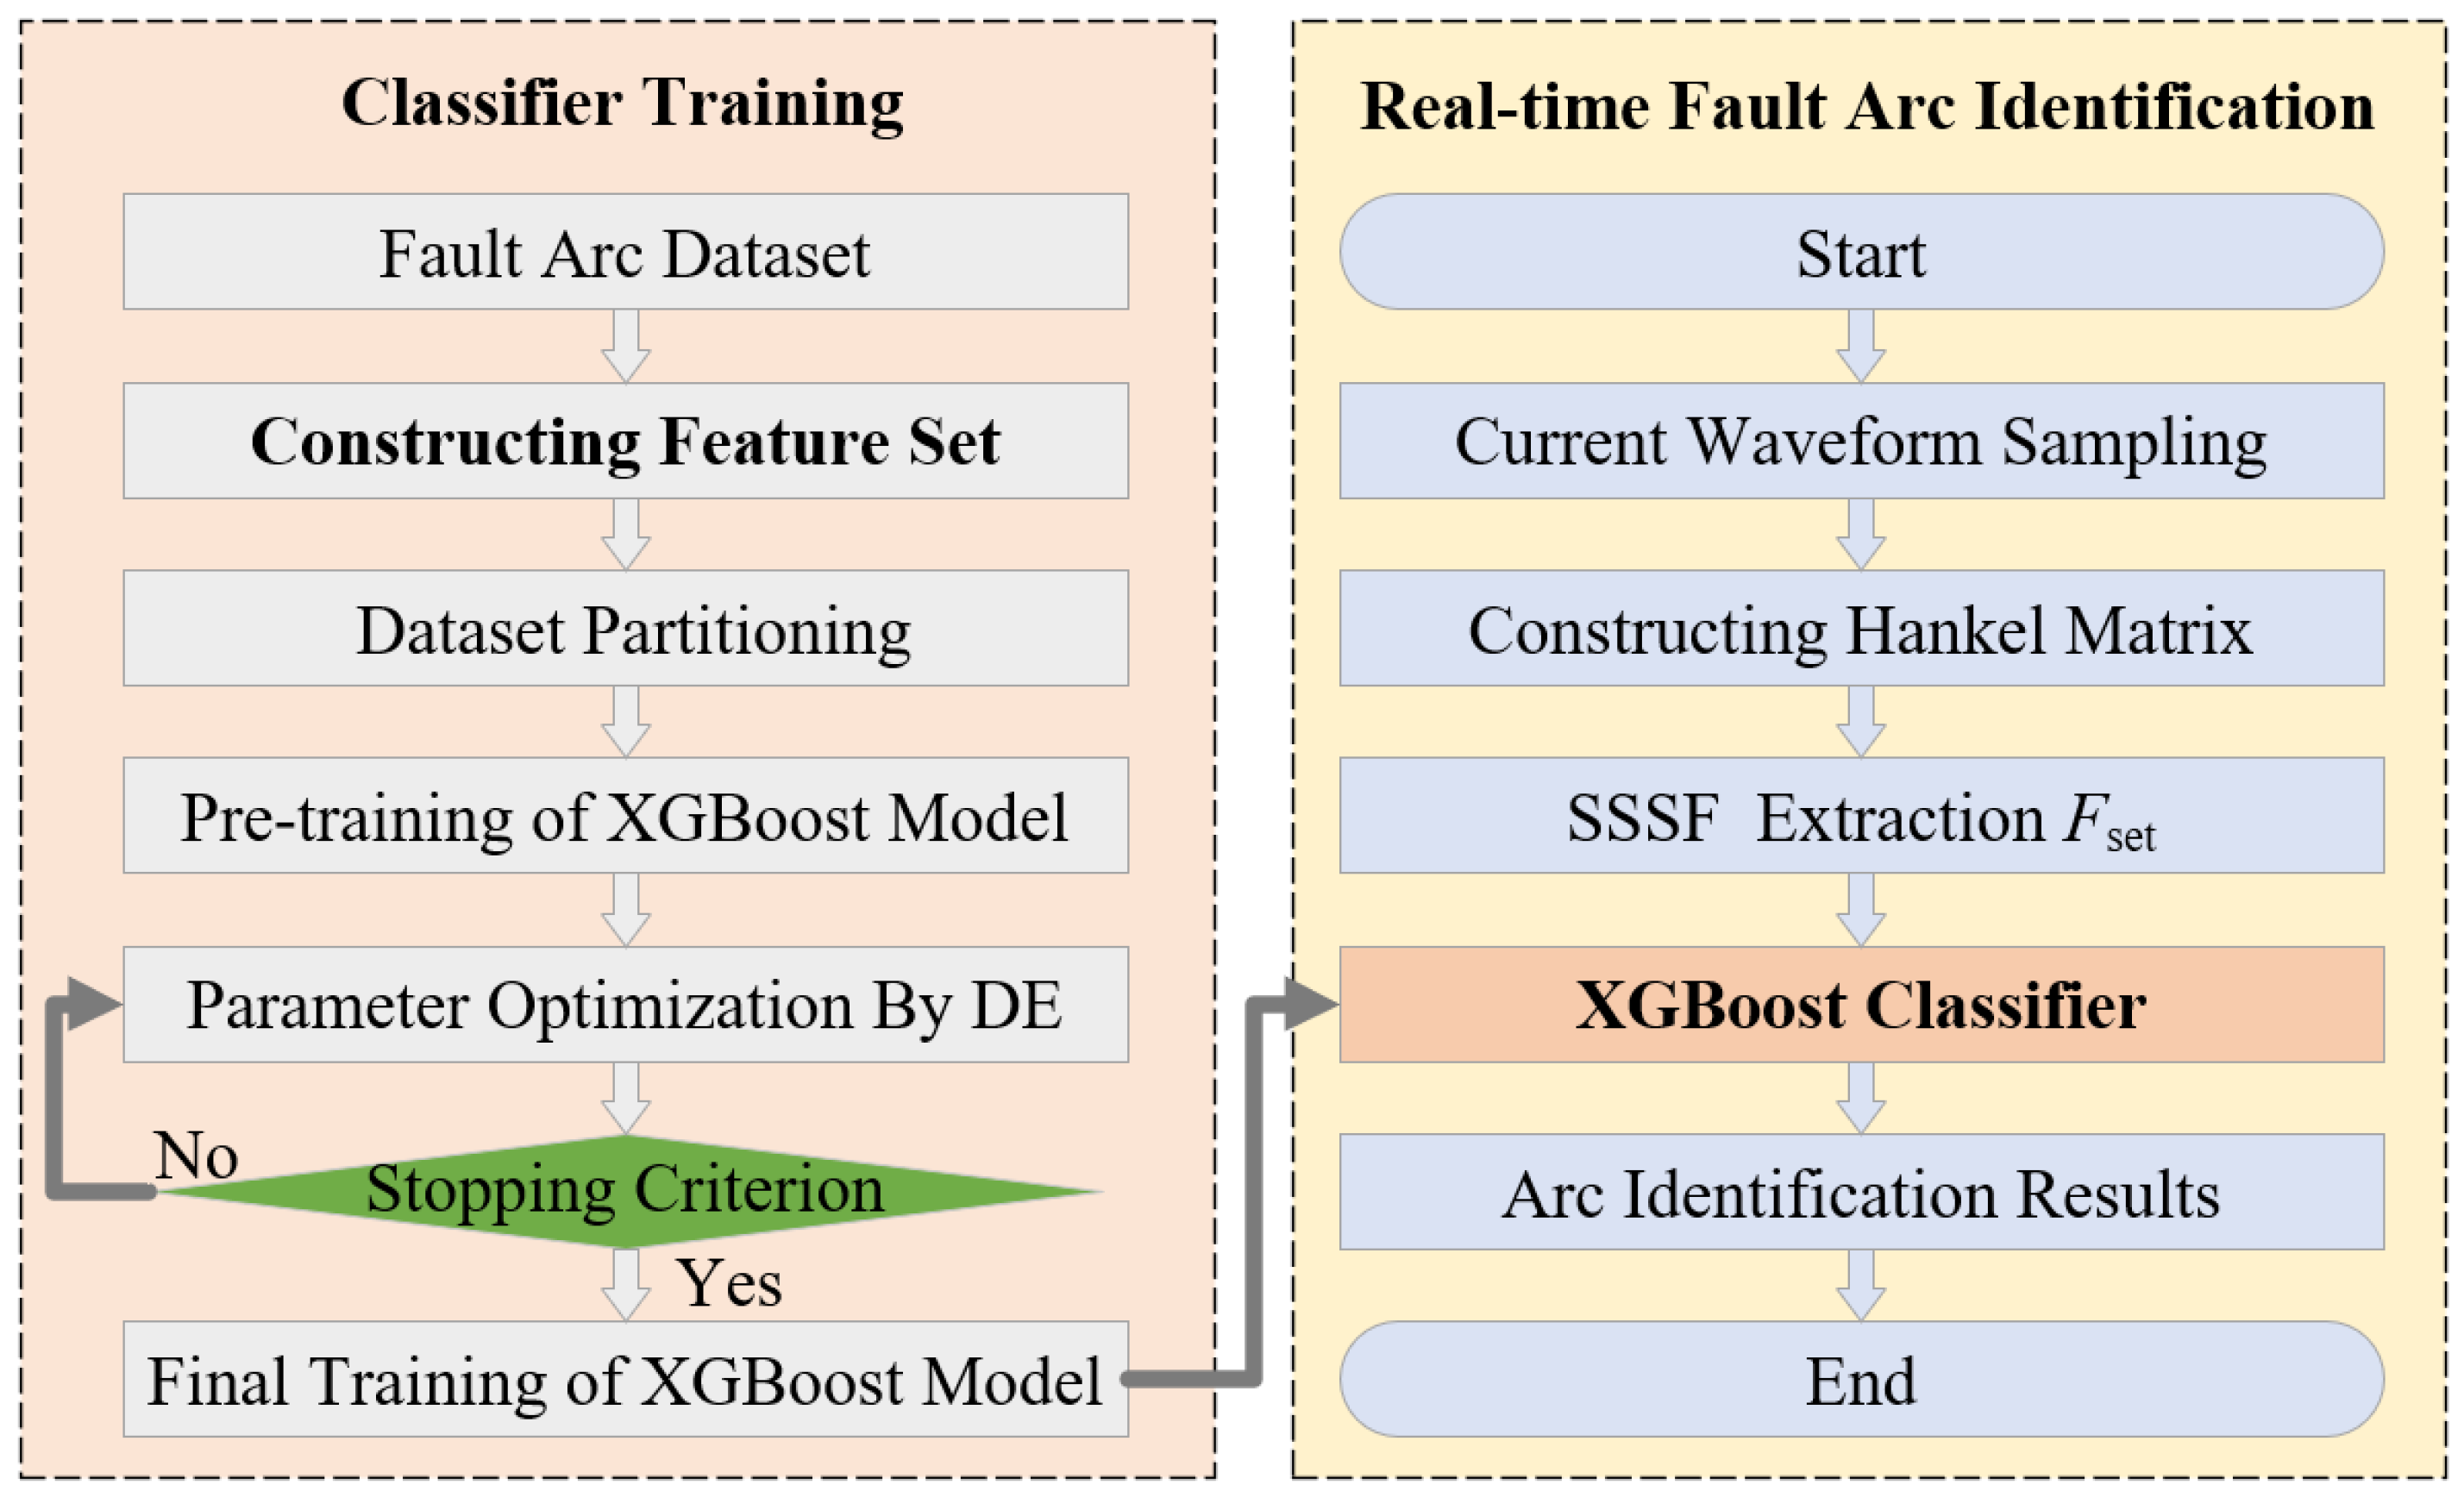
Figure 1. Overall flowchart of the proposed method. The abbreviation “DE” denotes differential evolution, and “SSSF” denotes singular spectrum statistical features.
Electronics 14 03337 g001
Figure 2. Arc fault current acquisition circuit schematic.
Electronics 14 03337 g002
Figure 3. Waveform diagrams of different types of arc fault currents.
Electronics 14 03337 g003
Figure 4. Confusion matrix of total test results.
Electronics 14 03337 g004
Figure 5. Precision under different proportions of training set in dataset.
Electronics 14 03337 g005
Figure 6. Recall under different proportions of training set in dataset.
Electronics 14 03337 g006
Figure 7. F1-score under different proportions of training set in dataset.
Electronics 14 03337 g007
Figure 8. Accuracy under different proportions of training set in dataset.
Electronics 14 03337 g008
Figure 9. t-SNE visualization of the feature distributions for classes A2, D2, G2, and F2.
Electronics 14 03337 g009
Table 1. The parameters of the adopted XGBoost classifier.
ParametersSearch RangeOptimal Selection
learning_rate[0.02, 0.5]0.1321
n_estimators[10, 50]17
max_depth[5, 30]10
subsample[0.2, 1]0.7921
colsample_bytree[0.2, 1]0.5934
reg_lambda[0, 1]0.8
min_child_weight[0, 1]0.4823
Table 2. Parameters of adopted loads.
Load TypesLoad CombinationPower/W
1Electric Fan60
2Incandescent Lamp300
3Dust Catcher1100
4Evaporative Cooling Fan65
5Monitor18
6Electric Fan + Monitor60 + 18
7Evaporative Cooling Fan + Monitor65 + 18
8Electric Fan + Evaporative Cooling Fan + Monitor60 + 65 + 18
Table 3. Classifications and labels of fault arc dataset.
Load TypesWorking ConditionsLabelLoad TypesWorking ConditionsLabel
1NormalA15NormalE1
Fault ArcA2Fault ArcE2
2NormalB16NormalF1
Fault ArcB2Fault ArcF2
3NormalC17NormalG1
Fault ArcC2Fault ArcG2
4NormalD18NormalH1
Fault ArcD2Fault ArcH2
Table 4. Evaluation indicators for fault arc recognition using the proposed identification method.
LabelPrecisionRecallF1-ScoreSupport
A11.000.991.00342
A20.970.920.94342
B11.001.001.00342
B20.991.001.00342
C11.001.001.00342
C21.001.001.00342
D11.001.001.00342
D20.940.970.95342
E11.001.001.00342
E21.001.001.00342
F11.001.001.00342
F20.960.990.97342
G11.001.001.00342
G20.970.950.96342
H11.001.001.00342
H21.001.001.00342
Accuracy--0.995472
Macro-Average0.990.990.995472
Weighted Average0.990.990.995472
Table 5. Fault arc detection success rates of different methods.
LabelBPNNSVMRNNProposed
A189.16%94.09%93.32%99.01%
A291.38%93.45%92.19%92.17%
B193.14%95.92%96.21%100.0%
B292.87%97.78%95.81%100.0%
C193.87%94.32%97.23%100.0%
C295.31%97.83%96.29%100.0%
D192.45%94.79%95.16%100.0%
D294.89%93.13%94.92%97.39%
E193.78%96.34%95.24%100.0%
E290.83%95.41%96.97%100.0%
F191.22%96.17%97.89%100.0%
F289.27%94.86%94.35%99.13%
G194.26%97.82%95.87%100.0%
G293.59%95.31%96.19%95.34%
H191.29%96.51%95.86%100.0%
H292.57%97.35%96.97%100.0%
Table 6. Execution time comparison averaged over 1000 runs.
MethodsWT-BPNNWT-SVMMLP-SVMRNNProposed
Avg Time23.76 ms10.34 ms17.93 ms37.49 ms7.21 ms
Disclaimer/Publisher’s Note: The statements, opinions and data contained in all publications are solely those of the individual author(s) and contributor(s) and not of MDPI and/or the editor(s). MDPI and/or the editor(s) disclaim responsibility for any injury to people or property resulting from any ideas, methods, instructions or products referred to in the content.