1. Introduction
Phased arrays (PAs), in which each antenna element transmits an electromagnetic signal with a different phase, have been widely used because they can illuminate a beam over a large distance in a specific angular direction [
1]. While the angle of a target can be readily determined, the target range can only be attained through the application of sophisticated techniques, such as the use of pulses or frequency modulation.
Recently, frequency diverse array (FDA) systems, which transmit continuous signals with different frequencies for each array element, have received considerable attention [
2]. FDA is a relatively new concept that was proposed in 2006 [
3]. For example, in a linear frequency offset FDA system, the first array element transmits a 10 GHz wave, the second element transmits a 10 GHz + 1 kHz wave, the third element transmits a 10 GHz+ 2 kHz wave, and so on. Unlike PA, FDA has a highly flexible beam pattern in the range-angle space [
4]. By adjusting the frequency offsets between the antenna elements, circle-shaped, bow-shaped, and even dot-shaped beam patterns can be formed [
2]. Due to their ability to form such interesting beam patterns, FDA systems have been investigated in many applications such as wireless power transmission [
5,
6] and secure communication [
7].
Many studies related to FDA have been conducted, focusing the transmitted beam at a specific point, and various frequency offset algorithms have been proposed for this purpose, including logarithmic [
8], square [
9], Hamming [
10], piecewise [
11], and others [
12,
13,
14], resulting in unique beam patterns. In addition, studies have also been performed on how to vary the frequency offset between antenna elements over time [
15,
16,
17]. Although these frequency allocation algorithms have shown that FDA systems can provide interesting point-like beam patterns, it is also verified that the focused beam inevitably moves or spreads over time [
18] due to the inherently time-varying beam pattern. This becomes a disadvantage in many applications, particularly in power transmission. As a result, FDA application has therefore moved to a new application: target localization.
The time-varying beam pattern of most FDAs can be an attractive feature from the point of view of target localization because the entire space can be swept without the additional device control required in ordinary PAs. However, challenges persist in employing FDA to target localization, largely due to the complexity of beam pattern analysis. It is not straightforward to calculate the location from the reflected signal, unlike with phased array. FDA signal is time-variant and range-angle-dependent. In order to solve this difficulty, different system architectures have been proposed. Systems using two subarrays [
19,
20], systems using band-limited arrays [
21], and systems using MIMO arrays [
22,
23,
24] have been proposed. These studies, which employed different array structures, showed the potential of FDA for target tracking through simulation. However, the focus of our research in this paper is not on the performance of these specialized FDA structures, but on the use of neural networks in a simple and implementable FDA radar. Many review articles are available to explore the details of the FDA’s research history [
2].
Artificial intelligence (AI) techniques such as neural networks are well suited to addressing this challenge. Because the temporal evolution of the beam pattern at one location differs from that at another location, it is certain that the reflected signal captured during a particular time period is likely to contain inherent information about the target location. For example, even if the reflected signals from two targets at different locations have similar amplitudes in a given time period, they will have different amplitudes in subsequent time periods due to frequency differences in each antenna element (if the FDA system is properly designed). A neural network can model difficult time-varying and range-angle-dependent signal without difficult mathematical modeling.
AI-based radar systems for ordinary radar have been widely studied in the literature. Convolution neural network (CNN)-based models are mainly considered as the neural network structure, since synthetic aperture radar (SAR) images or range-Doppler maps are considered as the main input [
25,
26,
27,
28,
29,
30]. There are several review papers that summarize numerous AI-based studies in all radar phases [
31,
32,
33]. However, there are few studies on AI-based approaches for FDA systems because most research on FDA focuses on designing new FDA structures rather than processing the reflected signal of FDA systems.
Regarding AI-based FDA target detection systems, multi-layer perceptron (MLP)-based systems have been attempted and show some promising results [
34]. However, only linear frequency FDA systems based on multi-Tx (Transmitter), multi-Rx (Receiver) configurations have been considered, and only in a single-target case.
In this paper, we propose the use of neural networks, specifically long-short-term memory (LSTM) networks [
35], to locate multiple targets simultaneously in a multi-Tx, single-Rx log-FDA radar system. The proposed system is rather simple and feasible to implement in real-world systems such as drone localization systems.
To the best of the authors’ knowledge, no previous work has attempted to locate multiple targets using an AI-based method in a Single-Rx FDA system. It is very difficult to thoroughly analyze time-varying reflected signals and locate multiple targets because the related signals are stacked into a single signal. In addition, there is always noise in the signal, making signal analysis even more difficult. However, neural network models are data-driven and can simultaneously integrate and analyze the effects of multiple targets, noise, and time-varying single-Rx signals.
The remainder of this paper is organized as follows.
Section 2 briefly introduces the structure of the FDA radar and
Section 3 describes the proposed localization system. Performance evaluation and conclusions are presented in
Section 4 and
Section 5, respectively.
2. Frequency Diverse Array Radar System
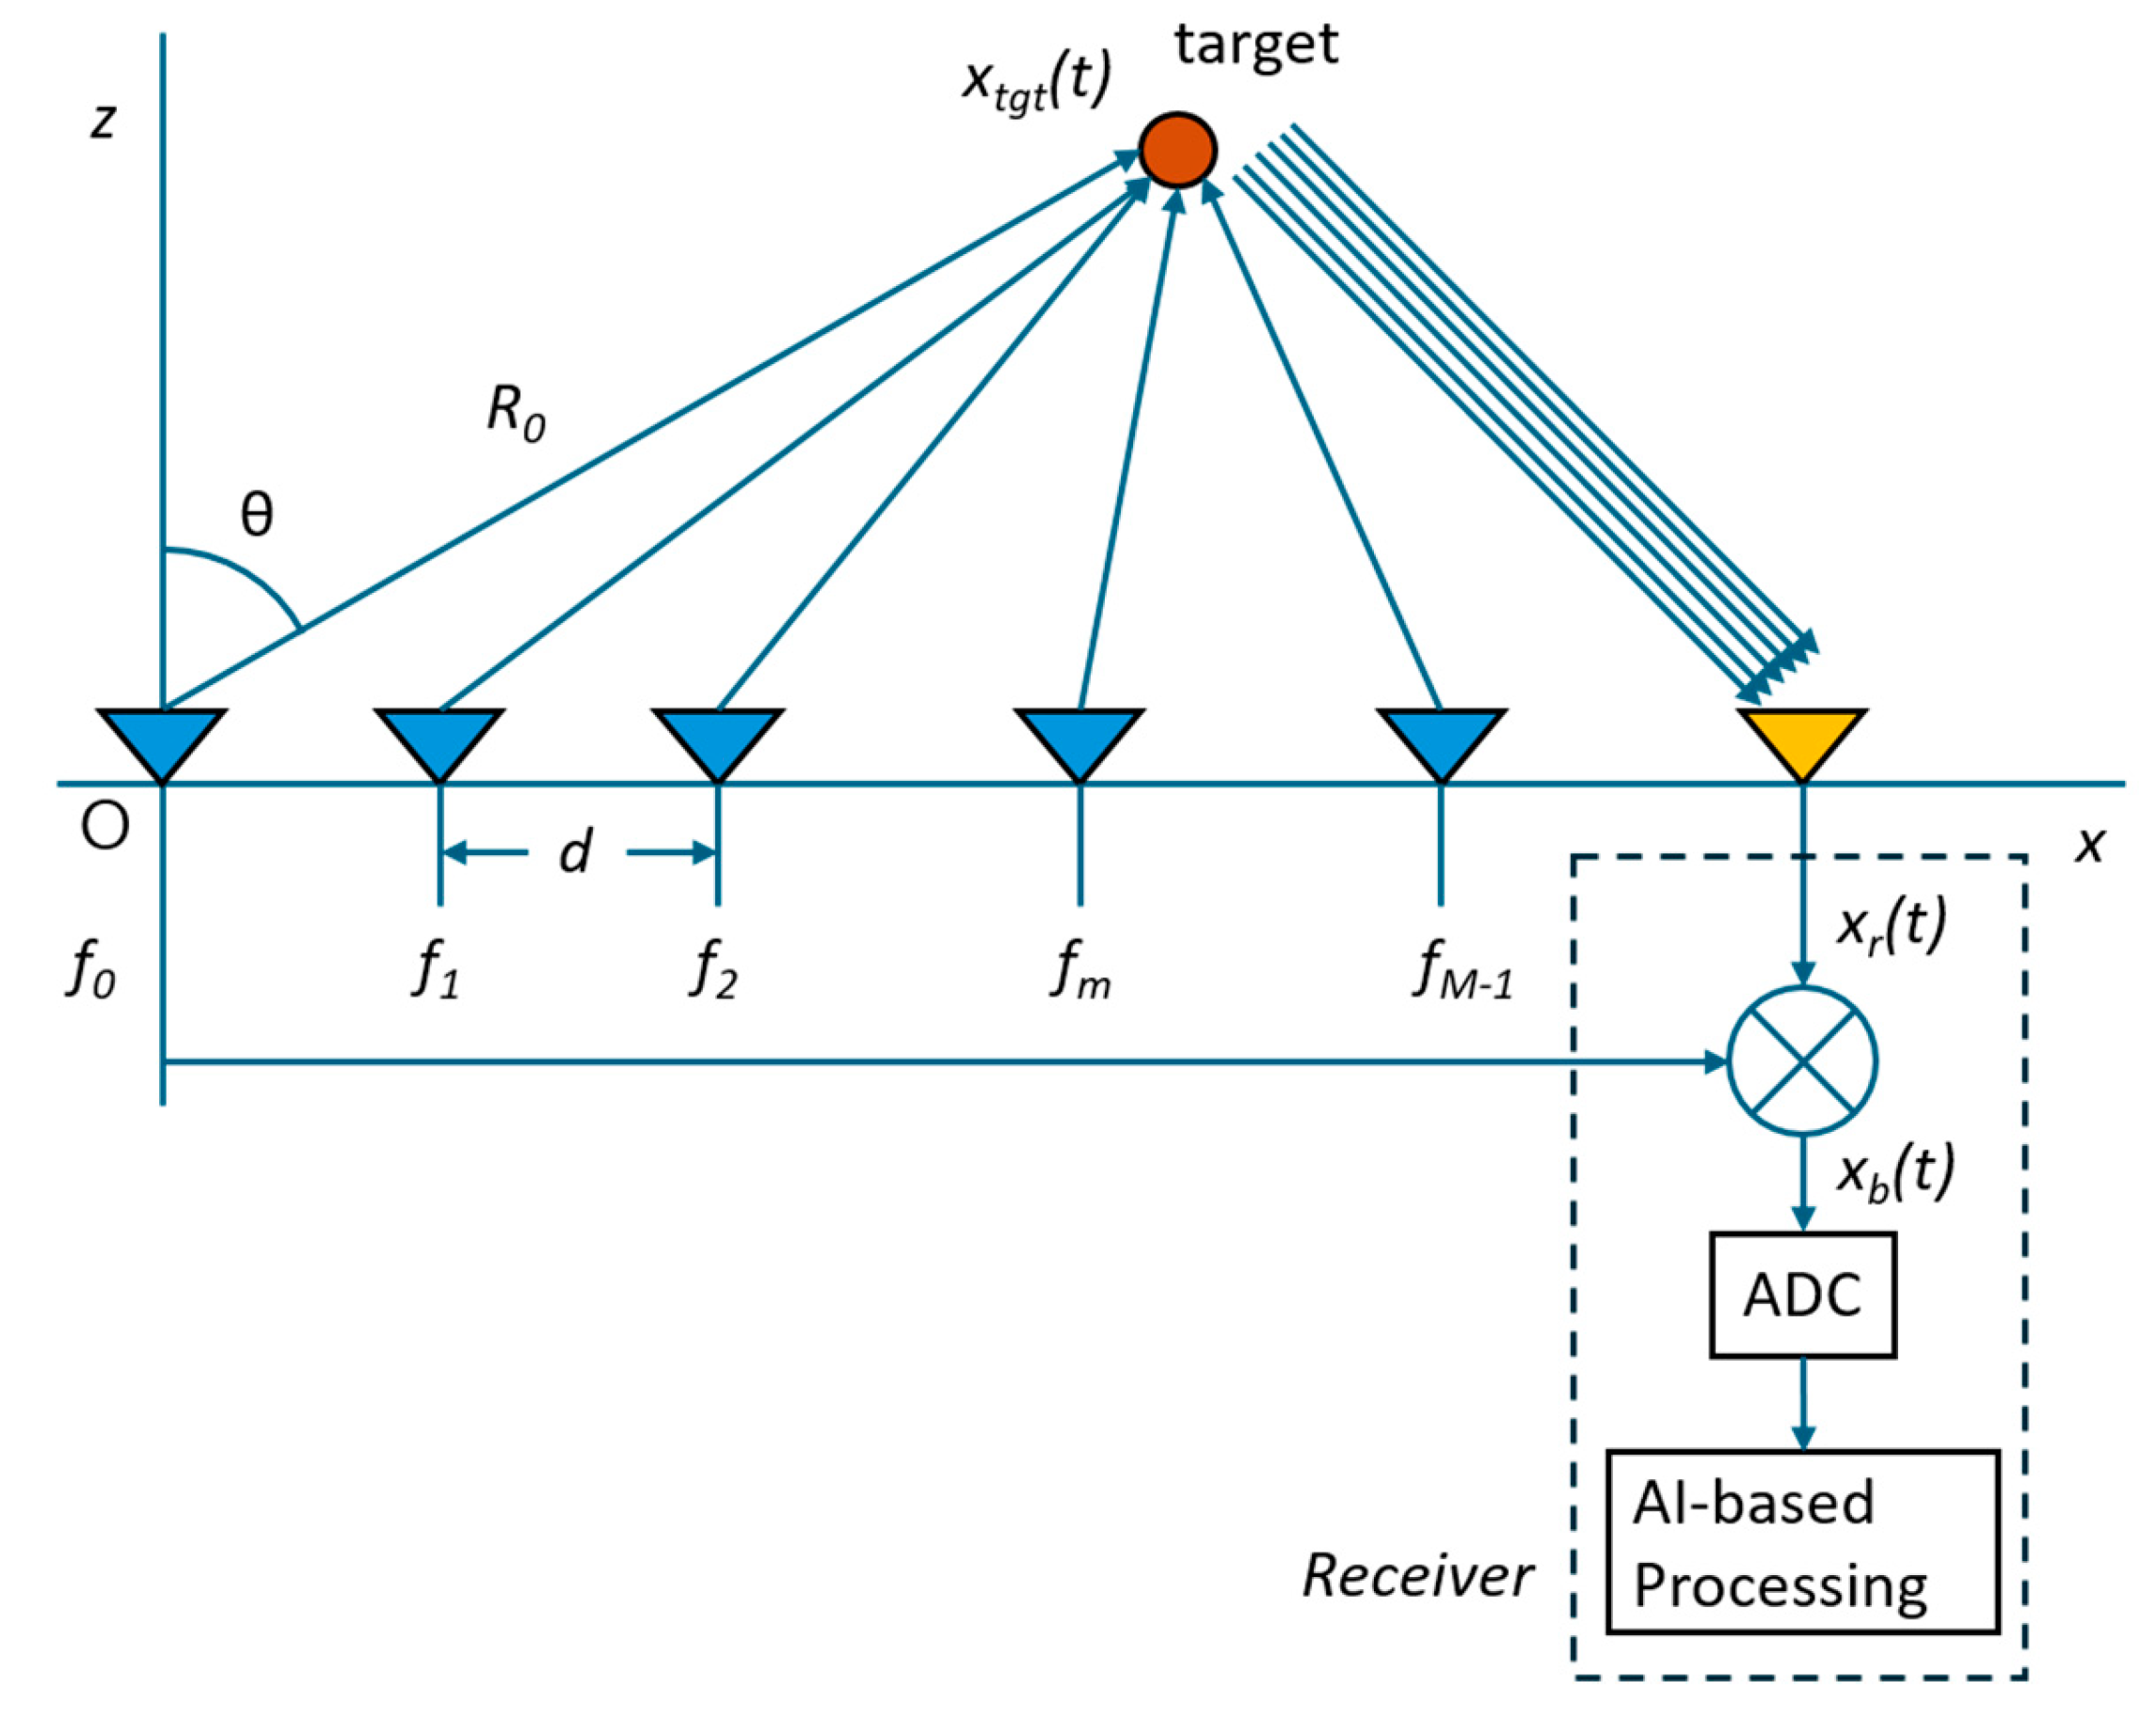
The FDA radar system that has multi-Tx and single-Rx is shown in
Figure 1, where an electromagnetic signal is radiated into the space at each array element with a different frequency. The antenna elements are spaced at regular intervals of
d.
For the Tx FDA with
M element, the signal at the
m-th element (
m = 0, 1, ⋯⋯,
M−1) is expressed as
where
Am is the amplitude weight,
fm =
f0 + Δ
fm.
f0 is the frequency of the RF carrier and Δ
fm is the frequency offset. The combined Tx signal at the target position is expressed as
where
is a time delay for the one-way range
R0 from the reference element (the left one) and the target position, and
. The Rx signal at the RF front-end becomes
and the baseband Rx signal obtained by a frequency down conversion is finally expressed as in Equation (4).
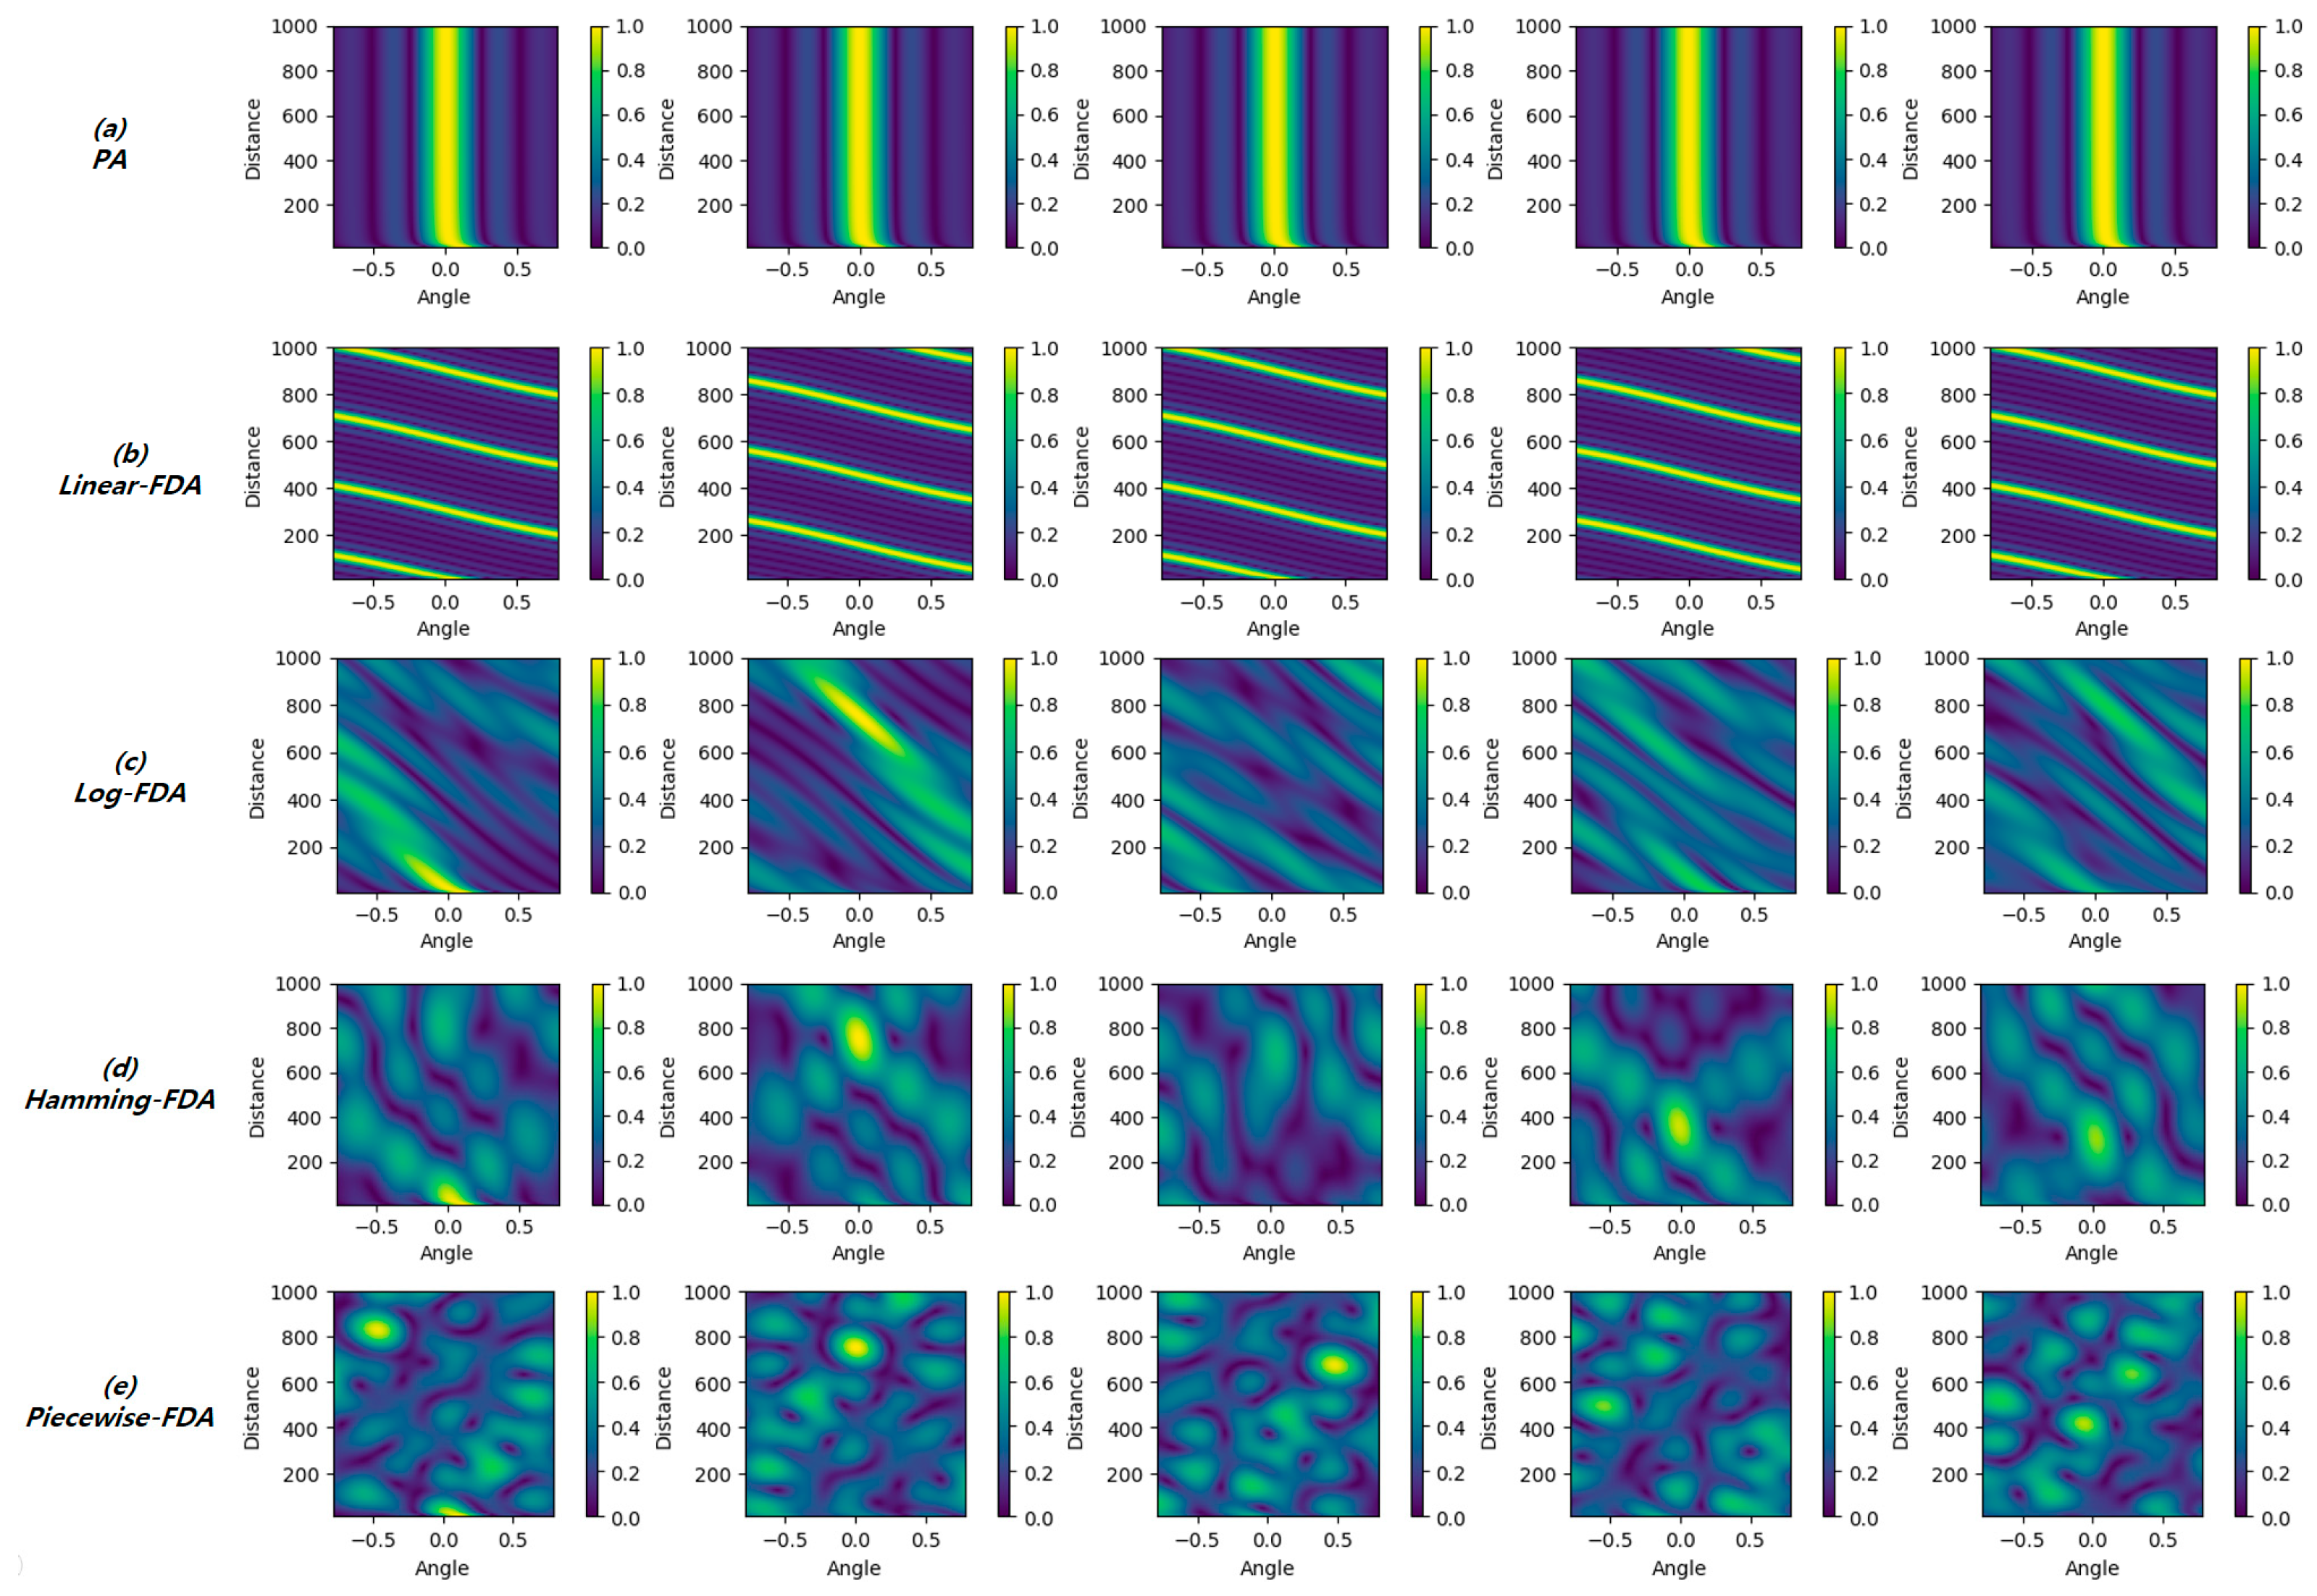
Figure 2 shows the normalized received signal strengths of PA and several FDA systems in a two-dimensional target space. The simulation plane is 10~1000 m and –π/4~π/4 rad. Eight antenna elements arranged in a row are assumed in the simulation and the signal strengths were acquired and plotted five times for a period of 10 μs (2 μs interval) to see the time-varying characteristics. In
Figure 2a, it is clear that the PA sends a beam in a given direction as described above, and this pattern does not change over time. However, the results of the FDA system in
Figure 2b–e are different from those of the PA. The focus of the signal is range-angle-dependent and, more importantly, it changes over time. The frequency offset method for each simulated FDA system is listed in
Table 1.
Because the FDA signal changes over time, it is possible that time series data of the reflected signals in a certain period of time carry information on target location. This time series data can be easily acquired without any additional device control. In the following section, the proposed AI-based localization structure that utilizes this data will be explained.
3. Proposed AI-Based Localization System
In a localization system, the signal is reflected from the target and received by an antenna near the transmitter, as shown in
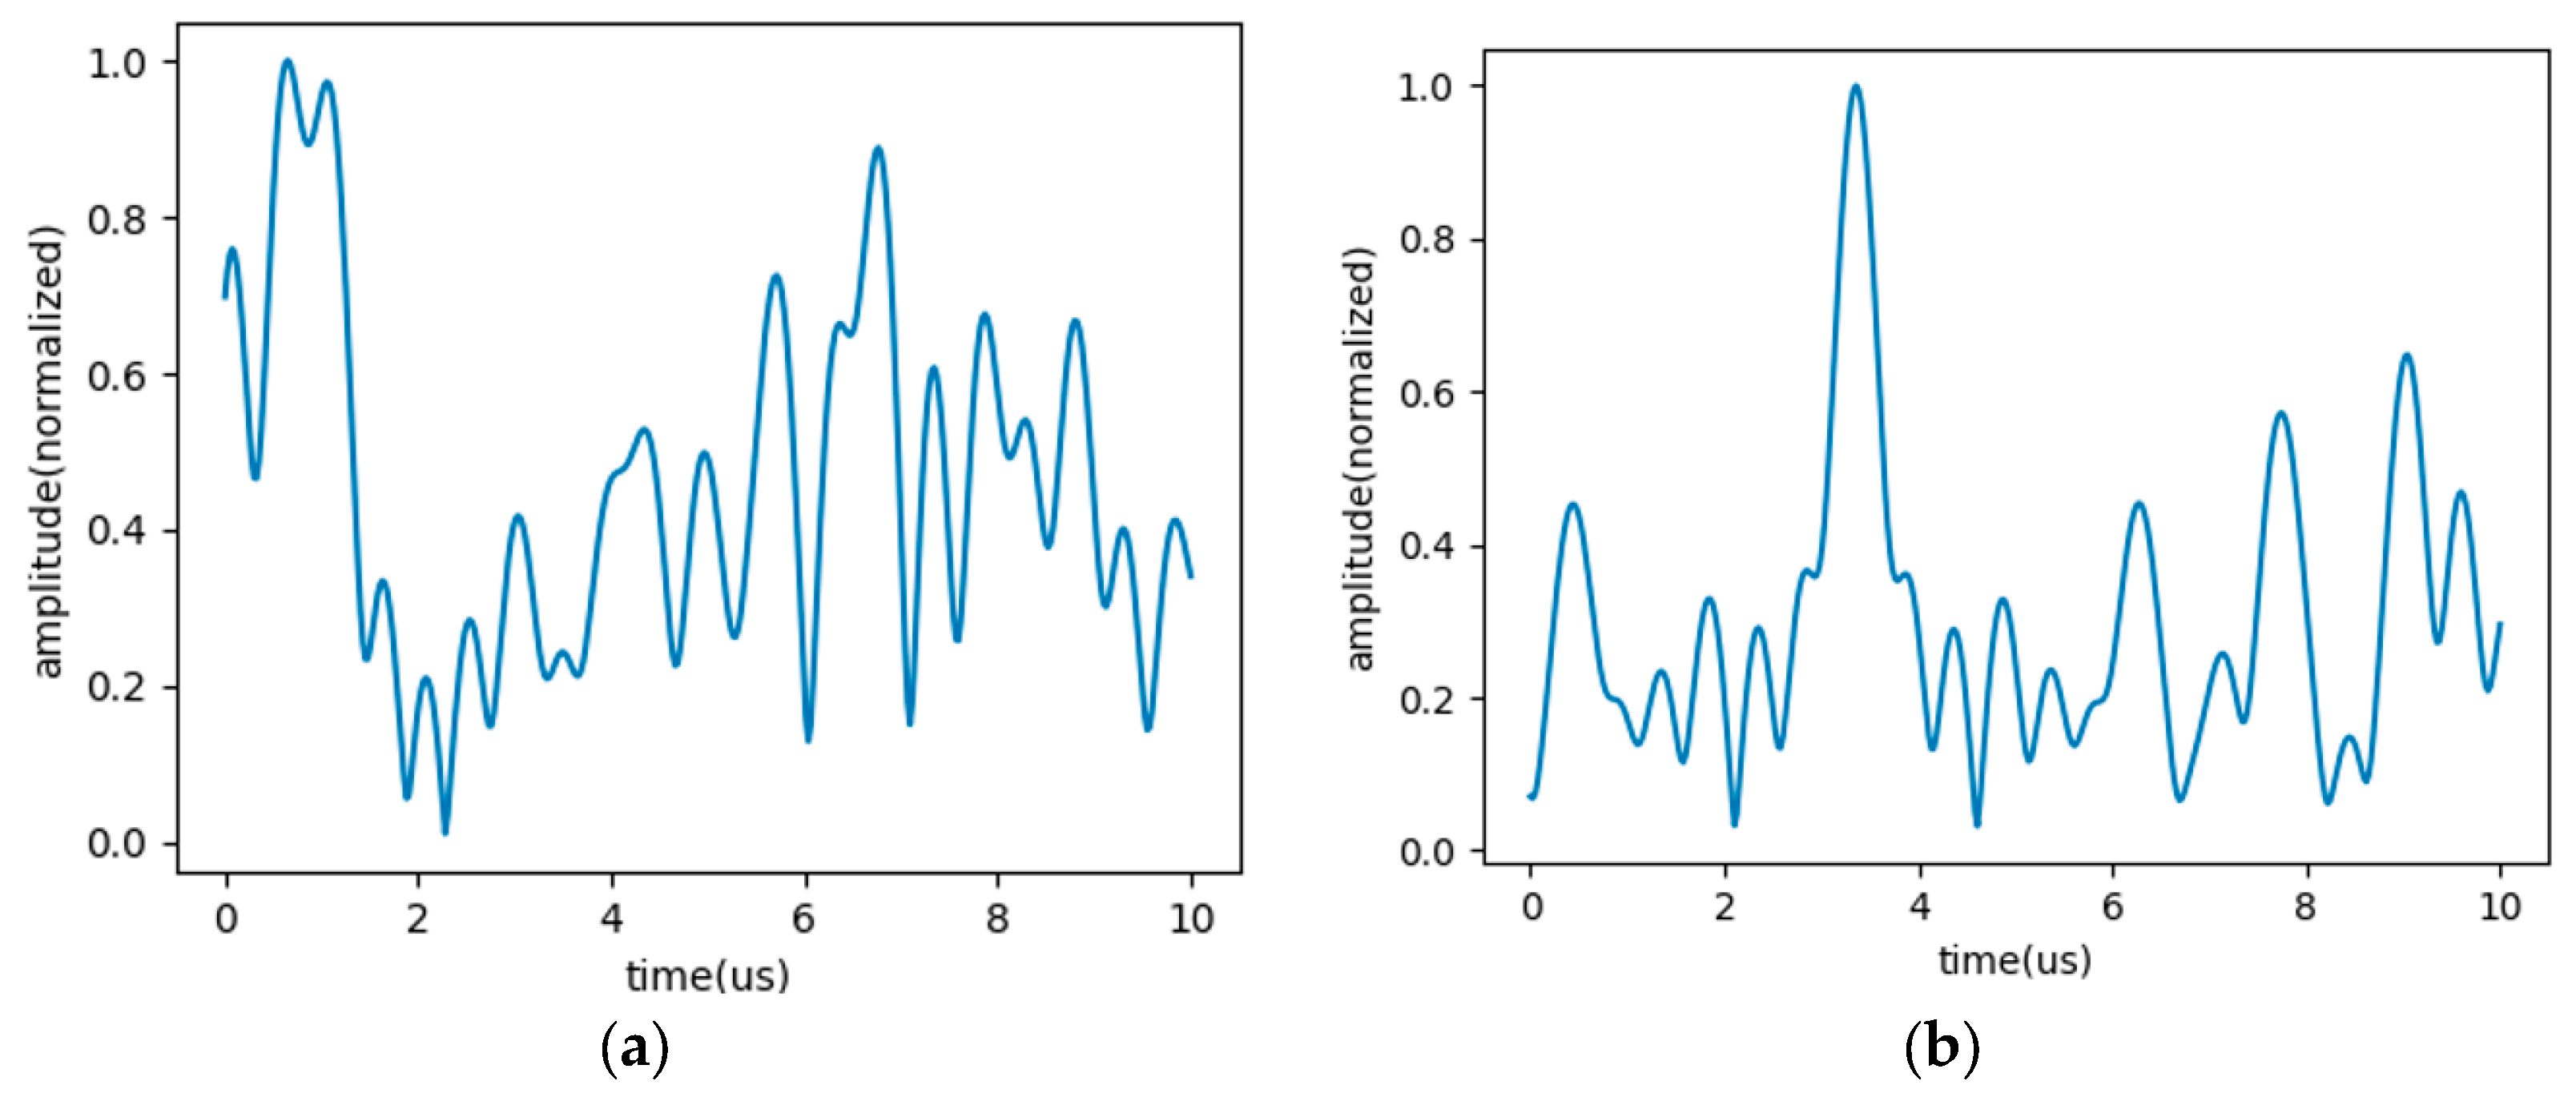
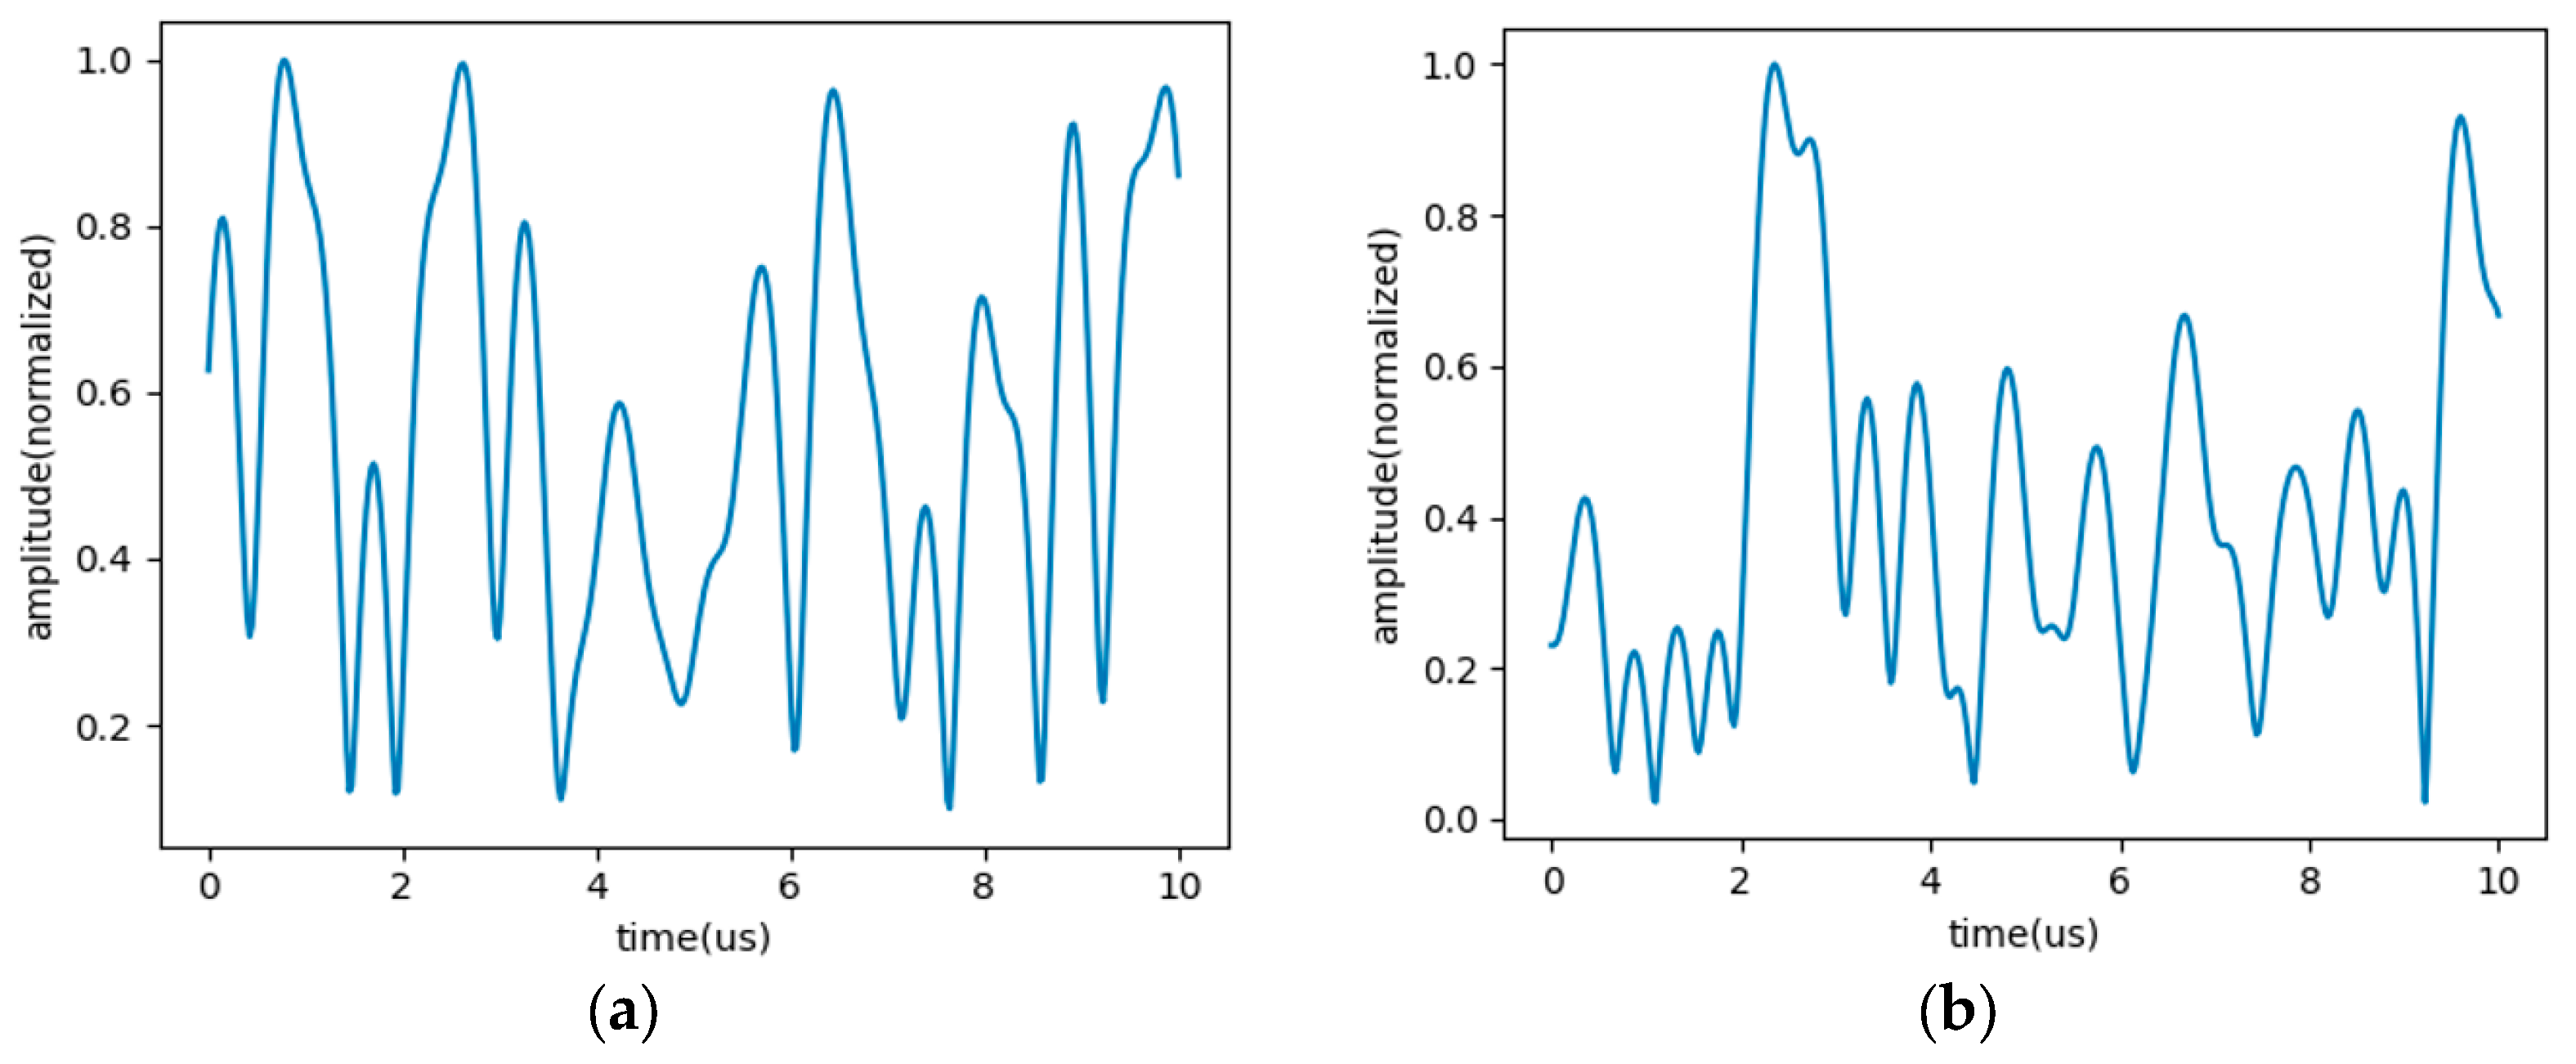
Figure 1. Assuming that the target is at a specific location, the signal received from a log-FDA system can be plotted as shown in
Figure 3. As shown in the figure, it is clear that the pattern fluctuating in the time domain carries some specific information. With two targets, the received signal is more complex, as shown in
Figure 4. First, the signals reflected from the two targets are combined in a single receiving antenna. Second, the absolute amplitude of the signal reflected from each target may be different because the size and reflection style of one target may be different from the other. Therefore, it is not easy to analyze the signal via simple mathematical methods. Since there is only one receiver regardless of the number of targets, this received signal pattern is the only input to the neural network.
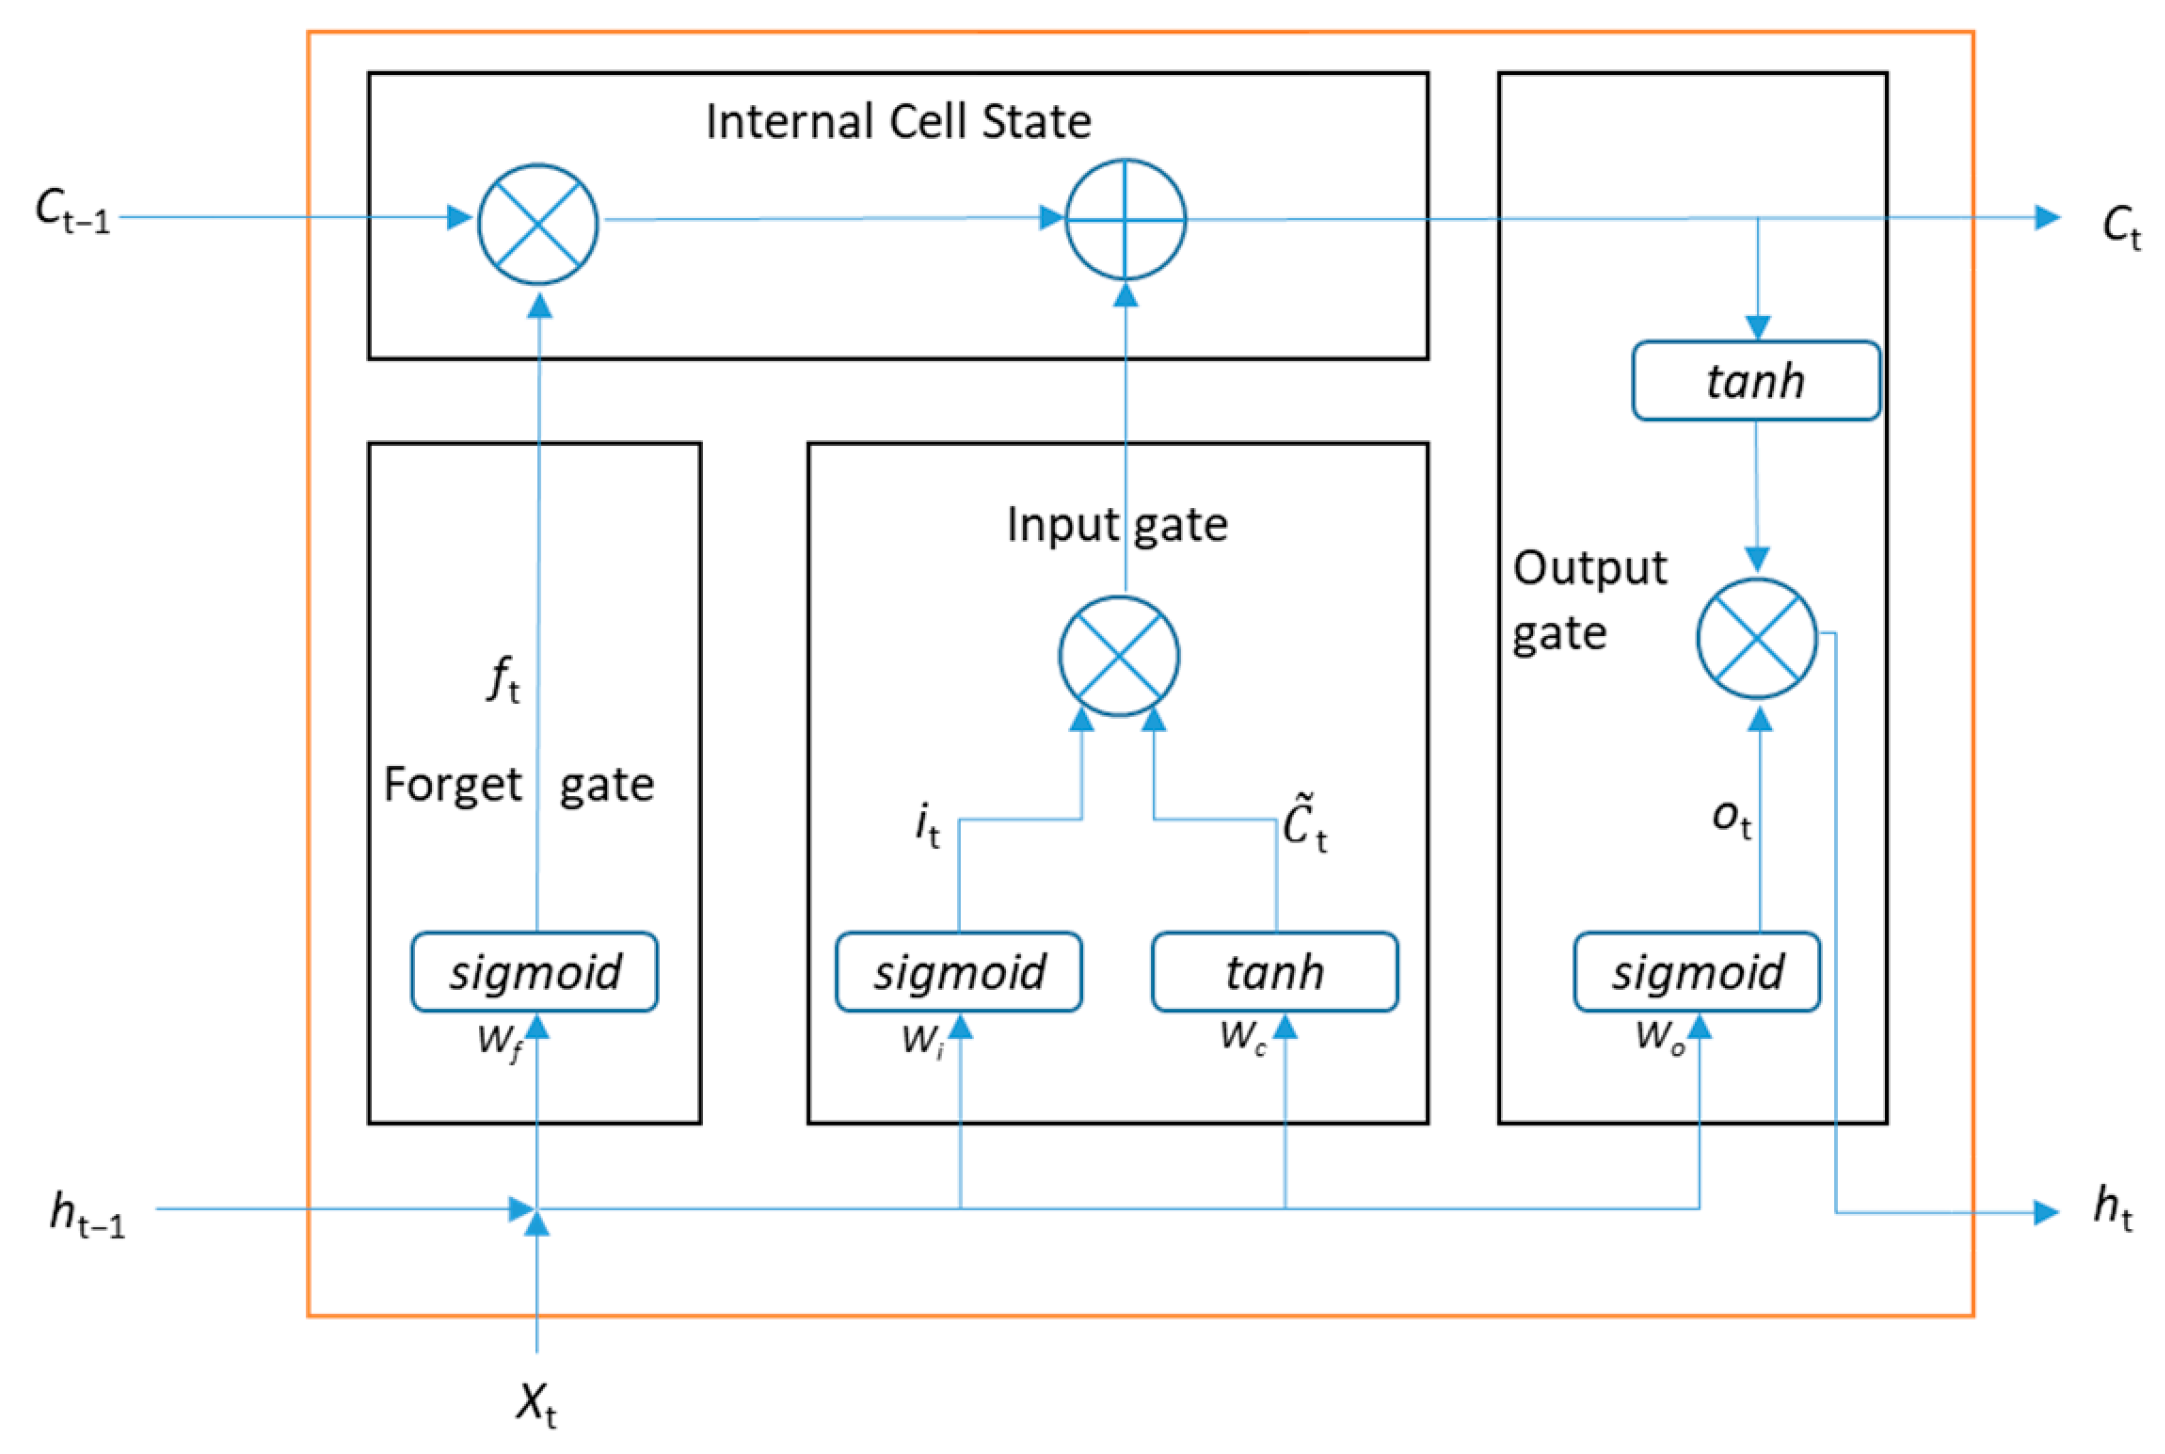
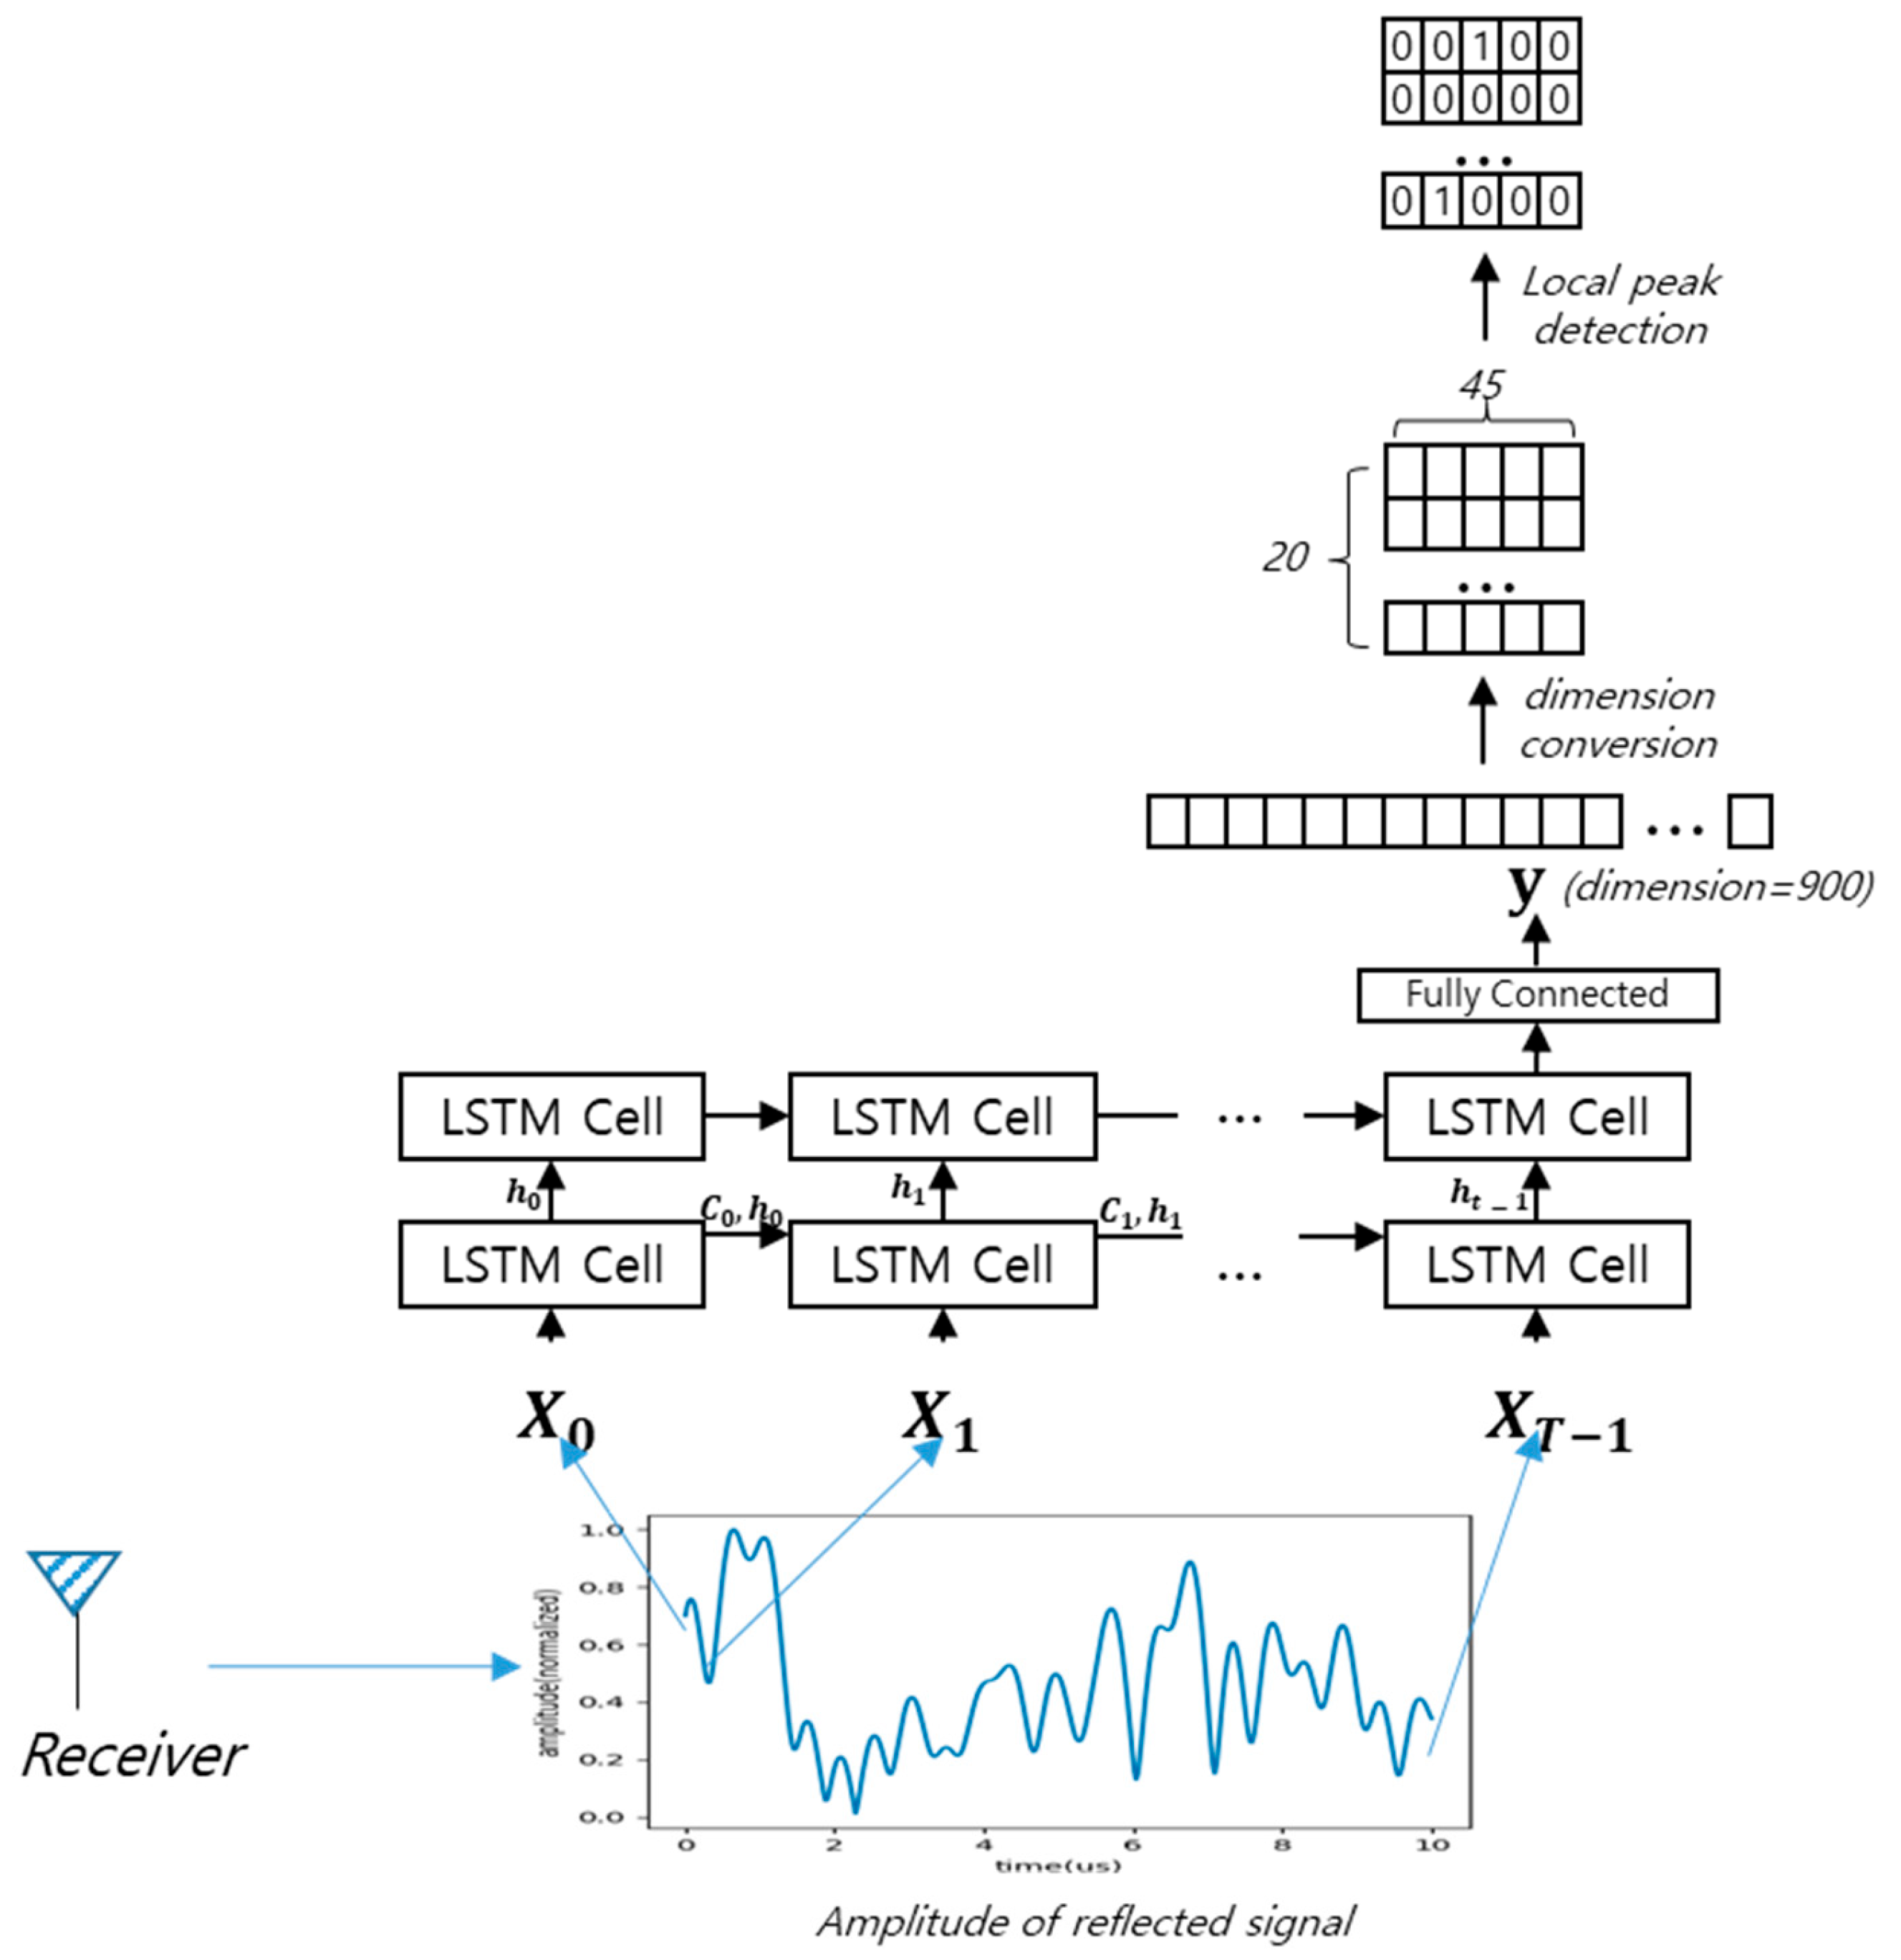
The LSTM (Long Short-Term Memory) neural network is used because it is known to be very stable and effective in the analysis of time series data. The concept behind LSTM is to retain meaningful past information in the internal state while processing each piece of time-step data
Xt. The LSTM model consists of multiple LSTM cells, and each cell is composed of a forget gate, input gate, output gate, and internal cell state. The input gate identifies and incorporates recent and relevant information, while the forget gate eliminates unnecessary information from the past. Each gate has weight matrices
W, which are learned during the training process. The structure of the LSTM cell is presented in
Figure 5 and the flow of data in the cell is described in Equations (5)~(10). Further details of the LSTM model can be found in the literature [
35]. In our data, it is assumed that the sequence of the change in amplitude contains the necessary information because the time-varying characteristic provides auto scanning of two-dimensional space. Although there may be other rising recurrent neural network structures, we do not consider them because the special structure of the neural network is not the main scope of this work. Nevertheless, we test LSTM and basic MLP (multi-layer perceptron) in the next evaluation section to see the suitability of the LSTM network for our system.
Figure 5.
Structure of an LSTM cell [
36].
Figure 5.
Structure of an LSTM cell [
36].
;
;
;
Figure 6 shows the overall architecture. Single-dimensional data are normalized by their maximum value and fed into a two-story LSTM network. The final LSTM cell is connected to the fully connected layer to obtain 900 (20 slots in distance and 45 slots in angle) outputs. A total of 900 slots provide a relatively smooth representation in two dimensions. Other studies which consider multi-layer perceptron also consider a similar number of slots, such as 620 (20 × 32) [
34]. The output can be translated into the possibility of the existence of a target in that two-dimensional slot. The localization system does not predict the exact location of the target, but provides information regarding whether there is a target in a particular two-dimensional slot or not. This is natural because there can be multiple targets in the space.
The frequency offset algorithm that we propose to use is the log-FDA with M = 8. As seen in
Figure 2, the log-FDA provides a strong amplitude at a particular point in two-dimensional space, although it is not fixed over time. Other FDA systems provide relatively multiple strong points. During the evaluation, the performance is compared with different FDA frequency offset signals.
In order to make an existence/non-existence binary decision, the neural network outputs require an additional detection step similar to traditional CFAR (Constant False Alarm Rate) detection. Basically, these algorithms compare the signal strength of adjacent slots to eliminate noise. In our system, the neural network outputs of adjacent two-dimensional slots are compared with each other. Since binary decision algorithms are not the main focus of this work, we simply find the local peak of the possibility distribution generated by the LSTM network. If a certain point is judged as a local peak in the 2D possibility distribution plane, it means there is a target at that point. Additionally, a threshold of at least 0.1 is applied to exclude locations with near-zero possibilities.
During training, false negatives are weighted ten times more than false positives. Most of the 900 slots are empty, which means a zero truth value, and in this sparse case, the neural network tends to produce all zeros in order to minimize the loss function. Weighting meaningful data helps the neural network to learn data with time and 10 as a weighting factor was enough to provide stable training with a few training simulations.
4. Performance Evaluation
The performance of the localization system can be validated by qualitative illustrations of the output of the neural network and the most popular quantitative F1 score [
37,
38] after the binary existence/non-existence decision. Traditional measures such as root mean square error (RMSE) and mean absolute error (MAE) cannot be adopted because the neural network predicts the location in a discrete space rather than in a continuous space. Furthermore, these indices are only suitable for single-target cases. Accuracy, another commonly used metric in binary classification, is not appropriate for this study because the vast majority of the target plane contains no actual targets and is correctly predicted in most cases. As a result, the overall accuracy consistently exceeds 0.99, making it an uninformative metric in this context. Given the imbalance in the target distribution, the F1 score provides a more meaningful measure of performance.
Input and output data are generated by simulation using Python v3.11.4. In each simulation, the target locations are randomly generated in a continuous two-dimensional space. The amplitudes of the reflected signals are uniformly distributed between 1 and 10 because we assume that the targets may have different sizes and different reflection scales. Signal attenuation due to distance is also adopted. The total number of simulations is 500,000 and the hidden unit of the LSTM neural network is set to 256. The frequency of the RF carrier and the frequency offset are set to 10 GHz and 1 MHz, respectively. Targets are located in 10~1000 m, −π/4~π/4 rad. A propagation model, such as a multi-path model, is not considered because we assume open-space application. Nevertheless, attenuation and thermal white noise are considered in the experiment.
Table 2 presents additional parameters for the neural network.
4.1. Single-Target Scenario
First, the single-target scenario is investigated, and the results are shown in
Figure 7,
Figure 8 and
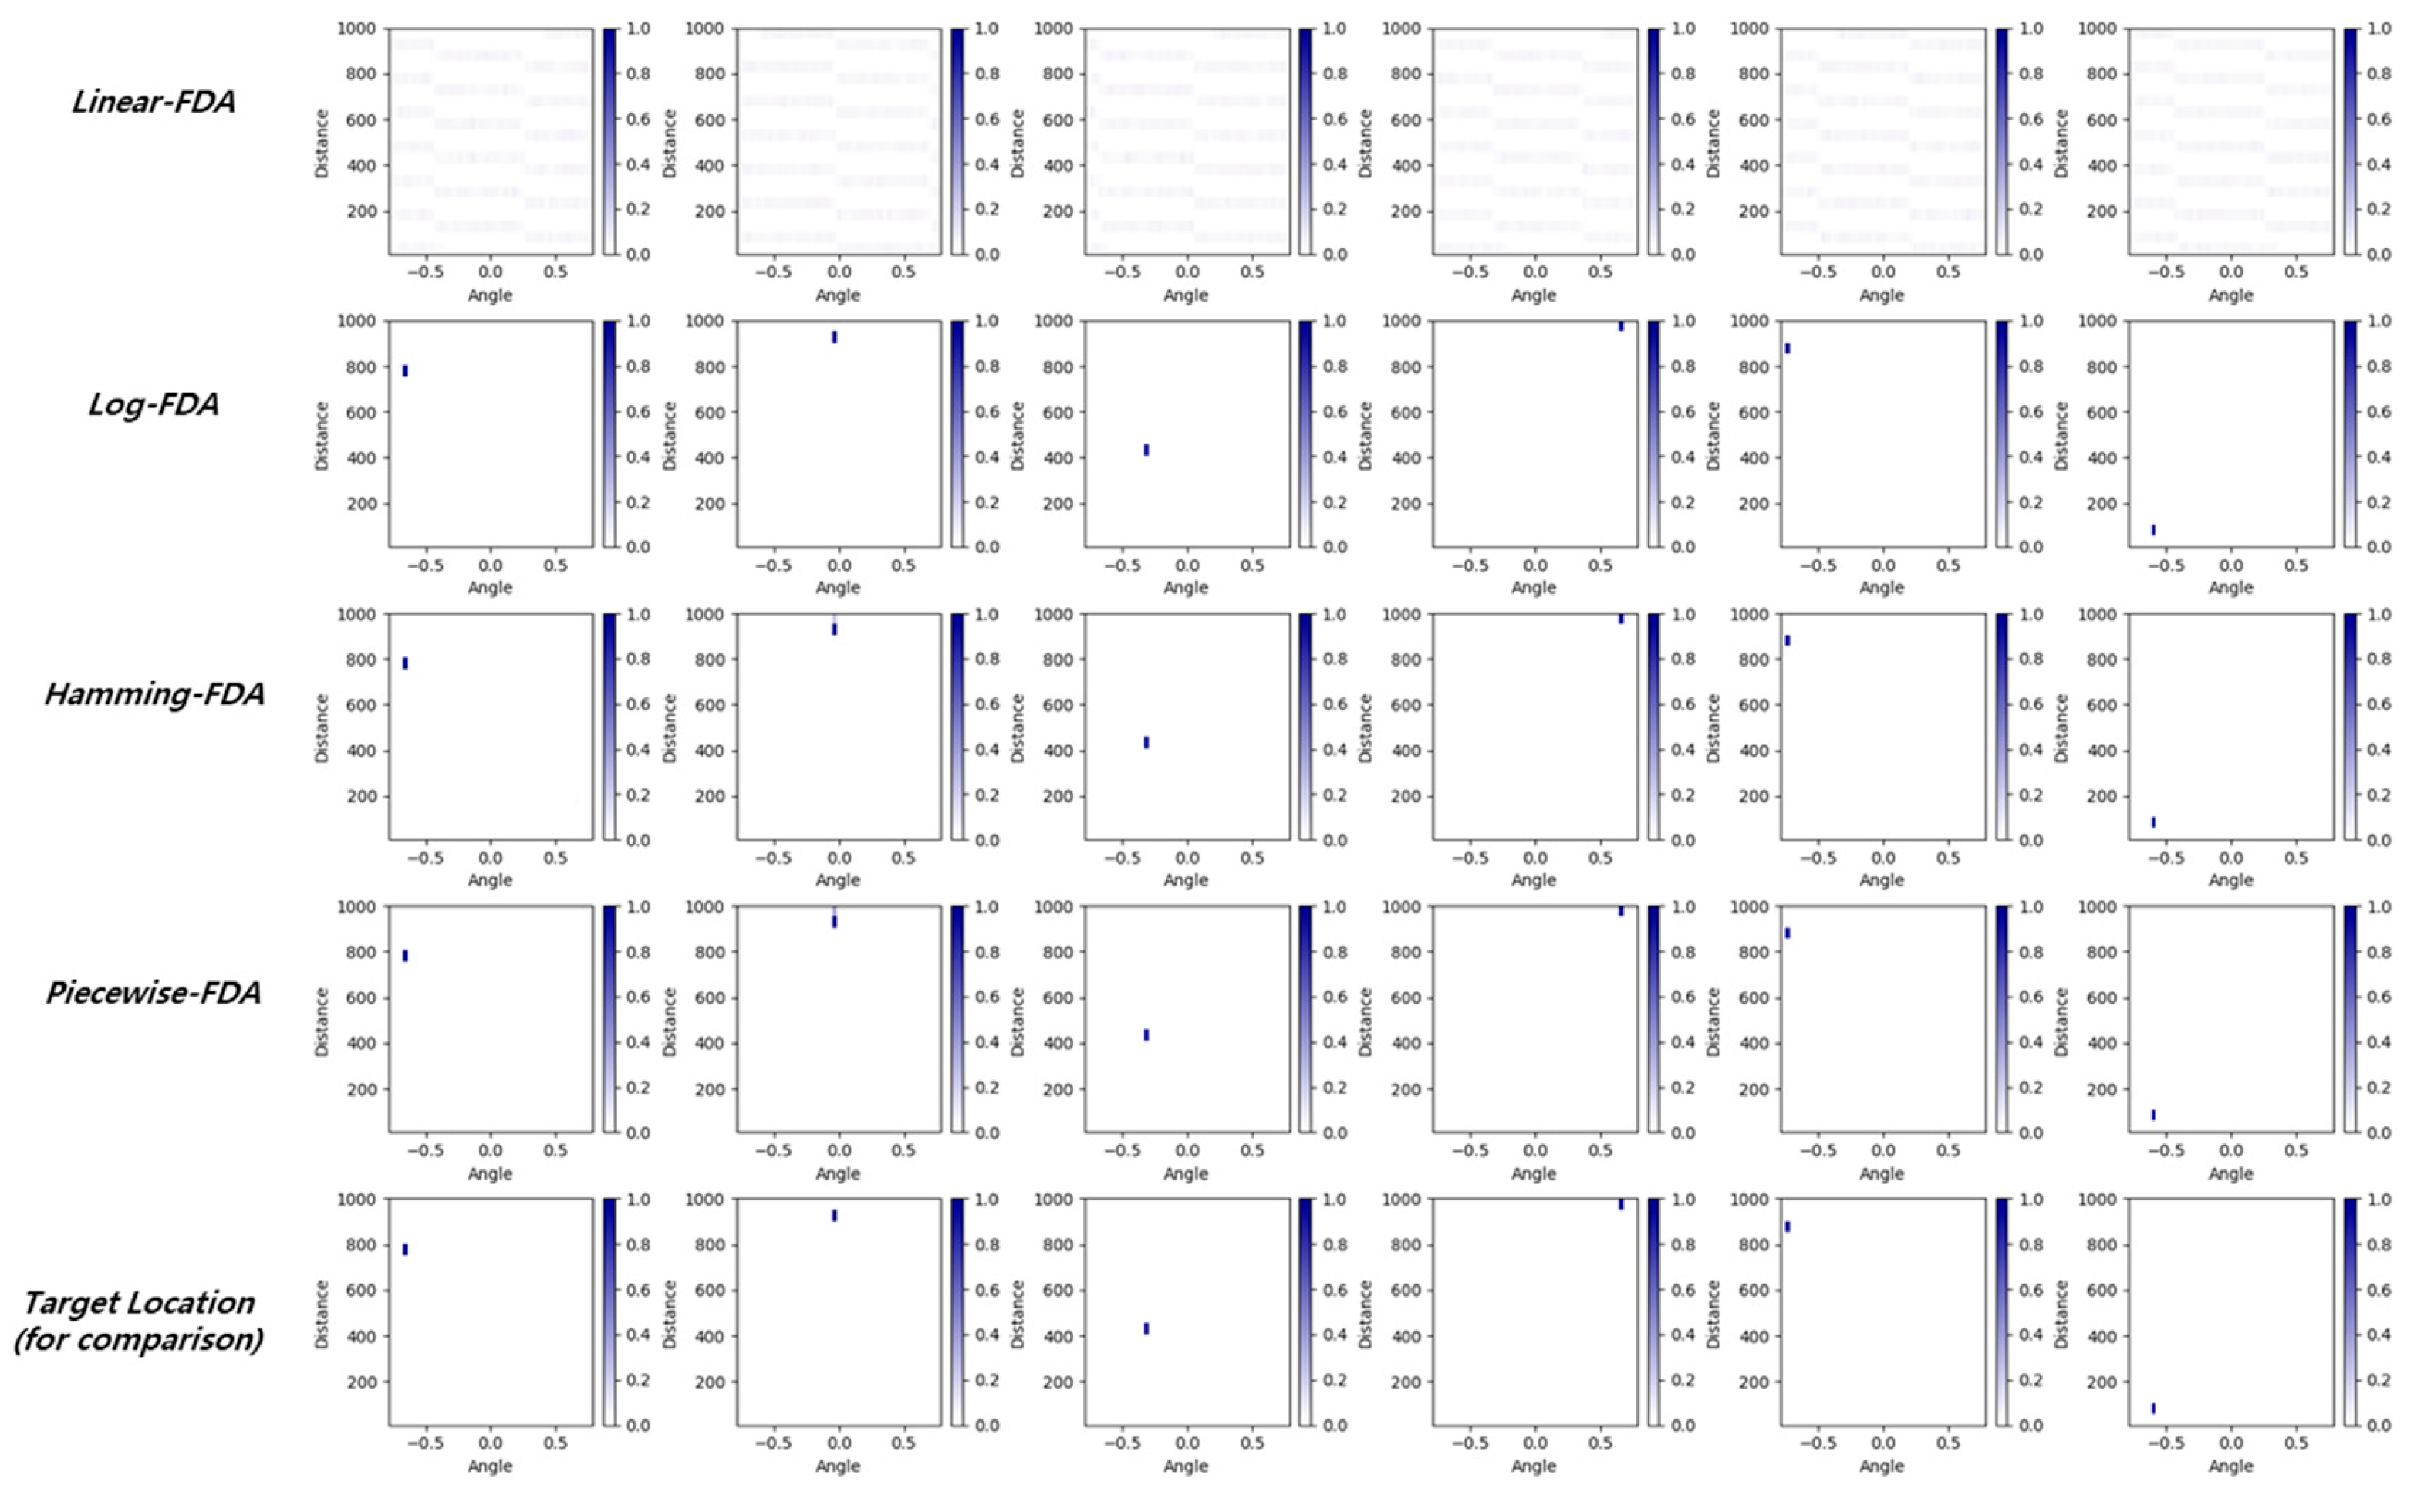
Figure 9. The total number of simulations is 500,000 and the ratio of training, validation, and test data is 70%, 21%, and 9%, respectively. For qualitative assessment, the output of the neural network before the existence/non-existence decision is presented in
Figure 7, where different FDA frequency offset algorithms are compared under the assumption of no noise. We presented six random cases and it is clear that the output of the linear FDA does not produce a dot-like result, but a line-like result. This is because the linear FDA produces a line-shaped beam pattern, as shown in
Figure 2. Other types of FDA produced a dot-like shape, which is very close to the real target’s location, as shown in
Figure 7.
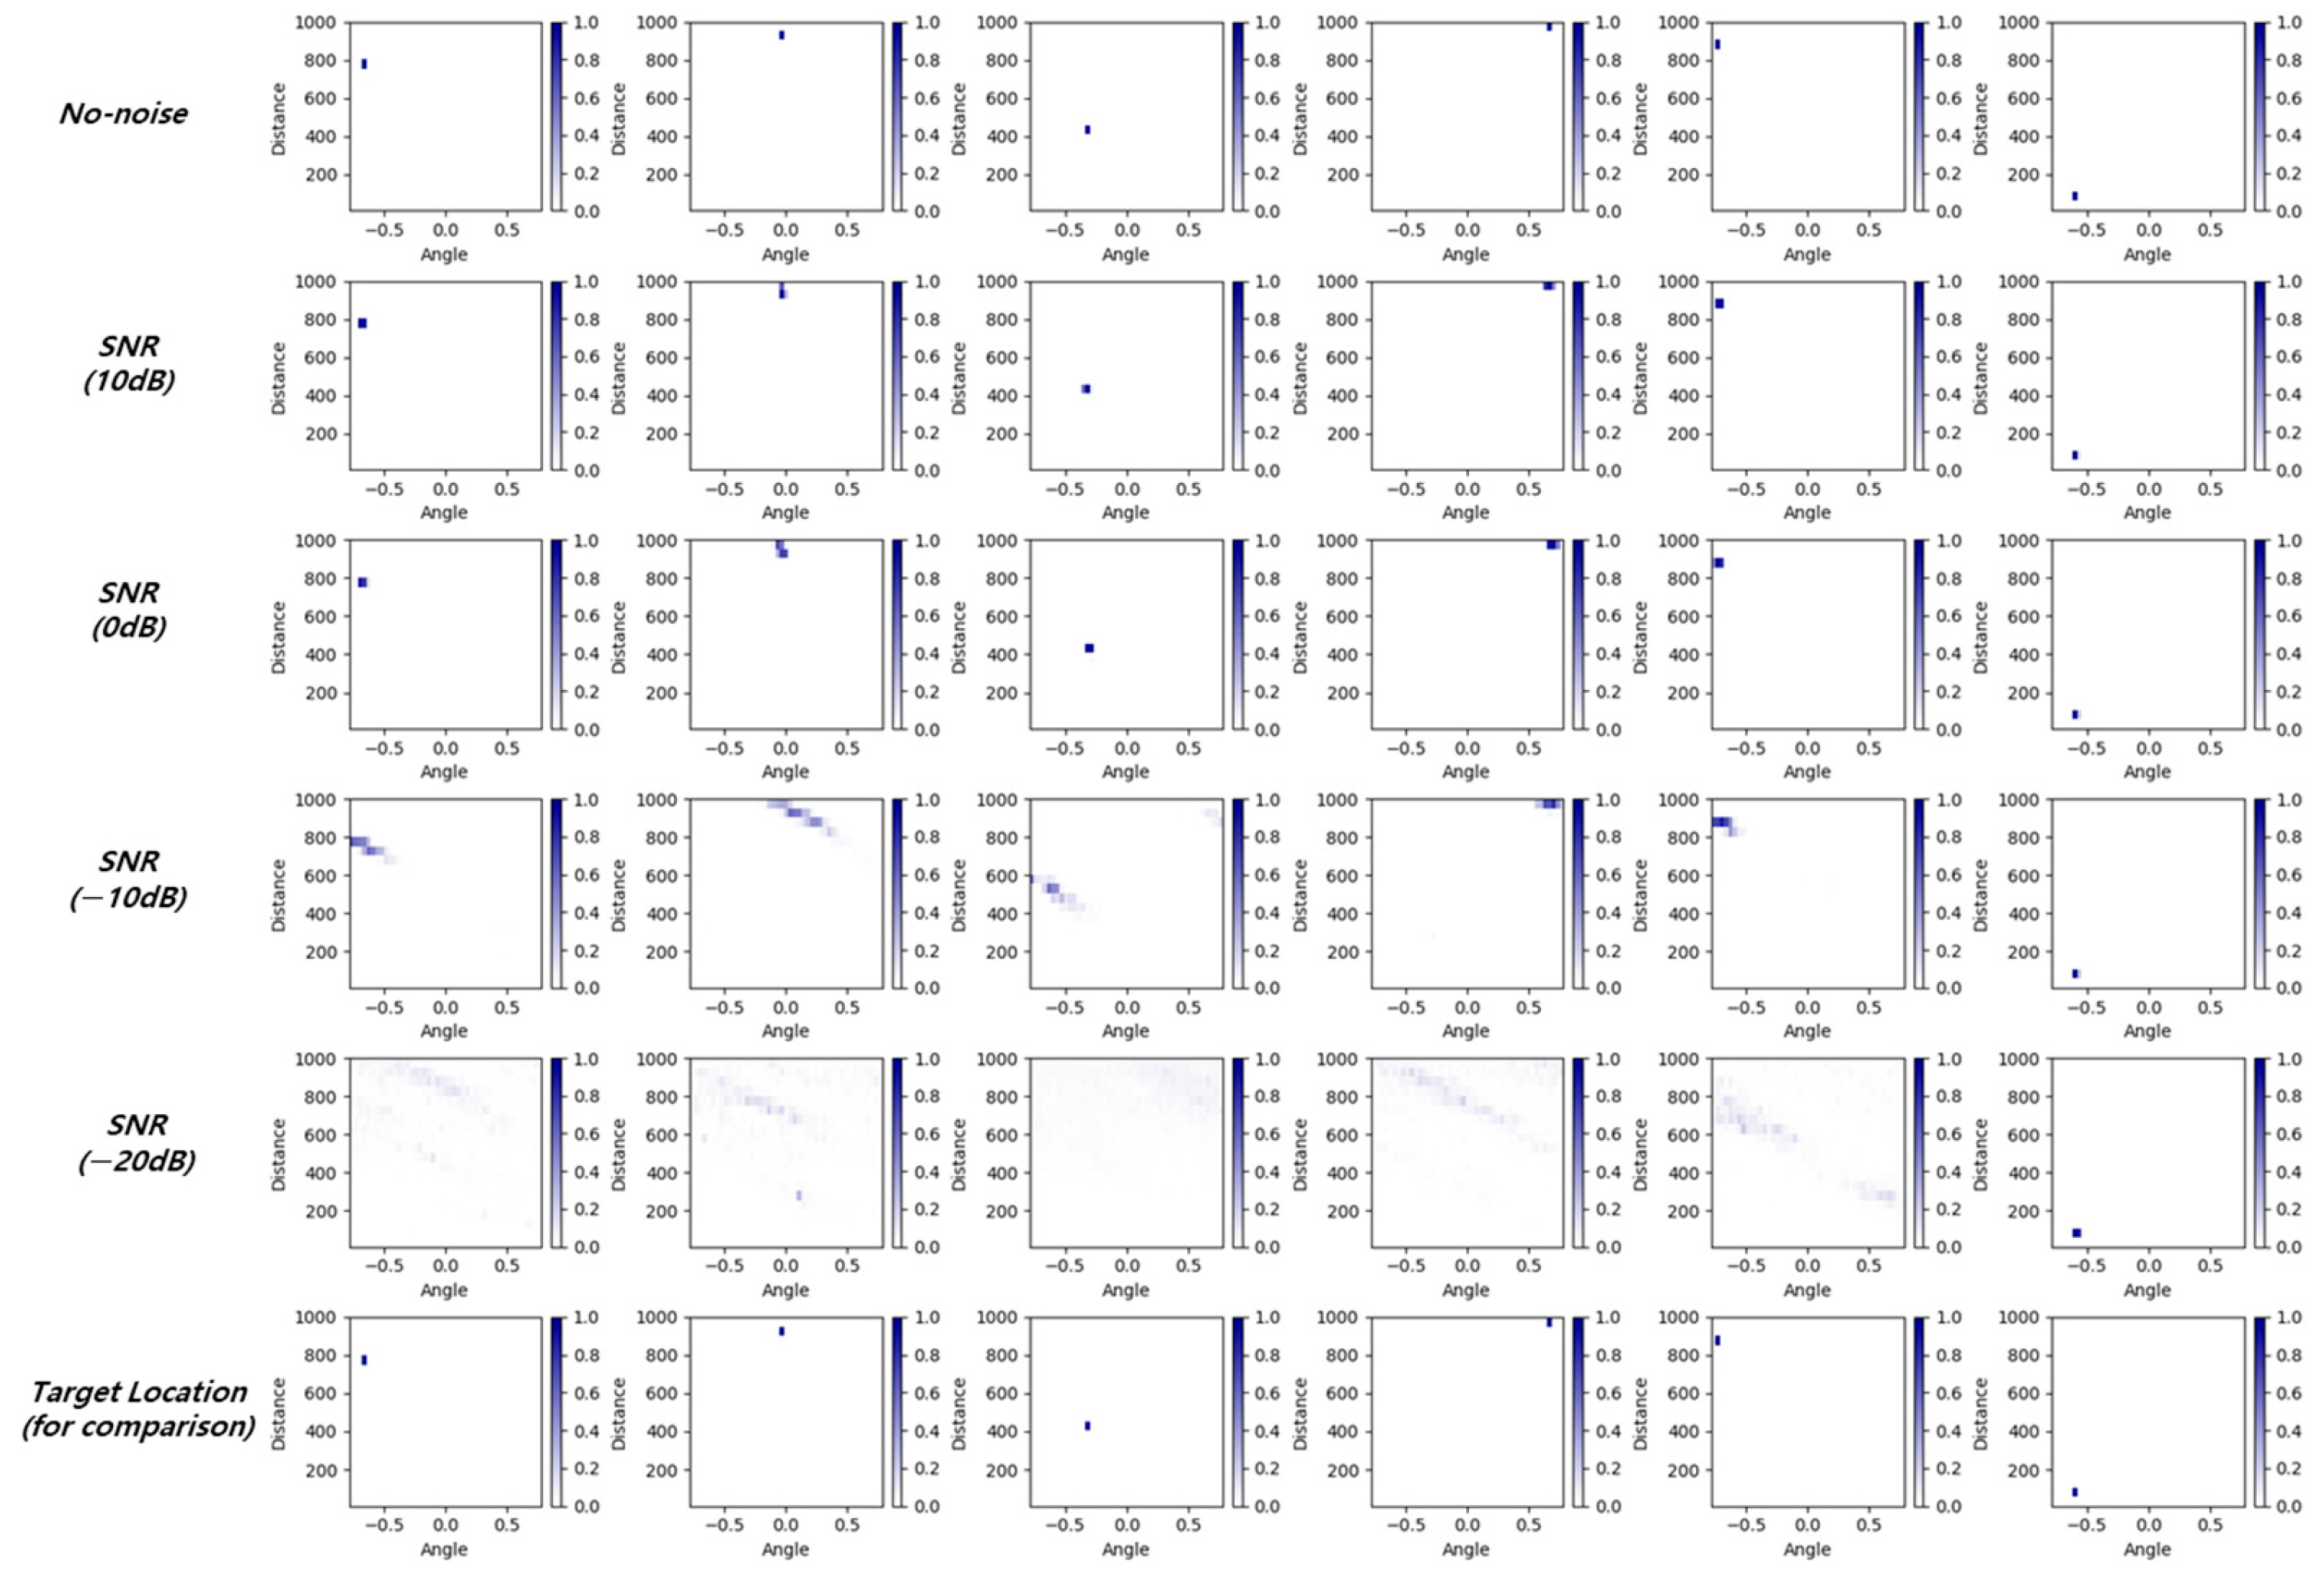
Figure 8 compares the scenarios with noise in a log-FDA system. Since we assume that the target is randomly placed in two-dimensional space and thermal noise has fixed amplitude, targets which are close to the radar have high signal-to-noise (SNR) and targets which are far from the radar have low SNR. The SNR at the closest distance was used to represent the SNR for the given scenario. Linear FDA is not presented because it cannot provide a dot-like output pattern. In
Figure 8, as the noise increases, the output of the LSTM becomes increasingly blurred, resulting in reduced performance. However, the system still produces a higher output value close to the real target’s location because of the generalization ability of the neural network.
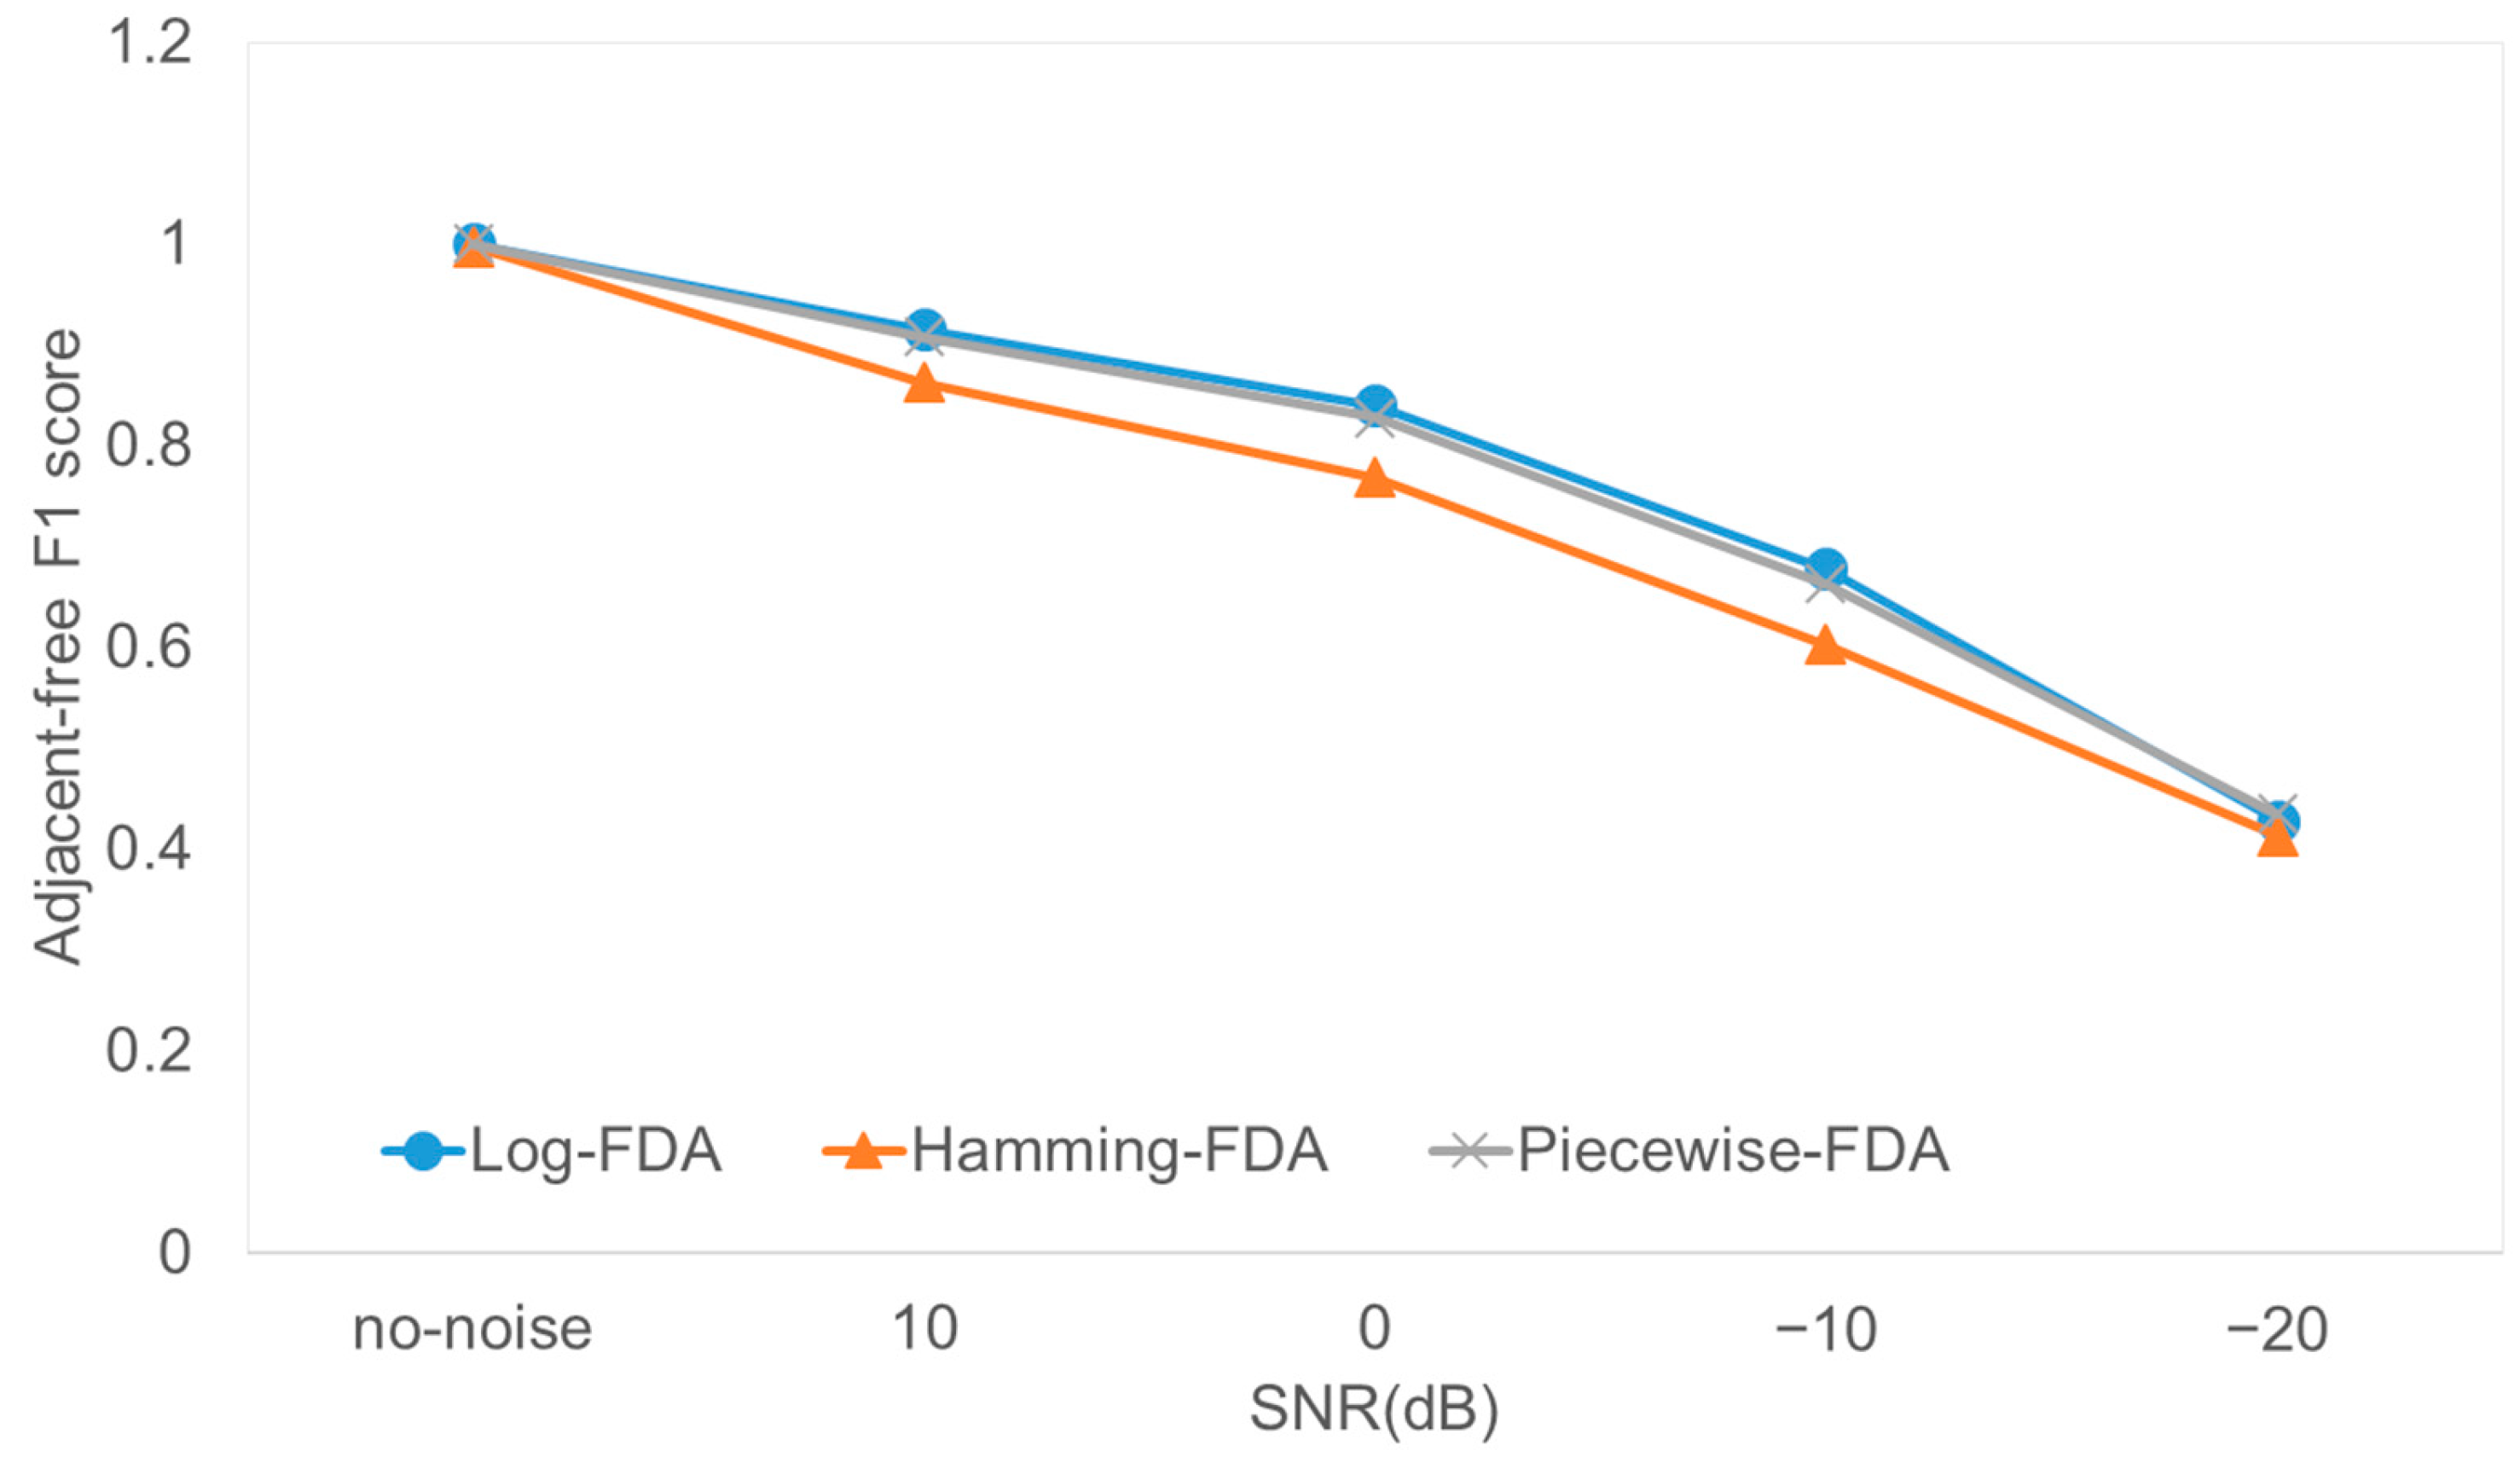
Figure 9 shows the adjacent-free F1 score after the binary decision. The adjacent-free F1 score, which is defined in this work, is similar to the original F1 score but accepts the near-miss prediction (adjacent slot in two-dimensional space) as the correct one. The original F1 score is defined using Equation (11), but the adjacent-free F1 score is defined using Equation (12).
where
TP (True Positive) = predicted positive and real positive, FP (False Positive) = predicted positive and real negative, and FN (False Negative) = predicted negative and real positive.
where
TP = predicted positive and real positive in one of its neighborhood in two dimensions, FP = predicted positive and real negative in all its neighborhoods in two dimensions, and FN = predicted negative in all its neighborhood and real positive. We propose this simply modified metric because our targets are located in a continuous space, as in the real world, and the output of the neural network is distributed in discrete slots. Therefore, it reduces the gap between the continuous and discrete worlds without compromising the principles of the F-measure. The score indicates improved performance as it increases, converging to 1 when the estimation is perfect.
As shown in
Figure 9, when there is no noise, the adjacent-free F1 score exceeds 0.99 across all three FDA systems. In other words, the neural network almost always correctly found the location of the target and it is certain that the simple single-Rx log-FDA system’s auto scanning ability provided enough information for target localization. The neural network effectively handled the complexities associated with FDA signal processing. As more noise is added, the F1 scores decrease, and it is natural that performance is degraded by noise. Among the three FDA algorithms, the log- and piecewise-FDAs provide higher scores than the Hamming-FDA. We note that the SNR mentioned in
Figure 9 was measured at the closest distance, so the average SNR is much lower than indicated.
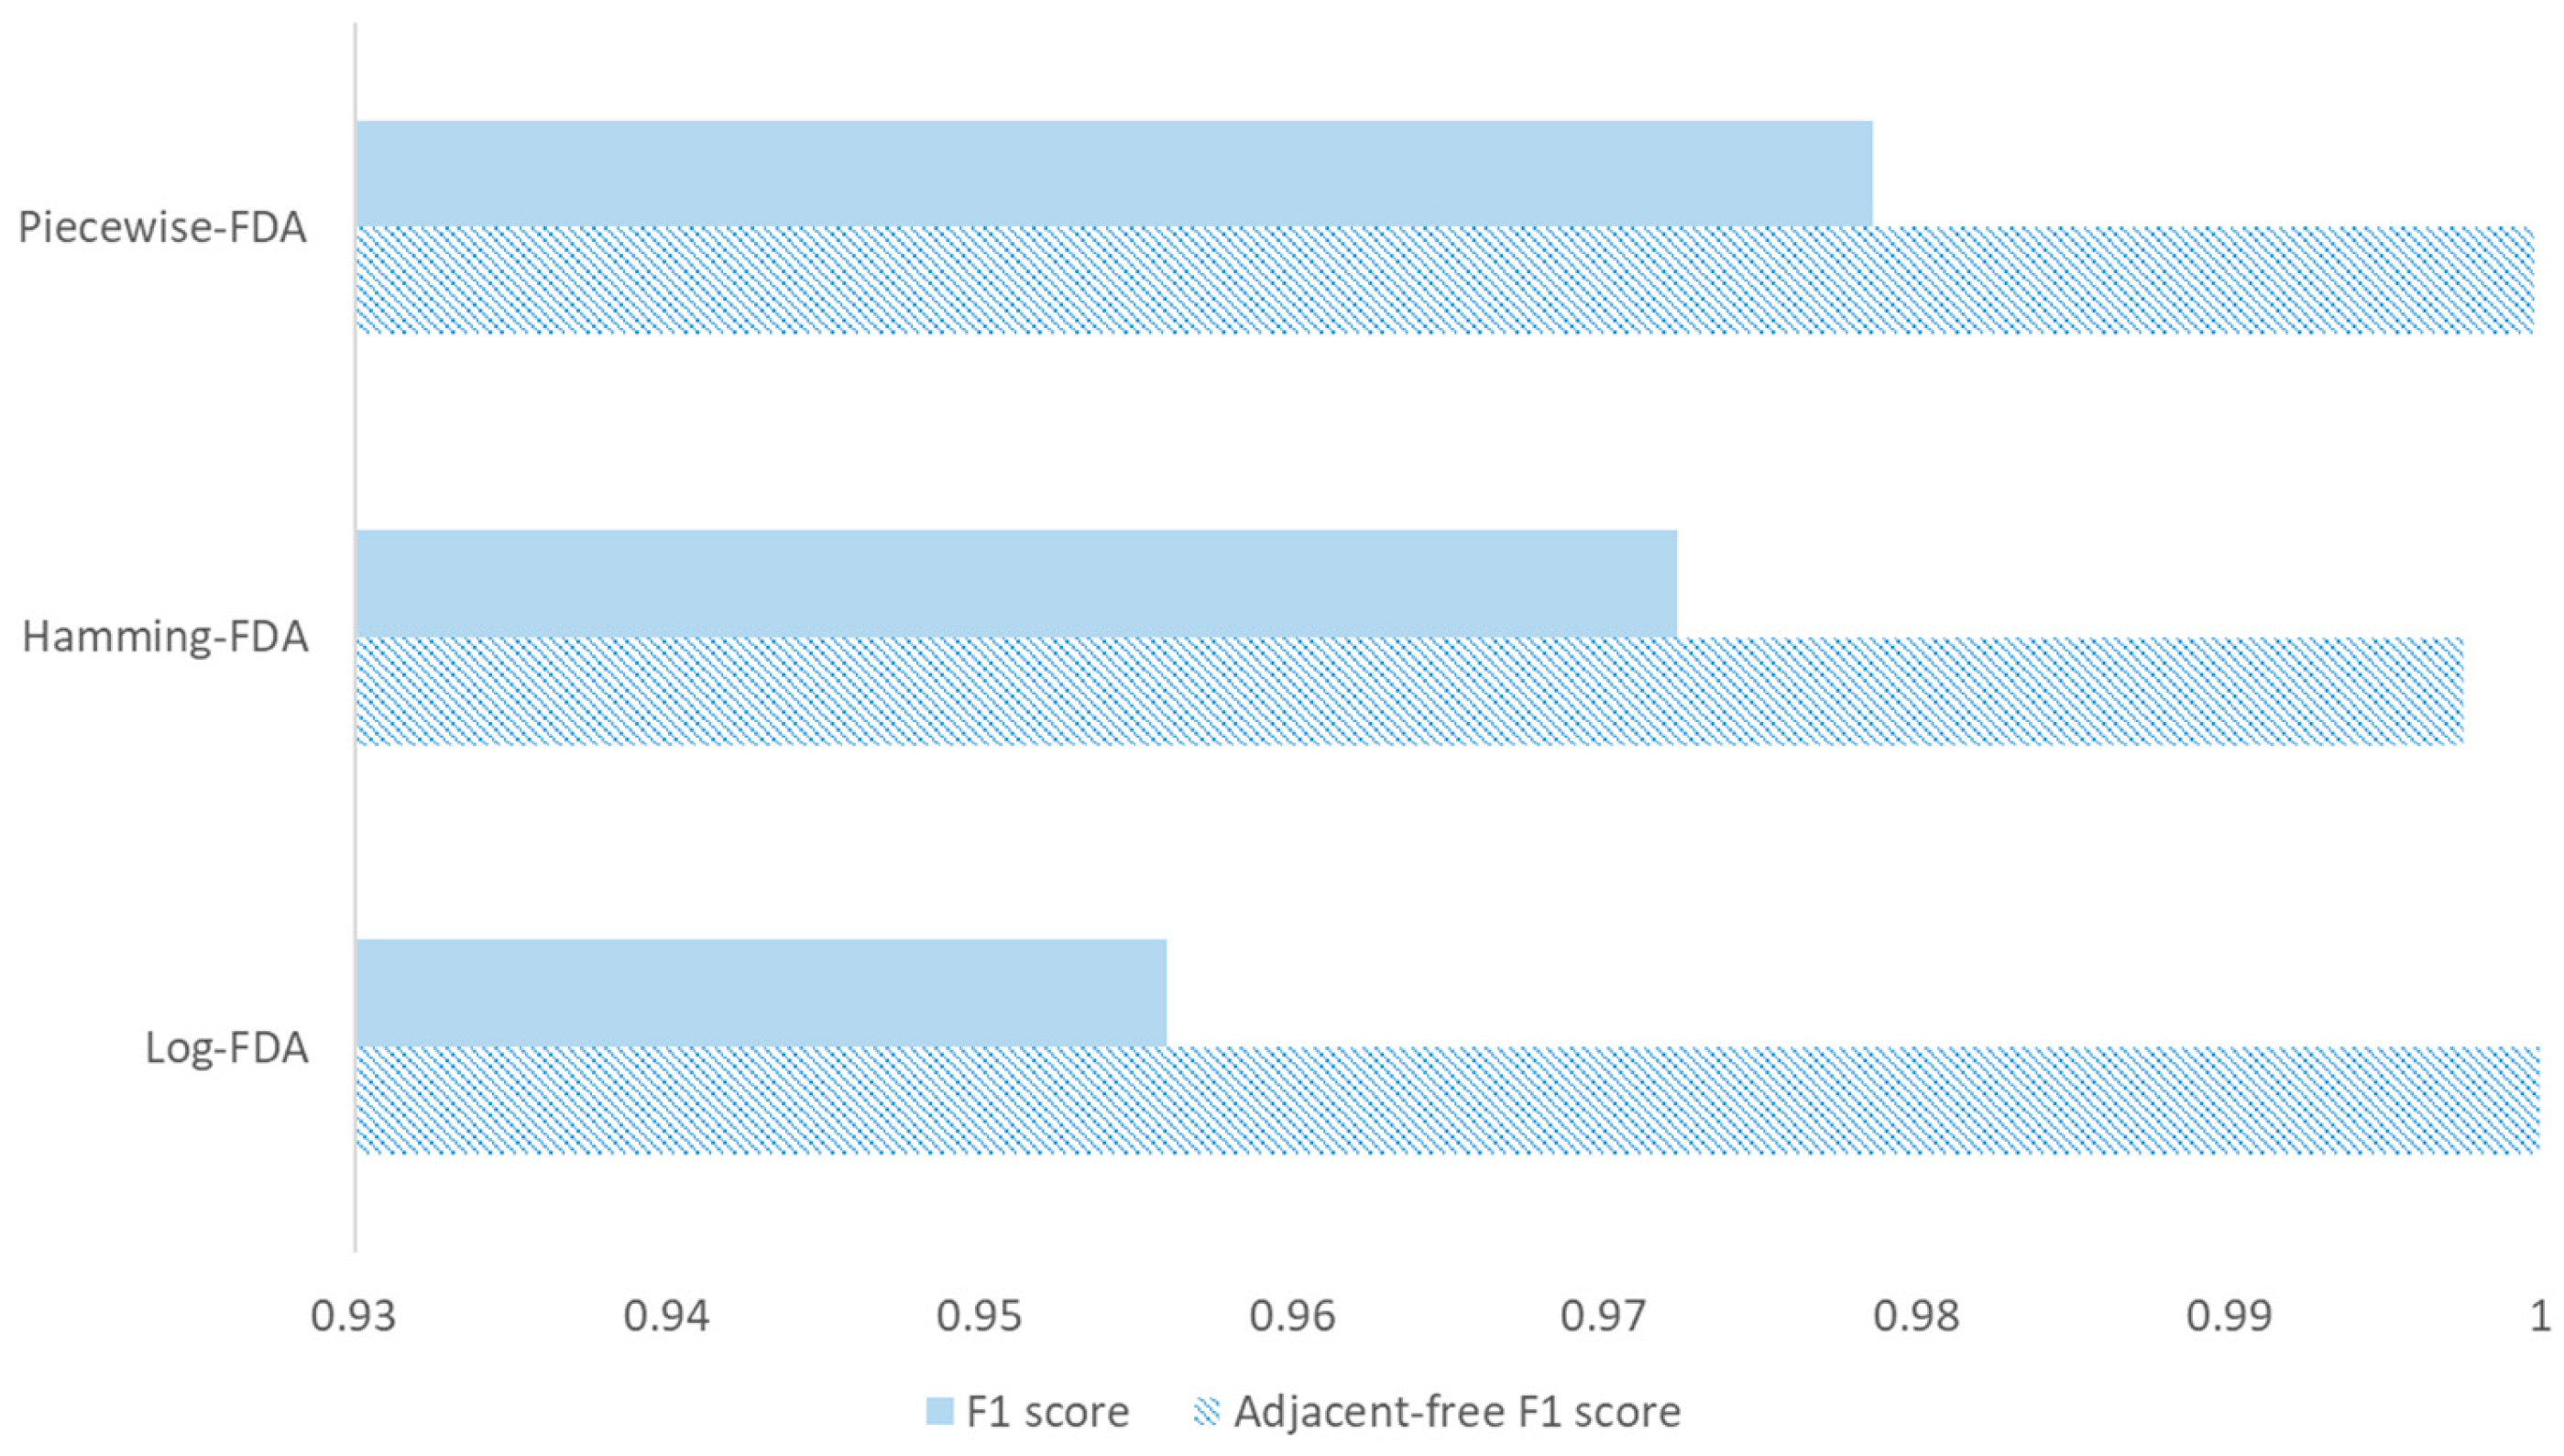
As shown in
Figure 10, we compared F1 score and adjacent-free F1 score in the absence of noise. The standard F1 score is typically around 0.96 to 0.97, whereas the adjacent-free F1 score is nearly 1. This highlights the suitability of the adjacent-free F1 score for evaluating models that make discrete predictions over spatially continuous target regions.
4.2. Multi-Target Scenario
Now, the multi-target scenario is investigated. Although a single-target scenario is important to validate the performance of the proposed system, a multi-target scenario is a more generalized scenario which is similar to real applications. However, multi-target FDA radar is rarely studied. In these scenarios, single-target cases and two-target cases are mixed in both training and test data, and the total number of simulations is 1,000,000, unless otherwise specified. Of course, the number of targets is not known to the system during the validation process.
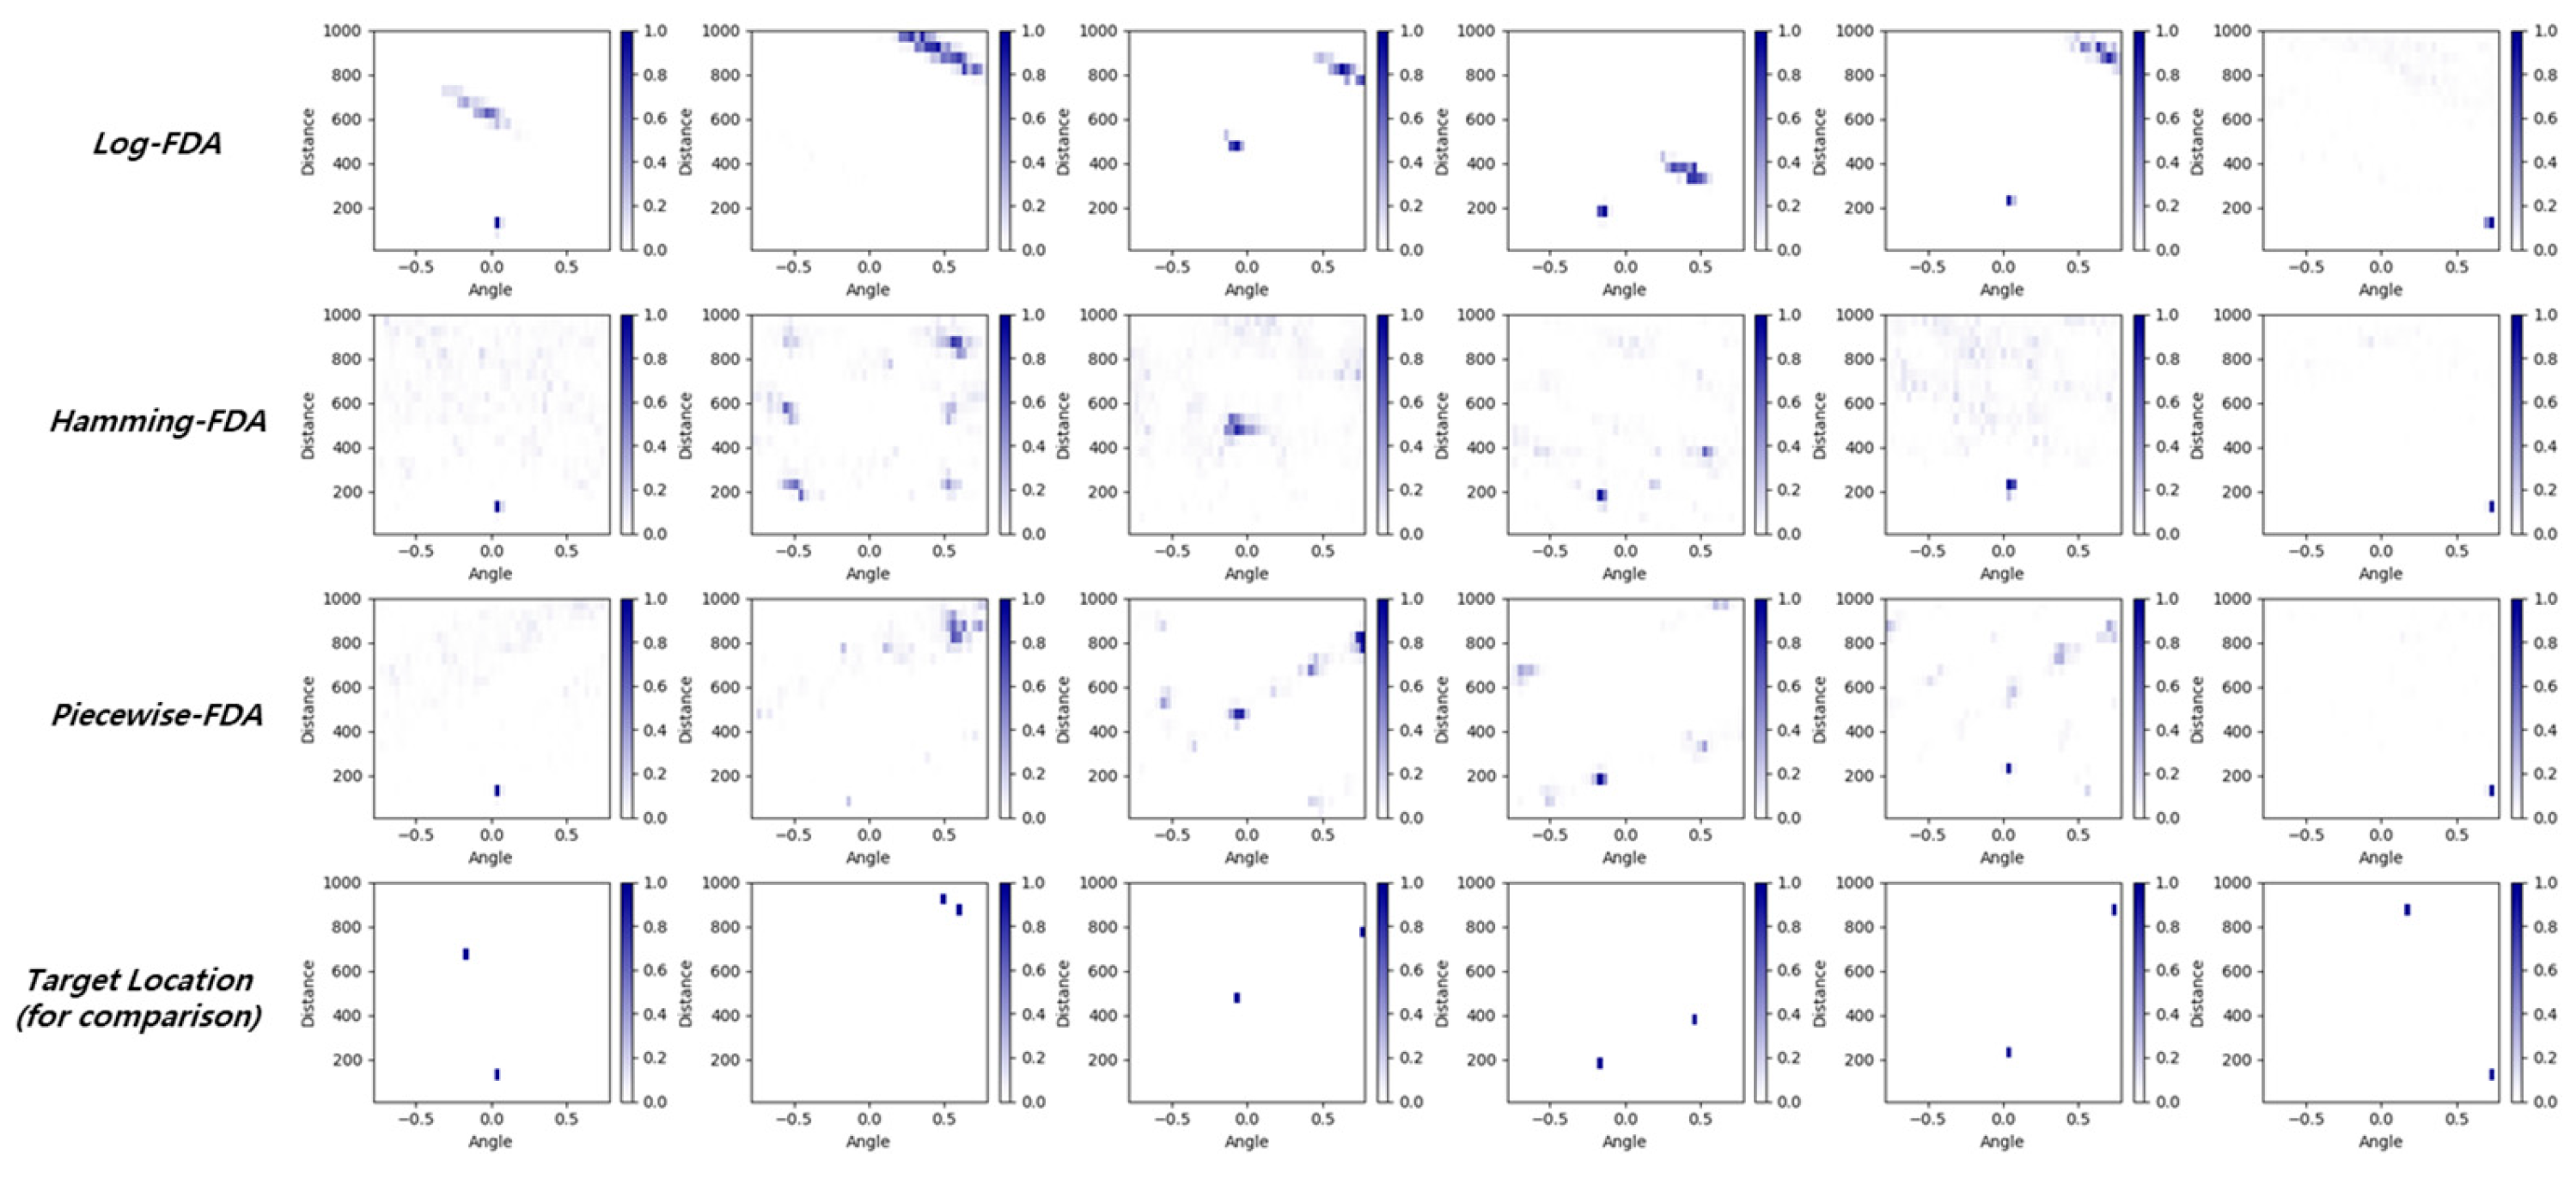
Figure 11 shows the output of the neural network under the assumption of no noise. Only the cases with two targets are displayed because the locations are found accurately in cases of a single target. When there are two targets, the neural network output is not as accurate as those in the single-target cases across all three FDA systems. However, the log-FDA is relatively more accurate in finding the target locations, even though it is blurred in 2D space. Other types of FDAs tend to provide multiple candidate locations, especially in case numbers 2, 3, and 4. This is because the beam patterns of other types of FDA, which are provided in
Figure 2, tend to provide multiple strong points. We also note that, in the last case, all FDA systems cannot find the second target, which is far from the radar. This is because the second target is randomly selected as the minimum reflection target and is randomly located in the farthest region from the radar. The second target’s reflected signal is too small compared to the signal from the first close and large target.
Figure 12 additionally shows the final result of the six cases after the binary decision of existence/non-existence in the log-FDA system. In the first sample, although the raw output of the neural network seems to be blurred in
Figure 10, the final decision is clear because the decision step finds the local peak of the foggy part. In the second sample, because two targets are located in close proximity, it appears that the neural network output is unable to distinguish between the two. However, after the decision step, the result is the clear production of two targets in close proximity. In case numbers 2, 3, and 4, the final output exactly provides two targets but the predicted targets’ locations are a little bit misaligned, resulting in lower values than single-target cases, as shown in the following F1 score validation. Nevertheless, it is certain that the proposed system provides the ability to find the locations of multiple targets.
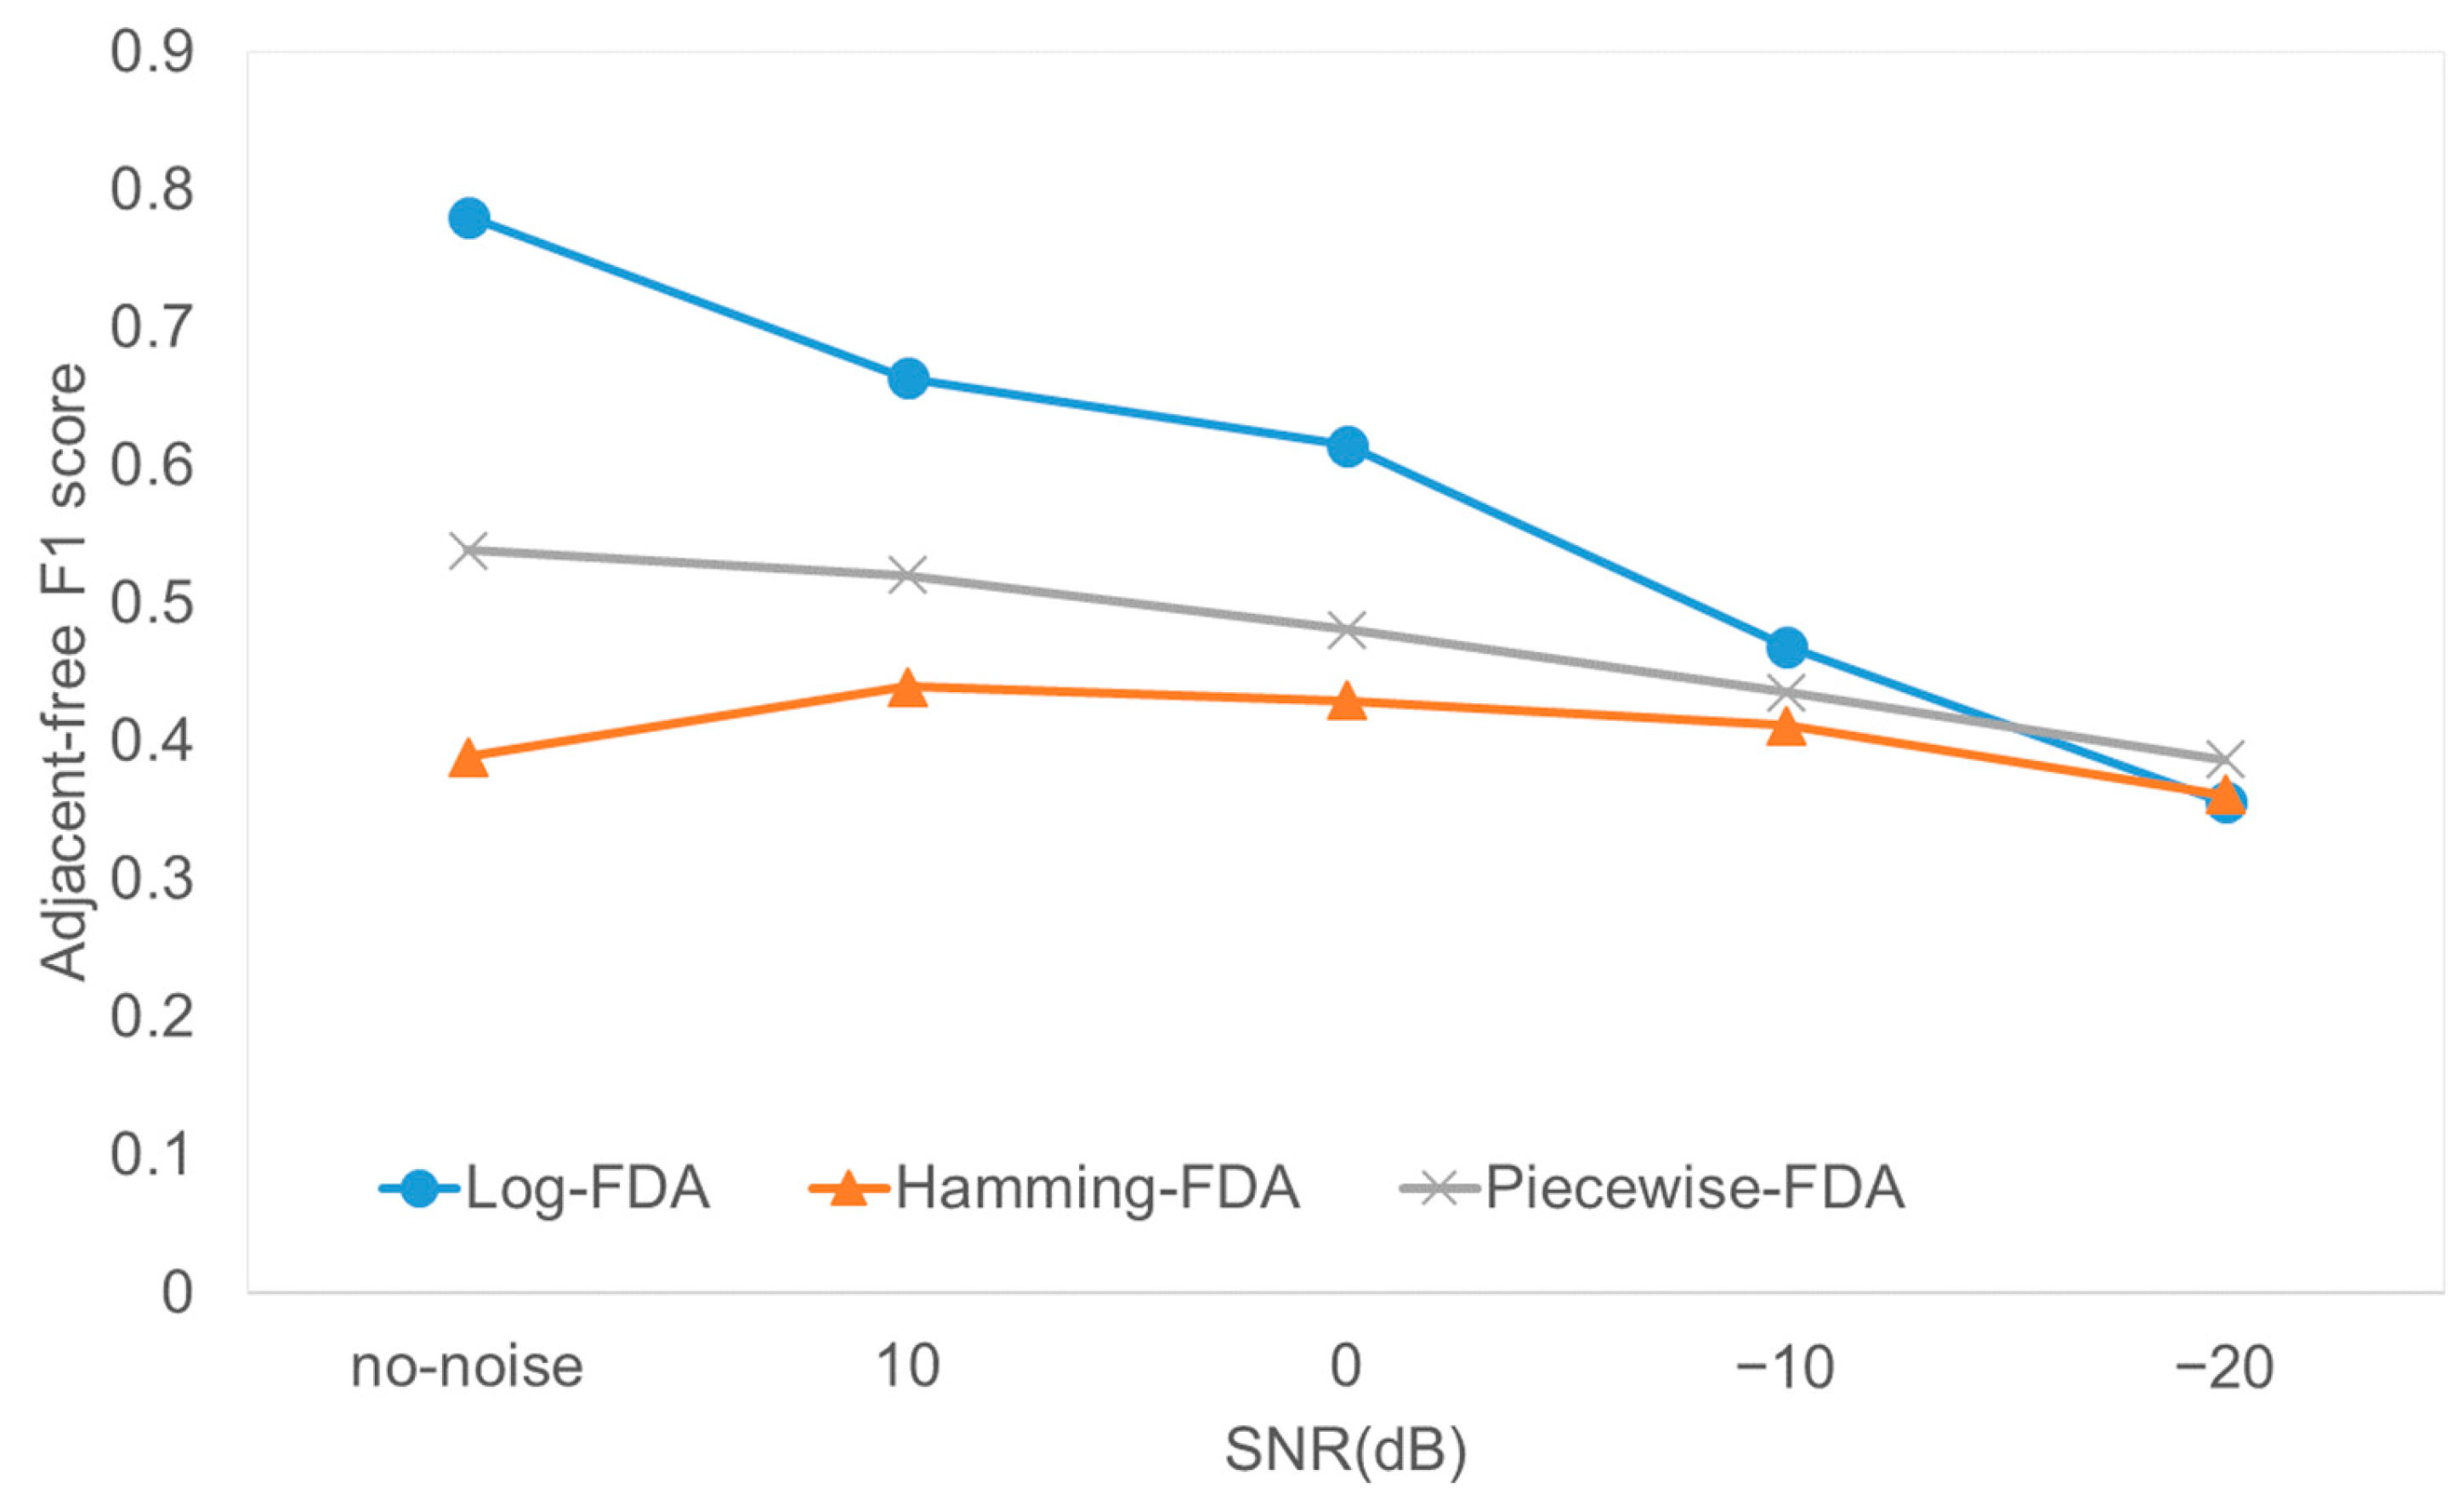
The adjacent-free F1 score in the multi-target scenario is shown in
Figure 13. In the absence of noise, the log-, Hamming-, and piecewise-FDAs produce maximums of 0.781, 0.389, and 0.539, respectively. Although the score is lower than that of a single-target case due to multi-target reflection, it is certain that multi-targets can also be found. The score decreases in the presence of noise, but the log-FDA produces the best performance in most cases.
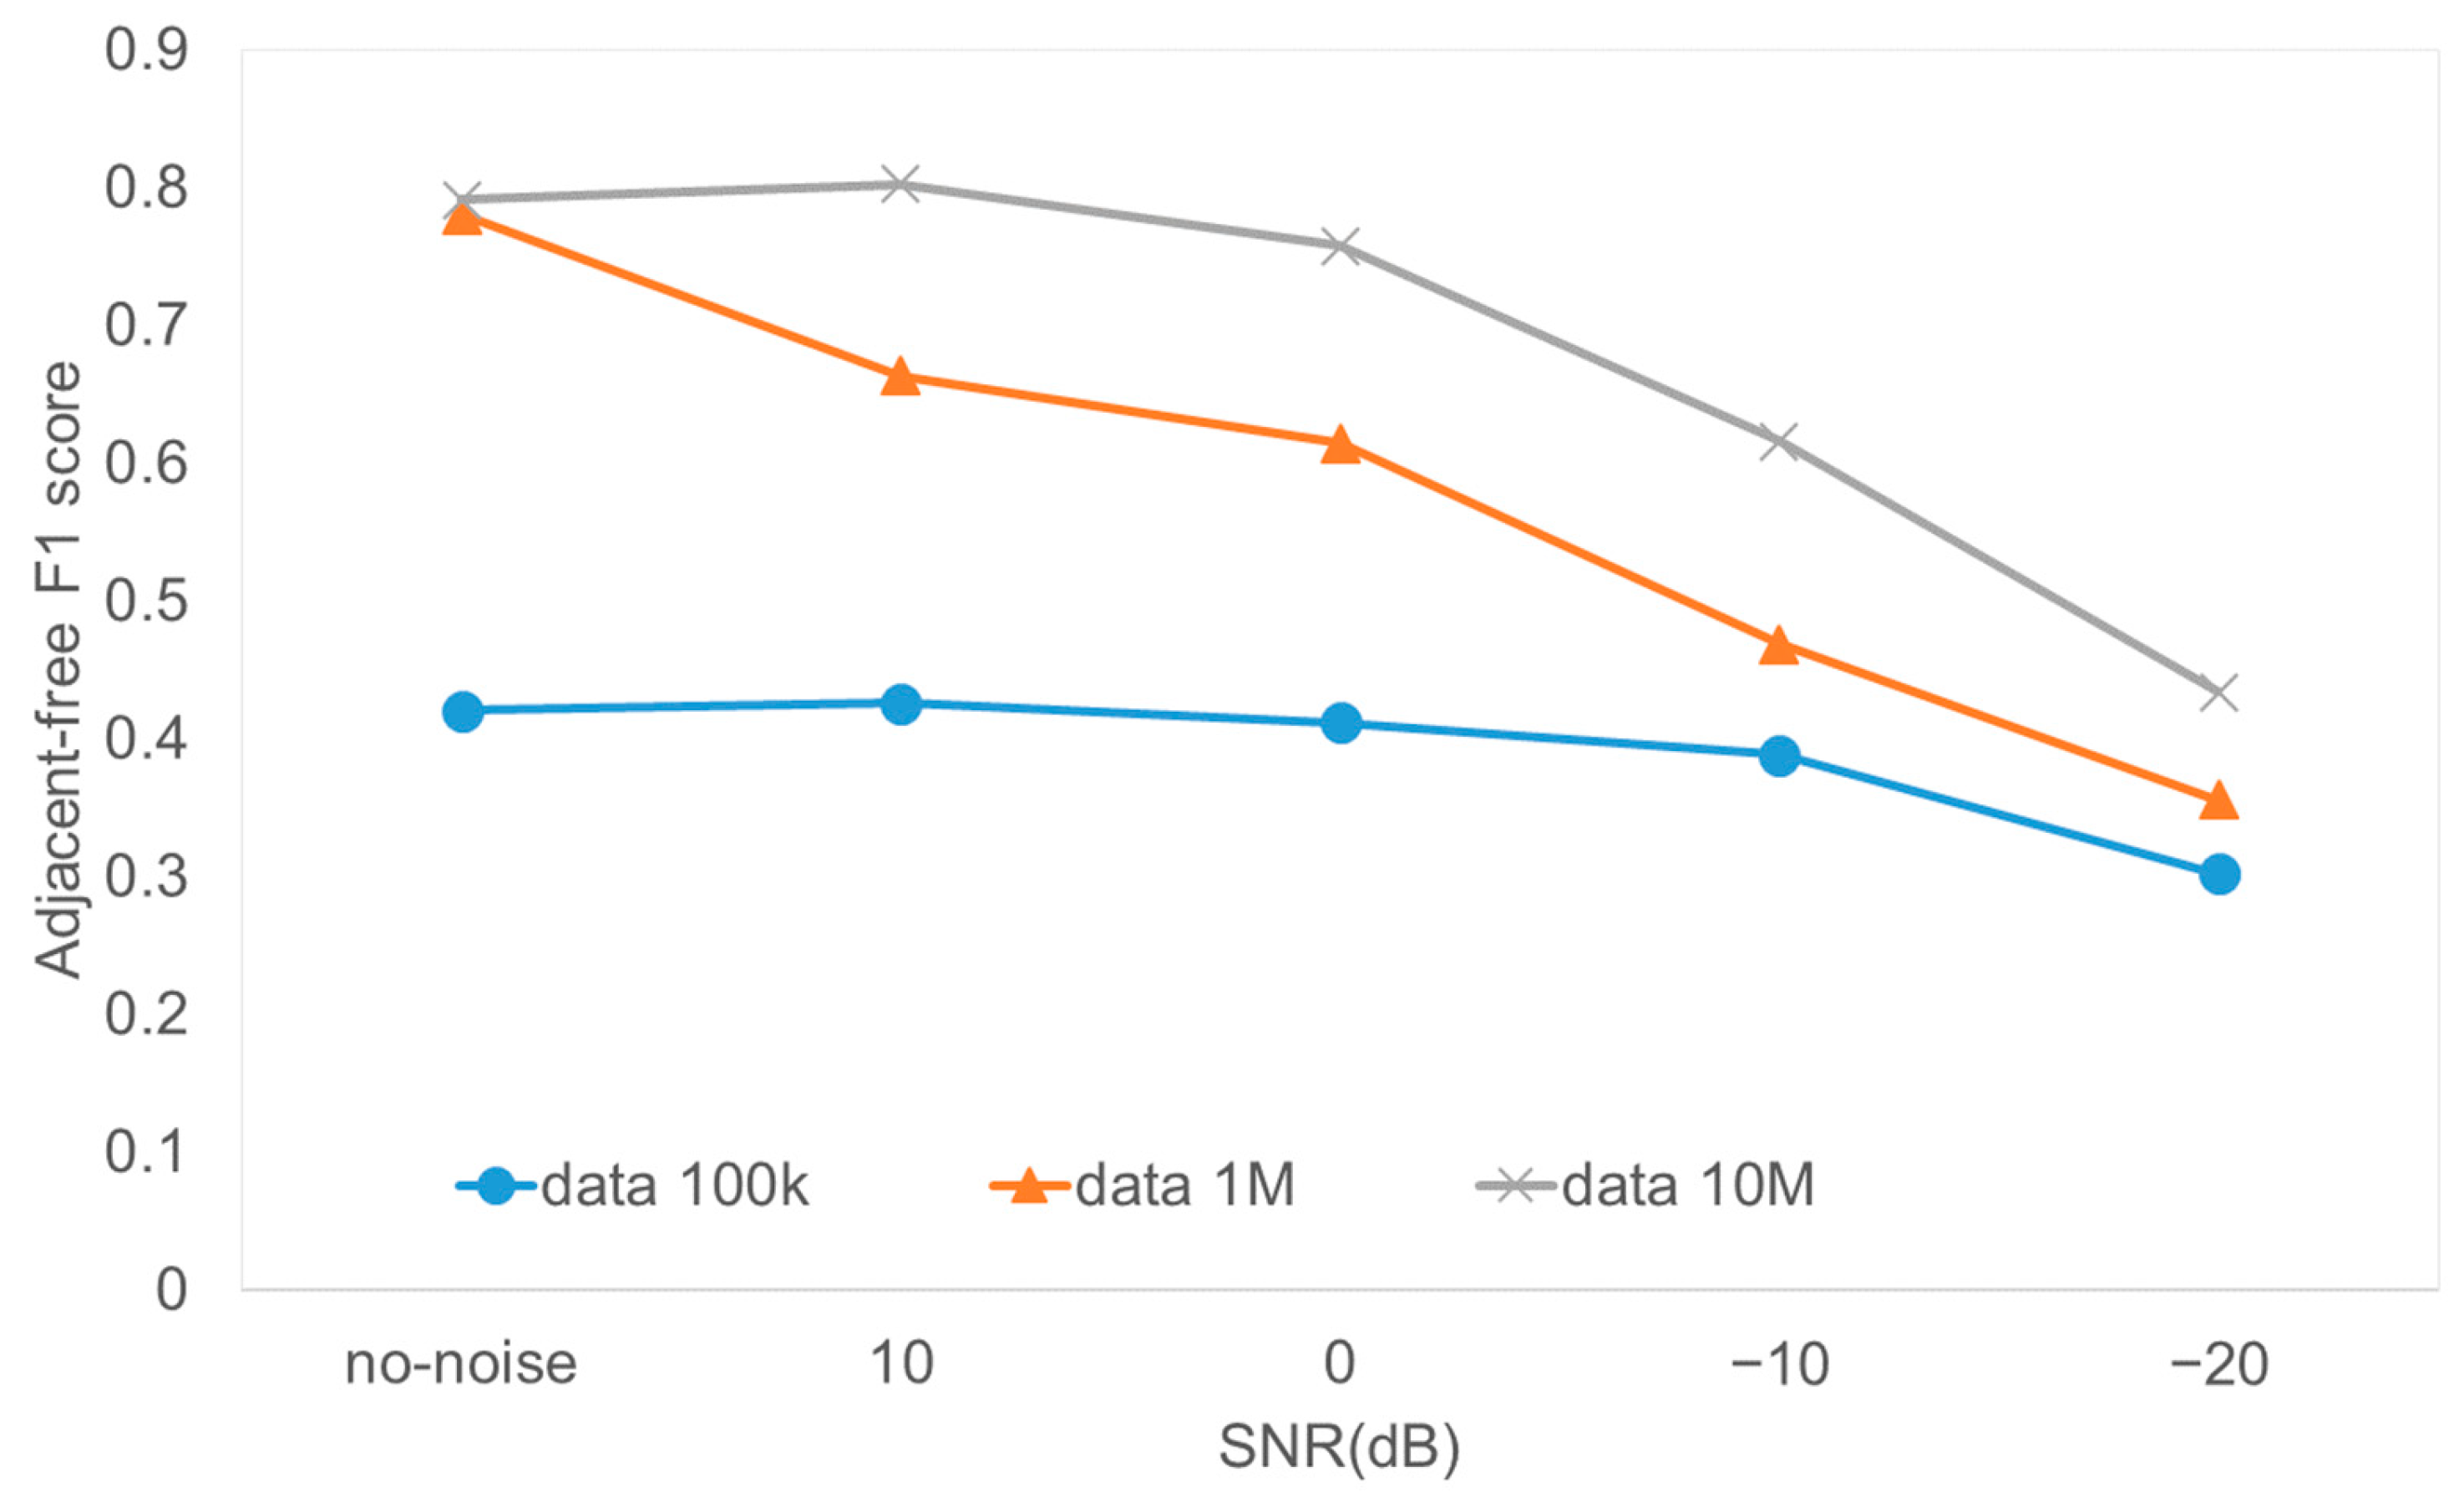
The total number of pieces of data is an important parameter to consider.
Figure 14 shows the performance with different data sizes for the log-FDA system. As the data size increases, the performance improves as expected. In the case of 10
7 data, the F1 score stays around 0.8 without showing a severe decrease under the assumption of 0 dB SNR at the closest distance. This verifies that the large dataset improves and stabilizes the performance.
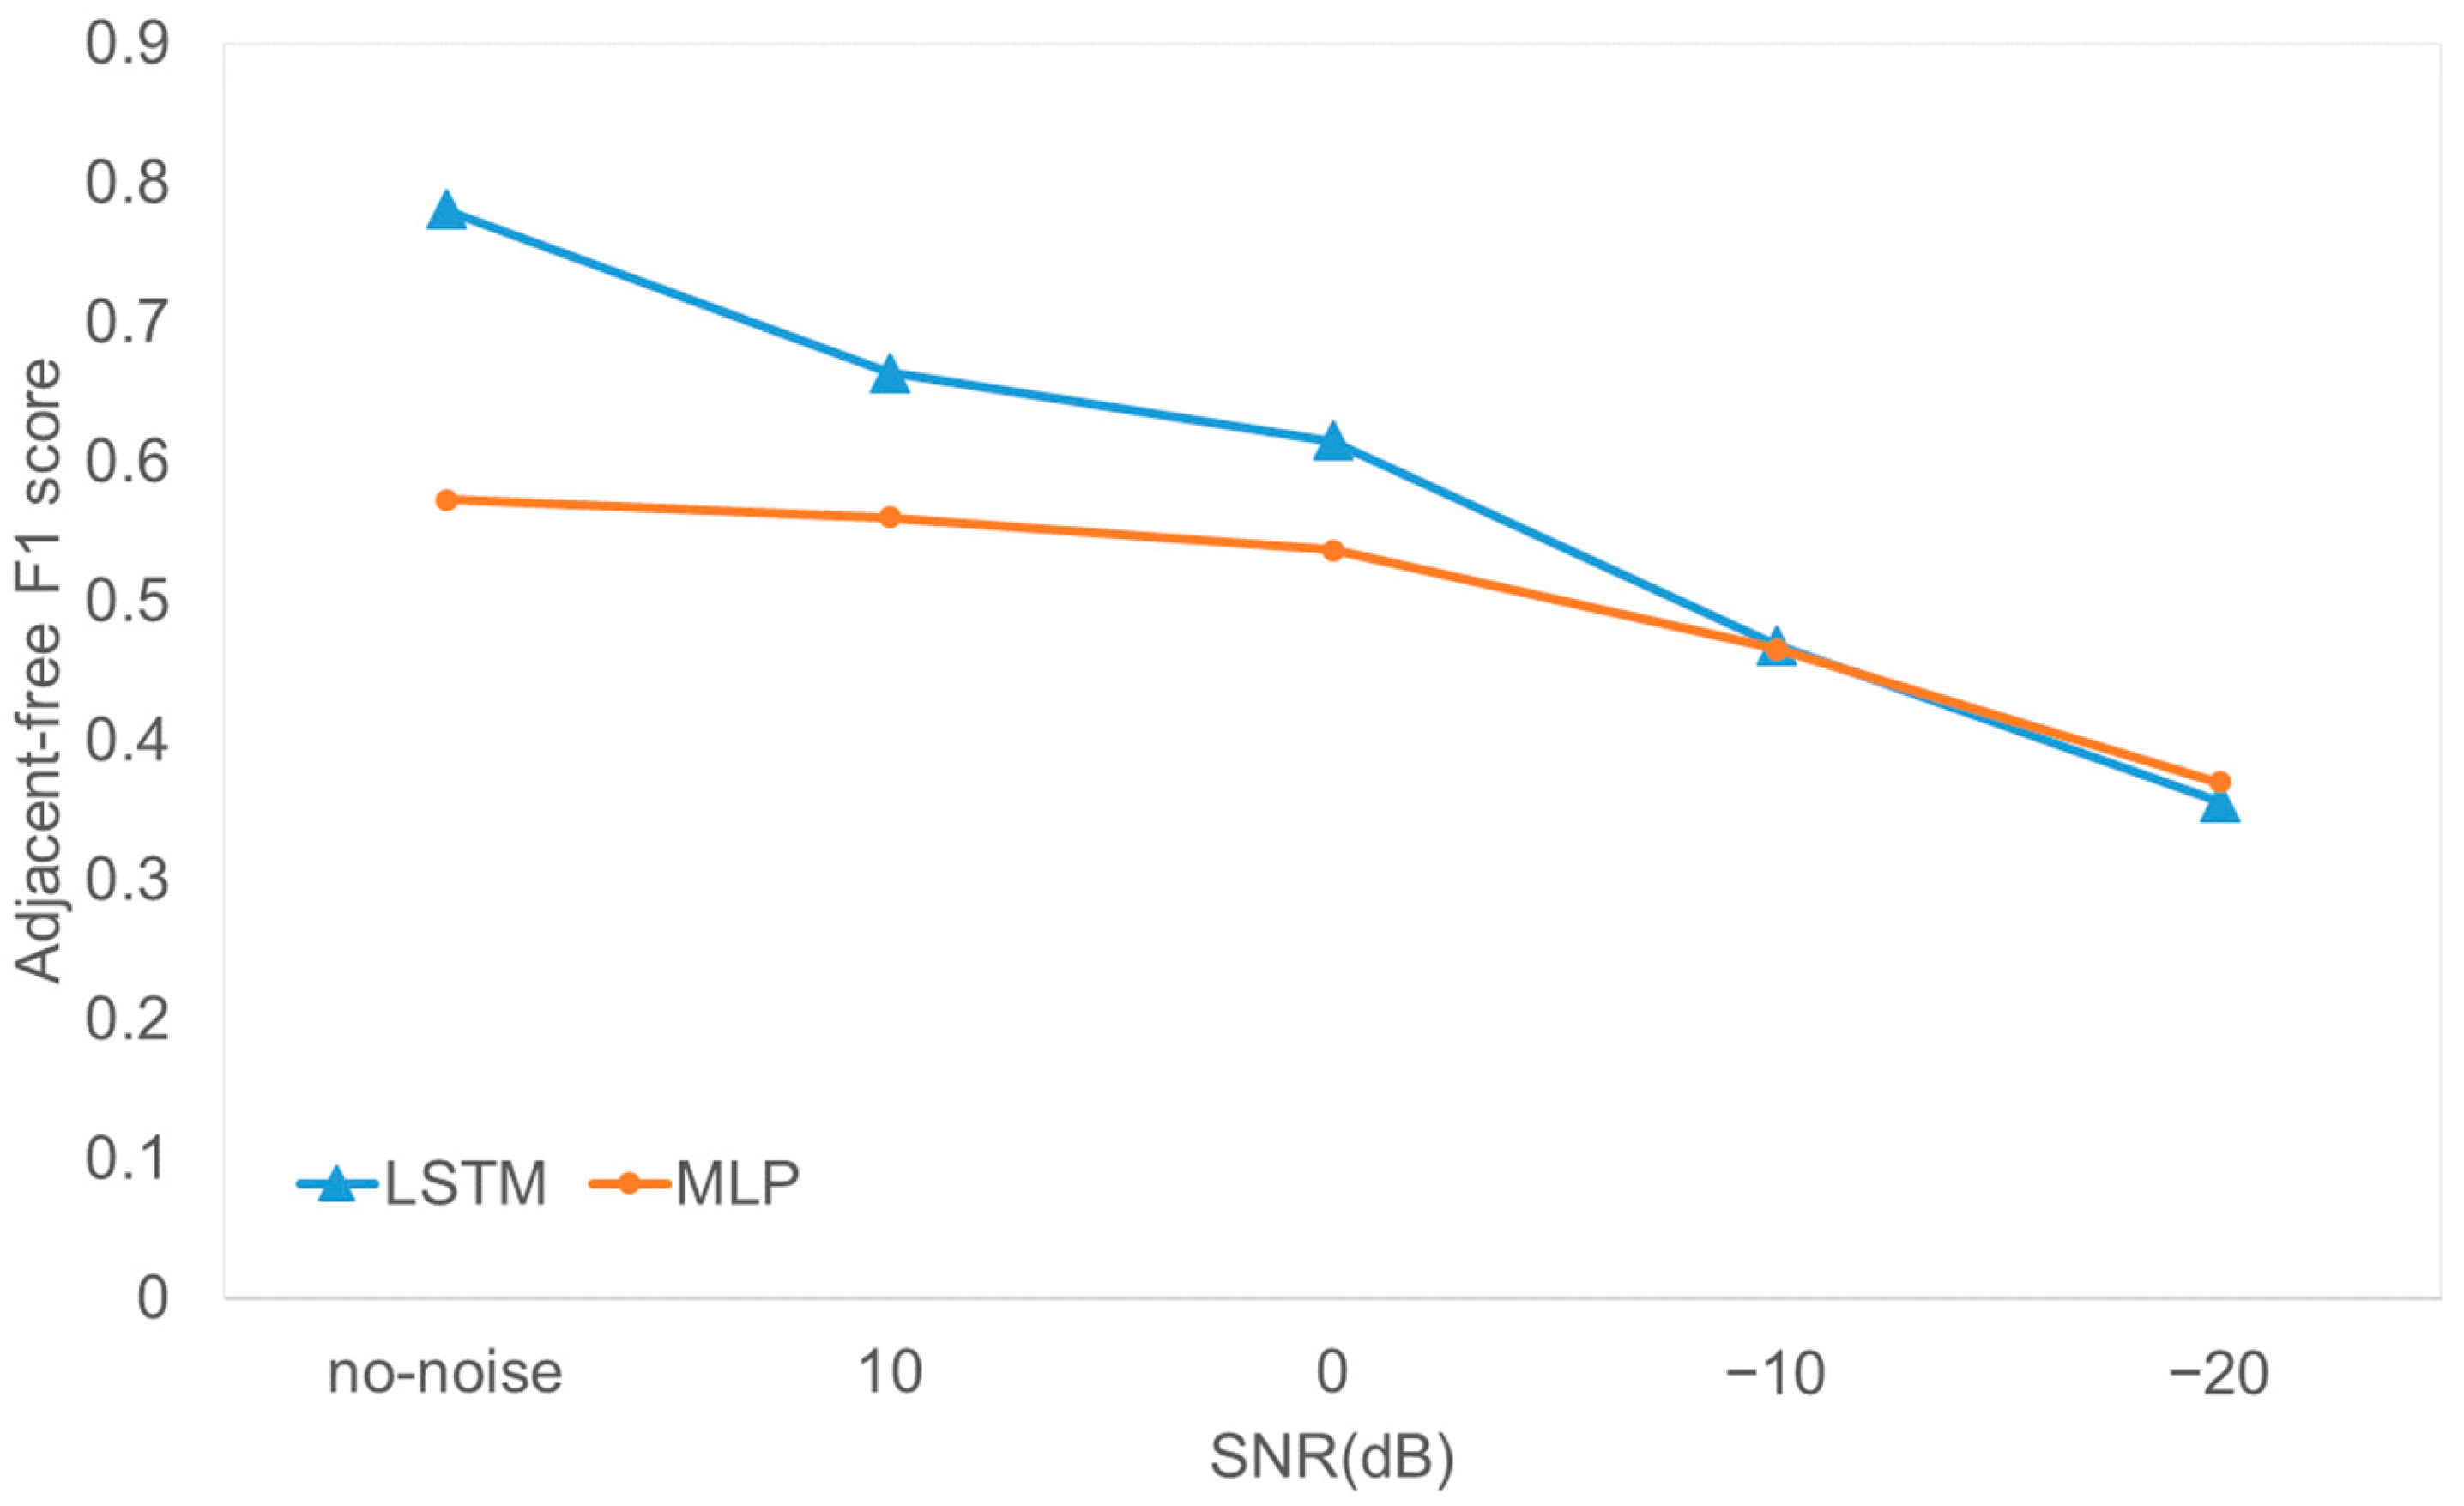
In order to validate the suitability of LSTM, a simple two-layer MLP is compared to LSTM in
Figure 15. LSTM performs significantly better than MLP. Although we did not test up-to-date models such as transformer, it is certain that LSTM can be a strong candidate model for Single-RX FDA data. Furthermore, complicated models are not suitable for simple systems with a single-Rx system. In the future, with more sophisticated model design, the system performance may be increased.
From the above experiments, it is certain that the proposed single-Rx localization system can predict the location of targets in both single-target and multi-target scenarios. Although an F1 score of more than 0.8 is not achieved during the multi-target experiment, it can be acceptable in random location, random size, and multi-target scenarios.
