Abstract
Student behavior analysis plays a critical role in enhancing educational quality and enabling personalized learning. While previous studies have utilized machine learning models to analyze campus card consumption data, few have integrated multi-source behavioral data with large language models (LLMs) to provide deeper insights. This study proposes an intelligent educational system that examines the relationship between student consumption behavior and academic performance. The system is built upon a dataset collected from students of three majors at Xinjiang Normal University, containing exam scores and campus card transaction records. We designed an artificial intelligence (AI) agent that incorporates LLMs, SageGNN-based graph embeddings, and time-series regularity analysis to generate individualized behavior reports. Experimental evaluations demonstrate that the system effectively captures both temporal consumption patterns and academic fluctuations, offering interpretable and accurate outputs. Compared to baseline LLMs, our model achieves lower perplexity while maintaining high report consistency. The system supports early identification of potential learning risks and enables data-driven decision-making for educational interventions. Furthermore, the constructed multi-source dataset serves as a valuable resource for advancing research in educational data mining, behavioral analytics, and intelligent tutoring systems.
1. Introduction
The use of machine learning techniques to analyze and predict students’ behaviors has become increasingly prevalent in modern education systems. Such analyses and predictions assist higher education institutions in identifying students who face difficulties in learning or other issues in advance, thereby enabling timely support and intervention. They also help optimize teaching methods and curriculum design, enhancing overall educational quality. For instance, by analyzing clickstream data and exam performance in massive open online course (MOOC) systems [1], it is possible to identify which learning resources and activities have the greatest impact on student performance, thus enabling targeted improvements in teaching strategies. Furthermore, by identifying key factors influencing students’ academic achievements and establishing early warning systems, educators can intervene at the initial stages of a problem. These interventions can rely on substantial latent knowledge extracted from educational data, uncovering imperceptible issues in traditional classroom teaching.
The powerful semantic processing capabilities of LLMs offer novel solutions to the task of student behavior prediction and analysis [2], exerting a profound impact on the personalized development and efficient management of education. LLMs can integrate multi-source data (e.g., operational logs from online learning systems and content from forum discussions) to extract deep learning characteristics from linguistic behaviors [3]. For example, by analyzing question-and-answer content and interaction records on learning platforms, these models can identify students’ areas of interest, knowledge gaps, and even emotional states. This information assists educational institutions or platforms in developing more effective learning resource recommendation strategies [4], providing personalized learning pathways, and enhancing overall learning outcomes.
More importantly, LLMs can generate intelligent behavioral reports based on behavioral analysis. For instance, over a student’s learning cycle, a model can summarize learning progress, behavioral trends, and potential risk points, generating visualized reports for teachers and parents. This data-driven decision support not only improves the precision of educational interventions but also helps prevent students from falling behind, thereby promoting educational equity and quality [5]. The application of LLMs to analyzing and predicting students’ behaviors provides essential technological support for personalized education and quality improvement, while enabling education managers to gain deeper insights into students’ behaviors, fostering a more intelligent and efficient educational ecosystem [6].
In this paper, we propose an intelligent educational system based on LLMs that integrates student consumption behavior and academic performance data to conduct behavior analysis. Using data collected from students of three majors at Xinjiang Normal University, including exam scores and campus card records, we construct an intelligent agent system that performs multi-source data fusion and generates individualized behavior analysis reports. Moreover, due to the lack of publicly available student behavior datasets, we contribute a structured dataset to support future research in the smart education field.
The main research question addressed in this study is: Can a large language model-based intelligent agent effectively analyze students’ consumption behavior and academic performance to support early educational intervention and personalized learning? As the dataset is limited to students from three majors, the findings should be interpreted within this context. Future research will extend the dataset to a broader student population to enhance the generalizability of the results.
To address this question, the remainder of this paper is organized as follows:
Section 2 reviews related work in student behavior analysis and the application of LLMs in education.
Section 3 introduces the dataset construction and visualization process.
Section 4 details the proposed intelligent system framework and its core components.
Section 5 presents experimental results and evaluation.
Finally, Section 6 concludes the paper and discusses limitations and future research directions.
2. Related Work
2.1. Student Behavior Analysis
In recent years, a growing number of studies have applied data mining and machine learning techniques to student performance prediction. For instance, Grivokostopoulou et al. [7] proposed a method combining decision trees and semantic rule extraction to predict students’ final grades by analyzing their learning activities. Similarly, Andergassen et al. [8] found that frequent engagement with learning systems in blended learning settings is significantly correlated with improved exam performance. These findings highlight the importance of learning behavior data in forecasting academic outcomes. Extending this line of work, Kalita et al. [9] conducted a decade-long review of educational data mining research, summarizing methodological advances and identifying persistent challenges in applying data-driven approaches to educational contexts. These studies collectively highlight the enduring value of learning behavior data in forecasting academic outcomes.
More advanced approaches have recently emerged using deep learning and LLM-based methods. Hayat et al. [10] introduced a three-tier LLM framework to forecast student engagement from qualitative longitudinal data, demonstrating that LLMs can effectively model complex educational behaviors over time. This reflects a shift in educational analytics toward leveraging language-based models for nuanced predictions.
In parallel, many researchers have explored the relationship between student consumption behavior and academic performance using campus card data. Earlier studies applied decision tree algorithms, clustering methods, or rule mining techniques to uncover patterns in spending habits that relate to academic outcomes [11,12]. Building on these foundations, Durachman et al. [13] applied k-means clustering to analyze study hours, attendance, and tutoring session patterns, linking them directly to educational achievement and providing a richer behavioral context for interpreting consumption data. These works provided useful insights for policy-making, particularly in the context of financial aid and student support systems.
Recent surveys have emphasized the potential and challenges of integrating LLMs into the educational context. Guizani et al. [2] conducted a comprehensive systematic review on the use of LLMs in higher education, identifying technical and ethical challenges, as well as opportunities for enhancing teaching and learning. Meanwhile, Razafinirina et al. [5] discussed how LLMs can be aligned with pedagogical goals for personalized learning, outlining trends in adaptive educational systems and intelligent tutoring models.
In summary, while prior research has established the value of academic and behavioral data in predicting student performance, relatively few studies have effectively combined multi-source behavioral signals—such as consumption and performance data—within a unified LLM-enhanced analytical framework. Our study addresses this gap by integrating large language models with graph-based representations to provide interpretable predictions and behavior analysis in a real-world university setting.
2.2. LLMs and AI Agents
Large language models (LLMs) [14,15] and intelligent agents are two pivotal and complementary concepts in the field of artificial intelligence (AI). Their synergistic development and applications are profoundly transforming multiple domains, including natural language processing (NLP), task automation, and human–computer interaction.
The core of LLMs lies in the use of deep learning techniques, leveraging large-scale neural networks to extract linguistic structures and semantic knowledge from vast datasets. The developmental trajectory of LLMs can be traced back to the introduction of Word2Vec [16], which pioneered the word-embedding method, enabling machines to comprehend semantic relationships between words in vector form. Subsequently, the emergence of models such as BERT [17] and GPT [18] marked the advent of the pre-trained model era. Notably, OpenAI’s GPT [19,20] series evolved from unidirectional generative models into powerful bidirectional pre-trained generative models. The parameter scales of these models expanded from billions to hundreds of billions, becoming a critical driving force for breakthroughs in NLP. Presently, mainstream LLMs, such as ChatGPT, Llama [21], and Tongyi Qianwen [22], are built around the attention mechanism. This mechanism dynamically adjusts the weights of words within an input sequence by computing the correlations between words, enabling the models to effectively capture key contextual information.
The attention mechanism [23], a foundational component of LLMs [24], employs three critical matrices—query (Q), key (K), and value (V)—during model training and computation. Once the Q, K, and V matrices are obtained, the model computes the output of the self-attention layer:
where the dot product between each row vector of matrices Q and K is computed, and the result is divided by the square root of the matrix dimension to prevent excessively large dot product values. After multiplying Q by the transpose of K, a new matrix with both row and column counts equal to z is obtained, where z represents the number of interaction items in the input sequence, such as the number of words in a sentence or the number of items in a user interaction sequence. This new matrix encodes the strength of relationships between different items in the input sequence.
The integration of LLMs with intelligent agents has emerged as a significant trend in recent AI development. The powerful language generation and comprehension capabilities of LLMs provide intelligent agents with a natural language interface. This enables multi-turn conversations with users, parses complex task instructions, and formulates reasonable execution strategies. For instance, in virtual assistants, intelligent agents embedded with LLMs can understand user needs and coordinate multiple tasks [25]. In robotics, LLMs endow robots with the ability to process ambiguous instructions and operate in complex environments [26]. For autonomous driving, intelligent agents utilize LLMs to analyze traffic regulations and environmental information, thereby offering decision-making support for driving behaviors [27].
This integration not only enhances the intelligence level of agents but also promotes the application of LLMs to task-oriented scenarios. Looking ahead, as the scale of LLMs continues to expand and the hardware capabilities of intelligent agents improve, this integrated system is poised to unlock greater potential in fields such as education, healthcare, industrial production, and scientific research, fostering broader interdisciplinary and cross-scenario innovations.
2.3. Summary and Research Objectives
In summary, although prior studies have demonstrated the value of integrating academic and behavioral data for predicting student performance, most existing approaches either rely on single-source datasets or lack the capability to combine multi-source behavioral signals within a unified, interpretable framework. Furthermore, while large language models (LLMs) have shown potential in educational contexts, their integration with graph-based methods for personalized behavior analysis remains underexplored.
To address these gaps, the objectives of this study are threefold: (1) to construct a multi-source dataset combining student consumption records and academic performance data, and to provide a visual and statistical analysis of these data; (2) to develop an intelligent educational system that integrates LLMs with SageGNN-based graph embeddings to generate individualized behavior reports; (3) to evaluate the system’s effectiveness, interpretability, and applicability in real-world higher education settings.
Accordingly, this study focuses on one central research question: whether an LLM-based intelligent agent can effectively integrate multi-source student behavioral and academic data to deliver accurate and interpretable analyses.
3. Dataset Construction
3.1. Participants
To address the scarcity of open-source datasets on student behavior, we constructed a dataset from a subset of undergraduate students at Xinjiang Normal University. As summarized in Table 1, the dataset comprises n = 437 students from the same college, enrolled in three majors—computer science (n = 212), software engineering (n = 116), and network engineering (n = 109)—and spanning three academic grades: third-year (n = 139), second-year (n = 143), and first-year (n = 155). Participants represent 20 regions and 13 ethnic groups, with ages ranging from 16 to 27 years. The gender distribution is balanced, with 49.4% female and 50.6% male.

Table 1.
Student behavior analysis dataset.
Data were collected over two consecutive semesters (fall: September–January; spring: March–July) from three institutional sources (see Table 1):
Student Management System (SMS): demographic attributes such as gender, ethnicity, region, age, grade, and major.
Campus Card System (CCS): 377,233 transaction records (excluding winter and summer breaks) containing transaction time, amount, card balance, usage frequency, operation type, POS terminal ID, and other identifiers.
Academic Performance Management System (APMS): exam scores for ten courses, aligned with each major’s curriculum plan and including both core and elective courses. All scores are reported on a 100-point scale, calculated as a weighted sum of continuous assessment and final examination results.
All data were anonymized to ensure privacy and security. Preprocessing steps included detecting and addressing missing values, outliers, and unique values, as well as encoding categorical variables (e.g., ethnicity, region) to preserve statistical characteristics while preventing personal identification. These procedures ensured the dataset’s integrity and research utility for educational data mining and predictive modeling.
3.2. Procedure
The dataset construction process involved four main stages:
- Data Extraction and Integration
Relevant attributes were obtained from the student management system (SMS), campus card system (CCS), and academic performance management system (APMS) and then consolidated into a unified multi-source dataset.
- b.
- Data Cleaning and Preprocessing
Missing values, outliers, and unique values were systematically identified and addressed through appropriate imputation or removal methods.
Selected categorical variables, such as ethnicity and region, were encoded to retain statistical characteristics while preventing direct personal identification.
- c.
- Temporal and Behavioral Alignment
Consumption records were standardized by timestamp and aligned with academic performance data for each semester.
- d.
- Feature Engineering
Time-series behavioral features and academic performance indicators were derived to form a structured feature set suitable for machine learning model training.
3.3. Data Analysis and Visualization
As shown in Figure 1, among the selected 437 samples, 216 were female and 221 were male, accounting for 49.4% and 50.6% of the total data, respectively. This ensures a relatively balanced gender ratio to a certain extent, thereby mitigating the potential impact of gender imbalance on the model.
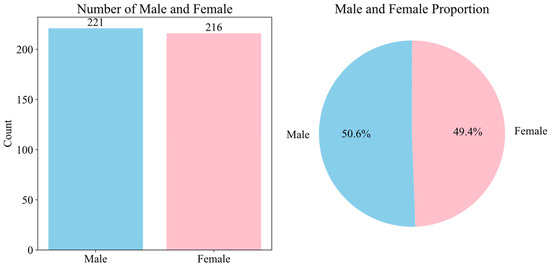
Figure 1.
Gender ratio.
The distribution of regional and ethnic information may influence students’ consumption behavior and academic performance. Figure 2 and Figure 3 present the statistical distribution of ethnic and regional information within the dataset. To protect data privacy and meet the requirements of model training, all ethnic and regional data were encoded. This approach preserves the statistical characteristics of the original information while preventing the direct exposure of individual features, effectively reducing the risk of data leakage.
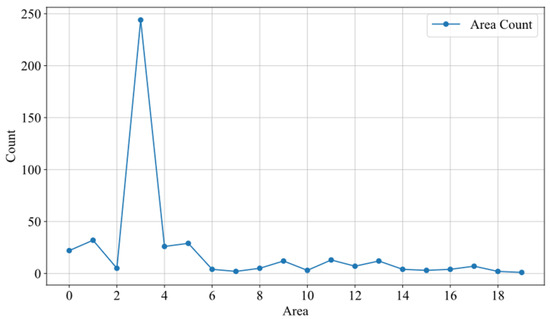
Figure 2.
Regional distribution.
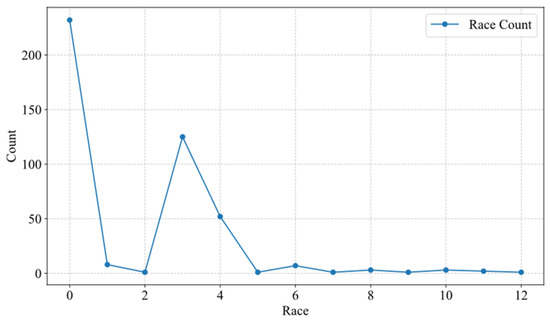
Figure 3.
Ethnic distribution.
Figure 4 uses box plots to visually represent the statistical characteristics of each course’s grades. The upper and lower boundaries correspond to the 75th and 25th percentiles, respectively, while the horizontal line in the middle indicates the median grade. From the figure, it can be observed that the grade distributions vary across different courses. A small number of low outliers are present in all courses, suggesting that certain students’ performance in these courses deviates from the overall trend. This also indirectly reflects the varying levels of difficulty among different courses.
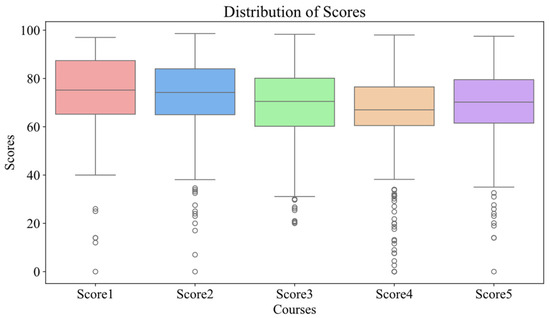
Figure 4.
Score distribution.
Figure 5 and Figure 6 present the heatmaps of student consumption frequency and consumption amount, respectively. The horizontal axis represents the dates of a month, while the vertical axis denotes the time periods within a day. The intensity of the colors in the heatmaps reflects the frequency and amount of consumption across different dates and time periods.
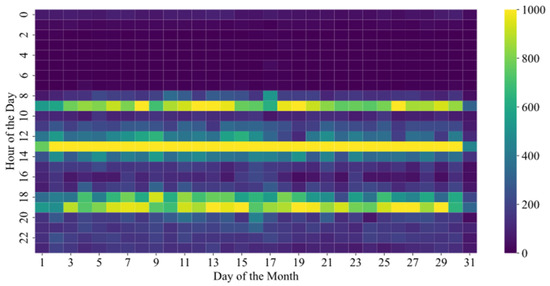
Figure 5.
Student consumption frequency.
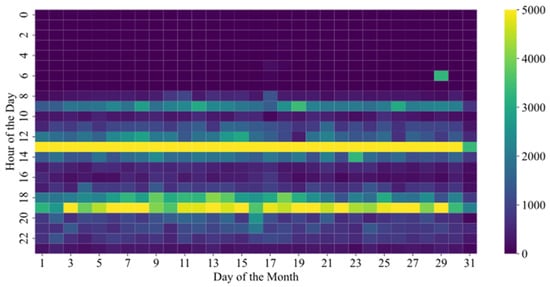
Figure 6.
Consumption amount.
Related studies suggest that adhering to a regular three-meal schedule can, to some extent, help students maintain sufficient energy to complete their academic tasks. Therefore, the consumption data from student ID cards serves as a crucial basis for behavior prediction modeling.
From the two figures, it can be observed that students’ consumption behavior exhibits specific spatiotemporal patterns in terms of frequency, as well as notable variations in consumption amounts. These visualized data insights facilitate further analysis of students’ consumption habits, help identify potential issues (e.g., abnormal consumption behavior), and provide data-driven support for student behavior analysis.
4. Method
4.1. Model Architecture
To further analyze students’ behaviors based on the constructed dataset, we developed a student behavior analysis system powered by Langchain [28]. The system aims to comprehensively examine the relationship between students’ consumption behavior and academic achievement performance. Built on Llama3.2, the agent leverages the model’s efficient tool-calling capabilities and lightweight design, making it suitable for deployment on resource-constrained mobile and edge devices.
The agent is composed of multiple tools, including a consumption embedding learning tool, a temporal analysis tool, and a score computation tool. Through the collaborative operation of these tools, the agent effectively extracts latent features from student consumption and academic data, generating comprehensive behavior analysis reports.
As shown in Figure 7, a graph is first constructed based on students’ consumption information, and the SageGNN model is trained to extract consumption information embeddings. The trained model is then utilized for subsequent consumption behavior analysis. Next, the system, powered by Llama3.2, invokes multiple tools to perform specific tasks, including analyzing changes in consumption behavior, evaluating academic performance, and assessing the regularity of consumption timing. Finally, the system integrates the results of these analyses to generate a structured student behavior analysis report.
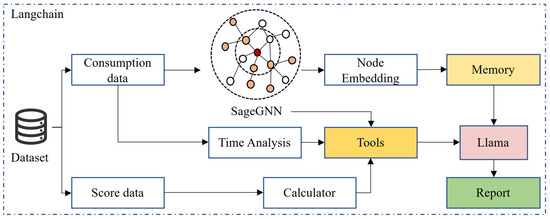
Figure 7.
The system structure.
4.2. Experimental Setup and Evaluation
4.2.1. Incremental Pretraining of Models
In recent years, pre-trained language models have achieved remarkable success in NLP tasks. However, due to the inability of general-purpose pre-trained models to optimize for specific domain requirements, their performance may be limited, and LLMs face similar challenges. To address this, incremental pre-training on domain-specific data has emerged as a viable solution. In this study, we selected the LLaMA3.2 3B model and conducted incremental pre-training using the IndustryCorpus_education2 dataset tailored to the education sector.
The IndustryCorpus is a large-scale corpus specifically constructed for training domain-adapted language models containing diverse domain-specific subcollections. Among these, IndustryCorpus_education is the subset dedicated to the education domain, comprising educational research papers, anonymized institutional reports, teaching materials, examination-related documents, and simulated dialogs from academic scenarios. The total size of this subset is approximately 458.1 GB. For our study, we extracted around 10 GB of high-relevance content from this subset, resulting in a total of 1,756,300 training entries. All data were cleaned to remove duplicates, irrelevant content, and sensitive personal information before use in low-rank adaptation (LoRA)-based fine-tuning of the LLaMA3.2-3B model. This ensured both domain specificity and compliance with privacy requirements while keeping computational costs manageable.
4.2.2. Agent Workflow
To achieve an integrated analysis of student consumption behavior and academic performance, we designed a workflow based on an AI Agent. The workflow encompasses data embedding, pattern analysis, classification of performance, and analysis report generation. The following sections provide a detailed explanation of the key processes:
Step 1: Using the pretrained SageGNN network to embed students’ consumption information. The SageGNN network extracts features from consumption data and generates a high-dimensional embedding vector, representing the comprehensive characteristics of student consumption behavior.
Step 2: Using the unique student ID retrieves the embedded vector of their consumption data from the previous semester. By calculating the distance between the current and historical consumption embeddings, the system evaluates the degree of change in student consumption behavior. This step highlights the behavioral differences across different time periods.
Step 3: To assess the temporal regularity of student consumption behavior, Fourier Transform is applied to extract frequency-domain features from the consumption time series. Additionally, information entropy is used to compute a regularity score. Fourier Transform identifies periodic patterns in consumption behavior, while information entropy quantifies the randomness and distribution of consumption timing.
Step 4: Student course performance data is used to compare academic results from the current semester with those from the previous semester. A classification model is constructed to determine whether there are significant fluctuations in performance.
Step 5: The information generated in the above steps, including consumption embedding distance, temporal regularity scores, and academic performance fluctuation classification results, is aggregated and processed using the Llama model, and an analytical report on the student’s consumption behavior and academic performance is produced.
As shown in Algorithm 1, This AI system-based workflow provides a structured and intelligent approach to understanding the interplay between student consumption patterns and academic outcomes, enabling personalized insights and targeted interventions.
| Algorithm 1. The Workflow |
| Input: C_curr—Current semester consumption data C_prev—Previous semester consumption data S_curr—Current semester academic scores S_prev—Previous semester academic scores Output: Student behavior analysis report 1: function EMBED_INFO(C): 2: return SageGNN(C) // Generate consumption embeddings using SageGNN 3: function CALCULATE_DISTANCE(E_curr, E_prev): 4: return EuclideanDistance(E_curr, E_prev) 5: function COMPUTE_REGULARITY(C): 6: F ← FourierTransform(C.time_series) 7: E ← InformationEntropy(C.time_series) 8: return WeightedScore(F, E) 9: function SCORE_CLASSIFICATION(S_curr, S_prev): 10: Δ ← CompareScores(S_curr, S_prev) 11: return ClassifyPerformance(Δ) 12: procedure AGENT_WORKFLOW(C_curr, C_prev, S_curr, S_prev) 13: E_curr ← EMBED_INFO(C_curr) 14: E_prev ← EMBED_INFO(C_prev) 15: D ← CALCULATE_DISTANCE(E_curr, E_prev) 16: R ← COMPUTE_REGULARITY(C_curr) 17: P ← SCORE_CLASSIFICATION(S_curr, S_prev) 18: Report ← LLM.invoke(D, R, P) 19: return Report |
4.2.3. SageGNN
The SageGNN model consists of an encoder and a decoder designed to capture the latent patterns of consumption behavior through an end-to-end unsupervised learning process. Figure 8 illustrates the constructed student consumption graph, in which each node represents an individual student. Edges between nodes are established based on the similarity of their consumption behaviors. This structure allows the SageGNN encoder to aggregate information from each student and their neighbors, thereby capturing latent patterns of behavioral similarity for subsequent analysis.
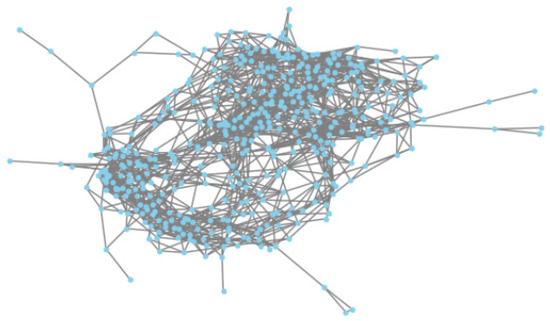
Figure 8.
Student consumption graph structure. (Dots represent students, and lines indicate similarities in their consumption behaviors).
The encoder is designed based on the GraphSAGE [29], which generates embedding representations by aggregating features from nodes and their neighborhoods. The decoder is implemented using a fully connected layer, mapping the low-dimensional embeddings back to the original feature space to achieve feature reconstruction. This design ensures that the model can effectively capture the feature distribution of consumption behavior in a low-dimensional space. The embedding update formula for the l-th layer of the model is as follows:
where N(i) denotes the neighborhood set of node i, W(l) represents the linear transformation matrix at layer l, σ is the activation function, and aggregate refers to the aggregation function.
4.2.4. The Analysis of Time Consumption
The regularity of student consumption behavior can reflect their daily routines and habits. We employ a combined method of spectral analysis and information entropy to quantitatively analyze the regularity of students’ consumption time data and assign scores to their regularity. By applying Fourier transform, we extract periodic features, and sample entropy is used to evaluate the randomness of the time series, enabling a comprehensive assessment of the temporal regularity.
In our dataset, the consumption time data lacks continuous characteristics, making direct regularity analysis challenging. To address this, the time-point sequence is transformed into a time-interval sequence to uncover latent periodicity and distribution patterns. Given the time-point data, the time intervals can be defined as:
For time intervals, Fourier Transform can be utilized for spectral analysis:
where x(n) represents the time interval sequence, and X(f) denotes the signal in the frequency domain, f is the frequency. Additionally, information entropy can be employed to evaluate the complexity and randomness of the time interval sequence. The final evaluation result can be obtained through a weighted summation of the outcomes from spectral analysis and information entropy:
4.2.5. Performance Analysis
The academic performance analysis tool focuses on identifying fluctuations in student performance across different semesters, leveraging key features such as grade point average (GPA) and average scores for data analysis. For instance, by comparing changes in GPA between the current and previous semesters, this tool can promptly detect significant variations in academic performance. Based on the analysis, we categorize students into three groups:
Stable: Students in this category exhibit minimal fluctuations in performance, maintaining a consistent and stable academic status, indicating a satisfactory learning trajectory.
Attention Needed: These students show slight performance variations that, while not severe, may be influenced by learning strategies or external factors. Targeted guidance and support may be required to address potential issues.
At-Risk: This category includes students experiencing significant fluctuations, often with a downward trend in performance. These students require prioritized attention and timely intervention to prevent further deterioration.
4.3. Experimental Results
To evaluate the performance of the proposed educational agent, we adopted three widely used language generation metrics: perplexity, type–token ratio (TTR), and repetition ate (RR). Identical prompts were provided to Llama2, Qianfan [30] and the proposed agent (Llama3.2-3B-Agent) for comparative analysis.
Table 2 visualizes the comparison of model performance across these metrics. Perplexity quantifies the degree of “uncertainty” in a model’s generated text; lower values indicate a better ability to produce contextually appropriate language. Across multiple tests, our agent consistently achieved lower perplexity scores than the baselines, demonstrating superior fluency and contextual understanding.

Table 2.
Model evaluation results.
The type–token ratio (TTR) reflects lexical diversity, with higher values indicating richer vocabulary usage. Due to its smaller parameter size, the proposed agent exhibited generally lower TTR values, suggesting comparatively limited lexical variation.
Repetition rate (RR) measures the proportion of repeated content in generated text. The agent’s higher RR values compared to the other two models indicate that, while coherent, its outputs still contain more redundancy, implying room for improvement in content diversity.
The accuracy score reflects expert evaluations of the correctness and reliability of the generated reports. As shown in Table 2, Llama2-7B-Chat achieved relatively lower accuracy (around 0.70–0.74), indicating that although the outputs were fluent, they contained more factual or interpretive inconsistencies. Qianfan-BLOOMZ-7B obtained moderate accuracy (0.71–0.78), showing more stable performance but with noticeable variation across samples. In contrast, Llama3.2-3B-Agent consistently demonstrated the highest accuracy (0.79–0.82), suggesting that its generated reports were generally more precise, coherent, and aligned with expert expectations. These results confirm that larger and more advanced models tend to provide better reliability in behavioral report generation.
Figure 9 presents the average performance of the three models across multiple experiments. It can be observed that our model outperforms the baselines overall, demonstrating superior accuracy and stability in the generated results. In terms of practical application, the generated content closely aligns with students’ real-life conditions, enabling educators and parents to gain clear insights into students’ learning performance and to provide targeted suggestions for improvement. Despite these promising results, several limitations warrant discussion.

Figure 9.
Comparison of model performance on language generation metrics.
First, the system relies heavily on campus card consumption data, which may introduce sampling bias, particularly for students who infrequently use their cards, resulting in sparse or incomplete behavioral records. This limitation could compromise the accuracy of behavioral pattern extraction and academic performance prediction. Future work will integrate additional data sources, such as library access logs, dormitory entry/exit records, and online learning management system (LMS) activity, to improve data completeness and model robustness. Second, our system is built upon the integrated infrastructure of Xinjiang Normal University. Not all institutions possess such comprehensive platforms, potentially limiting the model’s generalizability. To address this, we plan to modularize the system architecture for flexible integration with heterogeneous data sources and employ transfer learning on locally available datasets to enhance scalability and adaptability. Third, as with other LLM-based systems, our approach may be subject to biases in behavioral interpretation. For example, the model might overemphasize certain consumption or demographic patterns, leading to potentially skewed conclusions. Future work should incorporate fairness-aware modeling and bias mitigation strategies to address this issue.
These considerations highlight the need for ongoing refinement and multi-context evaluation to ensure that intelligent educational systems are fair, inclusive, and broadly applicable across diverse educational environments.
5. Discussion
In this study, the proposed LLM-based intelligent educational system was compared with related works presented in Section 2. Several similarities and differences were observed.
5.1. Similarities with State-of-the-Art Approaches
Consistent with studies by [11,12,13], our findings confirm that student consumption behavior is closely related to academic performance.
Similar to the LLM-based analyses reported by [2,5,10], our system demonstrates that large language models can effectively process multi-source educational data to generate interpretable insights.
5.2. Differences and Contributions
Unlike previous works that often rely on single-source data (e.g., campus card transactions or online learning logs), our approach integrates both consumption data and academic performance records, enabling more comprehensive behavioral analysis.
Prior LLM-based educational systems [2,10] have primarily focused on qualitative or text-based inputs; in contrast, our system combines graph-based embeddings (SageGNN) with time-series regularity analysis to handle structured behavioral data.
The proposed method achieved lower perplexity scores compared with general-purpose LLM baselines, suggesting better contextual understanding when generating domain-specific reports.
5.3. Interpretation of Differences
The differences can be attributed to the combination of domain-specific incremental pretraining and the use of multi-source data fusion. This design allows the system to capture patterns that may be overlooked in single-modality or non-specialized models. By situating our results within the context of prior research, it is evident that our approach extends existing methods in both scope and technical design, while confirming the fundamental relationship between student behavioral patterns and academic outcomes established in earlier studies.
6. Conclusions
This study demonstrates that an LLM-based intelligent agent can effectively integrate multi-source student behavioral and academic data to provide accurate and interpretable analyses. Building on this, the paper highlights the potential of machine learning and LLMs in education, particularly for predicting student behavior and academic performance. By developing an intelligent agent based on campus card consumption data and academic records, we provide educational institutions with a novel approach for the early identification of students’ potential learning difficulties and timely intervention. The analysis of data from Xinjiang Normal University validates the effectiveness of the proposed intelligent educational system in revealing behavior patterns and academic performance, thus offering valuable theoretical and practical support for the development of smart education.
However, the study has several limitations. First, the dataset is currently limited in scope, as it only includes data from a single college within the university. This restricts the generalizability of the findings across diverse academic environments. Second, the data types used are relatively narrow, focusing primarily on a few core course scores and dining-related consumption behaviors. This may not fully reflect the complexity of students’ learning patterns or daily activities.
Future research could expand the dataset to include students across the entire university and incorporate a broader range of behavioral indicators, such as library entry/exit records, dormitory access data, participation in extracurricular activities, or digital learning platform usage. Such enhancements would help build a more comprehensive, accurate, and generalizable student behavior prediction model, and further improve the practical utility of intelligent educational systems. In addition, attention should be given to the scalability of such systems to ensure they can be effectively deployed in diverse academic contexts. Equally important are the ethical considerations related to data privacy and algorithmic fairness, which must be carefully addressed to prevent unintended bias and protect students’ rights. Integrating these dimensions will not only strengthen the robustness of intelligent educational systems but also promote their responsible and sustainable application in the future of education.
Author Contributions
Methodology, software, visualization, writing—original draft, H.L.; conceptualization, supervision, funding acquisition, writing—review and editing, Z.L. All authors have read and agreed to the published version of the manuscript.
Funding
This study was mainly supported by the National Natural Science Foundation of China (Grant No. 62162061).
Data Availability Statement
The datasets used and analyzed in this study are available in full compliance with ethical procedures. All sensitive information has been anonymized, and the data are provided solely for academic and research purposes. The datasets, along with relevant documentation, can be accessed and downloaded from the following link: https://drive.google.com/drive/folders/1WrYE63f7GbuvVRV_ijgE7rDFZsFh68_V?usp=sharing (accessed on 18 August 2025). Researchers are encouraged to use these data to replicate and extend the findings of this work.
Acknowledgments
The authors would like to express their sincere gratitude to the Electronics journal for its support and consideration. We also thank the School of Computer Science and Technology at Xinjiang Normal University and the university’s Planning and Finance Office for providing essential support in data acquisition and management throughout this study. Their assistance was crucial for building the dataset used in this research. In addition, we are grateful to our colleagues and technical staff who offered valuable help during the system development and data preprocessing stages.
Conflicts of Interest
The authors declare no conflicts of interest.
References
- Mubarak, A.A.; Cao, H.; Zhang, W.; Zhang, W. Visual analytics of video-clickstream data and prediction of learners’ performance using deep learning models in MOOCs’ courses. Comput. Appl. Eng. Educ. 2021, 29, 710–732. [Google Scholar] [CrossRef]
- Guizani, S.; Mazhar, T.; Shahzad, T.; Ahmad, W.; Bibi, A.; Hamam, H. A systematic literature review to implement large language model in higher education: Issues and solutions. Discov. Educ. 2025, 4, 35. [Google Scholar] [CrossRef]
- Hong, M.; Xia, Y.; Wang, Z.; Zhu, J.; Wang, Y.; Cai, S.; Zhao, Z. EAGER-LLM: Enhancing large language models as recommenders through exogenous behavior-semantic integration. In Proceedings of the ACM on Web Conference 2025, Sydney, Australia, 28 April–2 May 2025; pp. 2754–2762. [Google Scholar] [CrossRef]
- Chen, J.; Liu, Z.; Huang, X.; Wu, C.; Liu, Q.; Jiang, G.; Pu, Y.; Lei, Y.; Chen, X.; Wang, X.; et al. When large language models meet personalization: Perspectives of challenges and opportunities. World Wide Web 2024, 27, 42. [Google Scholar] [CrossRef]
- Razafinirina, M.A.; Dimbisoa, W.G.; Mahatody, T. Pedagogical alignment of large language models (llm) for personalized learning: A survey, trends and challenges. J. Intell. Learn. Syst. Appl. 2024, 16, 448–480. [Google Scholar] [CrossRef]
- Chigbu, B.I.; Ngwevu, V.; Jojo, A. The effectiveness of innovative pedagogy in the industry 4.0: Educational ecosystem perspective. Soc. Sci. Humanit. Open 2023, 7, 100419. [Google Scholar] [CrossRef]
- Grivokostopoulou, F.; Perikos, I.; Hatzilygeroudis, I. Utilizing semantic web technologies and data mining techniques to analyze students learning and predict final performance. In Proceedings of the 2014 IEEE International Conference on Teaching, Assessment and Learning for Engineering (TALE), Wellington, New Zealand, 8–10 December 2014; IEEE: Piscataway, NJ, USA, 2014; pp. 488–494. [Google Scholar] [CrossRef]
- Andergassen, M.; Mödritscher, F.; Neumann, G. Practice and repetition during exam preparation in blended learning courses: Correlations with learning results. J. Learn. Anal. 2014, 1, 48–74. [Google Scholar] [CrossRef]
- Kalita, E.; Oyelere, S.S.; Gaftandzhieva, S.; Rajesh, K.N.V.P.S.; Jagatheesaperumal, S.K.; Mohamed, A.; Elbarawy, Y.M.; Desuky, A.S.; Hussain, S.; Cifci, M.A.; et al. Educational data mining: A 10-year review. Discov. Comput. 2025, 28, 81. [Google Scholar] [CrossRef]
- Hayat, A.; Martinez, H.; Khan, B.; Hasan, M.R. A Three-Tier LLM Framework for Forecasting Student Engagement from Qualitative Longitudinal Data. In Proceedings of the 29th Conference on Computational Natural Language Learning, Vienna, Austria, 31 July–1 August 2025; ACL: Stroudsburg, PA, USA, 2025; pp. 334–347. [Google Scholar] [CrossRef]
- Pal, S.; Chaurasia, D.V. Performance analysis of students consuming alcohol using data mining techniques. Int. J. Adv. Res. Sci. Eng. 2017, 6, 238–250. [Google Scholar]
- Li, Y.; Zhang, H.; Liu, S. Applying data mining techniques with data of campus card system. In IOP Conference Series: Materials Science and Engineering; IOP Publishing: Bristol, UK, 2020; Volume 715, p. 012021. [Google Scholar] [CrossRef]
- Durachman, Y.; Rahman, A.W.B. A Clustering Student Behavioral Patterns: A Data Mining Approach Using K-Means for Analyzing Study Hours, Attendance, and Tutoring Sessions in Educational Achievement. Artif. Intell. Learn. 2025, 1, 35–53. [Google Scholar] [CrossRef]
- Yao, Y.; Duan, J.; Xu, K.; Cai, Y.; Sun, Z.; Zhang, Y. A survey on large language model (llm) security and privacy: The good, the bad, and the ugly. High-Confid. Comput. 2024, 4, 100211. [Google Scholar] [CrossRef]
- Annepaka, Y.; Pakray, P. Large language models: A survey of their development, capabilities, and applications. Knowl. Inf. Syst. 2025, 67, 2967–3022. [Google Scholar] [CrossRef]
- Johnson, S.J.; Murty, M.R.; Navakanth, I. A detailed review on word embedding techniques with emphasis on word2vec. Multimed. Tools Appl. 2024, 83, 37979–38007. [Google Scholar] [CrossRef]
- Wang, J.; Huang, J.X.; Tu, X.; Wang, J.; Huang, A.J.; Laskar, M.T.R.; Bhuiyan, A. Utilizing BERT for Information Retrieval: Survey, Applications, Resources, and Challenges. ACM Comput. Surv. 2024, 56, 185. [Google Scholar] [CrossRef]
- Hou, S.; Shen, Z.; Zhao, A.; Liang, J.; Gui, Z.; Guan, X.; Li, R.; Wu, H. GeoCode-GPT: A large language model for geospatial code generation. Int. J. Appl. Earth Obs. Geoinf. 2025, 138, 104456. [Google Scholar] [CrossRef]
- Kalyan, K.S. A survey of GPT-3 family large language models including ChatGPT and GPT-4. Nat. Lang. Process. J. 2024, 6, 100048. [Google Scholar] [CrossRef]
- Jones, C.R.; Rathi, I.; Taylor, S.; Bergen, B.K. People cannot distinguish GPT-4 from a human in a Turing test. In Proceedings of the 2025 ACM Conference on Fairness, Accountability, and Transparency, Athens, Greece, 23–26 June 2025; pp. 1615–1639. [Google Scholar] [CrossRef]
- Song, Y.; Lv, C.; Zhu, K.; Qiu, X. LoRA fine-tuning of Llama3 large model for intelligent fishery field. Discov. Comput. 2025, 28, 135. [Google Scholar] [CrossRef]
- Le, H.; Zhang, Q.; Xu, G. A comparative study of six indigenous Chinese Large Language Models’ understanding ability: An assessment based on 132 college entrance examination objective test items. Res. Sq. 2025. [Google Scholar] [CrossRef]
- Vaswani, A.; Shazeer, N.; Parmar, N.; Uszkoreit, J.; Jones, L.; Gomez, A.N.; Kaiser, Ł.; Polosukhin, I. Attention is all you need. In Proceedings of the Advances in Neural Information Processing Systems (NeurIPS), Long Beach, CA, USA, 4–9 December 2017; Volume 30. [Google Scholar]
- Zheng, Z.; Wang, Y.; Huang, Y.; Song, S.; Yang, M.; Tang, B.; Xiong, F.; Li, Z. Attention heads of large language models. Patterns 2025, 6, 101176. [Google Scholar] [CrossRef] [PubMed]
- Zhao, A.; Huang, D.; Xu, Q.; Lin, M.; Liu, Y.J.; Huang, G. Expel: Llm agents are experiential learners. In Proceedings of the AAAI Conference on Artificial Intelligence, Vancouver, NA, Canada, 26–27 February 2024; Volume 38, pp. 19632–19642. [Google Scholar] [CrossRef]
- Mai, J.; Chen, J.; Qian, G.; Elhoseiny, M.; Ghanem, B. Llm as a robotic brain: Unifying egocentric memory and control. arXiv 2023, arXiv:2304.09349. [Google Scholar] [CrossRef]
- Fu, D.; Li, X.; Wen, L.; Dou, M.; Cai, P.; Shi, B.; Qiao, Y. Drive like a human: Rethinking autonomous driving with large language models. In Proceedings of the IEEE/CVF Winter Conference on Applications of Computer Vision (WACV), Waikoloa, HI, USA, 1–6 January 2024; pp. 910–919. [Google Scholar] [CrossRef]
- Topsakal, O.; Akinci, T.C. Creating large language model applications utilizing langchain: A primer on developing llm apps fast. In Proceedings of the International Conference on Applied Engineering and Natural Sciences, Konya, Turkey, 10–12 July 2023; Volume 1, pp. 1050–1056. [Google Scholar] [CrossRef]
- Liu, J.; Ong, G.P.; Chen, X. GraphSAGE-based traffic speed forecasting for segment network with sparse data. IEEE Trans. Intell. Transp. Syst. 2020, 23, 1755–1766. [Google Scholar] [CrossRef]
- Liu, X.; Zhang, Y. Design and implementation of vehicle type recognition system based on language large model. In Proceedings of the 2024 6th International Conference on Internet of Things, Automation and Artificial Intelligence (IoTAAI), Guangzhou, China, 26–28 July 2024; IEEE: Piscataway, NJ, USA, 2024; pp. 372–375. [Google Scholar] [CrossRef]
Disclaimer/Publisher’s Note: The statements, opinions and data contained in all publications are solely those of the individual author(s) and contributor(s) and not of MDPI and/or the editor(s). MDPI and/or the editor(s) disclaim responsibility for any injury to people or property resulting from any ideas, methods, instructions or products referred to in the content. |
© 2025 by the authors. Licensee MDPI, Basel, Switzerland. This article is an open access article distributed under the terms and conditions of the Creative Commons Attribution (CC BY) license (https://creativecommons.org/licenses/by/4.0/).