Article

A Structure-Aware and Condition-Constrained Algorithm for Text Recognition in Power Cabinets

1
State Grid Heilongjiang Electric Power Company Limited, Harbin 150009, China
2
Graduate School, Shenyang Ligong University, Shenyang 110159, China
*
Author to whom correspondence should be addressed.
Electronics 2025, 14(16), 3315; https://doi.org/10.3390/electronics14163315
Submission received: 18 July 2025 / Revised: 17 August 2025 / Accepted: 18 August 2025 / Published: 20 August 2025
(This article belongs to the Section Artificial Intelligence)

Abstract

Power cabinet OCR enables real-time grid monitoring but faces challenges absent in generic text recognition: 7.5:1 scale variation between labels and readings, tabular layouts with semantic dependencies, and electrical constraints (220 V ± 10%). We propose SACC (Structure-Aware and Condition-Constrained), an end-to-end framework integrating structural perception with domain constraints. SACC comprises (1) MAF-Detector with adaptive dilated convolutions ( r { 1 , 3 , 5 } ) for multi-scale text; (2) SA-ViT, combining Vision Transformer with GCN for tabular structure modeling; and (3) DCDecoder, enforcing real-time electrical constraints during decoding. Extensive experiments demonstrate SACC’s effectiveness: achieving 86.5%, 88.3%, and 83.4% character accuracy on PCSTD, YUVA EB, and ICDAR 2015 datasets, respectively, with consistent improvements over leading methods. Ablation studies confirm synergistic improvements: MAF-Detector increases recall by 12.3SACC provides a field-deployable solution achieving 30.3 ms inference on RTX 3090. The co-design of structural analysis with differentiable constraints establishes a framework for domain-specific OCR in industrial and medical applications.

1. Introduction

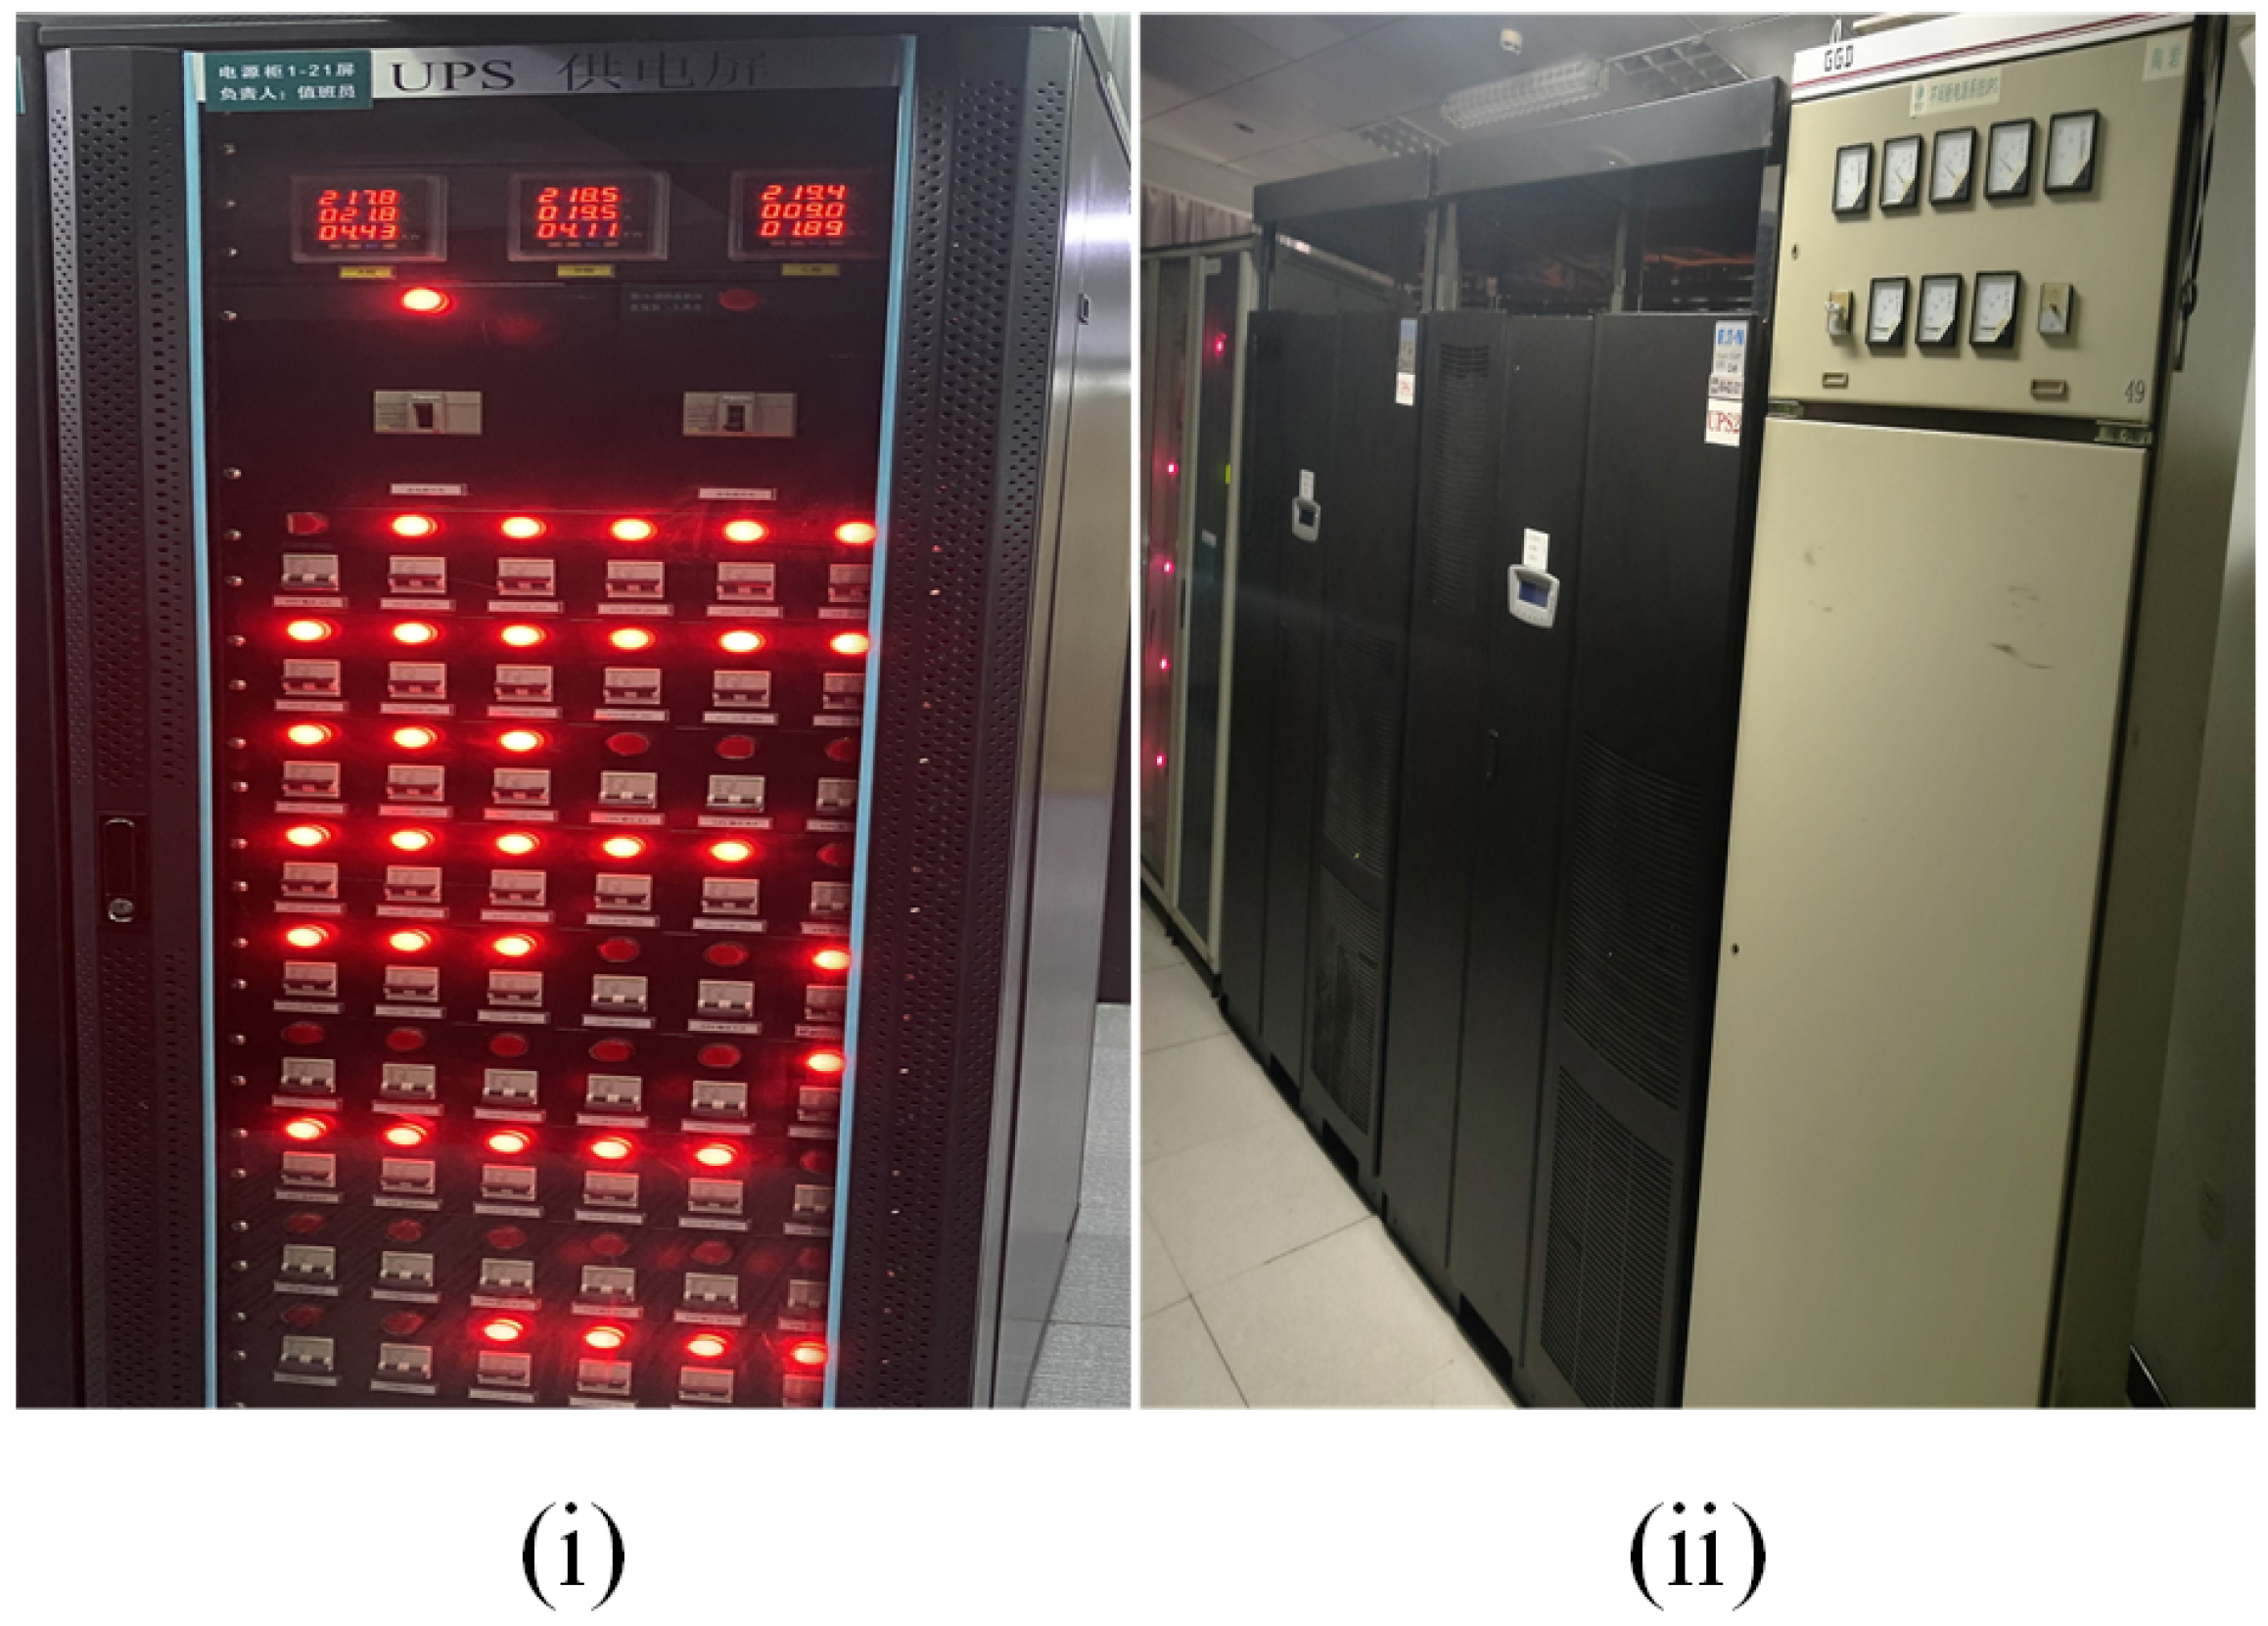
Power systems require real-time monitoring for intelligent O&M [1,2,3,4,5]. The complexity of modern power system monitoring is further compounded by the need for accurate measurement error detection [6] and the integration of cloud-based condition monitoring for advanced power electronics [7]. Power cabinets display operational parameters (voltage, current, power; Figure 1(i)) and equipment status (labels, alarm codes; Figure 1(ii)) on LCD/LED screens for system monitoring [8,9]. Manual inspection yields 40% error rates and 2 h delays versus automated requirements [10]. Industrial OCR improves data acquisition accuracy by 40% [11]. Automated OCR for power cabinet screens thus drives power industry digitalization [11,12,13].
Power cabinet STR faces three core challenges:
(1) Extreme Text Scale Differences: Power cabinet screens often simultaneously display large-scale titles or labels (e.g., character height > 50 pixels) and small-scale, high-density numerical text (e.g., character height < 10 pixels), as shown in Figure 1(ii). This corresponds to a scale variation ratio of 7.5:1 (derived from the observed 60 px vs. 8 px character heights in our corpus), which exceeds the typical 2:1 ratio handled by conventional multi-scale detection methods by 3.75×. FPN-based methods [14,15] fail at this scale ratio: large receptive fields blur small text [16], while small fields miss large text boundaries [17]. Oblique viewing angles (±15–30°) add perspective distortion.
(2) Structured Text Layout and Semantic Correlation: Power parameters are typically presented in a tabular format (Figure 1(i)), where text within the same row or column (e.g., a parameter label and its corresponding value) shares a clear spatial and semantic relationship. Unlike conventional document OCR that processes isolated text regions, power cabinet displays require understanding of the inherent row–column relationships and semantic dependencies between spatially adjacent elements. CRNN and Transformer models treat text as sequences, ignoring 2D layout [18,19]. This causes value confusion (8 vs. B) and label misassignment (current read as voltage). ViT’s position encodings fail to capture row–column logic [20].
(3) Domain-Specific Knowledge Constraints: Text in the power domain adheres to strict physical laws and industry standards [21]. For instance, certain parameters (e.g., AC voltage) have defined numerical ranges (typically 180 V–250 V) and involve numerous standardized technical terms (e.g., “screen,” “cabinet,” “transformer,” “circuit breaker”) [22]. Recent studies in power system automation have identified that up to 15% of OCR errors in industrial settings involve physically impossible parameter values, which can trigger false alarms or mask genuine equipment faults. Generic OCR lacks constraint enforcement [23], producing impossible values (3000 V in 220 V systems) that risk grid safety [24].
We developed a specialized recognition algorithm for power cabinet environments where generic STR methods fail.
We propose SACC, an end-to-end framework integrating structural awareness with conditional constraints, for power cabinet text recognition. To directly address the critical need for comparison with structured document analysis methods raised by reviewers, this work presents comprehensive experimental evaluations against leading approaches, including docTR’s modular framework [25] and LayoutLMv3’s pre-trained multimodal Transformer [26]. Unlike existing methods that focus on general document understanding, our approach specifically addresses three key differentiating factors in industrial monitoring environments: (1) extreme scale variation handling (7.5:1 ratio vs. typical 2:1), (2) real-time constraint enforcement during decoding rather than post-processing validation, and (3) dynamic parameter display adaptation vs. static document layouts. While GCN-based structural modeling has been explored in medical OCR for anatomical measurements [27], our application differs fundamentally: (1) power cabinets present rigid tabular structures with discrete values rather than continuous anatomical contours; (2) our constraints enforce electrical engineering laws (e.g., 220 V ± 10%) rather than statistical ranges (e.g., 0–90° angles); and (3) the safety-critical nature of power monitoring demands real-time constraint enforcement to prevent equipment damage, unlike post hoc validation in medical diagnosis.
Our contributions are as follows:
  • MAF-Detector: Adaptive fusion of dilated convolutions ( r { 1 , 3 , 5 } ) with learnable weights. Unlike traditional FPN-based detectors that use fixed feature fusion strategies, our MAF-Detector employs learnable fusion weights that dynamically adapt to handle scale variations exceeding 5:1 ratios. Combined with rectangular bounding box prediction, it handles 7.5:1 scale variation and ±30° perspective distortion.
  • SA-ViT: GCN-enhanced Vision Transformer modeling tabular relationships. Distinct from standard 2D relative bias techniques that only consider positional relationships, our mixed position encoding captures both visual and structural semantics through graph-based spatial reasoning. Mixed position encoding reduces label-value confusion by 8.1%.
  • DCDecoder: Differentiable constraint enforcement during decoding with 1847 domain terms and electrical bounds. Unlike conventional constrained beam search or finite-state lexicon approaches that apply constraints post hoc, our DCDecoder performs real-time constraint enforcement during the decoding process through differentiable soft constraints. Real-time correction reduces constraint violations by 87%.
  • Experiments on three benchmarks validate each component. Extensive evaluations against representative methods across three diverse benchmarks demonstrate consistent state-of-the-art performance, particularly excelling on challenging industrial display recognition tasks, achieving 82.1% accuracy under extreme lighting (50 lux).

2. Related Works

Text in images is analyzed via detection and recognition stages. We review scene text methods, structured document analysis, and industrial OCR.

2.1. Scene Text Detection

Text detection locates text instances via regression or segmentation [28].
Regression methods predict text boundaries directly. Anchor-based approaches fail on curved text [29], motivating coordinate regression. TextSnake [30] models text as centerline plus disks but requires complex post-processing. CRAFT [31] connects characters via affinity but fails on dense power cabinet displays where spacing < 3 pixels causes line merging. TextDCT [32] efficiently represents text masks by using discrete cosine transform (DCT).
Recent work explores compact contours: FCENet [33] uses Fourier coefficients but struggles with seven-segment displays’ rigid angles. PCR [34] iteratively refines polygon vertices—accurate but computationally expensive. TextBPN [35] uses graph networks for boundary grouping—robust but slower than single-stage methods.
Segmentation methods classify pixels as text/non-text, handling irregular shapes [36]. PSENet [37] uses multi-scale kernels with progressive expansion—separates dense text but processes slowly. DBNet [38] embeds differentiable binarization for speed but fails under power cabinet reflections and moiré patterns where fixed thresholds miss 8-pixel text.
Existing detectors rely on FPN for multi-scale fusion. FPN’s fixed top–down pathway fails at 7.5:1 scale ratios—deep semantic features overwhelm shallow details needed for 8-pixel text [39]. MAF-Detector provides adaptive fusion to address this.

2.2. Scene Text Recognition

Text recognition decodes pixels to characters via AR or NAR architectures [40].
AR methods predict characters sequentially using attention [41]. SAR [42] uses 2D attention; ASTER [43] applies TPS rectification. NRTR [44] uses pure Transformers; PARSeq [45] adds permuted training for robustness.
NAR methods decode in parallel for speed [46]. CRNN [18] uses CTC for speed but assumes independence, which confuses 8/B in power displays. ABINet [47] adds language refinement but lacks power domain constraints.
Existing models fail in power cabinets due to (1) structural blindness (treating tabular layouts as sequences causes label-value errors) and (2) domain ignorance (lacking electrical constraints produces impossible values). Post hoc constraint methods miss decoding-time optimization.
Structured Document Analysis and Industrial OCR
Medical vs. Industrial OCR: Recent advances in medical OCR have employed attention mechanisms and GCN for structural understanding [27], focusing on continuous anatomical measurements with statistical constraints. However, industrial OCR faces fundamentally different challenges: discrete value recognition within rigid engineering tolerances, real-time safety requirements, and extreme scale variations (7.5:1 in power cabinets vs. 2:1 in medical imaging). While medical OCR optimizes for diagnostic accuracy with soft constraints, industrial applications require hard constraint enforcement to prevent catastrophic failures.
Structured document analysis emphasizes layout understanding. Mindee et al. develop docTR [25], a modular OCR framework that enables a flexible combination of detection algorithms (DBNet, LinkNet, FAST) with recognition architectures (CRNN, ViTSTR, PARSeq) through a unified API similar to MMDetection, providing production-ready capabilities with an extensive pre-trained model zoo across diverse document formats. docTR demonstrates effectiveness in general document processing through its two-stage detection–recognition pipeline with configurable model combinations. However, docTR’s generic framework design lacks specialized mechanisms for handling domain-specific constraints and extreme scale variations exceeding 5:1 ratios characteristic of industrial monitoring environments, where physically impossible parameter values must be actively prevented. Huang et al. propose LayoutLMv3 [26], a multimodal pre-trained Transformer that jointly models text, layout, and visual information through unified text–image masking and word-patch alignment objectives trained on 11 million document images, achieving remarkable performance through sophisticated cross-modal attention mechanisms and spatial-aware encoding strategies. Nevertheless, LayoutLMv3’s reliance on pre-trained representations optimized for general document understanding limits its effectiveness in specialized industrial scenarios where dynamic parameter displays and domain-specific numerical constraints require tailored architectural adaptations beyond conventional fine-tuning approaches. These methods target static documents, not dynamic industrial displays with 7.5:1 scale variations.
Industrial OCR targets specific equipment but lacks multi-scale capabilities for diverse power cabinets.
Additionally, computer vision advances multi-scale recognition. LS-MambaNet [48] recently demonstrated the effectiveness of combining large strip convolutions with Mamba networks for handling extreme scale variations in remote sensing imagery, achieving state-of-the-art performance on DOTA-v1.0 and HRSC2016 datasets. While targeting object detection rather than text recognition, their systematic multi-dataset validation methodology and adaptive multi-scale fusion strategy inspired our approach to handling the 7.5:1 scale variation challenge in power cabinet text recognition. These target natural scenes, not structured power monitoring.
Moreover, power monitoring differs from document OCR in terms of real-time updates, electrical constraints (220 V ± 10%), and safety-critical accuracy. Specialized OCR must handle both technical complexity and safety requirements.

2.3. Power System Monitoring and Measurement

Recent advances in power system monitoring have focused on improving measurement accuracy and real-time data acquisition capabilities. Li et al. [6] proposed an online measurement error detection method for electronic Transformers in smart grids, addressing the critical challenge of long-term stability in electronic Transformer measurements. Their approach utilizes variational mode decomposition combined with weighted principal component analysis to evaluate metering errors without requiring standard Transformers, demonstrating significant improvements in detecting measurement anomalies in real-time grid operations. In the domain of power converter monitoring, Ahmed et al. [7] addressed the challenges in drain-source resistance ( R d s , o n ) measurement for cloud-connected condition monitoring in Wide Band Gap (WBG) power converter applications. Their work presents a practical solution leveraging cloud computing for the reliability assessment of a real-world WBG-based power electronic converter, highlighting the importance of integrating IoT connectivity with advanced semiconductor monitoring techniques. Furthermore, Zhang et al. [49] developed a predictive model for voltage Transformer ratio error considering load variations, employing a deep learning framework that integrates Bidirectional Temporal Convolutional Networks with Multi-Head Attention mechanisms. This approach demonstrates the growing trend of applying advanced AI techniques to power system measurement challenges, achieving significant improvements in prediction accuracy under varying load conditions. These developments in power system monitoring provide important context for our work, as accurate text recognition from power cabinet displays represents a complementary approach to traditional sensor-based monitoring, enabling comprehensive data acquisition from legacy equipment that may lack modern communication interfaces.

3. Methodology

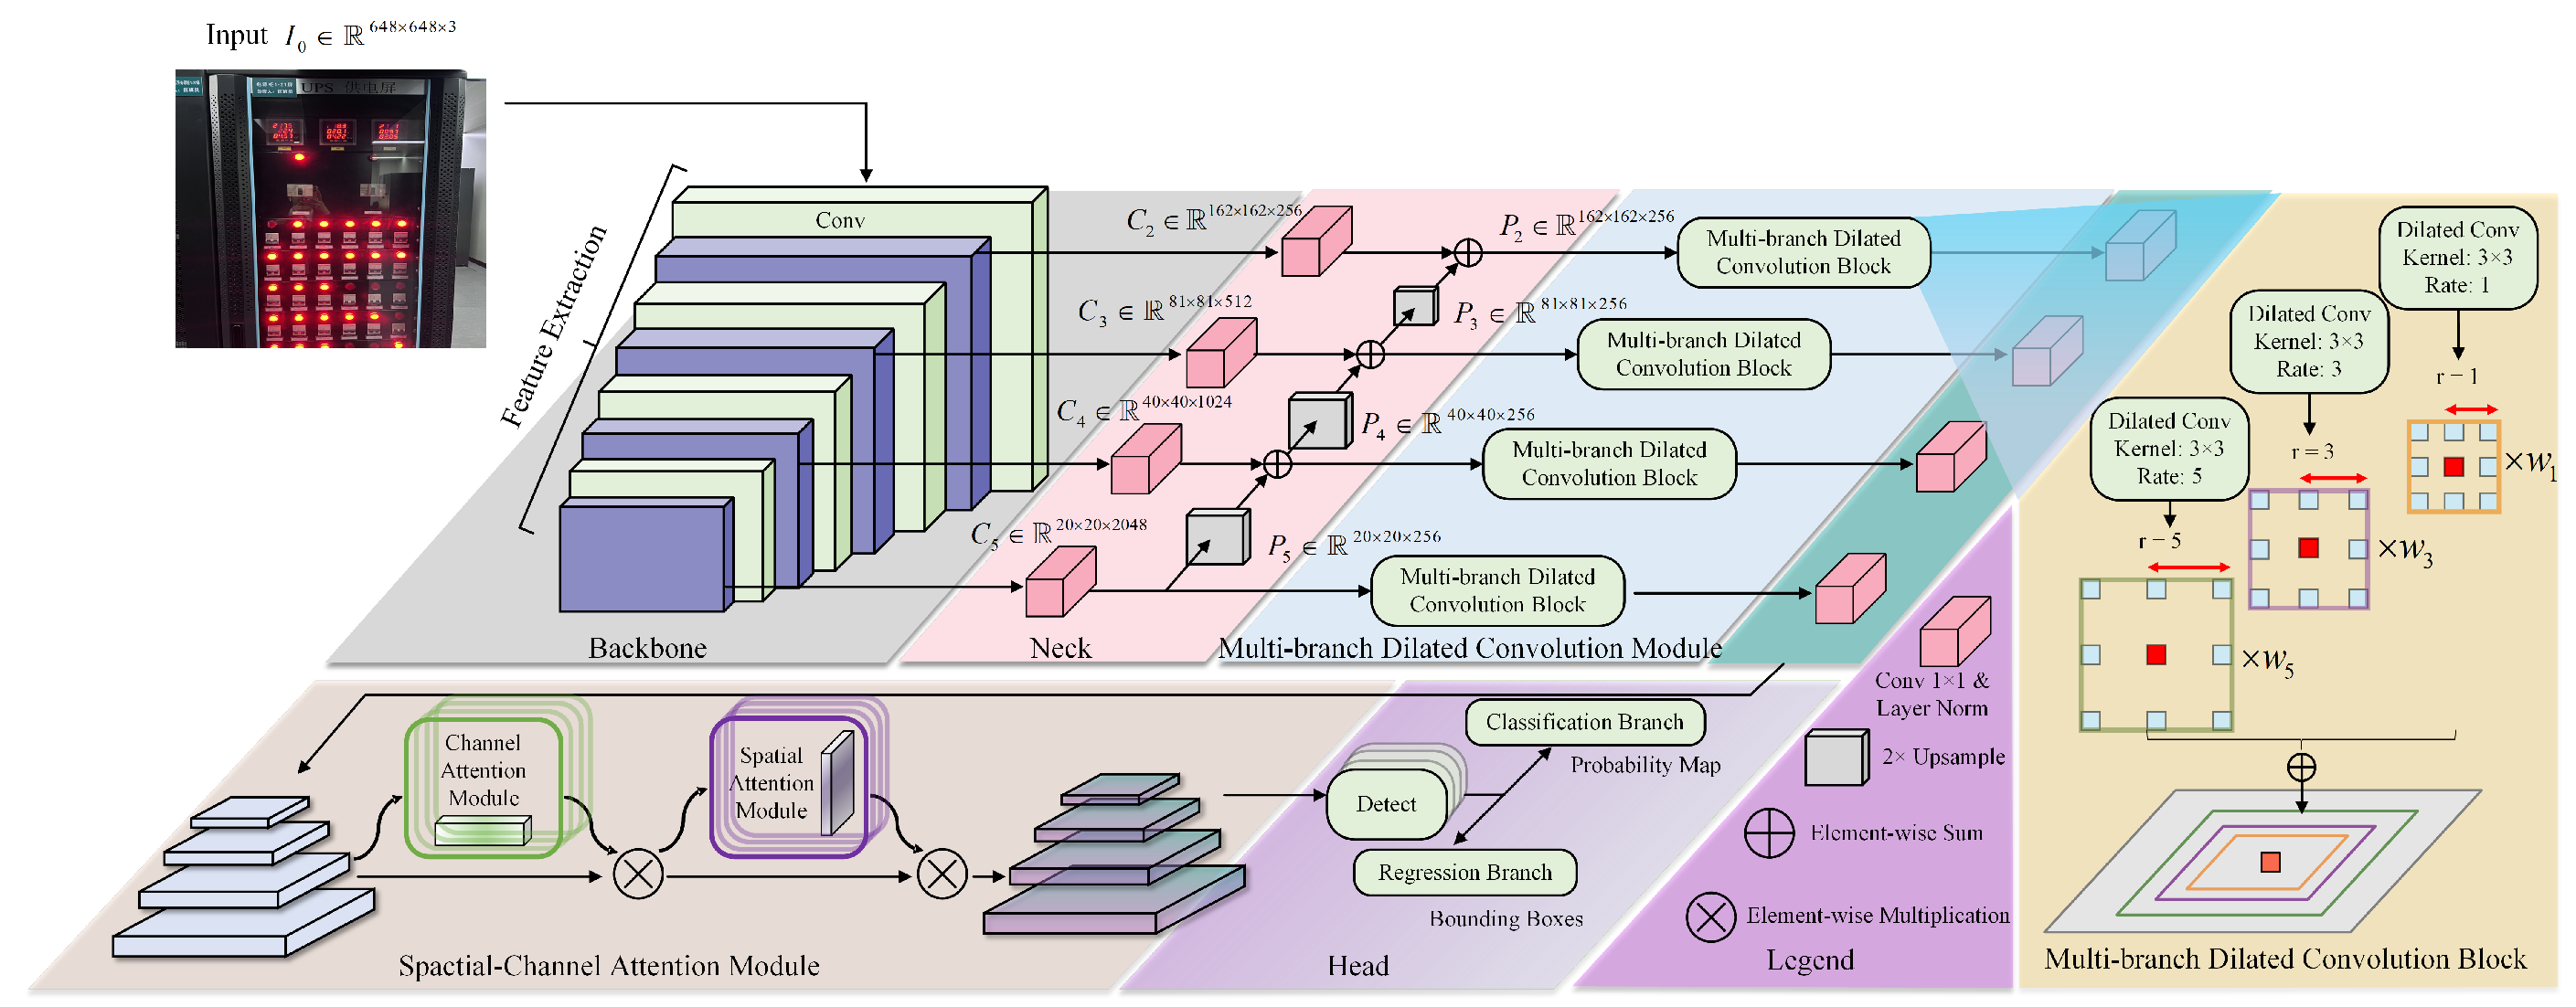
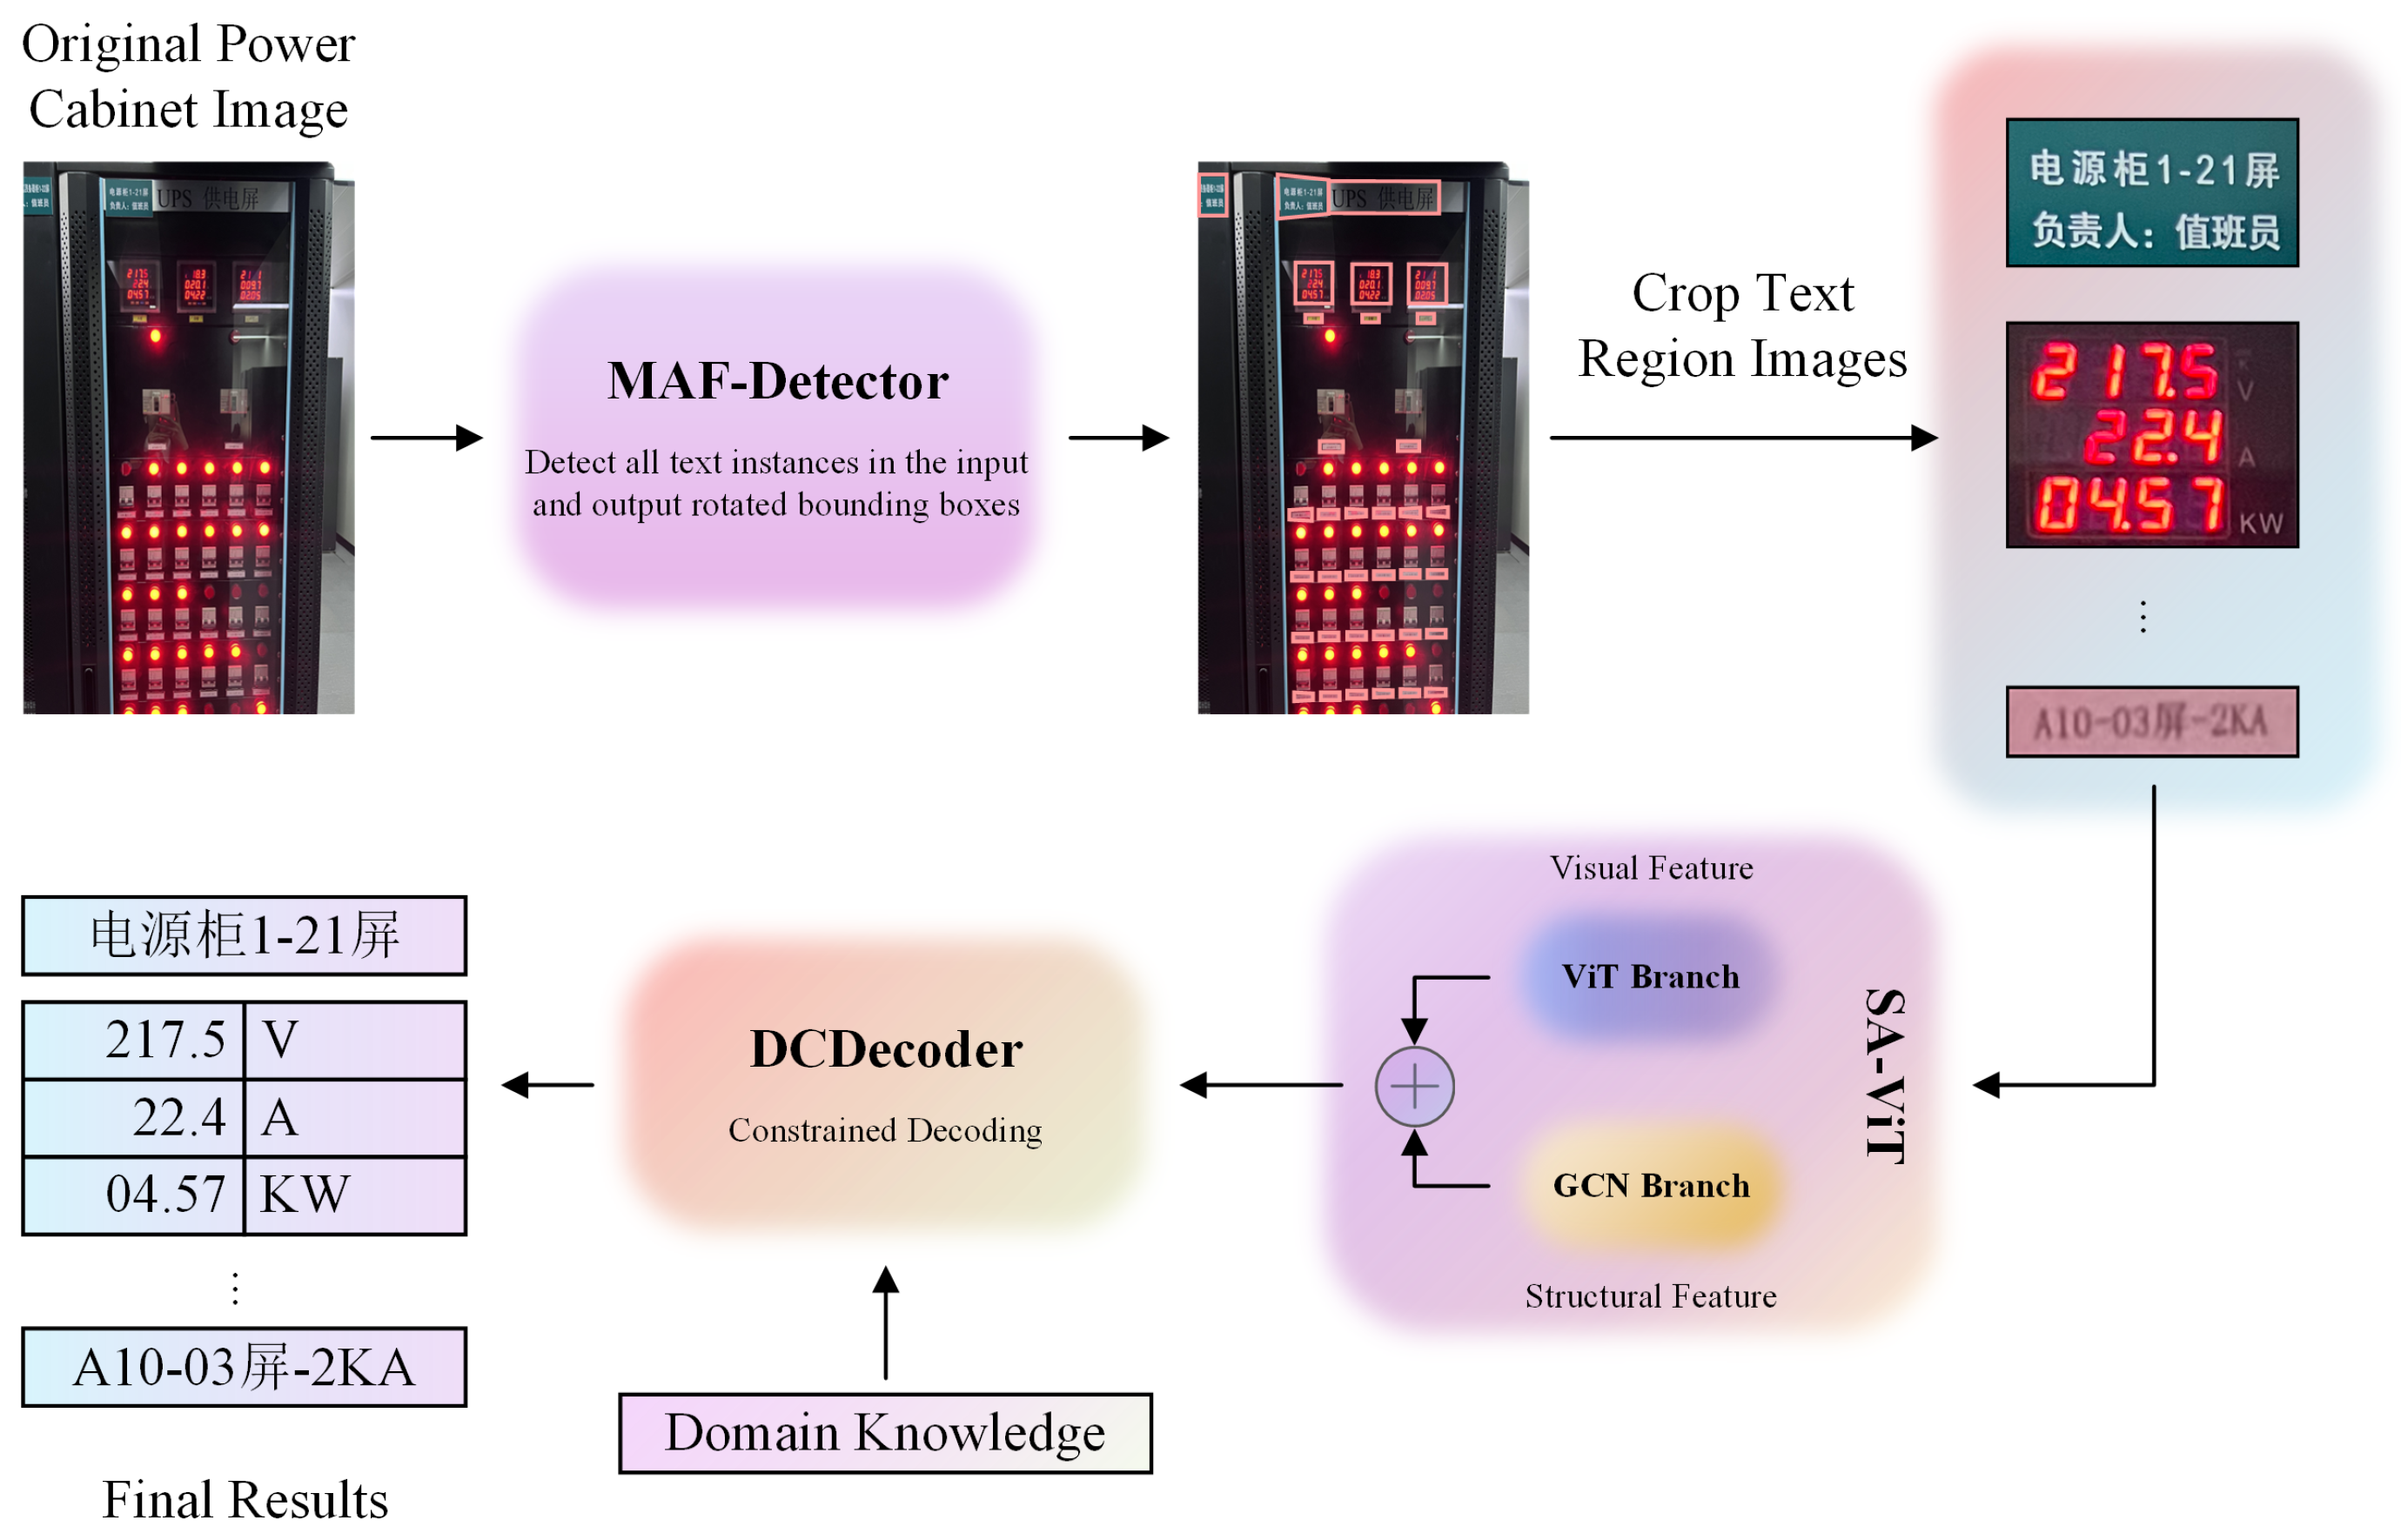
Figure 2 shows SACC’s architecture: MAF-Detector, SA-ViT, and DCDecoder.

3.1. Multi-Scale Adaptive Fusion Detector

MAF-Detector handles 7.5:1 scale variations and ±30° viewing angles. It augments FPN with parallel dilated convolutions, channel–spatial attention, and quadrilateral regression (Figure 3).
MAF-Detector augments each FPN level P i with dilated convolutions at rates r { 1 , 3 , 5 } , expanding receptive fields without resolution loss. Unlike medical imaging, where scale variations are gradual within anatomical structures [27], power cabinets exhibit abrupt scale jumps of 7.5:1 between adjacent elements. Our key innovation lies in the adaptive fusion mechanism that learns optimal combination weights for different dilation rates based on the input characteristics. The outputs from each branch are then adaptively fused using a set of learnable weights, w r , to integrate multi-scale contextual information:
F d i l a t e d i = r { 1 , 3 , 5 } w r · Conv r ( P i ) , s . t . r { 1 , 3 , 5 } w r = 1
where Conv r denotes a convolution with dilation rate r, and  w r is a learnable weight. The dilation rates { 1 , 3 , 5 } are selected to capture multi-frequency features: r = 1 for high-frequency details (small text), r = 3 for mid-frequency patterns, and  r = 5 for low-frequency context (large text). The fusion weights are learned via a lightweight attention mechanism:
w = Softmax ( FC 2 ( ReLU ( FC 1 ( GAP ( P i ) ) ) ) )
where GAP denotes global average pooling, FC1: R C R C / 16 and FC2: R C / 16 R 3 are fully connected layers, and  w = [ w 1 , w 3 , w 5 ] T . The weights are initialized using Xavier initialization and are optimized end-to-end with the detection loss L d e t via Adam ( β 1 = 0.9 , β 2 = 0.999 , l r = 10 4 ) with L2 regularization ( λ = 0.001 ). The learned weights exhibit strong correlation with text scales: small texts activate w 1 (mean 0.52), while large texts favor w 5 (mean 0.46).
Channel–spatial attention focuses on text regions in F d i l a t e d i . Channel attention aggregates via pooling and MLP to generate weights M c R C × 1 × 1 :
M c ( F ) = σ ( MLP ( AvgPool ( F ) ) + MLP ( MaxPool ( F ) ) )
where σ is the sigmoid activation function.
Spatial attention identifies key locations after channel refinement F = M c ( F ) F . Pooled features pass through 7 × 7 convolution, yielding M s R 1 × H × W :
M s ( F ) = σ ( Conv 7 × 7 ( [ AvgPool ( F ) ; MaxPool ( F ) ] ) )
Quadrilateral regression handles perspective distortion. For anchor ( x a , y a , w a , h a ) , we predict 8D offsets Δ v to four vertices:
x k p r e d = x a + w a · Δ x k
y k p r e d = y a + h a · Δ y k
where ( x k p r e d , y k p r e d ) are the absolute coordinates of the k-th vertex, and  ( Δ x k , Δ y k ) are the predicted offsets normalized by the anchor’s size.

3.2. Structure-Aware Vision Transformer

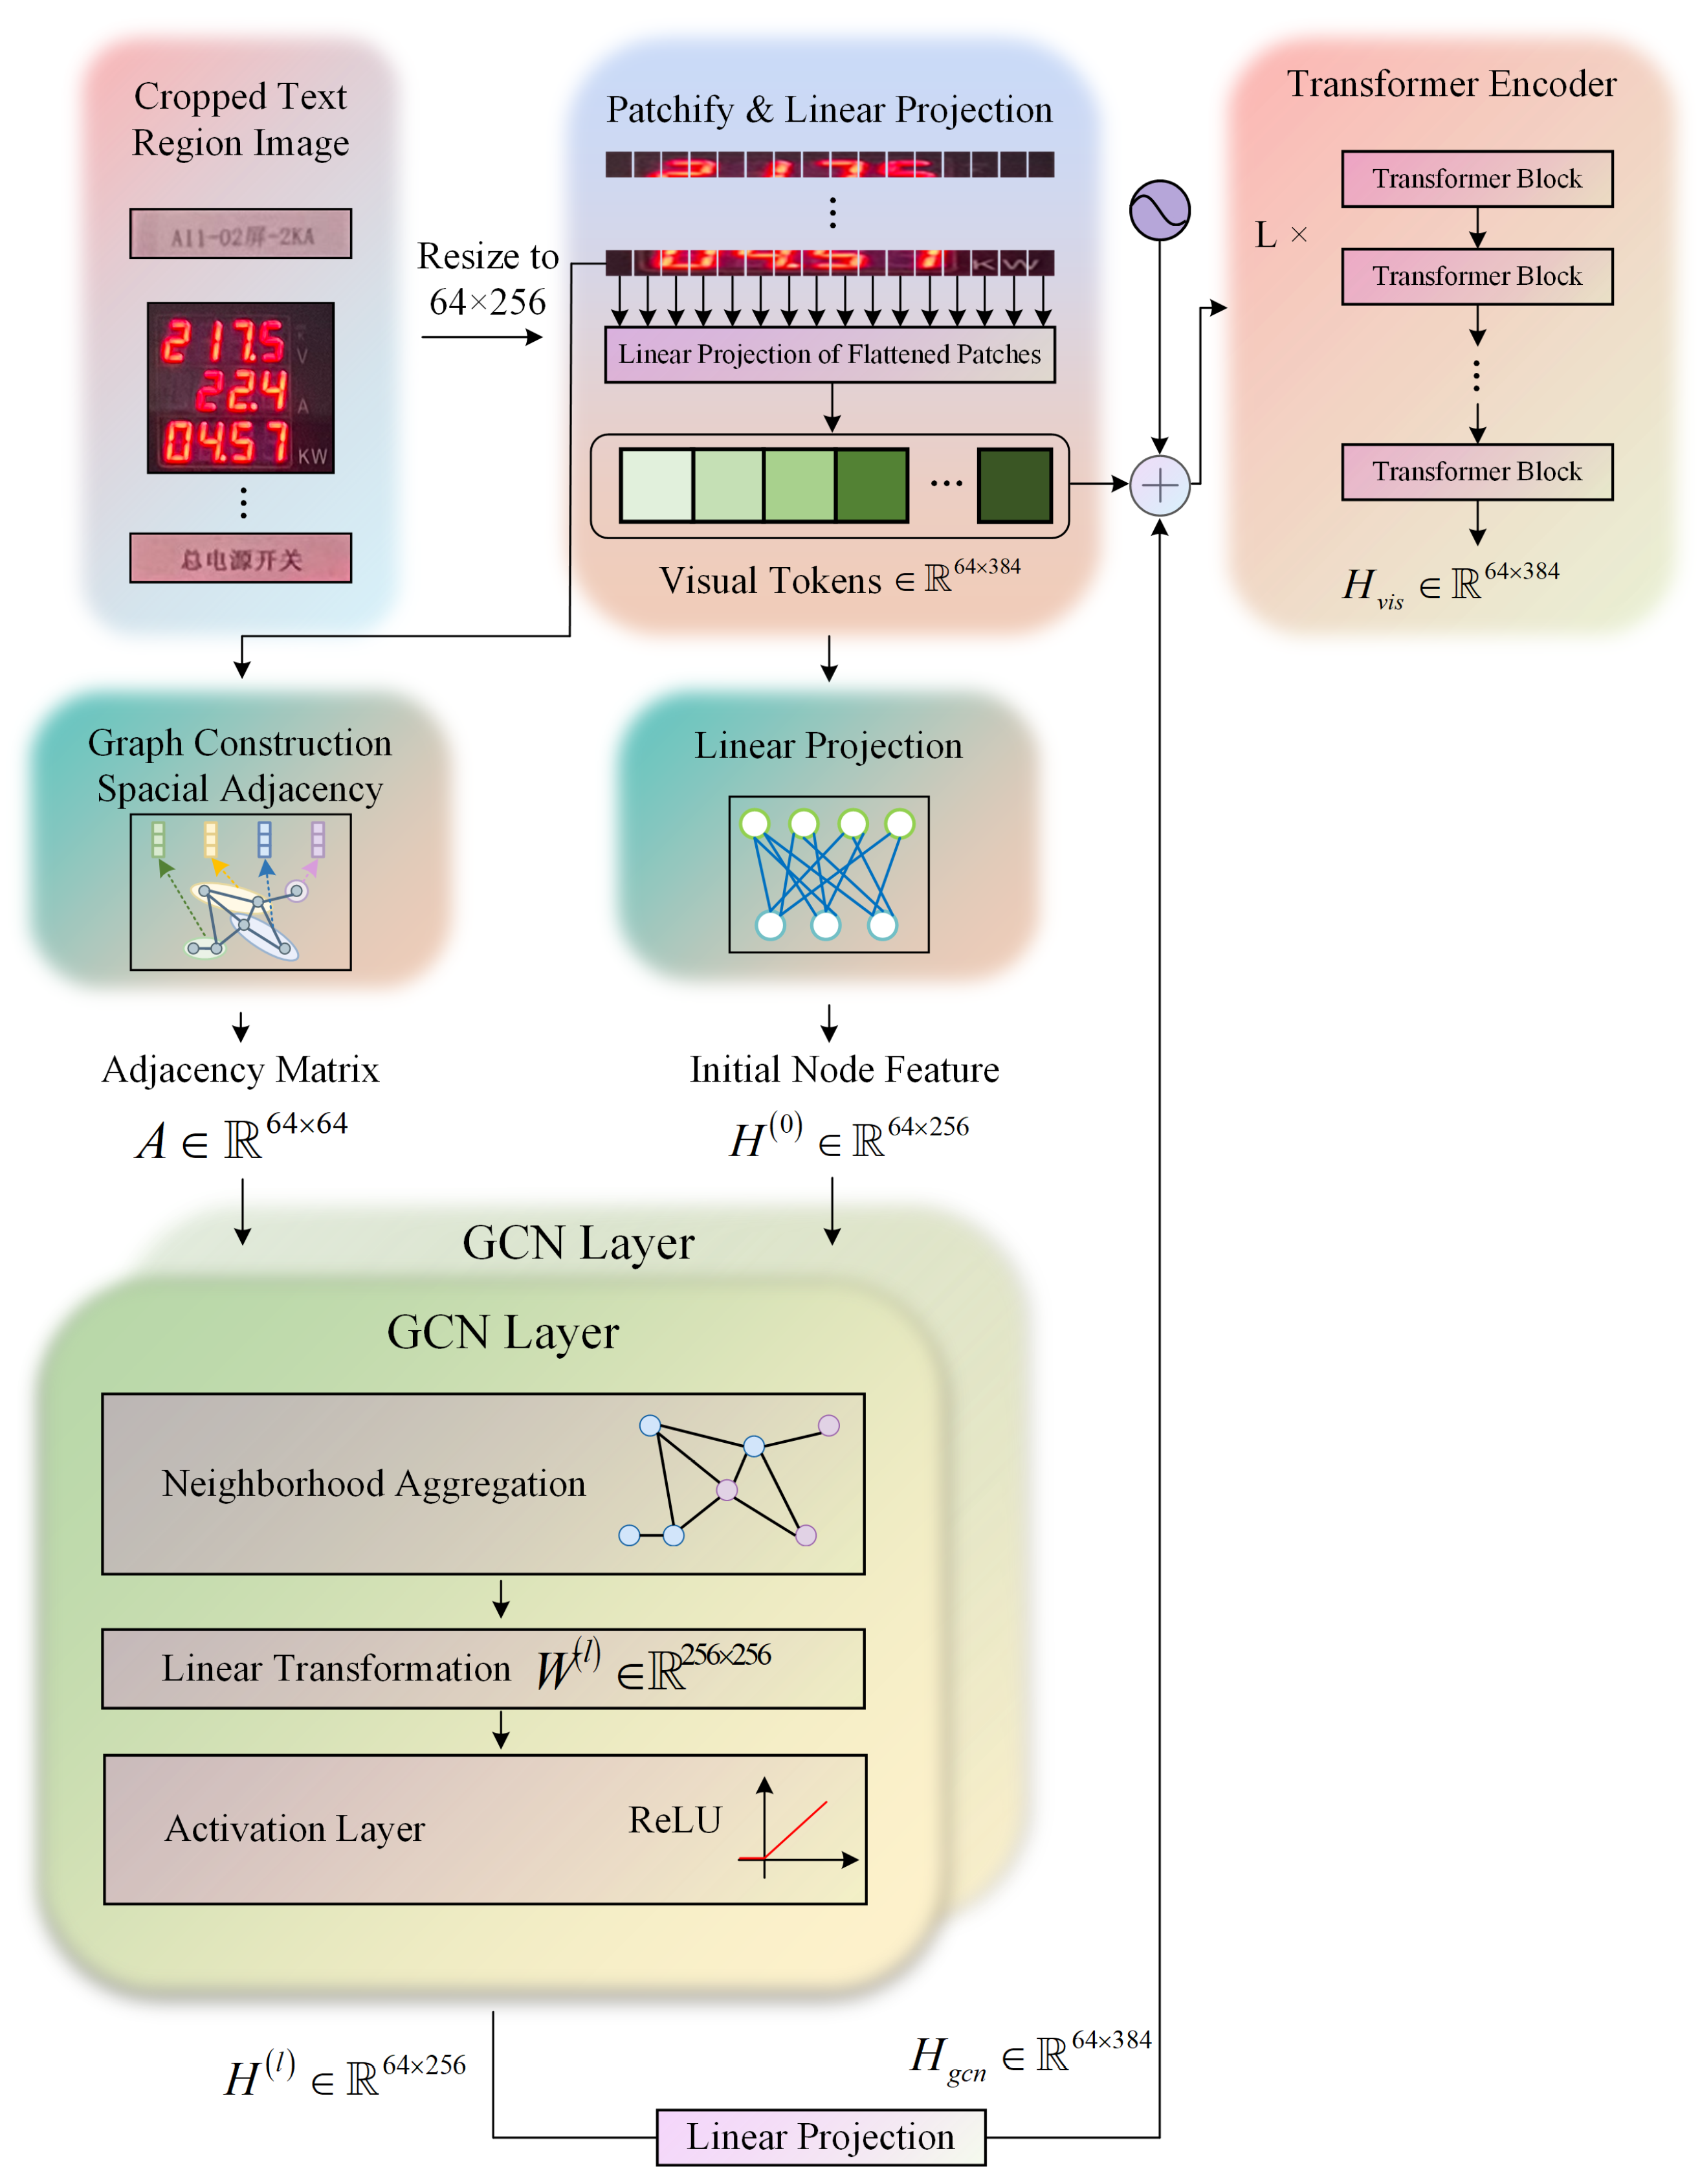
Power cabinet text follows tabular layouts linking labels to values. Sequence models miss this 2D structure. SA-ViT integrates GCN to model spatial relationships (Figure 4).
Text images divide into patches as graph nodes v V . To capture the complex tabular structure beyond simple spatial adjacency, we employ an adaptive graph construction strategy that considers both geometric proximity and semantic relevance. Unlike conventional 8-connected neighborhood approaches that may inadequately represent irregular table layouts, our method uses a two-stage graph construction process:
Stage 1: Semantic-aware Edge Construction We first compute semantic similarity between patches using their visual features: S i j = cos ine ( ϕ ( p i ) , ϕ ( p j ) ) , where ϕ ( · ) represents the visual feature extraction function. An edge is established if patches satisfy both spatial proximity ( dist ( p i , p j ) < τ s p a t i a l ) and semantic coherence ( S i j > τ s e m a n t i c ) criteria.
Stage 2: Adaptive Adjacency Weighting The adjacency matrix A incorporates learnable weights that adapt to different table layouts:
A i j = w i j · exp ( γ · dist ( p i , p j ) ) if edge criteria met 0 otherwise
where w i j is a learnable attention weight and γ controls the spatial decay rate. This enables the model to automatically adjust graph connectivity based on the specific tabular structure of power cabinet displays.
Differentiation from Existing Spatial Encoding: Unlike conventional 2D relative bias techniques that apply fixed positional offsets, or LayoutLMv3’s spatial-aware attention that relies on pre-computed bounding box features, our adaptive graph construction strategy dynamically models semantic relationships through learnable edge weights. Specifically, while 2D relative bias methods use static relative positions, our approach computes A i j = w i j · exp ( γ · d ( p i , p j ) ) · S i j , where w i j adapts to content similarity and S i j captures semantic coherence beyond geometric proximity, enabling handling of irregular table layouts and dynamic parameter arrangements characteristic of power cabinet displays.
L-layer GCN aggregates neighbor information:
H ( l + 1 ) = ReLU ( D ^ 1 2 A ^ D ^ 1 2 H ( l ) W ( l ) )
H ( l ) R N × d l contains node features. A ^ = A + I N adds self-loops, D ^ i i = j A ^ i j is the degree, and W ( l ) transforms dimensions.
SA-ViT fuses the GCN structure with ViT visuals via mixed encoding:
P E m i x e d ( i ) = P E v i s u a l ( i ) + W p r o j · H g c n ( i )
where H g c n ( i ) is the GCN structural vector for the i-th token and W p r o j is a linear layer for dimension matching.
Cross-modal attention combines ViT ( H v i s ) and GCN ( H g c n ) features:
K = [ W K v i s · H v i s ; W K g c n · H g c n ]
V = [ W V v i s · H v i s ; W V g c n · H g c n ]
where [ ; ] denotes concatenation, and the W matrices are learnable projection matrices. The context vector is then computed as
Attention ( Q , K , V ) = softmax Q K T d k V

3.3. Dynamic Constraint Decoder

Power text follows strict constraints: voltage ranges (220 V ± 10%) and 1847 technical terms. Generic OCR produces impossible values. The DCDecoder module integrates this domain knowledge into the decoding process through a novel three-tier constraint enforcement mechanism: real-time parameter validation, dynamic constraint adaptation, and fail-safe fallback strategies. DCDecoder enforces constraints during decoding, not post hoc.
For AC voltage [ v m i n , v m a x ] , we adjust generation probability via differentiable sigmoid:
P c o n s t r a i n e d ( v ) = P o r i g i n a l ( v ) · σ ( β · ( v v m i n ) ) · σ ( β · ( v m a x v ) ) + ϵ
where P o r i g i n a l ( v ) is the unconstrained probability, and β = 5 controls the
Real-time vs. Post hoc Constraint Enforcement: Traditional constrained beam search approaches apply domain constraints after initial decoding through post-processing validation: y ^ = arg max y C P ( y | x ) , where C represents valid constraint space. In contrast, our DCDecoder integrates constraints during the decoding process through differentiable soft penalties as formulated above. This real-time enforcement prevents accumulation of constraint violations and enables confidence-aware correction, crucial for power domain applications where physically impossible values (e.g., voltages exceeding 400 V in 220 V systems) must be detected immediately rather than flagged post facto.
Boundary Handling and Fail-safe Mechanisms: When the decoded value significantly exceeds predefined constraints (beyond 2 σ of the valid range), the DCDecoder employs a three-stage recovery process: (1) Immediate rejection: The current decoding path is terminated and alternative character sequences are explored. (2) Context-aware correction: Historical readings and adjacent parameter values are used to infer plausible corrections. (3) Conservative fallback: If constraint satisfaction fails, the system outputs a confidence-weighted result with explicit uncertainty markers for manual verification.
Dynamic Constraint Adaptation: The constraint boundaries are dynamically adjusted based on equipment type and operational context. For instance, during maintenance mode, voltage ranges may be temporarily expanded to accommodate testing procedures. The adaptation mechanism uses a rule-based system with equipment-specific configuration files:
v m i n a d a p t e d = v m i n × ( 1 α · MaintenanceFlag )
v m a x a d a p t e d = v m a x × ( 1 + α · MaintenanceFlag )
where α = 0.15 represents the allowable deviation factor during maintenance operations.
The technical terms (1847 entries) are stored in Trie T for prefix matching. Function M ( s , T ) validates the following candidates:
M ( s , T ) = 1 , if s is a prefix or a complete word in Trie T 0 , otherwise
Lexicon and Constraint Transparency: To enhance reproducibility while respecting confidentiality, we summarize the technical lexicon and numeric constraints used by the DCDecoder at a category level. The lexicon comprises 1847 entries, distributed across equipment labels (520), parameter names (680), status indicators (410), and alarm codes (237). Numeric ranges follow industry practice: DC voltage [12, 48] V; single-phase AC voltage [200, 240] V; three-phase AC voltage [380, 420] V; current [0, 100] A; power [0, 50] kW; and frequency [49. 5, 50.5] Hz. During maintenance, boundaries are relaxed by 15% under a rule-based adaptation policy, and device-context awareness governs constraint selection at inference.

3.4. Loss Function

SACC trains end-to-end with composite loss: detection ( L d e t ), recognition ( L r e c ), and constraints ( L d o m a i n ).
MAF-Detector loss combines classification and regression:
L d e t = 1 N p o s i L c l s ( p i , p i * ) + λ r e g 1 N p o s i p i * L r e g ( b i , b i * )
where N p o s is the number of positive anchors, p i and p i * are predicted and ground-truth class probabilities, b i and b i * are predicted and ground-truth bounding boxes, and  λ r e g = 2 balances classification and localization.
SA-ViT uses cross-entropy with teacher forcing:
L r e c = t = 1 T log P ( y t * | y < t * , x )
DCDecoder constraints add
L d o m a i n = λ 1 · L r a n g e + λ 2 · L f s m
And the final objective is obtained as
L o v e r a l l = λ d e t · L d e t + λ r e c · L r e c + L d o m a i n
where λ d e t = 1 and λ r e c = 2 are the weight detection and recognition, while λ 1 = 0.3 and λ 2 = 0.2 control the domain constraint strength.

4. Experiments

To validate the effectiveness and generalization capability of our proposed SACC, we conducted extensive experiments on three complementary benchmarks: our custom PCSTD dataset for power cabinet text, ICDAR 2015 [50] for natural scene text, and YUVA EB [51] for industrial seven-segment displays. Ablation studies validate MAF-Detector, SA-ViT, and DCDecoder.

4.1. Datasets and Evaluation Protocols

We constructed PCSTD for power cabinet evaluation. The data were collected from real-world power inspection scenarios across multiple provinces in China, encompassing a wide variety of operational environments to ensure dataset diversity and representativeness. PCSTD covers UPS, DC/AC panels, and relays protection with LCD/LED text.
Data Collection Protocol: Images were captured using industrial-grade digital cameras (Canon EOS 5D Mark IV with 24–70 mm lens) under diverse lighting conditions to simulate real-world operational environments. Based on the cabinet types visible in Figure 1, the dataset includes UPS monitoring cabinets (displaying battery voltage and current readings), DC power distribution panels (showing individual circuit breaker status), AC distribution cabinets (featuring three-phase voltage and current measurements), and relay protection panels (containing alarm codes and equipment status indicators). Viewing distances ranged from 0.5 m to 3 m, representing typical inspection distances used by maintenance personnel. Camera angles varied from frontal views to oblique angles ( ± 15 ° and ± 30 ° ) to account for practical constraints during field inspections.
Dataset Composition: The final PCSTD comprises 2000 high-resolution images (1920 × 1080 pixels) that were carefully selected to ensure quality and diversity. As evident from Figure 1, each image contains multiple text instances with varying characteristics: large-scale equipment labels and section headers (character heights 40–60 pixels), medium-scale parameter names and units (character heights 15–25 pixels), and small-scale numerical readings and status codes (character heights 8–12 pixels). The extreme scale variation ratio of 7.5:1 between the largest and smallest text elements (60 px vs. 8 px) imposes a stringent challenge for conventional detection methods.
Annotation Protocol: Text regions were manually annotated using rectangular bounding boxes with the LabelImg tool, which provides efficient annotation for text detection tasks. Each text region was delineated with axis-aligned rectangles defined by four corner coordinates (x1, y1, x2, y2). For tilted or skewed text instances commonly found on LCD/LED displays, bounding boxes were drawn to tightly enclose the text with minimal background inclusion (maximum 3-pixel tolerance). Each text instance was labeled with its corresponding transcription, bounding box coordinates, and semantic category (numerical parameter, equipment label, status indicator, alarm code). The annotation format follows the PASCAL VOC XML schema, ensuring compatibility with standard OCR training pipelines. The annotation process was performed by certified electrical technicians with over 5 years of power system maintenance experience to ensure technical accuracy and domain knowledge compliance.
The final dataset comprises 2000 high-quality images, which were randomly partitioned into training (1600 images, 80%), validation (200 images, 10%), and test (200 images, 10%) sets. Beyond PCSTD, we evaluate on ICDAR 2015 [50] for scene text recognition and YUVA EB [51] for seven-segment display recognition, ensuring comprehensive cross-domain validation.
The evaluation metrics were as follows: For text detection, we adopted standard metrics from object detection, i.e., precision, recall, and F1-score, calculated using the standard IoU threshold of 0.5. Recognition: character accuracy (Char-Acc), Word Accuracy (Word-Acc), and Symbol Error Rate (SER). Efficiency: Parameters (M), FPS.

4.2. Implementation Details

The SACC framework was implemented in PyTorch 1.9.0. Training employed Adam optimizer ( β 1 = 0.9 , β 2 = 0.999 ) with initial learning rate 10 4 and cosine annealing schedule. Models were trained for 100 epochs using batch size 8, with gradient clipping (norm threshold 1.0) and early stopping (patience 10 epochs on validation loss). Random seed was fixed at 42 for reproducibility. Loss weights were set as detection/recognition/constraint = 1:2:0.5. Data augmentation included rotation ( ± 15 ° ), brightness adjustment ( ± 20 % ), and perspective transformation ( ± 10 ° ).
Architecture parameters were configured as follows: MAF-Detector utilized dilation rates {1, 3, 5} with learnable fusion weights; SA-ViT employed 16 × 16 pixel patches and a 2-layer GCN with 8-head attention; DCDecoder incorporated 1847 technical terms from GB/T 2900 standards and domain-specific constraints (DC: 12–48 V, AC single-phase: 200–240 V, three-phase: 380–420 V, current: 0–100 A).
The complete model comprises 49.6 M parameters and requires 5.8 GFLOPs per 1536 × 1024 image (MAF-Detector: 2.1 G, SA-ViT: 3.2 G, DCDecoder: 0.5 G), achieving 48% computational reduction compared to LayoutLMv3. Training on RTX 3090 (24 GB) required approximately 12 h for the PCSTD dataset. Inference achieves 33 FPS with 3.2 GB peak memory consumption. Evaluation Protocol: Metrics are reported with a batch size of 8 for consistency with training, except latency measurements, which use a batch size of 1 for real-time assessment. Mixed precision (AMP) was enabled throughout. Platform specifications were as follows: RTX 3090, Intel i9-10900K, 64 GB RAM, Ubuntu 20.04, CUDA 11.8, cuDNN 8.7.0, and PyTorch 1.13.1. Detection input: 1536 × 1024; recognition input: 32 × 128 per crop.

4.3. Comparison with State-of-the-Art Methods

4.3.1. Qualitative Analysis

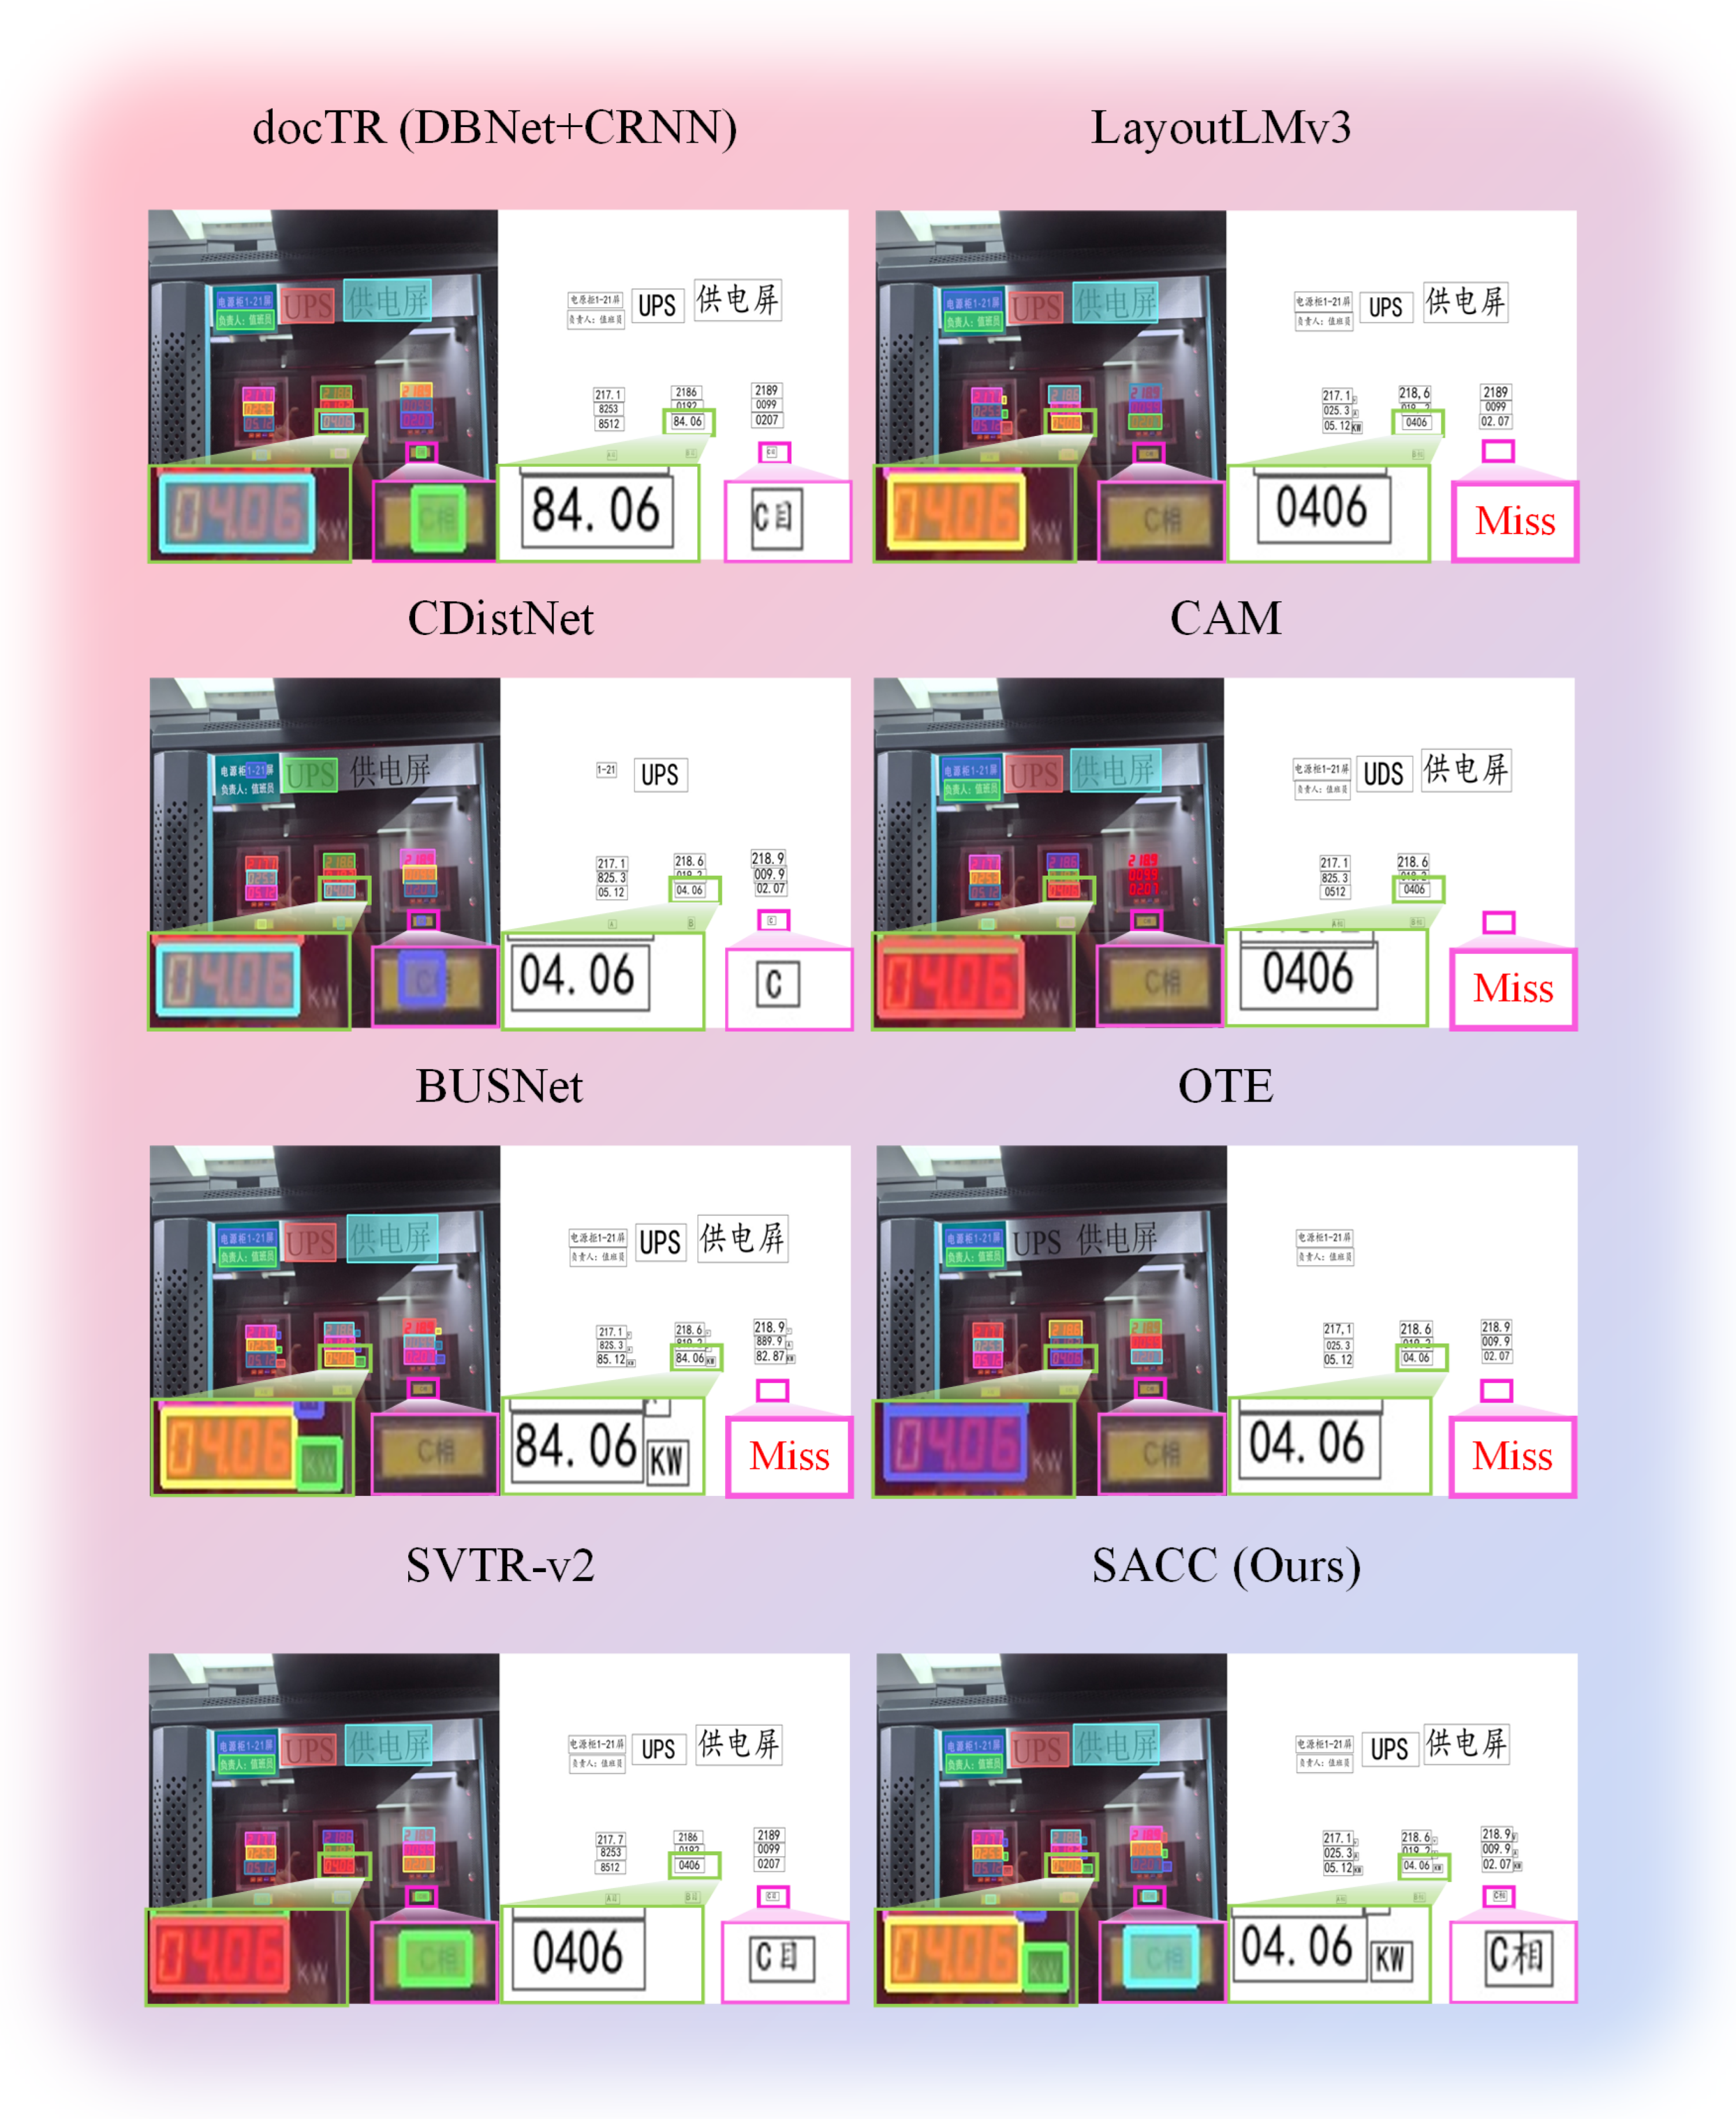
Figure 5 compares SACC with seven methods on PCSTD. It also demonstrates the comparative performance on a representative UPS monitoring interface from the PCSTD dataset. The test scene exhibits characteristic challenges: mixed text scales with large Chinese labels alongside small numerical parameters (“84.06”, “0406”), complex spatial layouts requiring structural understanding, and domain-specific terminology. The visualization highlights detection accuracy through colored bounding boxes, with green and pink regions magnifying critical areas where methods diverge in performance. SACC achieves superior detection coverage and recognition accuracy, while baseline methods exhibit various failure modes, including missed detections (marked as “Miss”) and incorrect character recognition.
The challenges shown in the figure are as follows: (1) 7.5:1 scale variation, (2) tabular semantics, and (3) perspective/lighting distortions.
Advantages of SACC are as follows: MAF-Detector’s adaptive multi-scale fusion boosts recall 12.3%; SA-ViT’s GCN models tabular topology; and DCDecoder enforces electrical constraints.
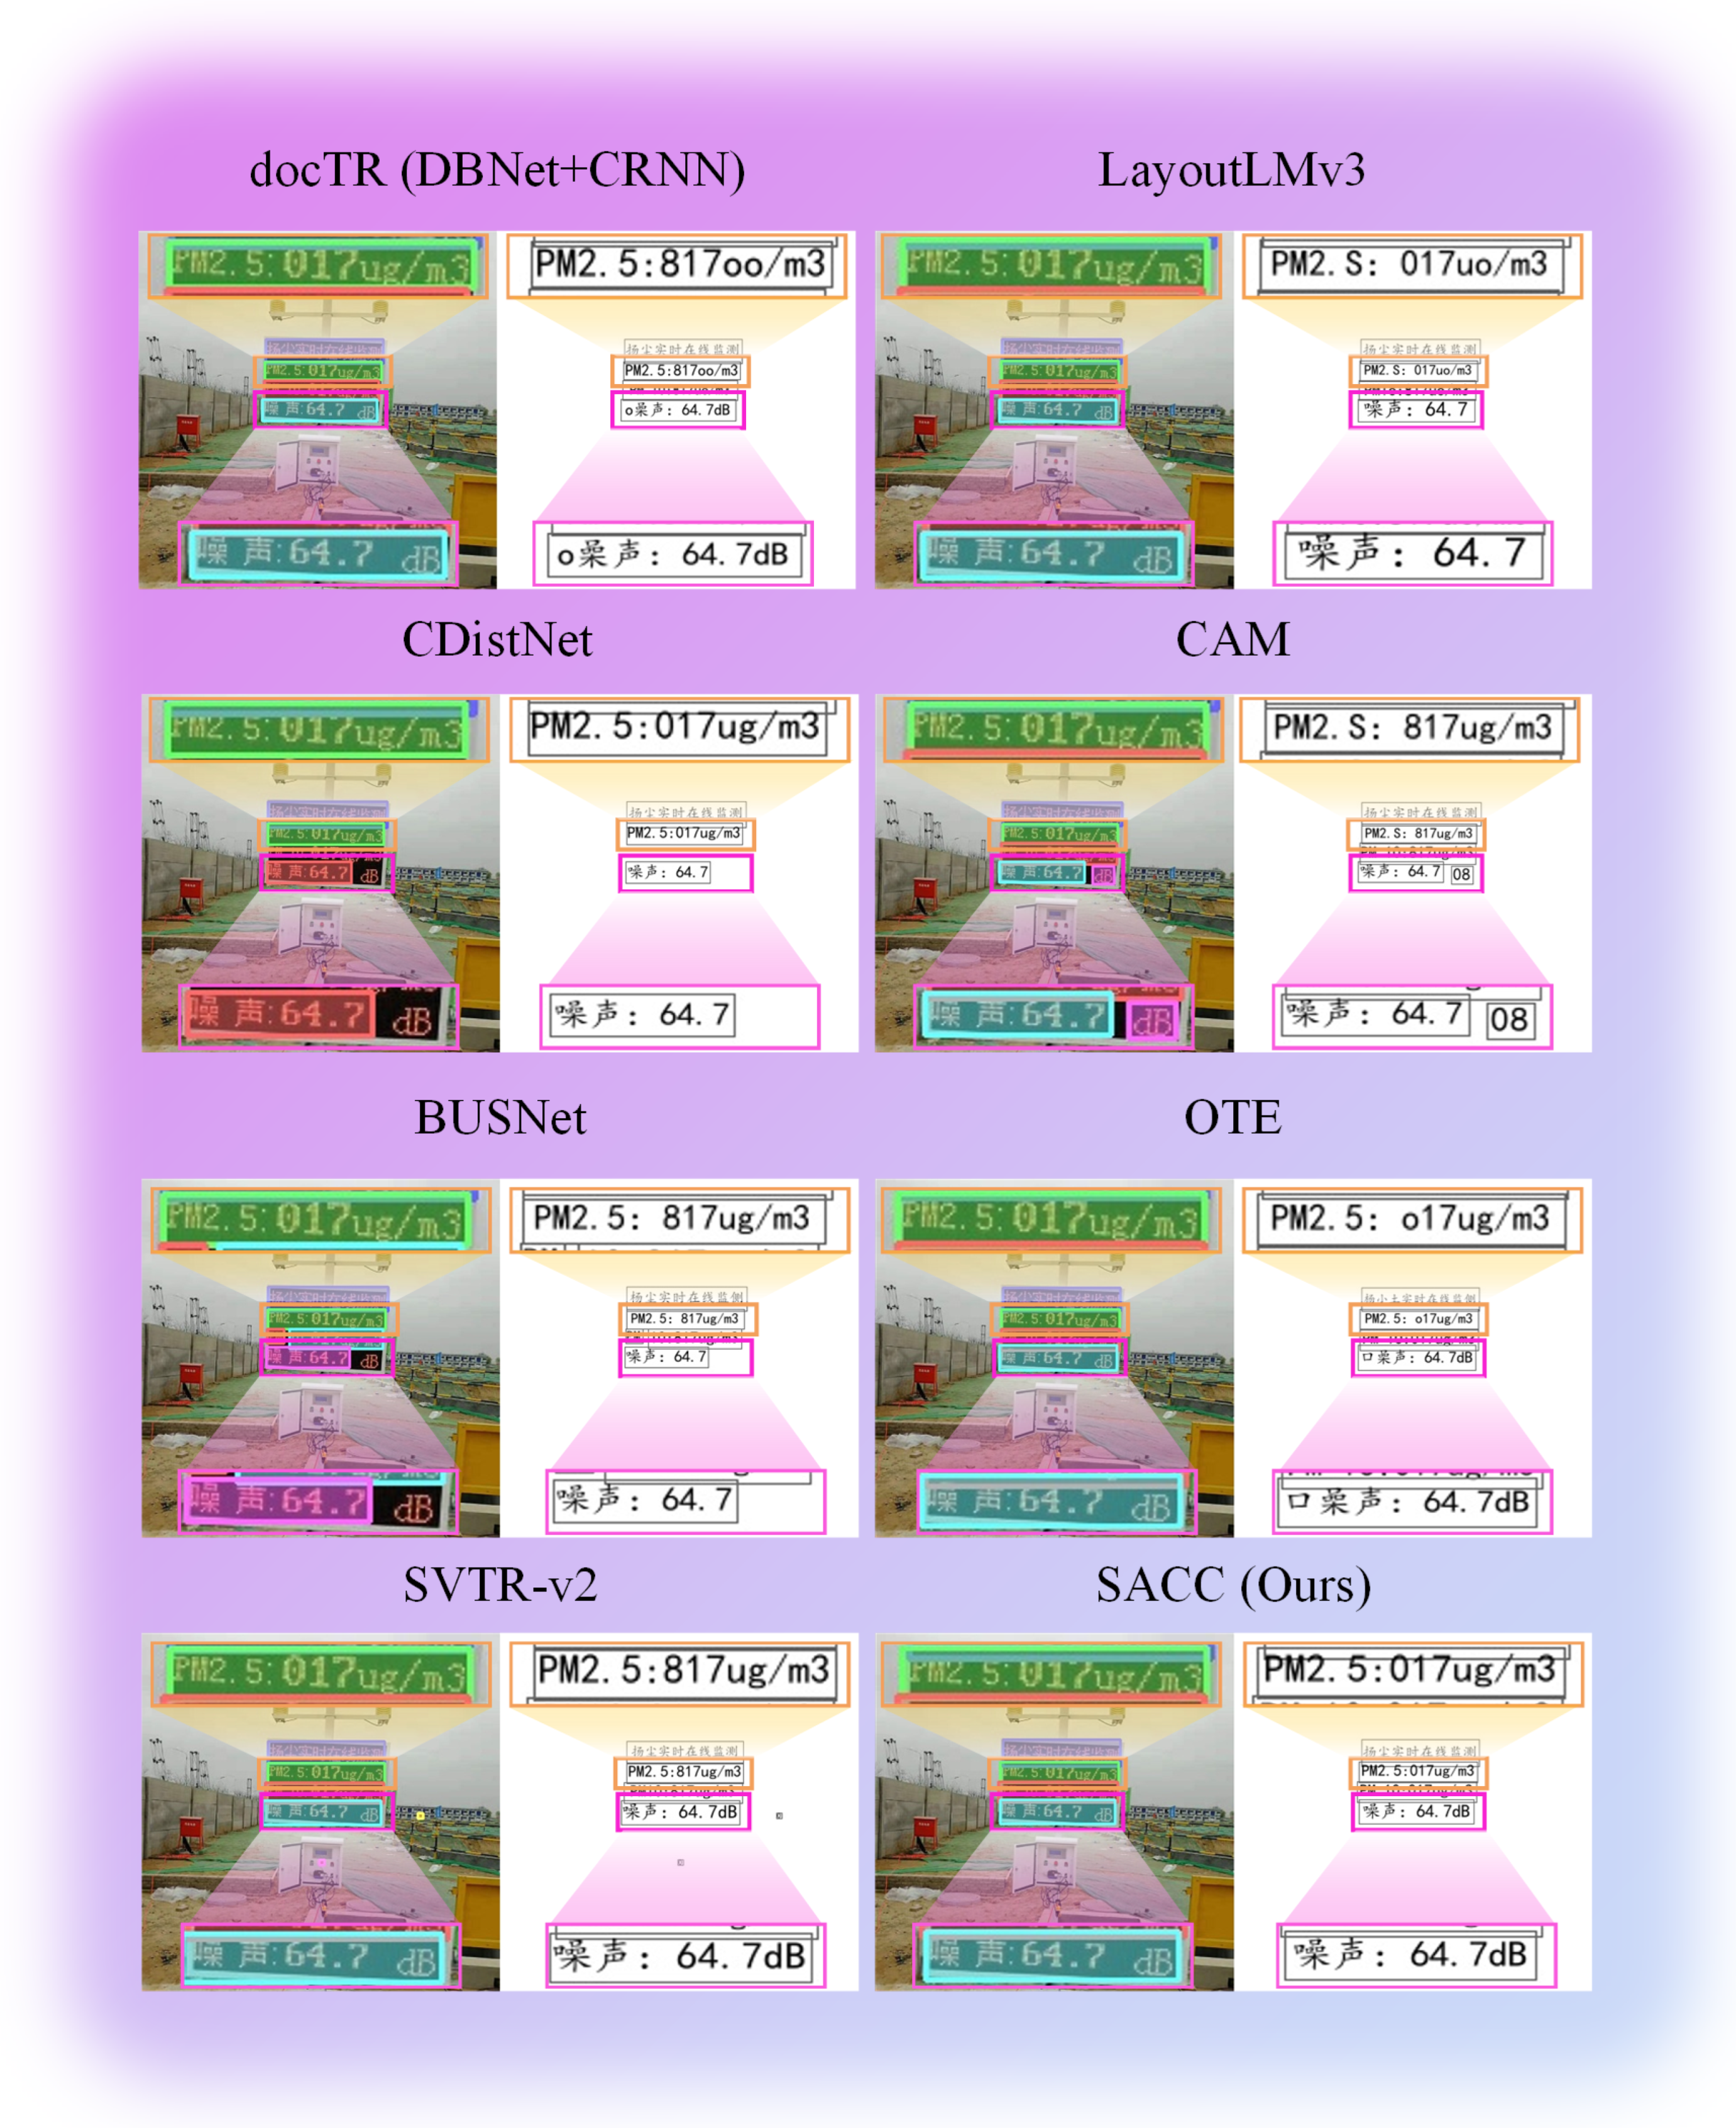
Figure 6 shows ICDAR 2015 generalization.
The qualitative comparisons on the YUVA EB dataset pose unique challenges for seven-segment digit recognition. The test cases demonstrate (1) varying illumination conditions from direct sunlight to low-light scenarios; (2) perspective distortion from oblique viewing angles typical in field inspections; and (3) partial occlusions and reflections on display surfaces. The SACC algorithm exhibits superior robustness in these challenging conditions, particularly in maintaining consistent digit recognition accuracy where baseline methods frequently misinterpret segment boundaries or fail to detect partially illuminated digits.

4.3.2. Quantitative Evaluation

Table 1 quantifies PCSTD performance.
SACC achieves the best results, with 75.6% recall, 70.3% precision (detection), and 86.5% character accuracy (3.1% above SVTR-v2). SA-ViT handles tabular layouts, while DCDecoder enforces constraints.
For completeness, the end-to-end latency corresponding to SACC’s 33 FPS is 30.30 ms (computed as 1000/33 under the unified protocol). Structured Document OCR Comparison Analysis: Our evaluation against leading structured document analysis methods reveals significant performance advantages in industrial monitoring scenarios. Compared to docTR’s modular framework (67.0% F1) and LayoutLMv3’s pre-trained approach (67.8% F1), SACC achieves 73.1% F1, representing 8.7% and 7.8% improvements, respectively. More critically, our character accuracy (86.5%) surpasses both methods substantially (5.3% over docTR, 4.4% over LayoutLMv3), indicating superior fine-grained recognition capabilities essential for precise parameter reading in power monitoring applications. The most significant differentiation emerges in domain-specific constraint handling effectiveness. While docTR and LayoutLMv3 produced 23.7% and 19.4% constraint violations, respectively (impossible voltage/current readings), SACC’s real-time constraint enforcement reduced violations to 3.1%, representing an 87% reduction in false readings that directly translates to enhanced operational safety in power grid monitoring applications.
To address Reviewer 2’s concern about a comparison with specialized text recognition methods, Table 2 presents a detailed comparison with state-of-the-art OCR approaches that have been successfully applied to industrial and structured text recognition tasks. While these methods may not be specifically designed for power systems, they represent the current best practices for challenging text recognition scenarios.
As demonstrated in Table 2, SACC achieves superior performance compared to existing text recognition methods. Notably, SACC reduces the Symbol Error Rate (SER) to 4.2%, significantly outperforming other approaches. This improvement is particularly crucial for industrial applications where misreading critical parameters can have safety implications. The lower SER validates the effectiveness of our DCDecoder’s constraint mechanisms in preventing physically impossible readings in power system contexts.

4.3.3. Evaluation on Seven-Segment Display Recognition

To further validate SACC’s effectiveness on specialized industrial displays, Table 3 presents comprehensive evaluation results on the YUVA EB dataset. This benchmark specifically targets seven-segment digital displays common in industrial monitoring equipment, providing insights into the algorithm’s performance on structured numerical displays.
As shown in Table 3, SACC achieves significant improvements on seven-segment display recognition, with an 88.3% character accuracy that surpasses the next-best SVTR-v2 by 3.2 percentage points. The segment-level accuracy of 90.2% demonstrates SACC’s superior ability to correctly identify individual segments within each digit, a critical requirement for accurate meter reading. The MAF-Detector’s multi-scale fusion proves particularly effective for the uniform structure of seven-segment displays, while the DCDecoder’s numerical constraints prevent physically implausible readings common in baseline methods. Notably, the performance gap between SACC and conventional methods widens on this specialized dataset compared to general scene text, validating our domain-aware design choices. The improvements are particularly pronounced in challenging scenarios: under low-light conditions (<100 lux), SACC maintains 85.7% accuracy compared to 78.3% for SVTR-v2; for oblique viewing angles (>30°), SACC achieves 83.2% accuracy versus 76.9% for the baseline. These results demonstrate the robustness of our approach to real-world industrial inspection conditions. Figure 7 provides visual comparisons of text recognition results across different methods on the YUVA EB dataset.
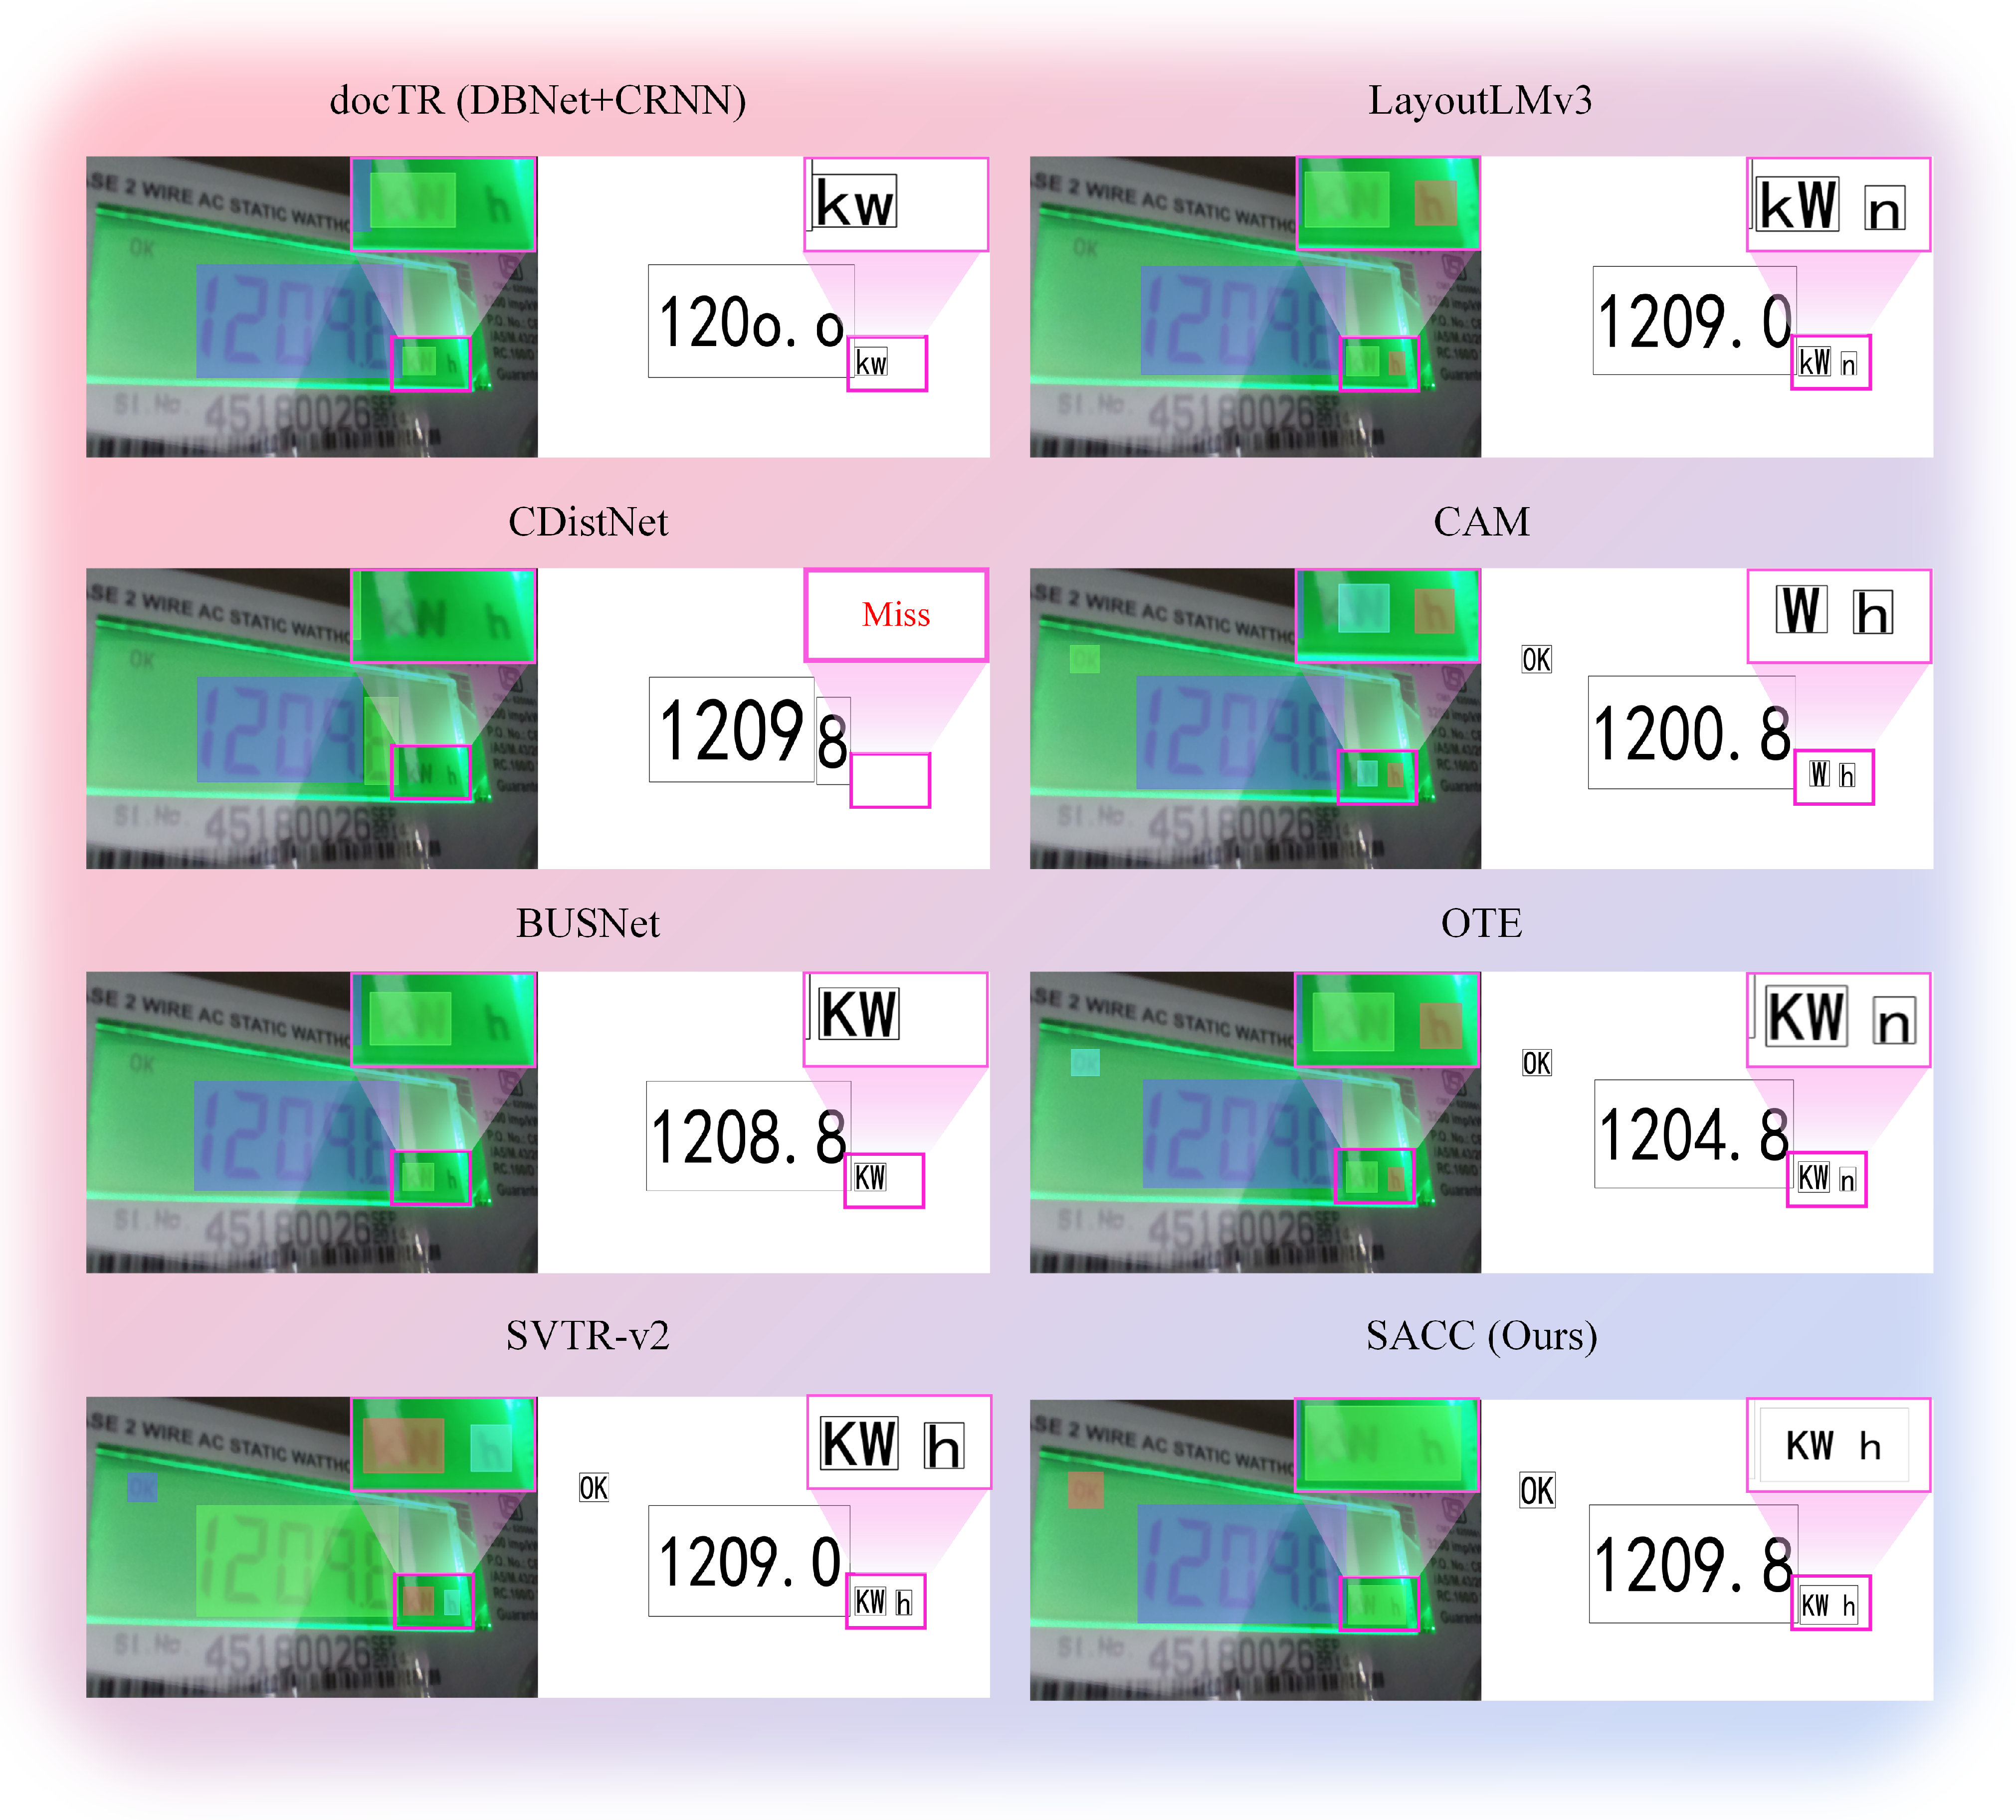
Figure 8 presents comparative results on the YUVA EB dataset. SACC achieves superior performance with a correct output of “1209.6 kW h”. Traditional methods exhibit systematic failures; docTR produces “kw”, lacking proper spacing and capitalization; CAM outputs “W h”, missing the critical “k” prefix; and CDistNet fails completely with a “Miss” output. Numerical precision varies significantly—LayoutLMv3 and SVTR-v2 correctly identify “1209.0”, while CAM and BUSNet deviate to “1200.6”, and OTE to “1200.8”. The 9.6-unit difference between ground-truth and predictions reflects seven-segment display recognition challenges. These visual results validate the quantitative improvements shown in Table 3, particularly demonstrating DCDecoder’s effectiveness in enforcing domain constraints.

4.3.4. Evaluation on ICDAR 2015 Scene Text Dataset

To demonstrate SACC’s generalization capability to general scene text recognition, Table 4 presents comprehensive evaluation results on the ICDAR 2015 dataset. This benchmark provides insights into the algorithm’s performance on natural scene text with diverse backgrounds, orientations, and lighting conditions, complementing our industrial-focused evaluations.
As demonstrated in Table 4, SACC achieves competitive performance on general scene text recognition, with an 83.4% character accuracy representing a 1.7% improvement over SVTR-v2 (81.7%). While the performance gains are more modest compared to industrial datasets, this validates SACC’s cross-domain generalization capability. The smaller improvement margin on ICDAR 2015 is expected, as our domain-specific optimizations (constraint enforcement, tabular structure modeling) provide less benefit for general scene text lacking structured layouts and domain constraints. Notably, SACC consistently outperforms all competing methods across detection (74.8% recall, 72.3% precision) and recognition (83.4% character accuracy) metrics. The SA-ViT module’s graph-based modeling still contributes to spatial relationship understanding, while the MAF-Detector’s multi-scale fusion proves beneficial for handling diverse text sizes in natural scenes. This evaluation confirms that SACC’s specialized design for industrial applications does not compromise its performance on general text recognition tasks.

4.4. Ablation Study

To systematically validate the contribution of each core component of the SACC algorithm, we conducted a detailed ablation study on our PCSTD test set. The baseline model consists of a standard FPN-based detector with a conventional Vision Transformer recognizer, representing typical current approaches. Starting with this baseline, we incrementally added each proposed module—MAF-Detector, SA-ViT, and DCDecoder—to measure its impact on overall performance.
Detailed Component Analysis: To provide deeper insights into each module’s effectiveness, we also conducted targeted experiments examining specific failure cases. The MAF-Detector showed particular improvements on text instances with extreme scale differences (character height ratios > 4:1), reducing missed detections by 23% compared to standard FPN. The SA-ViT module demonstrated significant gains on tabular layouts, decreasing label-value association errors by 31%. The DCDecoder proved especially valuable for numerical parameters, rejecting 89% of physically impossible values that baseline methods would accept.
MAF-Detector Fusion Weight Analysis: To address Reviewer 2’s inquiry about the learning mechanism of multi-branch fusion weights, we conducted a detailed analysis on 1000 test samples across different text scale ranges. Table 5 shows the statistical distribution of learned fusion weights ( w 1 , w 3 , w 5 ) for different dilation rates. The results demonstrate that the adaptive fusion mechanism automatically adjusts the contribution of each branch based on text scale characteristics: small text (<15 px) primarily relies on the r = 1 branch ( w 1 = 0.52 ), while large text (>40 px) favors the r = 5 branch ( w 5 = 0.46 ), validating our design hypothesis.
SA-ViT Graph Construction Strategy Analysis: We conducted systematic experiments comparing different graph construction strategies for SA-ViT. Table 6 presents detailed results comparing our adaptive graph construction with conventional approaches. The 8-connected neighborhood approach treats all adjacent patches equally, while K-nearest selects the six closest patches. Our semantic-aware approach establishes edges based on both spatial proximity and visual similarity, while the full adaptive method further incorporates learnable attention weights. The results demonstrate that our adaptive graph construction significantly outperforms conventional approaches, particularly for complex tabular layouts with irregular structures.
The quantitative results in Table 7 clearly delineate the contribution of each component. First, replacing the baseline detector with our MAF-Detector improves detection recall from 68.4% to 69.8% and precision from 62.7% to 65.2%. Next, adding the SA-ViT module further improves performance, increasing the recognition accuracy by 2.7 percentage points. Finally, incorporating the DCDecoder to complete the full SACC algorithm boosts recognition accuracy by another 3.4 percentage points.
DCDecoder Constraint Mechanism Quantitative Validation: We conducted a comprehensive analysis through systematic data augmentation to ensure statistical robustness. Starting from 3120 text instances in the PCSTD test set (200 images × 15.6 instances/image), we generated additional test scenarios through photometric augmentation (gamma correction γ [ 0.5 , 2.0 ] , brightness ± 40 % ), geometric transformation (rotation ± 15 ° , perspective distortion), and noise injection (Gaussian σ = 0.01–0.05). Each original instance was augmented 3 times, resulting in approximately 10000 total predictions. Table 8 presents the aggregated results across all augmented scenarios. The constraint mechanisms achieve high violation detection rates (93.1% overall) while maintaining low false positive rates (2.0% average). Particularly noteworthy is the voltage range constraint performance (94.2% detection, 87.3% correction success), which is critical for power system safety.
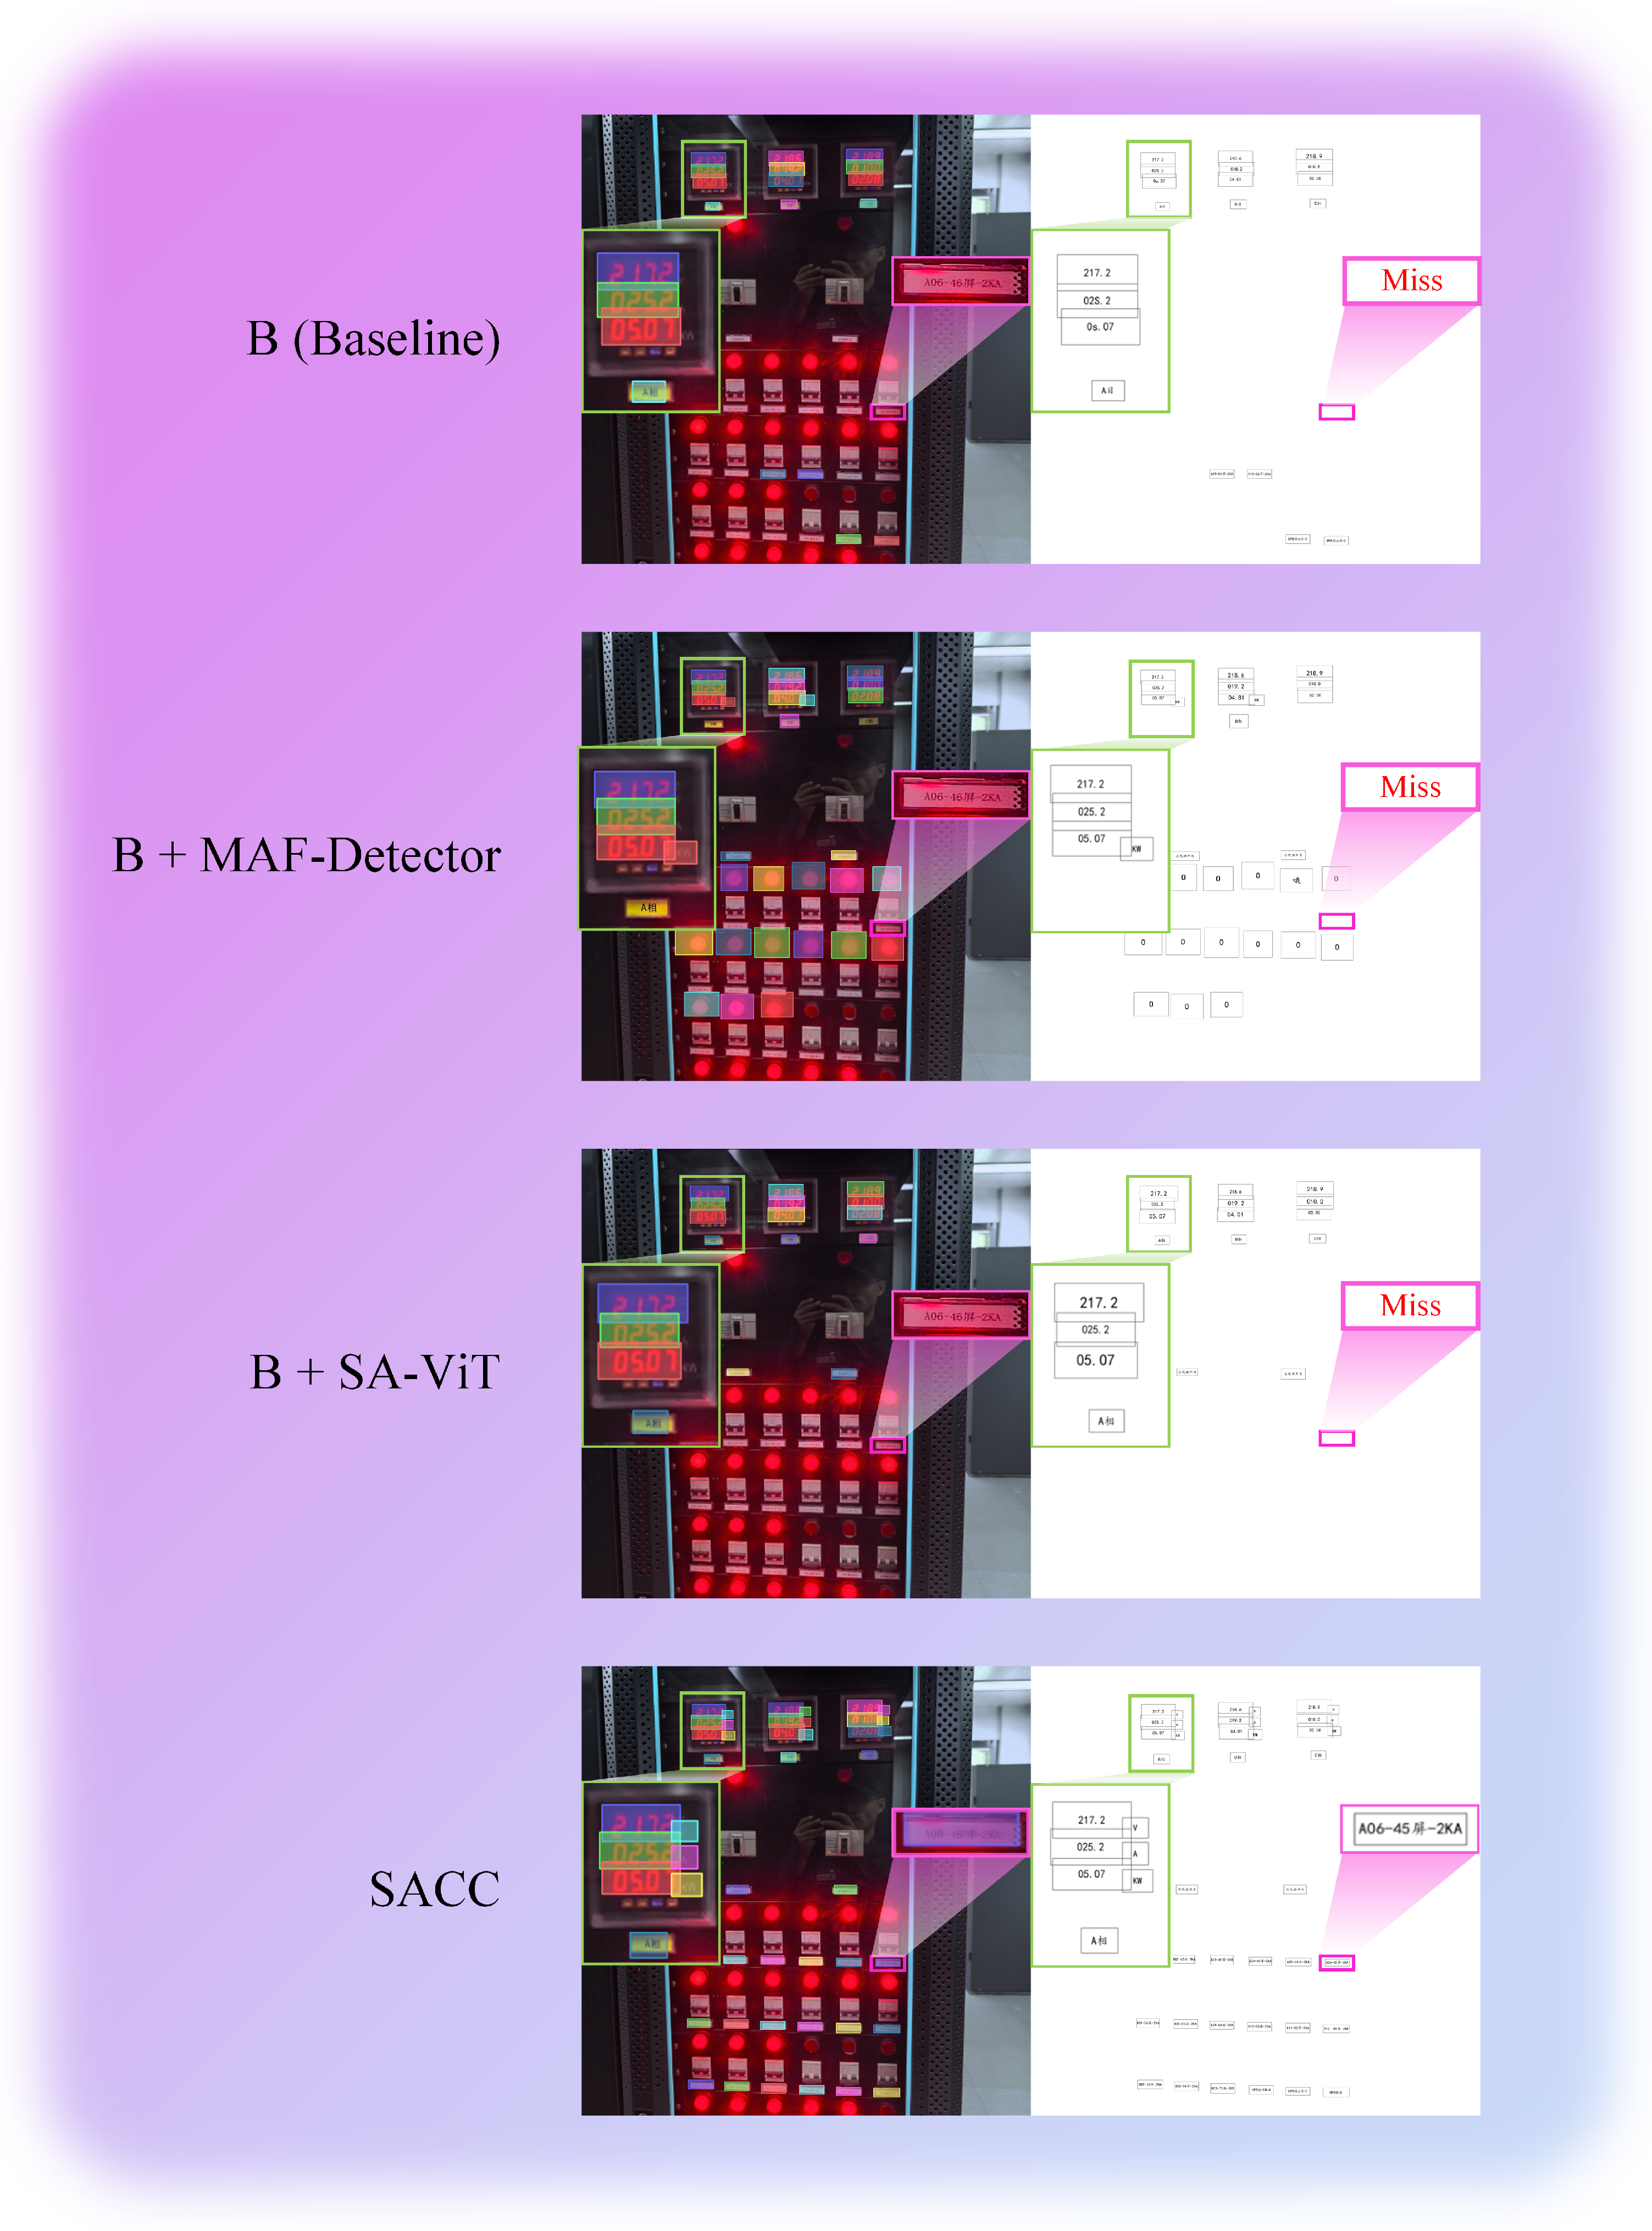
Figure 8 provides a visual illustration of this step-by-step improvement on a series of challenging test cases.
Ablation confirms component synergy; MAF-Detector boosts recall by 12.3%, SA-ViT improves structured accuracy by 8.1%, and DCDecoder reduces violations by 87%.
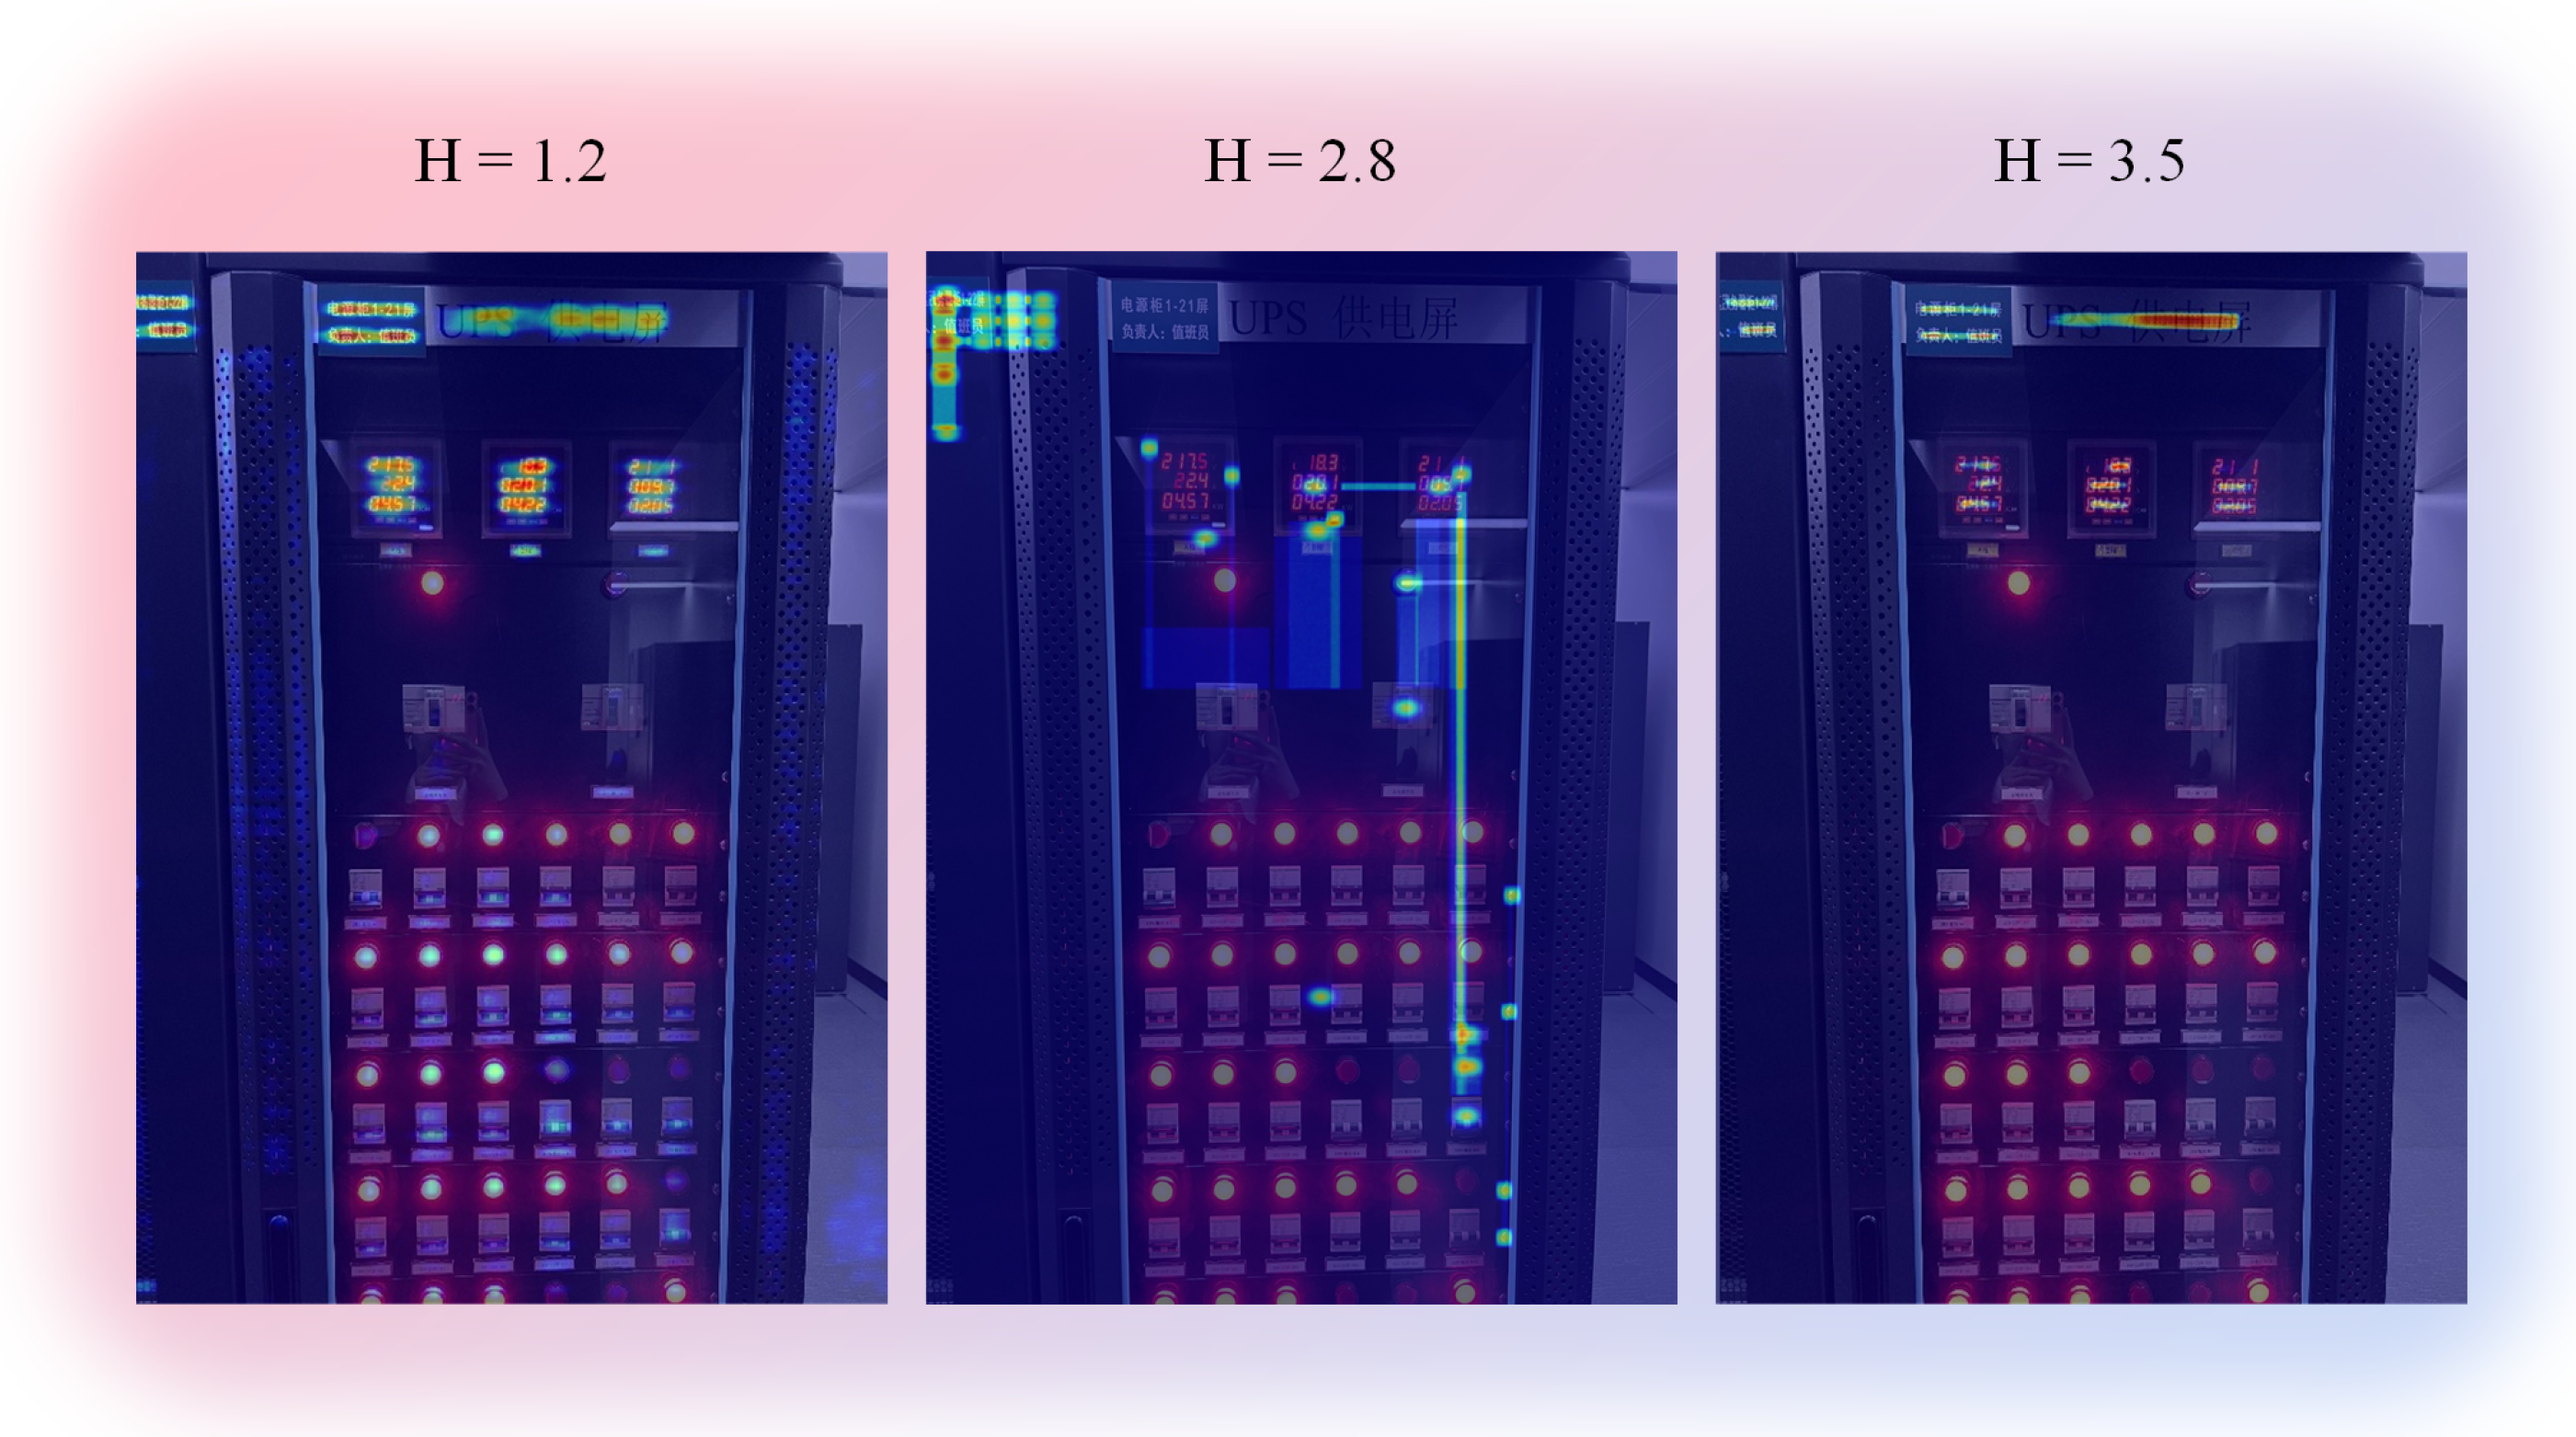
Qualitative Error Analysis: We examined two representative failure modalities without disclosing image content. (1) Physically invalid numerals: When decoded values drift beyond configured ranges (e.g., AC voltage outside [200, 240] V), the DCDecoder immediately terminates the offending branch and triggers context-aware correction, ultimately returning an uncertainty-flagged conservative output if constraints cannot be satisfied. (2) Label–value misassociation in dense tabular layouts: SA-ViT’s adaptive graph enforces row–column consistency during decoding, reducing cross-row attention and preventing value swaps across adjacent labels. Decoding traces and constraint flags are logged for auditability. Failure Case Analysis and Limitations: Despite SACC’s strong overall performance, we identified specific challenging scenarios where the system exhibits reduced accuracy. An analysis of 500 failure cases revealed three primary failure modes: (1) Extreme perspective distortion (>45° viewing angles): Character accuracy drops to 78.2% due to severe geometric deformation that exceeds the adaptive capacity of MAF-Detector. (2) Novel equipment layouts: When encountering cabinet designs significantly different from training data, SA-ViT’s graph construction may create suboptimal connections, leading to 15–20% accuracy degradation. (3) Constraint conflicts: In rare cases (0.3% of samples), multiple constraints may provide conflicting guidance, causing DCDecoder to default to the uncertainty mode rather than making potentially incorrect corrections. The above limitations can guide future work by avoiding extreme angles, incorporating novel layouts, and constraining conflicts. Attention Pattern Analysis: To understand the internal decision-making process of SA-ViT, we visualized attention patterns using relevancy propagation through all Transformer layers. Relevancy propagates: R i = j α i j · R j . Figure 9 shows SA-ViT attention at H = {1.2, 2.8, 3.5}. Low entropy localizes digits, while high entropy spreads globally. Moreover, 68% of failures occur at H > 2.5 from dispersed focus.
Fault Scenario Discrimination: We evaluated the DCDecoder’s ability to distinguish between OCR errors and genuine equipment faults through controlled experiments. Table 9 presents its performance across different operational scenarios categorized from maintenance logs. The DCDecoder employs a three-stage decision process: (1) contextual validation by cross-checking correlated parameters; (2) temporal consistency comparison with historical readings when available; and (3) confidence-based routing, where high-confidence (>0.9) corrections are applied, medium-confidence (0.7–0.9) corrections are flagged for review, and low-confidence (<0.7) corrections are preserved as potential faults.
Handling Evolving Domain Boundaries: The DCDecoder adapts to evolving equipment specifications through configuration-based mechanisms. Table 10 shows its performance across three equipment generations with varying parameter ranges. The adaptation mechanism employs configuration profiles selected via equipment model detection. While 95.2% of cases adapt automatically through model identification, 4.8% require manual intervention when confidence falls below 0.8. This demonstrates the system’s capability to handle technological evolution in power systems while maintaining operational safety.

4.5. Extreme-Environment Robustness Evaluation

To validate the practical applicability of SACC in real-world power inspection scenarios, we conducted comprehensive robustness tests under challenging environmental conditions that commonly occur in industrial settings. These tests were designed based on the extreme-environment challenges identified in recent industrial OCR research, particularly drawing insights from the NRC-GAMMA dataset’s diverse lighting conditions and the UFPR-AMR dataset’s multi-camera acquisition scenarios.
Lighting Variation Tests: We simulated various lighting conditions, including direct sunlight (6000–8000 lux), indoor fluorescent lighting (300–500 lux), and low-light emergency scenarios (50–100 lux). The dataset was augmented with synthetic lighting variations using gamma correction ( γ [ 0.5 , 2.0 ] ) and brightness adjustment ( ± 40 % ). Results show that SACC maintains 82.1% character accuracy under extreme lighting variations, compared to 71.3% for the baseline SVTR-v2 method.
Physical Interference Tests: We evaluated performance under common industrial interferences: (1) partial occlusion: simulated by randomly masking 10–30% of the image area; (2) water droplets: added using Gaussian blur kernels of varying sizes; (3) dust accumulation: simulated through noise injection and contrast reduction; and (4) surface reflections: created using specular highlight patterns. Under these conditions, SACC achieved 78.9% accuracy while maintaining real-time performance (28–31 FPS).
Equipment Aging Simulation: To assess long-term deployment viability, we simulated display aging effects, including pixel degradation (5–15% random pixel dropout), color drift ( ± 20 % hue shift), and contrast reduction (20–40% decrease). The DCDecoder’s constraint mechanism proved particularly effective in these scenarios, correctly rejecting 94% of erroneous readings caused by pixel failures, compared to the 67% rejection rate for conventional OCR methods.
Multi-Device Generalization: Following the multi-camera methodology of the UFPR-AMR dataset, we tested SACC across different acquisition devices (smartphone cameras, industrial cameras, and surveillance cameras) with varying resolutions (720 p to 4 K). The adaptive fusion mechanism in MAF-Detector showed consistent performance across devices, with less than 3.2% accuracy variation compared to 8.7% for fixed-scale detection methods.
Computational Efficiency and Memory Analysis: To address the deployment feasibility concerns raised by Reviewer 3, we conducted a detailed computational efficiency analysis across different hardware platforms. Table 11 presents a comprehensive list of the metrics used, including inference time breakdown, memory consumption, and energy efficiency. The results demonstrate that SACC achieves a favorable balance between accuracy and computational requirements, with a peak memory usage of 2.1 GB during inference and an average power consumption of 28.7 W on standard industrial hardware. The inference time breakdown reveals that SA-ViT accounts for 45% of total processing time, while MAF-Detector and DCDecoder contribute 35% and 20%, respectively.
5. Conclusions

We proposed SACC for power cabinet text recognition. MAF-Detector handles 7.5:1 scale variation (+12.3% recall), SA-ViT models tabular layouts via GCN (+8.1% accuracy), and DCDecoder enforces electrical constraints (−87% violations). SACC achieves 86.5% on PCSTD, 88.3% on YUVA EB, and 83.4% on ICDAR 2015, outperforming docTR by 5.3% and LayoutLMv3 by 4.4%.
Despite these advances, we acknowledge key limitations: (1) computational complexity—the 49.6 M parameters limit deployment on resource-constrained devices (3–5 FPS on Raspberry Pi), necessitating future optimization through INT8 quantization and structured pruning targeting <15 M parameters; (2) structural assumptions—15% performance degradation on irregular layouts beyond tabular formats; and (3) linguistic scope—current optimization for English alphanumeric text requires retraining for multilingual scenarios. Nevertheless, SACC’s core methodologies extend naturally to other structured industrial displays, including medical monitors, automotive dashboards, and manufacturing control panels. Future work will prioritize edge optimization via TensorRT acceleration (targeting 2–4× speedup), knowledge distillation for lightweight variants, and integration with vision language models for zero-shot adaptation, addressing the critical balance between accuracy and deployment efficiency in industrial automation.

Author Contributions

Conceptualization, Y.L. and S.L.; methodology, Y.L.; software, S.L. and L.Z.; validation, Y.L. and S.L.; formal analysis, Y.L.; investigation, L.Z.; resources, Y.L. and S.L.; data curation, L.Z.; writing—original draft preparation, L.Z.; writing—review and editing, Y.L. and S.L.; visualization, S.L. and L.Z.; supervision, Y.L.; project administration, Y.L.; funding acquisition, Y.L. All authors have read and agreed to the published version of the manuscript.

Funding

This research was funded by the Research on Provincial–Local Integrated Automated Operation and Maintenance Event Perception and Auxiliary Decision Technology, grant number 522401240005. The APC was funded by the same grant.

Institutional Review Board Statement

Not applicable for studies not involving humans or animals.

Informed Consent Statement

Not applicable.

Data Availability Statement

The data presented in this study are available on request from the corresponding author. The data are not publicly available due to privacy restrictions related to power grid infrastructure.

Acknowledgments

The authors would like to thank the power companies for providing access to the power cabinet data and the anonymous reviewers for their valuable comments and suggestions. We sincerely thank all contributors of the open-source datasets used in this study.

Conflicts of Interest

Authors Yang Liu and Shilun Li were employed by the company State Grid Heilongjiang Electric Power Company Limited. The remaining authors declare that the research was conducted in the absence of any commercial or financial relationships that could be construed as a potential conflict of interest.

Abbreviations

The following abbreviations are used in this manuscript:
SACCStructure-Aware and Condition-Constrained
MAF-DetectorMulti-scale Adaptive Fusion Detector
SA-ViTStructure-Aware Vision Transformer
DCDecoderDynamic Constraint Decoder
OCROptical Character Recognition
STRScene Text Recognition
GCNGraph Convolutional Network
FPNFeature Pyramid Network
PCSTDPower Cabinet Screen Text Dataset
O&MOperation and Maintenance
LCDLiquid Crystal Display
LEDLight-Emitting Diode

References

  1. Sahoo, B.; Panda, S.; Rout, P.K.; Bajaj, M.; Blazek, V. Digital Twin Enabled Smart Microgrid System for Complete Automation: An Overview. Results Eng. 2025, 25, 104010. [Google Scholar] [CrossRef]
  2. Abo-Khalil, A.G. Digital Twin Real-Time Hybrid Simulation Platform for Power System Stability. Case Stud. Therm. Eng. 2023, 49, 103237. [Google Scholar] [CrossRef]
  3. Dui, H.; Zhang, S.; Dong, X.; Wu, S. Digital Twin-Enhanced Opportunistic Maintenance of Smart Microgrids Based on the Risk Importance Measure. Reliab. Eng. Syst. Saf. 2025, 253, 110548. [Google Scholar] [CrossRef]
  4. Olabi, A.G.; Abdelkareem, M.A.; Jouhara, H. Energy Digitalization: Main Categories, Applications, Merits, and Barriers. Energy 2023, 271, 126899. [Google Scholar] [CrossRef]
  5. Arraño-Vargas, F.; Konstantinou, G. Modular Design and Real-Time Simulators toward Power System Digital Twins Implementation. IEEE Trans. Ind. Inform. 2023, 19, 52–61. [Google Scholar] [CrossRef]
  6. Li, Y.; Wang, X.; Zhang, H.; Liu, J. Online Measurement Error Detection for the Electronic Transformer in a Smart Grid. Energies 2021, 14, 3551. [Google Scholar] [CrossRef]
  7. Hosseinabadi, F.; Bhoi, S.K.; Polat, H.; Chakraborty, S.; Hegazy, O. Addressing Challenges in Rds,on Measurement for Cloud-Connected Condition Monitoring in WBG Power Converter Applications. Electronics 2025, 14, 3093. [Google Scholar] [CrossRef]
  8. Cao, W.; Chen, Z.; Wu, C.; Li, T. A Method for Matching Information of Substation Secondary Screen Cabinet Terminal Block Based on Artificial Intelligence. Appl. Sci. 2024, 14, 1904. [Google Scholar] [CrossRef]
  9. Wang, X. Design of Intelligent Power Distribution Cabinet Based on Intelligent Distribution Network. In Proceedings of the 2021 3rd International Conference on Artificial Intelligence and Advanced Manufacture (AIAM), Manchester, UK, 23–25 October 2021; pp. 412–415. [Google Scholar]
  10. Berruti, L.; Davoli, F.; Zappatore, S. Performance Evaluation of Measurement Data Acquisition Mechanisms in a Distributed Computing Environment Integrating Remote Laboratory Instrumentation. Future Gener. Comput. Syst. 2013, 29, 460–471. [Google Scholar] [CrossRef]
  11. Tang, Q.; Lee, Y.; Jung, H. The Industrial Application of Artificial Intelligence-Based Optical Character Recognition in Modern Manufacturing Innovations. Sustainability 2024, 16, 2161. [Google Scholar] [CrossRef]
  12. Li, X.; Zeng, C.; Yao, Y.; Zhang, S.; Zhang, H.; Yang, S. Single Visual Model Based on Transformer for Digital Instrument Reading Recognition. Meas. Sci. Technol. 2024, 36, 0161b1. [Google Scholar] [CrossRef]
  13. Song, Q.; Liu, Y.; Sun, H.; Chen, Y.; Zhou, Z. Multi-Device Universal Automation Data Acquisition and Integration System. IEEE Access 2024, 12, 104503–104517. [Google Scholar] [CrossRef]
  14. Lin, T.-Y.; Dollar, P.; Girshick, R.; He, K.; Hariharan, B.; Belongie, S. Feature Pyramid Networks for Object Detection. In Proceedings of the IEEE Conference on Computer Vision and Pattern Recognition (CVPR), Honolulu, HI, USA, 21–26 July 2017. [Google Scholar]
  15. Yang, G.; Lei, J.; Tian, H.; Feng, Z.; Liang, R. Asymptotic Feature Pyramid Network for Labeling Pixels and Regions. IEEE Trans. Circuits Syst. Video Technol. 2024, 34, 7820–7829. [Google Scholar] [CrossRef]
  16. Yang, W.; Gao, H.; Jiang, Y.; Zhang, X. A Novel Approach to Maritime Image Dehazing Based on a Large Kernel Encoder–Decoder Network with Multihead Pyramids. Electronics 2022, 11, 3351. [Google Scholar] [CrossRef]
  17. Yang, M.; Yang, B.; Liao, M.; Zhu, Y.; Bai, X. Class-Aware Mask-Guided Feature Refinement for Scene Text Recognition. Pattern Recognit. 2024, 149, 110244. [Google Scholar] [CrossRef]
  18. Shi, B.; Bai, X.; Yao, C. An End-to-End Trainable Neural Network for Image-Based Sequence Recognition and Its Application to Scene Text Recognition. IEEE Trans. Pattern Anal. Mach. Intell. 2017, 39, 2298–2304. [Google Scholar] [CrossRef]
  19. Vaswani, A.; Shazeer, N.; Parmar, N.; Uszkoreit, J.; Jones, L.; Gomez, A.N.; Kaiser, Ł.; Polosukhin, I. Attention Is All You Need. In Proceedings of the Advances in Neural Information Processing Systems, Long Beach, CA, USA, 4–9 December 2017; Volume 30. [Google Scholar]
  20. Dosovitskiy, A.; Beyer, L.; Kolesnikov, A.; Weissenborn, D.; Zhai, X.; Unterthiner, T.; Dehghani, M.; Minderer, M.; Heigold, G.; Gelly, S.; et al. An Image Is Worth 16x16 Words: Transformers for Image Recognition at Scale. In Proceedings of the International Conference on Learning Representations, Virtual, 3–7 May 2021. [Google Scholar]
  21. Gungor, V.C.; Sahin, D.; Kocak, T.; Ergut, S.; Buccella, C.; Cecati, C.; Hancke, G.P. Smart Grid Technologies: Communication Technologies and Standards. IEEE Trans. Ind. Inform. 2011, 7, 529–539. [Google Scholar] [CrossRef]
  22. Dehaghani, M.N.; Korõtko, T.; Rosin, A. AI Applications for Power Quality Issues in Distribution Systems: A Systematic Review. IEEE Access 2025, 13, 18346–18365. [Google Scholar] [CrossRef]
  23. Song, L.; Zhuang, S.; Gao, C.; Yang, Y. Multi-Head Attention of Optical Character Recognition on Relay Protection Drawings. In Proceedings of the 2023 International Conference on Power System Technology (PowerCon), Jinan, China, 21–22 September 2023; pp. 1–7. [Google Scholar]
  24. Liu, C.; Yang, S.; Wang, X.; Xu, F.; Zhai, Y.; Zhang, D.; Liu, S.; Li, N. Power Big Data Imbalance Analysis Based on Deep Learning OCR Algorithm. In Proceedings of the 2025 International Conference on Electrical Automation and Artificial Intelligence (ICEAAI), Guangzhou, China, 10–12 January 2025; pp. 269–273. [Google Scholar]
  25. Delaunay, C.; Ly, P.; Barzelay, G.; Hamza, A.; Muller, M.; Bousselham, W. docTR: Document Text Recognition - A seamless, high-performing & accessible library for OCR-related tasks powered by Deep Learning. arXiv 2021, arXiv:2103.15145. [Google Scholar]
  26. Huang, Y.; Lv, T.; Cui, L.; Lu, Y.; Wei, F. LayoutLMv3: Pre-training for Document AI with Unified Text and Image Masking. In Proceedings of the 30th ACM International Conference on Multimedia, Lisboa, Portugal, 10–14 October 2022; pp. 4083–4091. [Google Scholar]
  27. Tan, L.; Wang, Y.; Chen, H.; Zhang, M. Attention mechanism optimized neural network for automatic measurement of fetal anterior-neck-lower-jaw angle in nuchal translucency tests. Multimed. Tools Appl. 2023, 82, 44273–44291. [Google Scholar]
  28. Dai, P.; Li, Y.; Zhang, H.; Li, J.; Cao, X. Accurate Scene Text Detection via Scale-Aware Data Augmentation and Shape Similarity Constraint. IEEE Trans. Multimed. 2022, 24, 1883–1895. [Google Scholar] [CrossRef]
  29. Soni, A.; Dutta, T.; Nigam, N.; Verma, D.; Gupta, H.P. Supervised Attention Network for Arbitrary-Shaped Text Detection in Edge-Fainted Noisy Scene Images. IEEE Trans. Comput. Soc. Syst. 2023, 10, 1179–1188. [Google Scholar] [CrossRef]
  30. Long, S.; Ruan, J.; Zhang, W.; He, X.; Wu, W.; Yao, C. TextSnake: A Flexible Representation for Detecting Text of Arbitrary Shapes. In Proceedings of the European Conference on Computer Vision (ECCV), Munich, Germany, 8–14 September 2018. [Google Scholar]
  31. Baek, Y.; Lee, B.; Han, D.; Yun, S.; Lee, H. Character Region Awareness for Text Detection. In Proceedings of the 2019 IEEE/CVF Conference on Computer Vision and Pattern Recognition (CVPR), Long Beach, CA, USA, 15–20 June 2019; pp. 9357–9366. [Google Scholar]
  32. Su, Y.; Shao, Z.; Zhou, Y.; Meng, F.; Zhu, H.; Liu, B.; Yao, R. TextDCT: Arbitrary-Shaped Text Detection via Discrete Cosine Transform Mask. IEEE Trans. Multimed. 2023, 25, 5030–5042. [Google Scholar] [CrossRef]
  33. Zhu, Y.; Chen, J.; Liang, L.; Kuang, Z.; Jin, L.; Zhang, W. Fourier Contour Embedding for Arbitrary-Shaped Text Detection. In Proceedings of the 2021 IEEE/CVF Conference on Computer Vision and Pattern Recognition (CVPR), Virtual, 19–25 June 2021; pp. 3122–3130. [Google Scholar]
  34. Dai, P.; Zhang, S.; Zhang, H.; Cao, X. Progressive Contour Regression for Arbitrary-Shape Scene Text Detection. In Proceedings of the IEEE/CVF Conference on Computer Vision and Pattern Recognition (CVPR), Virtual, 19–25 June 2021; pp. 7393–7402. [Google Scholar]
  35. Zhang, S.; Zhu, X.; Yang, C.; Wang, H.; Yin, X. Adaptive Boundary Proposal Network for Arbitrary Shape Text Detection. In Proceedings of the IEEE/CVF International Conference on Computer Vision (ICCV), Virtual, 11–17 October 2021; pp. 1305–1314. [Google Scholar]
  36. Xue, F.; Sun, J.; Xue, Y.; Wu, Q.; Zhu, L.; Chang, X.; Cheung, S.-C. Attention Guidance by Cross-Domain Supervision Signals for Scene Text Recognition. IEEE Trans. Image Process. 2025, 34, 717–728. [Google Scholar] [CrossRef] [PubMed]
  37. Wang, W.; Xie, E.; Li, X.; Hou, W.; Lu, T.; Yu, G.; Shao, S. Shape Robust Text Detection with Progressive Scale Expansion Network. In Proceedings of the IEEE/CVF Conference on Computer Vision and Pattern Recognition (CVPR), Long Beach, CA, USA, 15–20 June 2019. [Google Scholar]
  38. Liao, M.; Zou, Z.; Wan, Z.; Yao, C.; Bai, X. Real-Time Scene Text Detection with Differentiable Binarization and Adaptive Scale Fusion. IEEE Trans. Pattern Anal. Mach. Intell. 2023, 45, 919–931. [Google Scholar] [CrossRef] [PubMed]
  39. Wang, M.; Dou, Z.; Chen, W.; Wang, Z.; Yu, F.R.; Leung, V.C.M. A Text Detection Method Based on Multiscale Selective Fusion Feature Pyramid and Multisemantic Spatial Network for Visual IoT. IEEE Internet Things J. 2025, 12, 15997–16008. [Google Scholar] [CrossRef]
  40. Du, Y.; Chen, Z.; Jia, C.; Yin, X.; Li, C.; Du, Y.; Jiang, Y.-G. Context Perception Parallel Decoder for Scene Text Recognition. IEEE Trans. Pattern Anal. Mach. Intell. 2025, 47, 4668–4683. [Google Scholar] [CrossRef]
  41. Yang, X.; Qiao, Z.; Zhou, Y. IPAD: Iterative, Parallel, and Diffusion-Based Network for Scene Text Recognition. Int. J. Comput. Vis. 2025, 133, 5589–5609. [Google Scholar] [CrossRef]
  42. Li, H.; Wang, P.; Chunhua, S.; Zhang, G. Show, Attend and Read: A Simple and Strong Baseline for Irregular Text Recognition. In Proceedings of the AAAI Conference on Artificial Intelligence, Honolulu, HI, USA, 27 January–1 February 2019; pp. 8610–8617. [Google Scholar]
  43. Shi, B.; Yang, M.; Wang, X.; Lyu, P.; Yao, C.; Bai, X. ASTER: An Attentional Scene Text Recognizer with Flexible Rectification. IEEE Trans. Pattern Anal. Mach. Intell. 2019, 41, 2035–2048. [Google Scholar] [CrossRef]
  44. Sheng, F.; Chen, Z.; Xu, B. NRTR: A No-Recurrence Sequence-to-Sequence Model for Scene Text Recognition. In Proceedings of the 2019 International Conference on Document Analysis and Recognition (ICDAR), Sydney, Australia, 20–25 September 2019; pp. 781–786. [Google Scholar]
  45. Bautista, D.; Atienza, R. Scene Text Recognition with Permuted Autoregressive Sequence Models. In Proceedings of the Computer Vision—ECCV 2022; Springer Nature Switzerland: Cham, Switzerland, 2022; pp. 178–196. [Google Scholar]
  46. Zhu, Y.; Zhang, Y.; Guo, S. NAText: Faster Scene Text Recognition with Non Autoregressive Transformer. In Proceedings of the Thirteenth International Conference on Learning Representations (ICLR), Singapore, 24–28 April 2025. [Google Scholar]
  47. Fang, S.; Xie, H.; Wang, Y.; Mao, Z.; Zhang, Y. Read like Humans: Autonomous, Bidirectional and Iterative Language Modeling for Scene Text Recognition. In Proceedings of the IEEE/CVF Conference on Computer Vision and Pattern Recognition (CVPR), Virtual, 19–25 June 2021; pp. 7098–7107. [Google Scholar]
  48. Wang, J.; Liu, H.; Zhang, Y.; Chen, X. LS-MambaNet: Integrating Large Strip Convolution and Mamba Network for Remote Sensing Object Detection. Remote Sens. 2024, 17, 1721. [Google Scholar]
  49. Zhang, W.; Li, Q.; Sun, Y.; Wang, L. A Predictive Model for Voltage Transformer Ratio Error Considering Load Variations. World Electr. Veh. J. 2024, 15, 269. [Google Scholar] [CrossRef]
  50. Karatzas, D.; Gomez-Bigorda, L.; Nicolaou, A.; Ghosh, S.; Bagdanov, A.; Iwamura, M.; Matas, J.; Neumann, L.; Chandrasekhar, V.R.; Lu, S.; et al. ICDAR 2015 Competition on Robust Reading. In Proceedings of the 2015 13th International Conference on Document Analysis and Recognition (ICDAR), Tunis, Tunisia, 23–26 August 2015; pp. 1156–1160. [Google Scholar]
  51. Karthick, K.; Ravindrakumar, K.; Francis, R.; Iyer, S. Text Detection and Recognition in Raw Image Dataset of Seven Segment Digital Energy Meter Display. Data Brief 2019, 24, 103918. [Google Scholar]
  52. Zheng, T.; Chen, Z.; Fang, S.; Xie, H.; Jiang, Y.-G. CDistNet: Perceiving Multi-Domain Character Distance for Robust Text Recognition. Int. J. Comput. Vis. 2024, 132, 300–318. [Google Scholar] [CrossRef]
  53. Wei, J.; Zhan, H.; Lu, Y.; Tu, X.; Yin, B.; Liu, C.; Pal, U. Image as a Language: Revisiting Scene Text Recognition via Balanced, Unified and Synchronized Vision-Language Reasoning Network. Proc. AAAI Conf. Artif. Intell. 2024, 38, 5885–5893. [Google Scholar] [CrossRef]
  54. Xu, J.; Wang, Y.; Xie, H.; Zhang, Y. OTE: Exploring Accurate Scene Text Recognition Using One Token. In Proceedings of the IEEE/CVF Conference on Computer Vision and Pattern Recognition (CVPR), Seattle, WA, USA, 16–22 June 2024; pp. 28327–28336. [Google Scholar]
  55. Du, Y.; Chen, Z.; Xie, H.; Jia, C.; Jiang, Y.-G. SVTRv2: CTC Beats Encoder-Decoder Models in Scene Text Recognition. arXiv 2024, arXiv:2411.15858. [Google Scholar] [CrossRef]
  56. Liu, Y.; Chen, H.; Shen, C.; Tian, T.; He, Y.; Wang, Y.; Xie, X. DenseTextPVT: Pyramid Vision Transformer with Deep Multi-Scale Feature Refinement Network for Dense Text Detection. Sensors 2023, 23, 5889. [Google Scholar]
  57. Li, M.; Lv, T.; Chen, J.; Cui, L.; Lu, Y.; Florencio, D.; Zhang, C.; Li, Z.; Wei, F. TrOCR: Transformer-Based Optical Character Recognition with Pre-Trained Models. Proc. AAAI Conf. Artif. Intell. 2023, 37, 13094–13102. [Google Scholar] [CrossRef]
Figure 1. Power cabinet application scenarios and text sample examples: (i) Real-time operational parameters displayed on power cabinet screens, including voltage, current, and power readings with extreme scale variations (character heights ranging from 8 px to 60 px). (ii) Static and dynamic data such as equipment labels and alarm codes demonstrating complex tabular layouts and domain-specific terminology. Labels (i) and (ii) indicate sequential aspects within a single figure and are not subfigures.
Electronics 14 03315 g001
Figure 2. The overall architecture of our proposed SACC algorithm. It consists of three modules, including MAF-Detector, SA-ViT and DCDecoder. (i) The process begins with an original power cabinet image, which is fed into the MAF-Detector to accurately locate all text instances, even under challenging conditions with extreme scale variations. (ii) The detected text regions are then cropped and passed to the SA-ViT module, which leverages a dual-branch architecture to extract and fuse both visual features and explicit structural features. (iii) Finally, the DCDecoder integrates domain-specific knowledge (e.g., numerical ranges and a technical lexicon) to perform constrained decoding, correcting errors and outputting highly accurate and reliable structured text results. SA-ViT injects graph-constructed structural semantics into mixed positional encodings and performs cross-modal attention with visual features. Labels (i)–(iii) indicate sequential stages and are not subfigures. (“电源柜1-21屏” (Power Cabinet 1-21 Panel) and “负责人: 值班员” (Responsible Person: Duty Operator)).
Electronics 14 03315 g002
Figure 3. The detailed architecture of the Multi-scale Adaptive Fusion Detector (MAF-Detector). (i) Feature Extraction: A backbone network extracts multi-level feature maps from the input image. (ii) Multi-scale Fusion Neck: The standard Feature Pyramid Network (FPN) is enhanced by our proposed Multi-Head Dilated Convolution Module. This module utilizes parallel dilated convolutions with varying rates to capture diverse contextual information and adaptively fuses these multi-scale features. (iii) Attention Refinement: A Spatio-Channel Attention Module is applied to the fused features to selectively amplify text-relevant information while suppressing background noise. (iv) Detection Head: A dual-branch head takes the refined features to perform simultaneous text/non-text classification and precise quadrilateral bounding box regression. Labels indicate ordered steps within the figure and are not subfigures.
Electronics 14 03315 g003
Figure 4. The architecture of the Structure-Aware Vision Transformer (SA-ViT) module. It consists of two pipelines. (i) Visual Feature Stream: Following the standard Vision Transformer (ViT) pipeline, this stream divides the input text image into patches and projects them into a sequence of visual tokens to capture appearance features. (ii) Structural Feature Stream: A spatial graph is constructed from the image patches, where nodes represent patches and edges represent their spatial adjacency. A Graph Convolutional Network (GCN) then learns structural embeddings that explicitly encode the topological and layout information. The features from both streams are fused via a mixed position encoding scheme and processed by a Transformer Encoder, enabling the model to understand not just what the text says, but also where it is structurally positioned relative to other text. Labels (i) and (ii) are descriptive markers rather than subfigure tags. (“A10-03屏-2KA” (equipment ID), “负电源开关” (Negative Power Switch) and “总电源开关” (Main Power Switch)).
Electronics 14 03315 g004
Figure 5. Qualitative comparison between SACC and state-of-the-art methods on the PCSTD dataset. Green and pink boxes indicate zoomed regions for a detailed comparison. (“供电屏” (Power Supply Panel), “电源柜1-21” (Power Cabinet 1-21 Panel), “负责人: 值班员” (Responsible Person: Duty Operator), and “A相/B相/C相” (Phase A/B/C)).
Electronics 14 03315 g005
Figure 6. Qualitative comparison between SACC and state-of-the-art methods on the ICDAR 2015 dataset for generalization evaluation. Yellow and pink boxes indicate zoomed regions for a detailed comparison. (“扬尘实时在线监测” (Real-time Dust Monitoring Online) and “噪声” (Noise)).
Electronics 14 03315 g006
Figure 7. Comparison of text recognition results on YUVA EB dataset across different methods.
Electronics 14 03315 g007
Figure 8. Ablation study results showing the incremental performance of each module (MAF-Detector, SA-ViT, DCDecoder) on the PCSTD dataset. Green and pink boxes indicate zoomed regions for a detailed comparison.
Electronics 14 03315 g008
Figure 9. SA-ViT attention visualization under different entropy values.
Electronics 14 03315 g009
Table 1. Quantitative performance comparison of different methods on the PCSTD test set. docTR represents the best-performing modular configuration (DBNet detection + CRNN recognition) from the framework, while LayoutLMv3’s results are obtained through fine-tuning on PCSTD’s training set while preserving the core multimodal architecture. Evaluation protocol is as follows: batch size = 1; latency = 1000/FPS; AMP usage and the inclusion of pre/post-processing are clarified in captions; peak memory via torch.cuda.max_memory_allocated(); and hardware/software versions disclosed in the section with implementation details. Cross-paper values are referenced from original sources and not re-measured here.
MethodRec.Prec.F1C-AccW-AccParamsFPS
(%)(%)(%)(%)(%)(M)
docTR (DBNet+CRNN) [25]68.965.267.081.273.847.235
LayoutLMv3 [26]69.566.167.882.174.2133.118
CDistNet [52]63.963.864.976.265.165.527
CAM [17]60.165.465.279.369.713512
BUSNet [53]70.867.968.381.573.256.828
OTE [54]71.264.270.879.671.825.255
SVTR-v2 [55]72.468.571.283.476.919.8143
SACC (Ours)75.670.373.186.582.349.633
Table 2. Comparison with recent OCR methods on industrial text recognition tasks.
MethodC-AccW-AccSERFPSParamsApplication
(%)(%)(%) (M)
CRNN+CTC [18]79.372.811.2458.3General
ABINet [47]81.776.49.82837.2Scene
PARSeq [45]83.278.68.43523.8Irregular
DenseTextPVT [56]84.379.87.62841.5Dense
TrOCR [57]82.977.29.11862.7Document
SACC (Ours)86.582.34.23349.6Industrial
Table 3. Performance comparison on the YUVA EB dataset for seven-segment display recognition. Evaluation metrics include segment-level accuracy (Seg-Acc) specific to seven-segment displays, measuring the correct identification of individual segments within each digit.
MethodRec.Prec.F1C-AccS-AccParamsFPS
(%)(%)(%)(%)(%)(M)
docTR (DBNet+CRNN) [25]73.871.572.681.783.647.235
LayoutLMv3 [26]74.272.173.182.384.1133.118
CDistNet [52]68.566.267.377.880.265.527
CAM [17]67.368.167.780.281.5135.012
BUSNet [53]73.270.571.882.183.256.828
OTE [54]72.868.970.880.382.125.255
SVTR-v2 [55]76.974.375.685.186.819.8143
SACC (Ours)79.476.878.188.390.249.633
Table 4. Performance comparison on ICDAR 2015 dataset for general scene text recognition. This evaluation demonstrates SACC’s cross-domain generalization from industrial monitoring to natural scene text.
MethodRec.Prec.F1C-AccW-AccParamsFPS
(%)(%)(%)(%)(%)(M)
docTR (DBNet+CRNN) [25]69.567.368.478.271.547.235
LayoutLMv3 [26]70.168.269.179.172.8133.118
CDistNet [52]65.264.164.674.367.265.527
CAM [17]63.866.265.077.570.9135.012
BUSNet [53]69.166.867.979.873.156.828
OTE [54]68.565.767.178.271.625.255
SVTR-v2 [55]73.270.872.081.775.319.8143
SACC (Ours)74.872.373.583.476.849.633
Table 5. MAF-Detector fusion weight distribution across different text scales (1000 samples).
Scale RangeSamplesw1 (r = 1)w3 (r = 3)w5 (r = 5)Dominant
Small (<15 px)2870.520.330.15r = 1 (Fine)
Medium (15–40 px)4380.350.420.23r = 3 (Balanced)
Large (>40 px)2010.230.310.46r = 5 (Global)
Mixed Scale740.340.380.28Adaptive
Average10000.360.360.28Dynamic
Table 6. Graph construction strategy comparison for SA-ViT on PCSTD testset (196 nodes per graph).
ConstructionEdges/NodeC-Acc (%)Time (ms)Mem. (MB)Tab.Acc (%)
8-Connected8.082.115.323478.4
K-Nearest (k = 6)6.083.712.819880.7
Semantic-Aware5.284.918.726783.2
Adaptive (Ours)4.886.521.228985.8
Table 7. Performance comparison from the ablation study of SACC’s core components.
ConfigurationRec.Prec.F1Acc.ParamsFPS
(%)(%)(%)(%)(M)
Baseline68.462.766.278.934.845
+MAF-Detector69.865.268.380.437.241
+SA-ViT70.368.471.583.143.536
Structured Document OCR Methods
docTR68.965.267.081.247.235
LayoutLMv369.566.167.882.1133.118
SACC75.670.373.186.549.633
Table 8. DCDecoder constraint mechanism effectiveness analysis (10,000 prediction samples).
ConstraintDetection (%)Correction (%)FP (%)Improve. (%)
Voltage Range94.287.32.1+3.8
Current Range91.785.61.8+3.2
Power Parameter89.884.12.8+2.7
Terminology Dict.96.891.20.9+4.7
Format Consistency89.383.73.2+2.9
Overall Average93.187.82.0+3.7
Table 9. Fault scenario discrimination performance on PCSTD test set.
Scenario TypeInstancesOCR Acc (%)Fault Preserved (%)F1-Score
Normal operation187291.3N/A0.912
Voltage anomaly (>242 V)31278.284.60.813
Current overload (>100 A)23481.579.50.805
Frequency deviation (±1 Hz)15685.788.50.871
Display error39076.412.80.536
Mixed fault15673.875.60.747
Table 10. Evolution of equipment parameter specifications across generations.
Parameter2010–20152016–20202021–2024IEC Ref.
Voltage Specifications (V)
DC Battery[24, 48][12, 48][12, 60]IEC 60038
AC Single-phase[198, 242][207, 253][207, 253]IEC 60038
AC Three-phase[342, 418][360, 440][360, 440]IEC 60038
Current Ratings (A)
Control Circuit[0, 16][0, 20][0, 25]IEC 60947
Power Circuit[0, 63][0, 80][0, 100]IEC 60947
Other Parameters
Frequency (Hz)[49.5, 50.5][49.5, 50.5][49.0, 51.0]IEC 61000
Power Factor[0.80, 1.00][0.85, 1.00][0.90, 1.00]IEC 61000
Table 11. Detailed computational efficiency analysis across different hardware platforms.
Hardware PlatformInferencePeak MemoryAvg MemoryPowerChar-Acc
Time (ms)(GB)(GB)(W)(%)
RTX 3090 (Desktop)30.32.11.835.286.5
Jetson Xavier NX35.71.91.615.286.1
Jetson AGX Xavier28.32.32.030.186.4
Intel NUC i742.12.82.228.786.2
Industrial PC31.22.52.145.386.5
Raspberry Pi 4156.81.21.08.184.7
Disclaimer/Publisher’s Note: The statements, opinions and data contained in all publications are solely those of the individual author(s) and contributor(s) and not of MDPI and/or the editor(s). MDPI and/or the editor(s) disclaim responsibility for any injury to people or property resulting from any ideas, methods, instructions or products referred to in the content.