To validate the effectiveness and generalization capability of our proposed SACC, we conducted extensive experiments on three complementary benchmarks: our custom PCSTD dataset for power cabinet text, ICDAR 2015 [
50] for natural scene text, and YUVA EB [
51] for industrial seven-segment displays. Ablation studies validate MAF-Detector, SA-ViT, and DCDecoder.
4.1. Datasets and Evaluation Protocols
We constructed PCSTD for power cabinet evaluation. The data were collected from real-world power inspection scenarios across multiple provinces in China, encompassing a wide variety of operational environments to ensure dataset diversity and representativeness. PCSTD covers UPS, DC/AC panels, and relays protection with LCD/LED text.
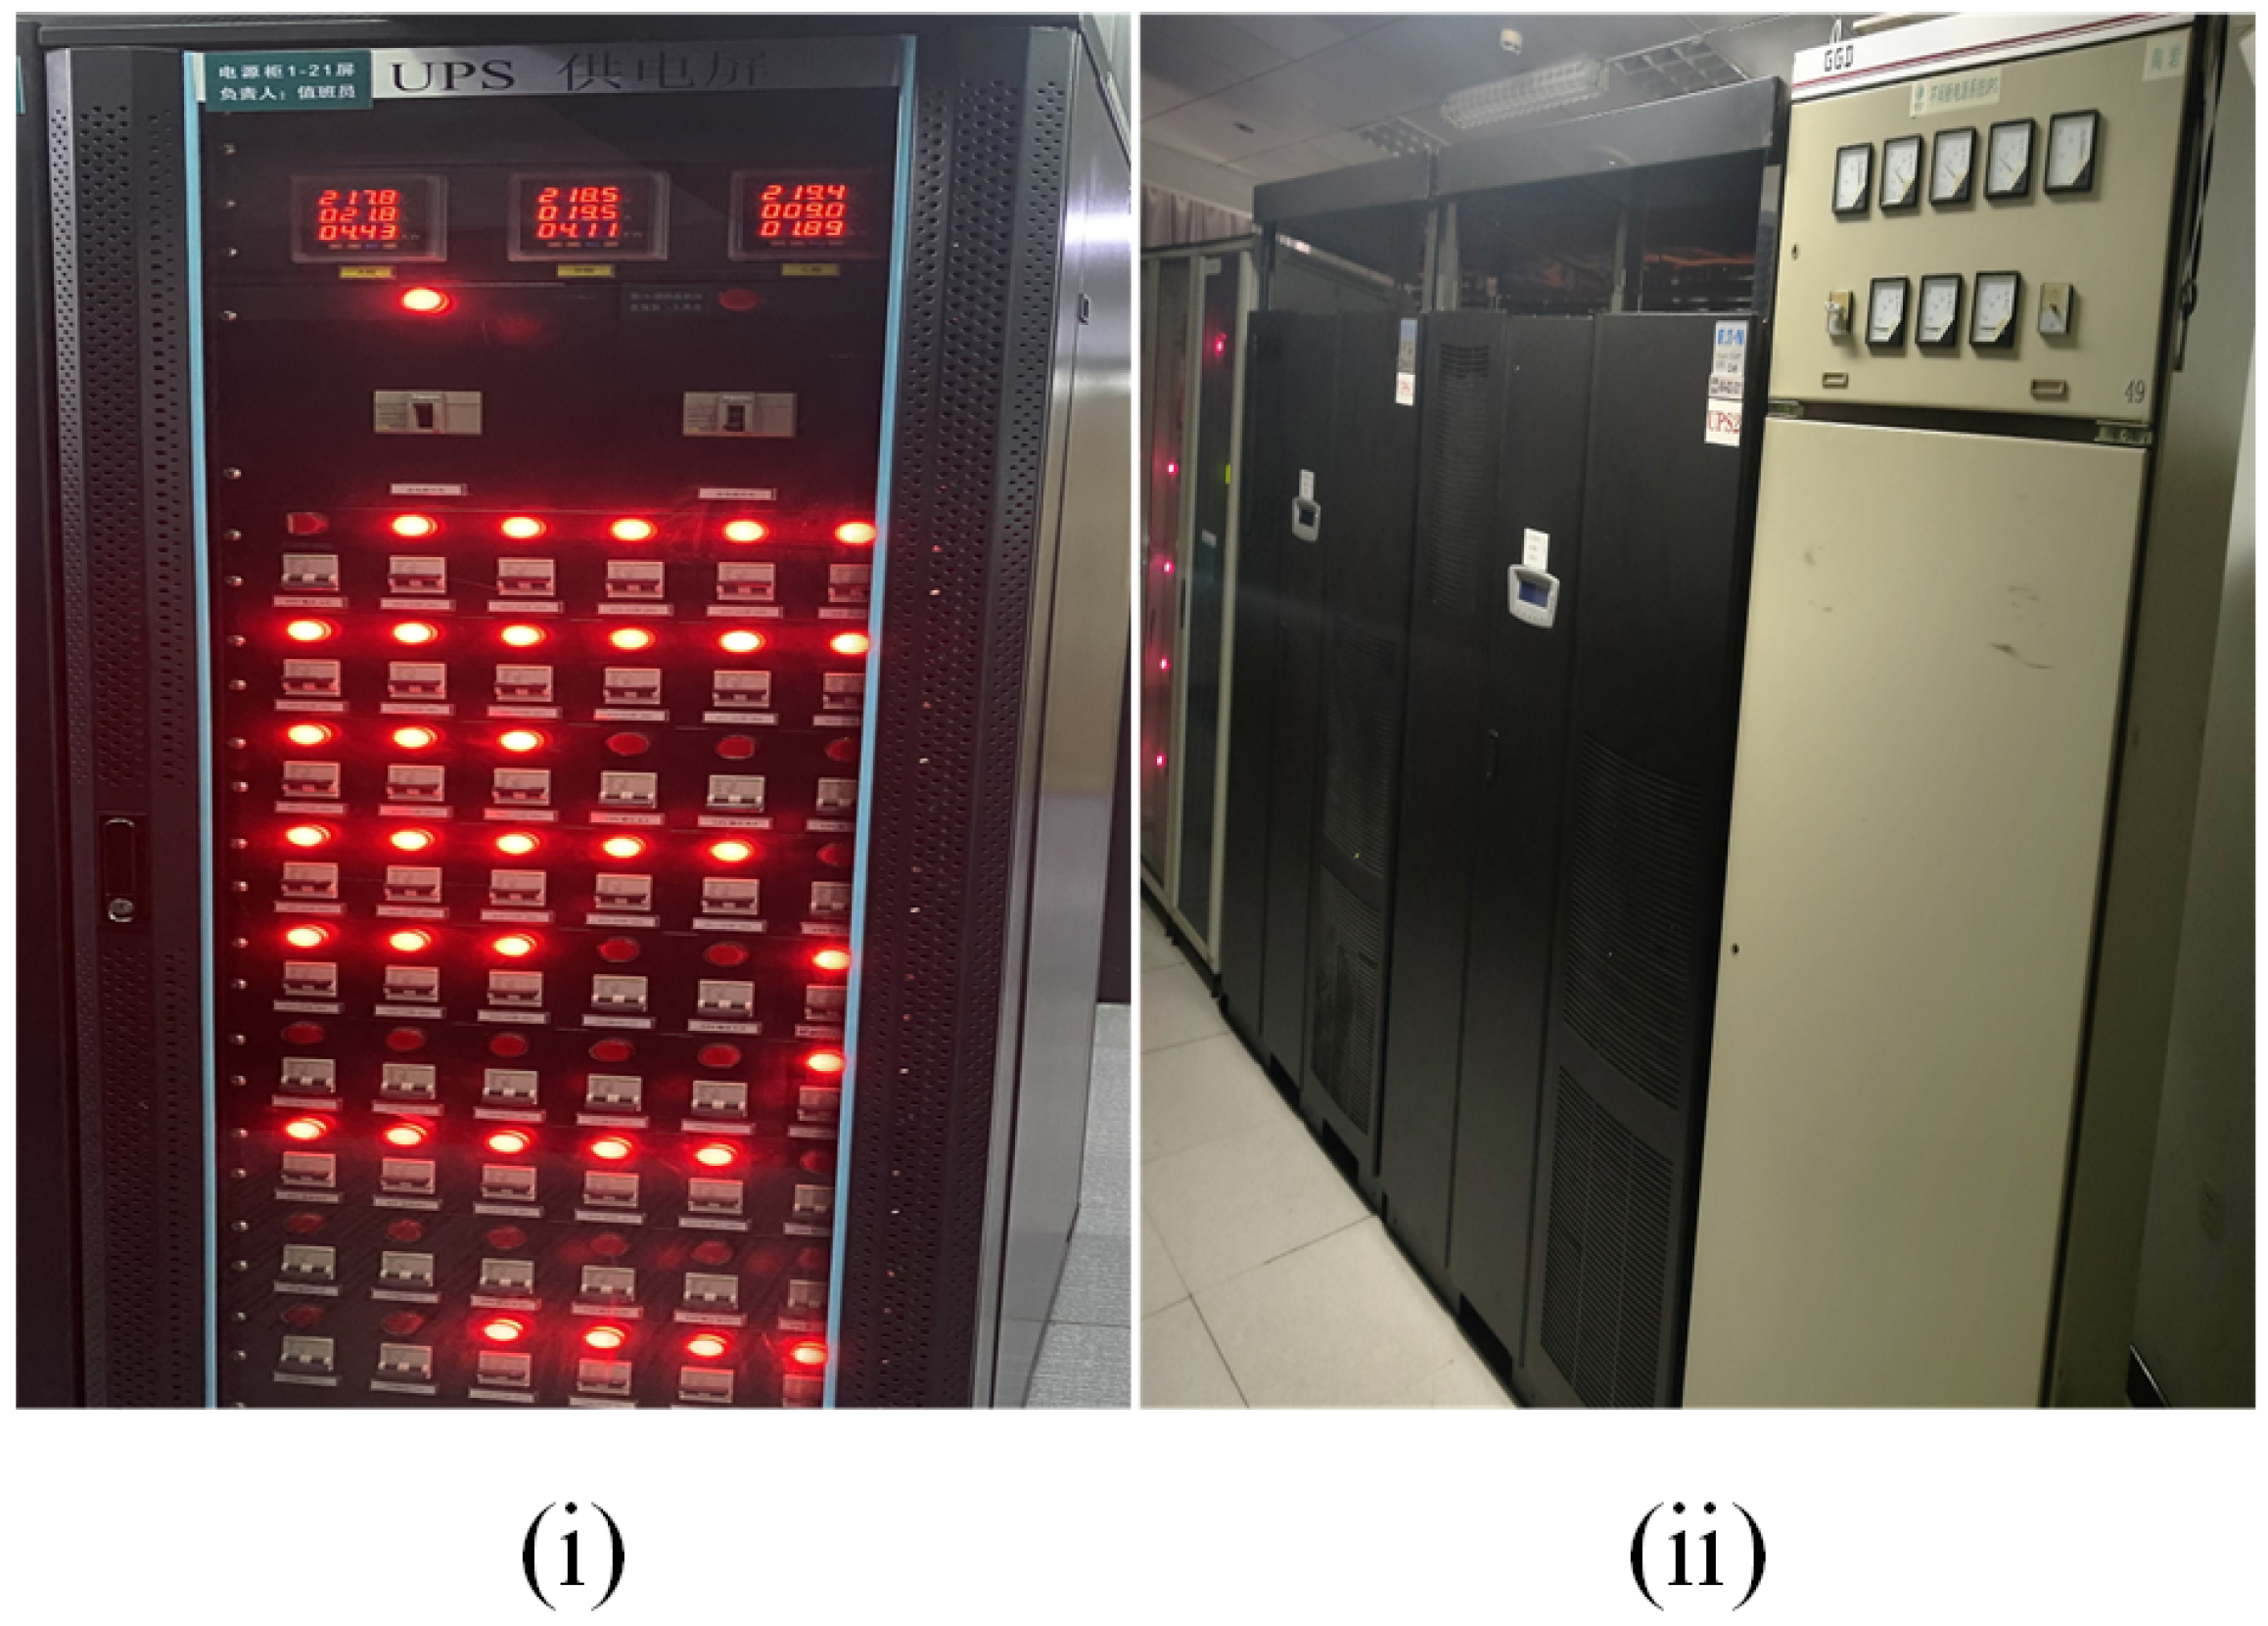
Data Collection Protocol: Images were captured using industrial-grade digital cameras (Canon EOS 5D Mark IV with 24–70 mm lens) under diverse lighting conditions to simulate real-world operational environments. Based on the cabinet types visible in
Figure 1, the dataset includes UPS monitoring cabinets (displaying battery voltage and current readings), DC power distribution panels (showing individual circuit breaker status), AC distribution cabinets (featuring three-phase voltage and current measurements), and relay protection panels (containing alarm codes and equipment status indicators). Viewing distances ranged from 0.5 m to 3 m, representing typical inspection distances used by maintenance personnel. Camera angles varied from frontal views to oblique angles (
and
) to account for practical constraints during field inspections.
Dataset Composition: The final PCSTD comprises 2000 high-resolution images (1920 × 1080 pixels) that were carefully selected to ensure quality and diversity. As evident from
Figure 1, each image contains multiple text instances with varying characteristics: large-scale equipment labels and section headers (character heights 40–60 pixels), medium-scale parameter names and units (character heights 15–25 pixels), and small-scale numerical readings and status codes (character heights 8–12 pixels). The extreme scale variation ratio of 7.5:1 between the largest and smallest text elements (60 px vs. 8 px) imposes a stringent challenge for conventional detection methods.
Annotation Protocol: Text regions were manually annotated using rectangular bounding boxes with the LabelImg tool, which provides efficient annotation for text detection tasks. Each text region was delineated with axis-aligned rectangles defined by four corner coordinates (x1, y1, x2, y2). For tilted or skewed text instances commonly found on LCD/LED displays, bounding boxes were drawn to tightly enclose the text with minimal background inclusion (maximum 3-pixel tolerance). Each text instance was labeled with its corresponding transcription, bounding box coordinates, and semantic category (numerical parameter, equipment label, status indicator, alarm code). The annotation format follows the PASCAL VOC XML schema, ensuring compatibility with standard OCR training pipelines. The annotation process was performed by certified electrical technicians with over 5 years of power system maintenance experience to ensure technical accuracy and domain knowledge compliance.
The final dataset comprises 2000 high-quality images, which were randomly partitioned into training (1600 images, 80%), validation (200 images, 10%), and test (200 images, 10%) sets. Beyond PCSTD, we evaluate on ICDAR 2015 [
50] for scene text recognition and YUVA EB [
51] for seven-segment display recognition, ensuring comprehensive cross-domain validation.
The evaluation metrics were as follows: For text detection, we adopted standard metrics from object detection, i.e., precision, recall, and F1-score, calculated using the standard IoU threshold of 0.5. Recognition: character accuracy (Char-Acc), Word Accuracy (Word-Acc), and Symbol Error Rate (SER). Efficiency: Parameters (M), FPS.
4.2. Implementation Details
The SACC framework was implemented in PyTorch 1.9.0. Training employed Adam optimizer (, ) with initial learning rate and cosine annealing schedule. Models were trained for 100 epochs using batch size 8, with gradient clipping (norm threshold 1.0) and early stopping (patience 10 epochs on validation loss). Random seed was fixed at 42 for reproducibility. Loss weights were set as detection/recognition/constraint = 1:2:0.5. Data augmentation included rotation (), brightness adjustment (), and perspective transformation ().
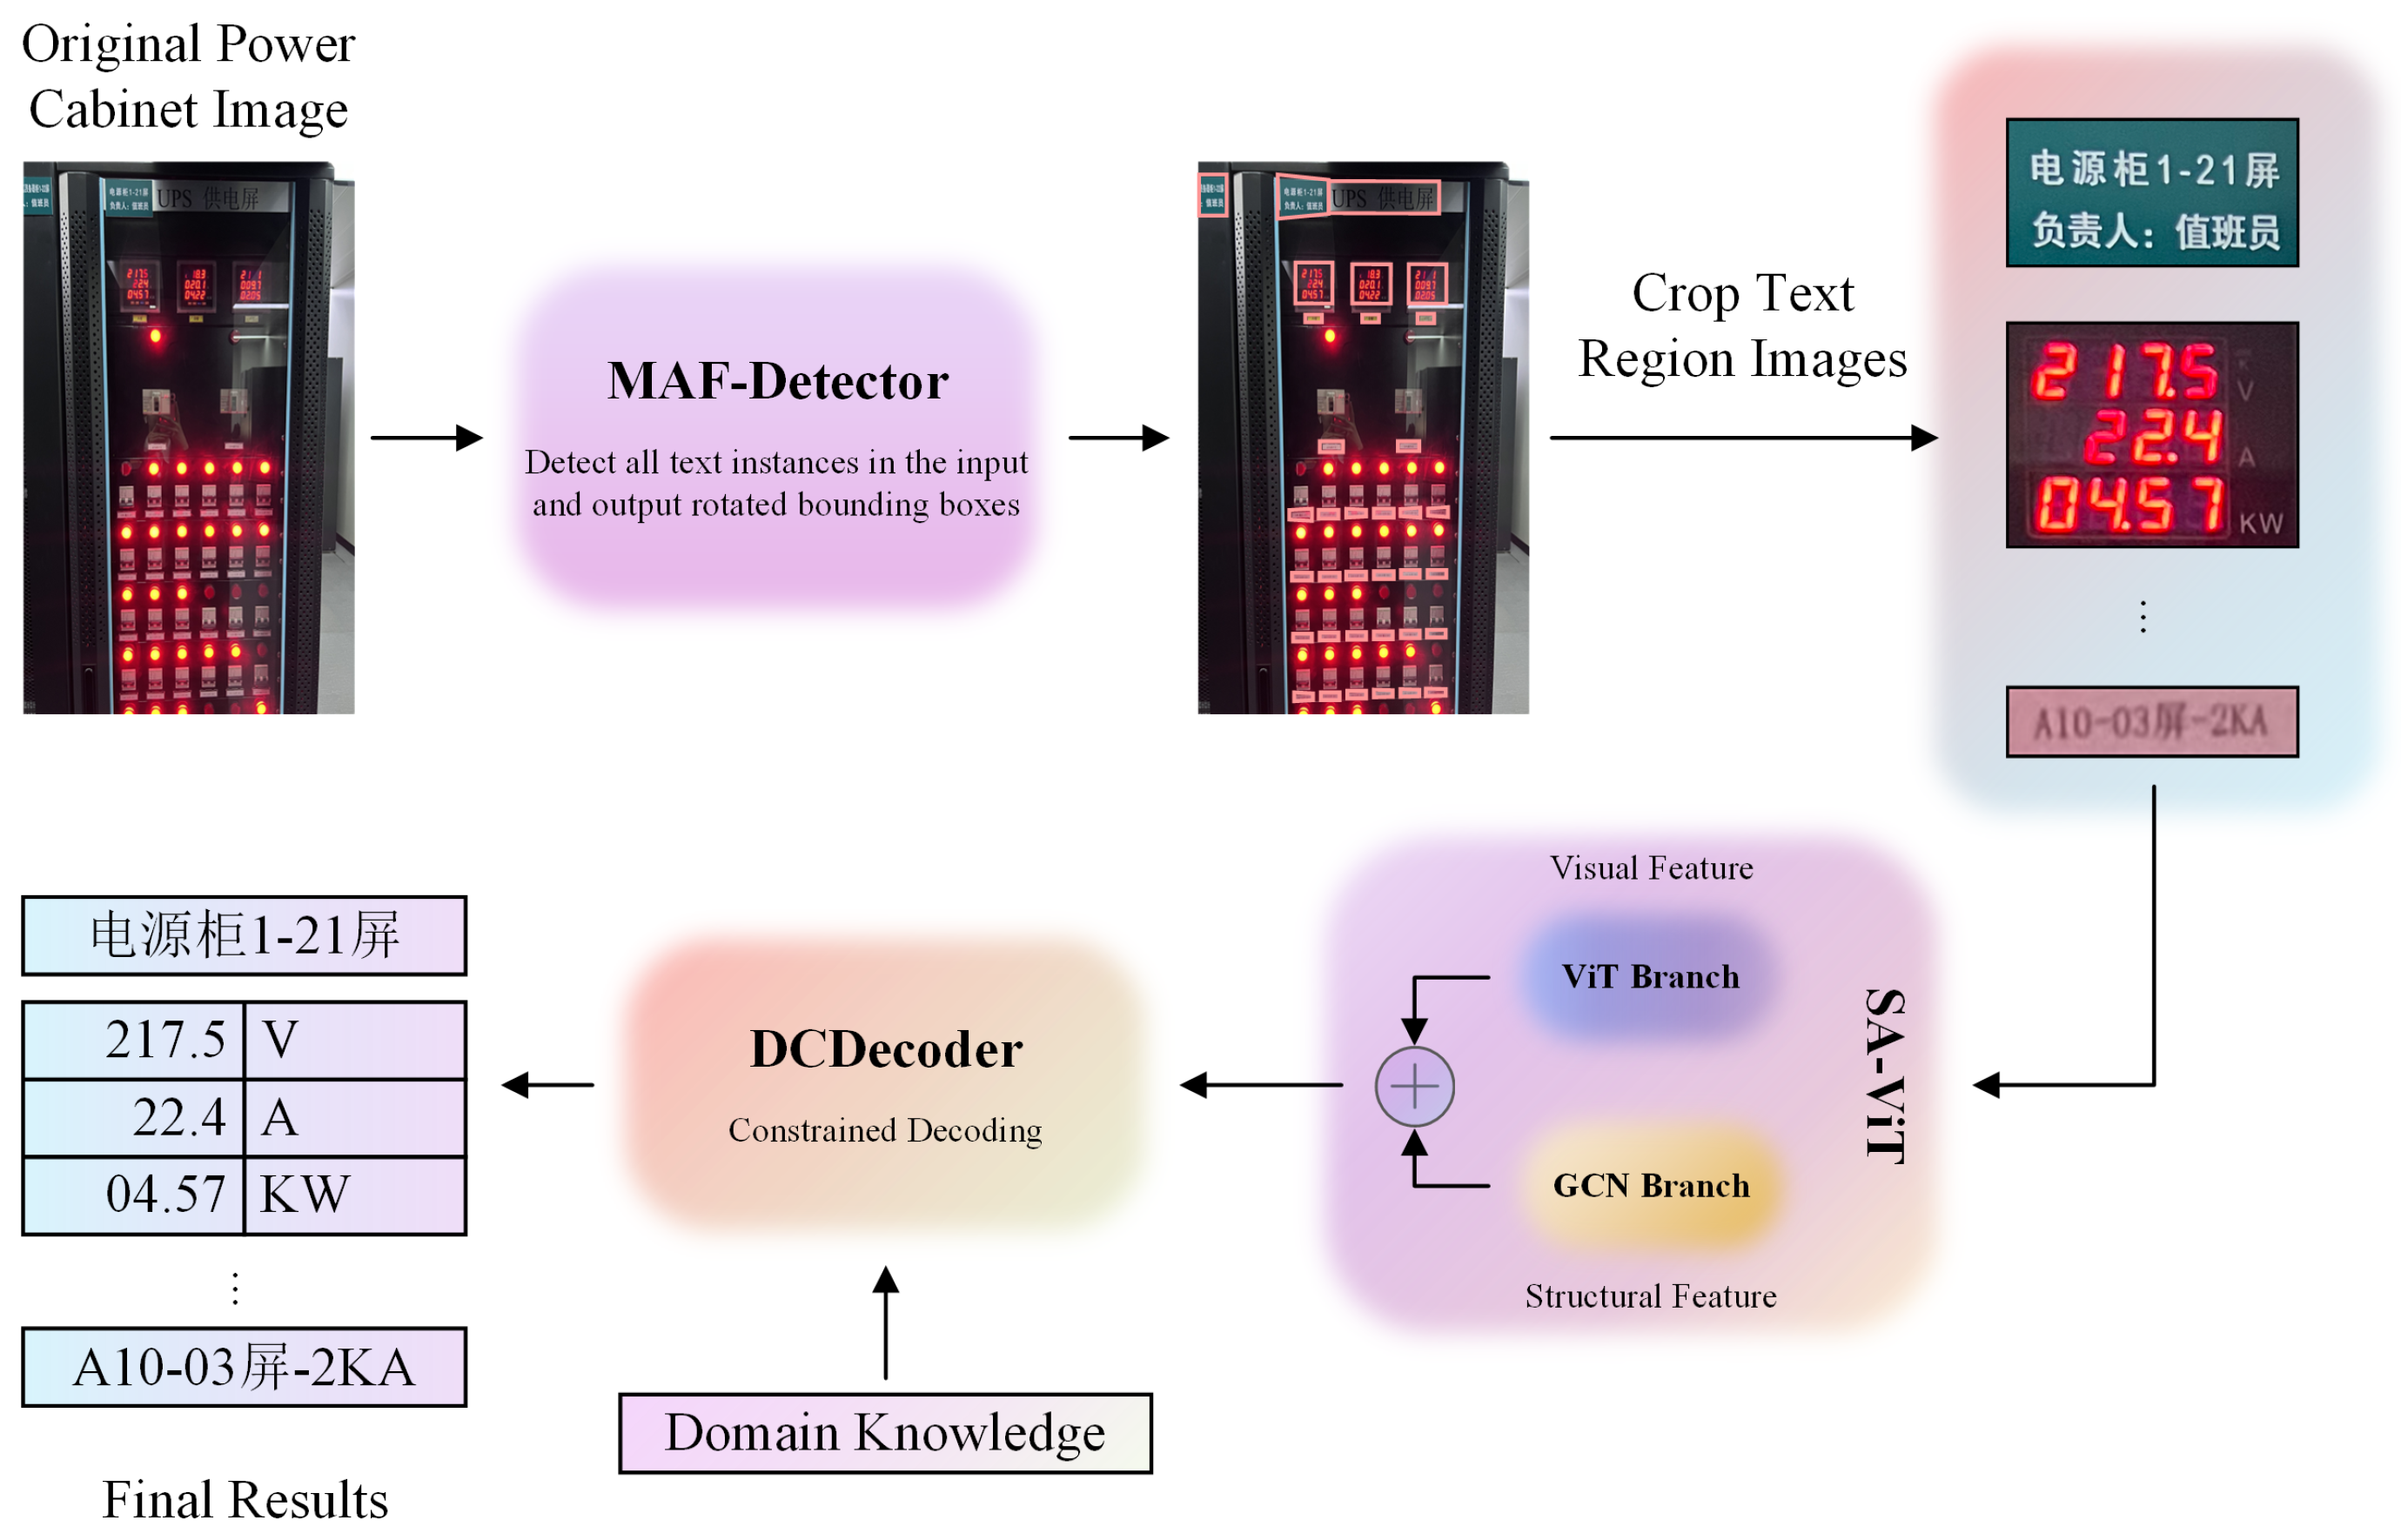
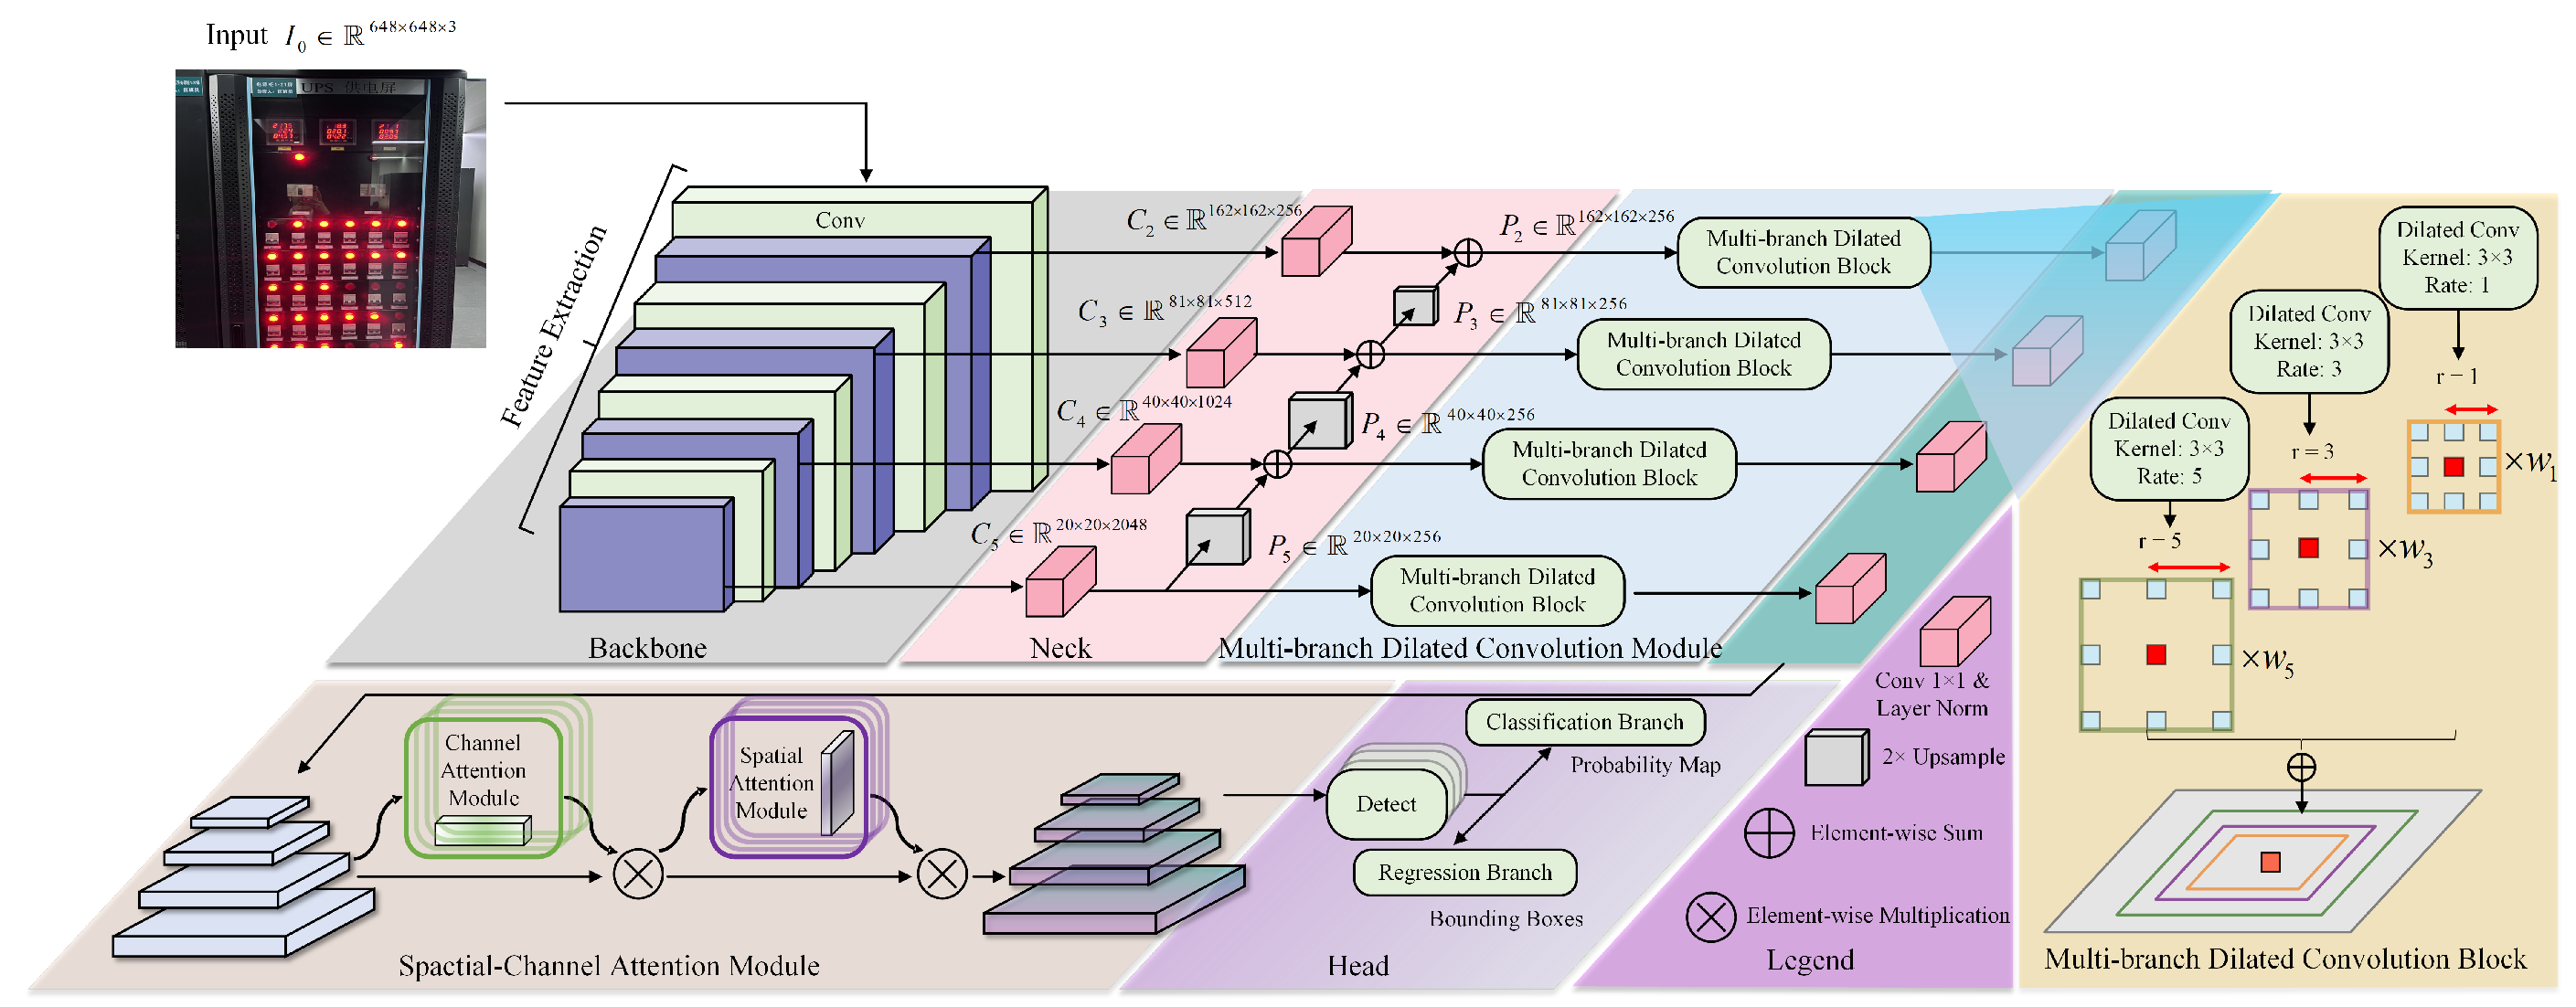
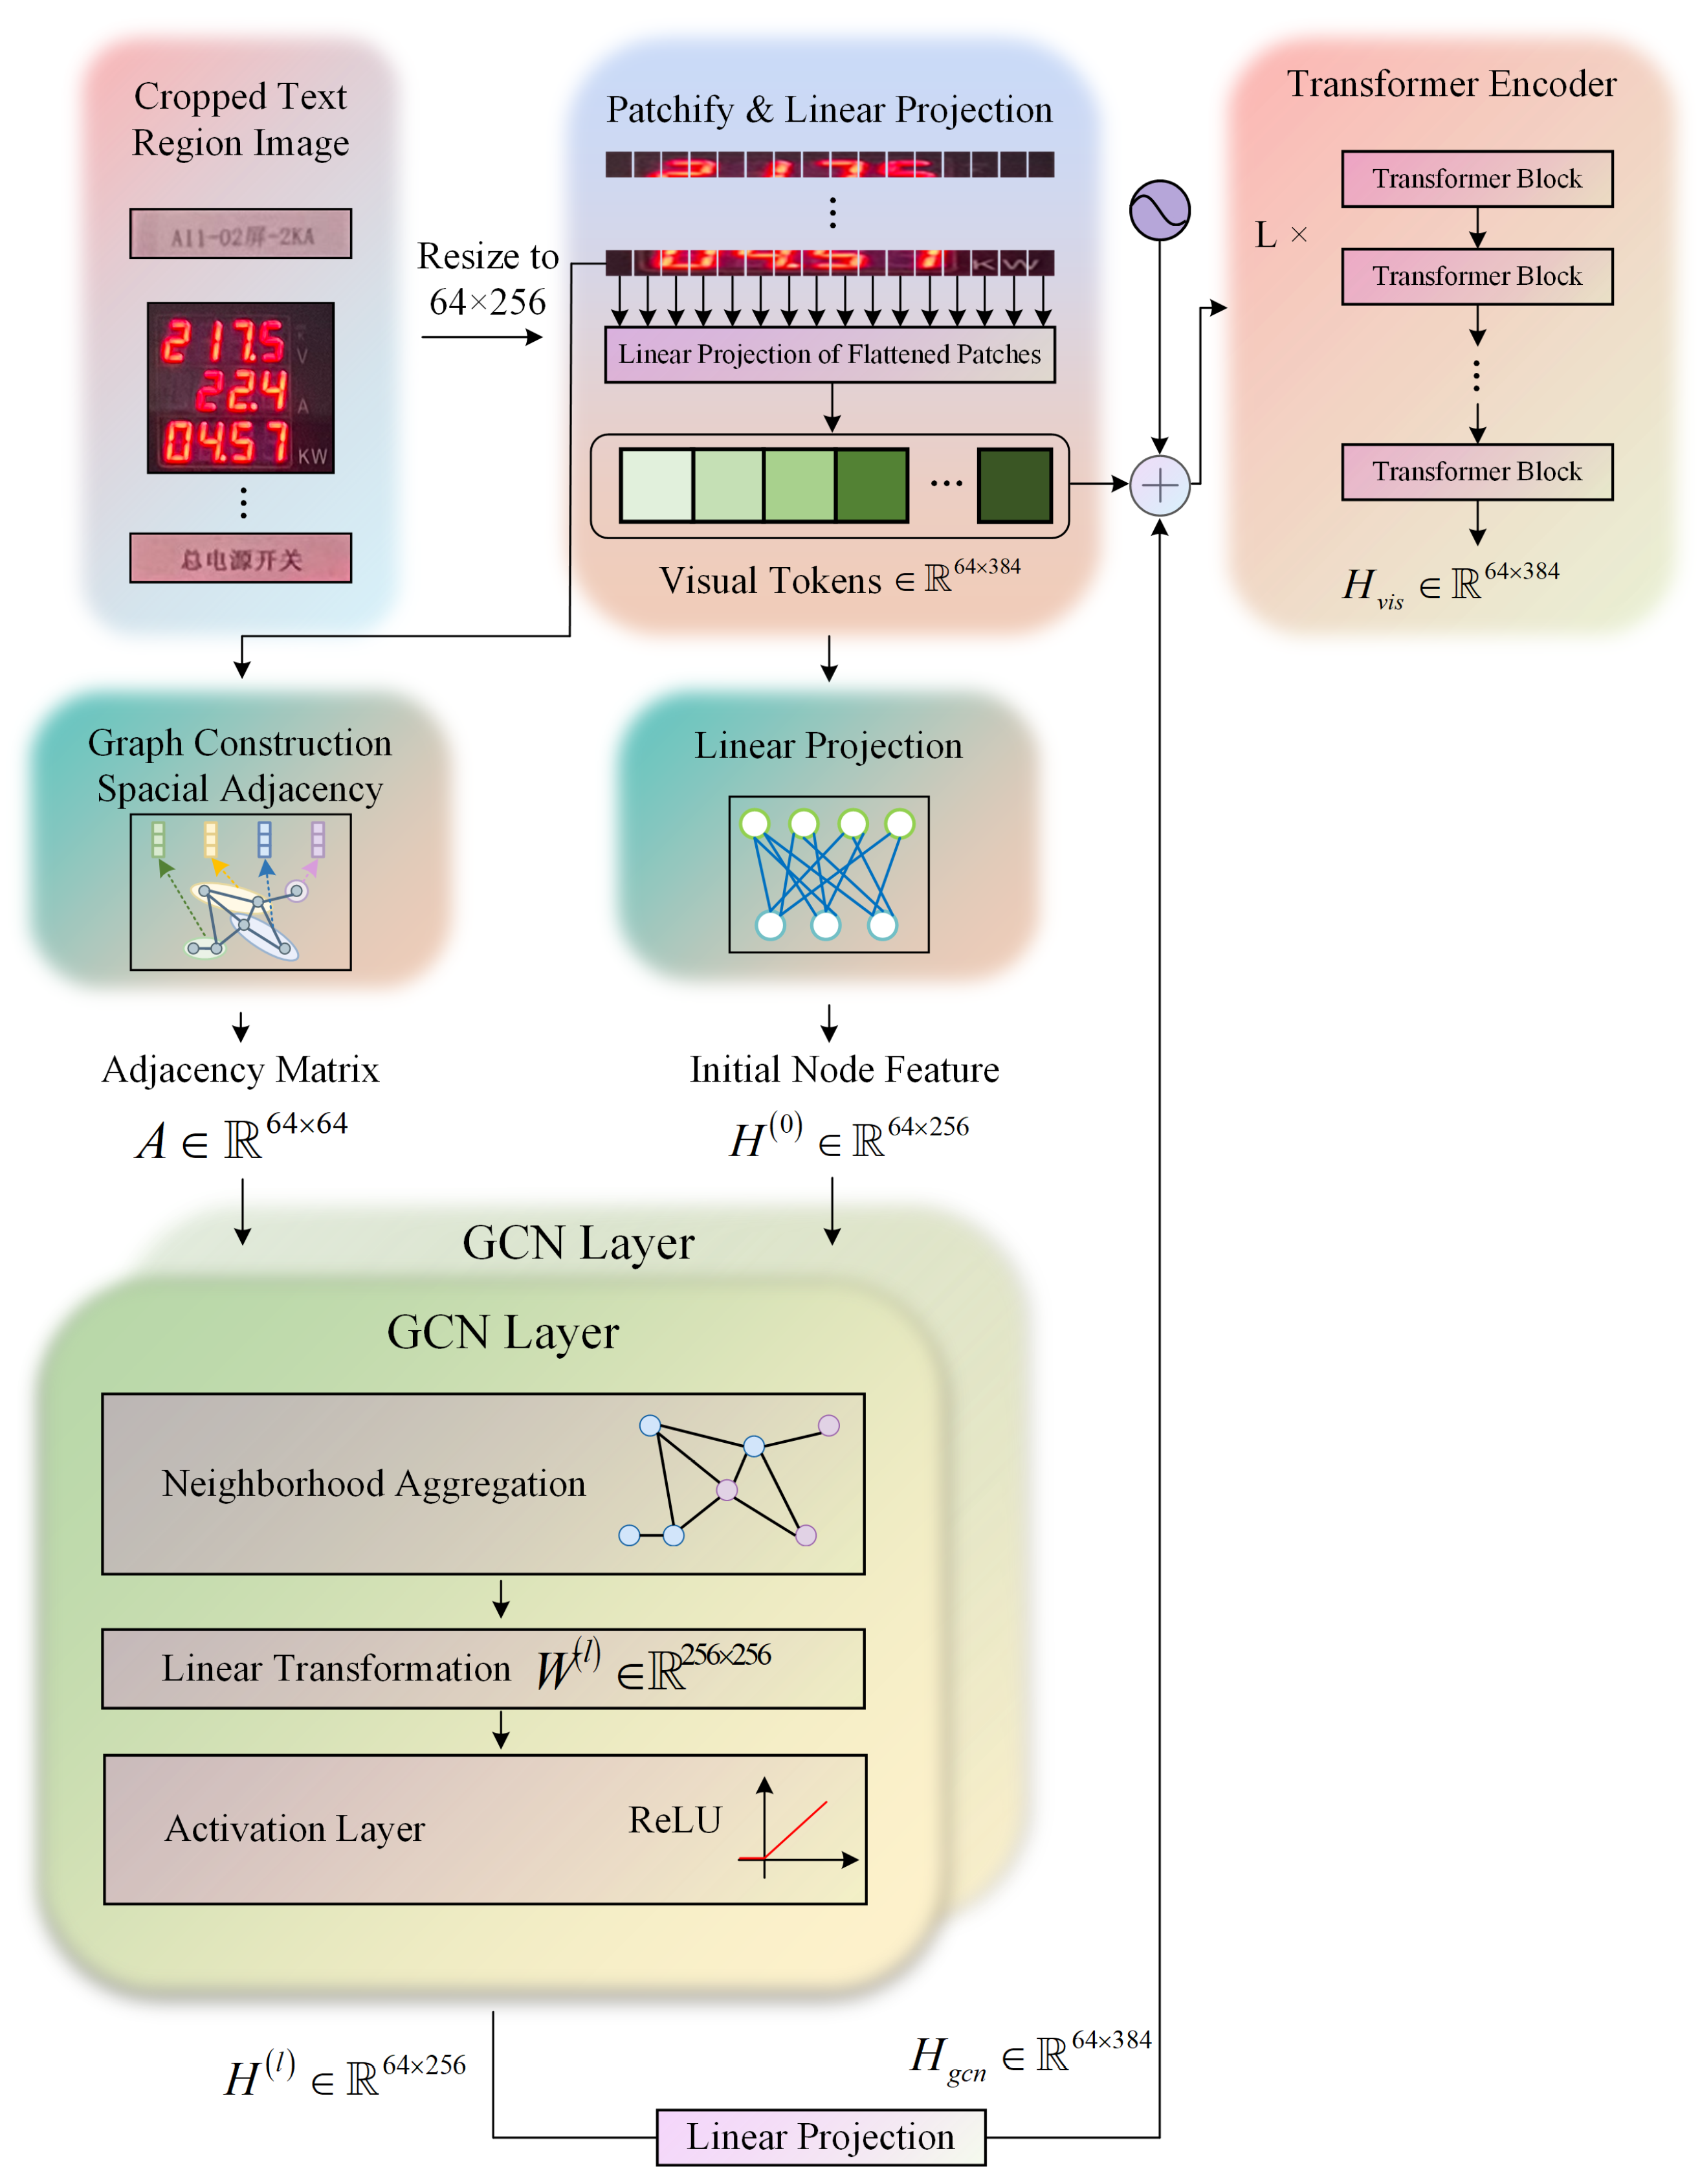
Architecture parameters were configured as follows: MAF-Detector utilized dilation rates {1, 3, 5} with learnable fusion weights; SA-ViT employed 16 × 16 pixel patches and a 2-layer GCN with 8-head attention; DCDecoder incorporated 1847 technical terms from GB/T 2900 standards and domain-specific constraints (DC: 12–48 V, AC single-phase: 200–240 V, three-phase: 380–420 V, current: 0–100 A).
The complete model comprises 49.6 M parameters and requires 5.8 GFLOPs per 1536 × 1024 image (MAF-Detector: 2.1 G, SA-ViT: 3.2 G, DCDecoder: 0.5 G), achieving 48% computational reduction compared to LayoutLMv3. Training on RTX 3090 (24 GB) required approximately 12 h for the PCSTD dataset. Inference achieves 33 FPS with 3.2 GB peak memory consumption. Evaluation Protocol: Metrics are reported with a batch size of 8 for consistency with training, except latency measurements, which use a batch size of 1 for real-time assessment. Mixed precision (AMP) was enabled throughout. Platform specifications were as follows: RTX 3090, Intel i9-10900K, 64 GB RAM, Ubuntu 20.04, CUDA 11.8, cuDNN 8.7.0, and PyTorch 1.13.1. Detection input: 1536 × 1024; recognition input: 32 × 128 per crop.
4.3. Comparison with State-of-the-Art Methods
4.3.1. Qualitative Analysis
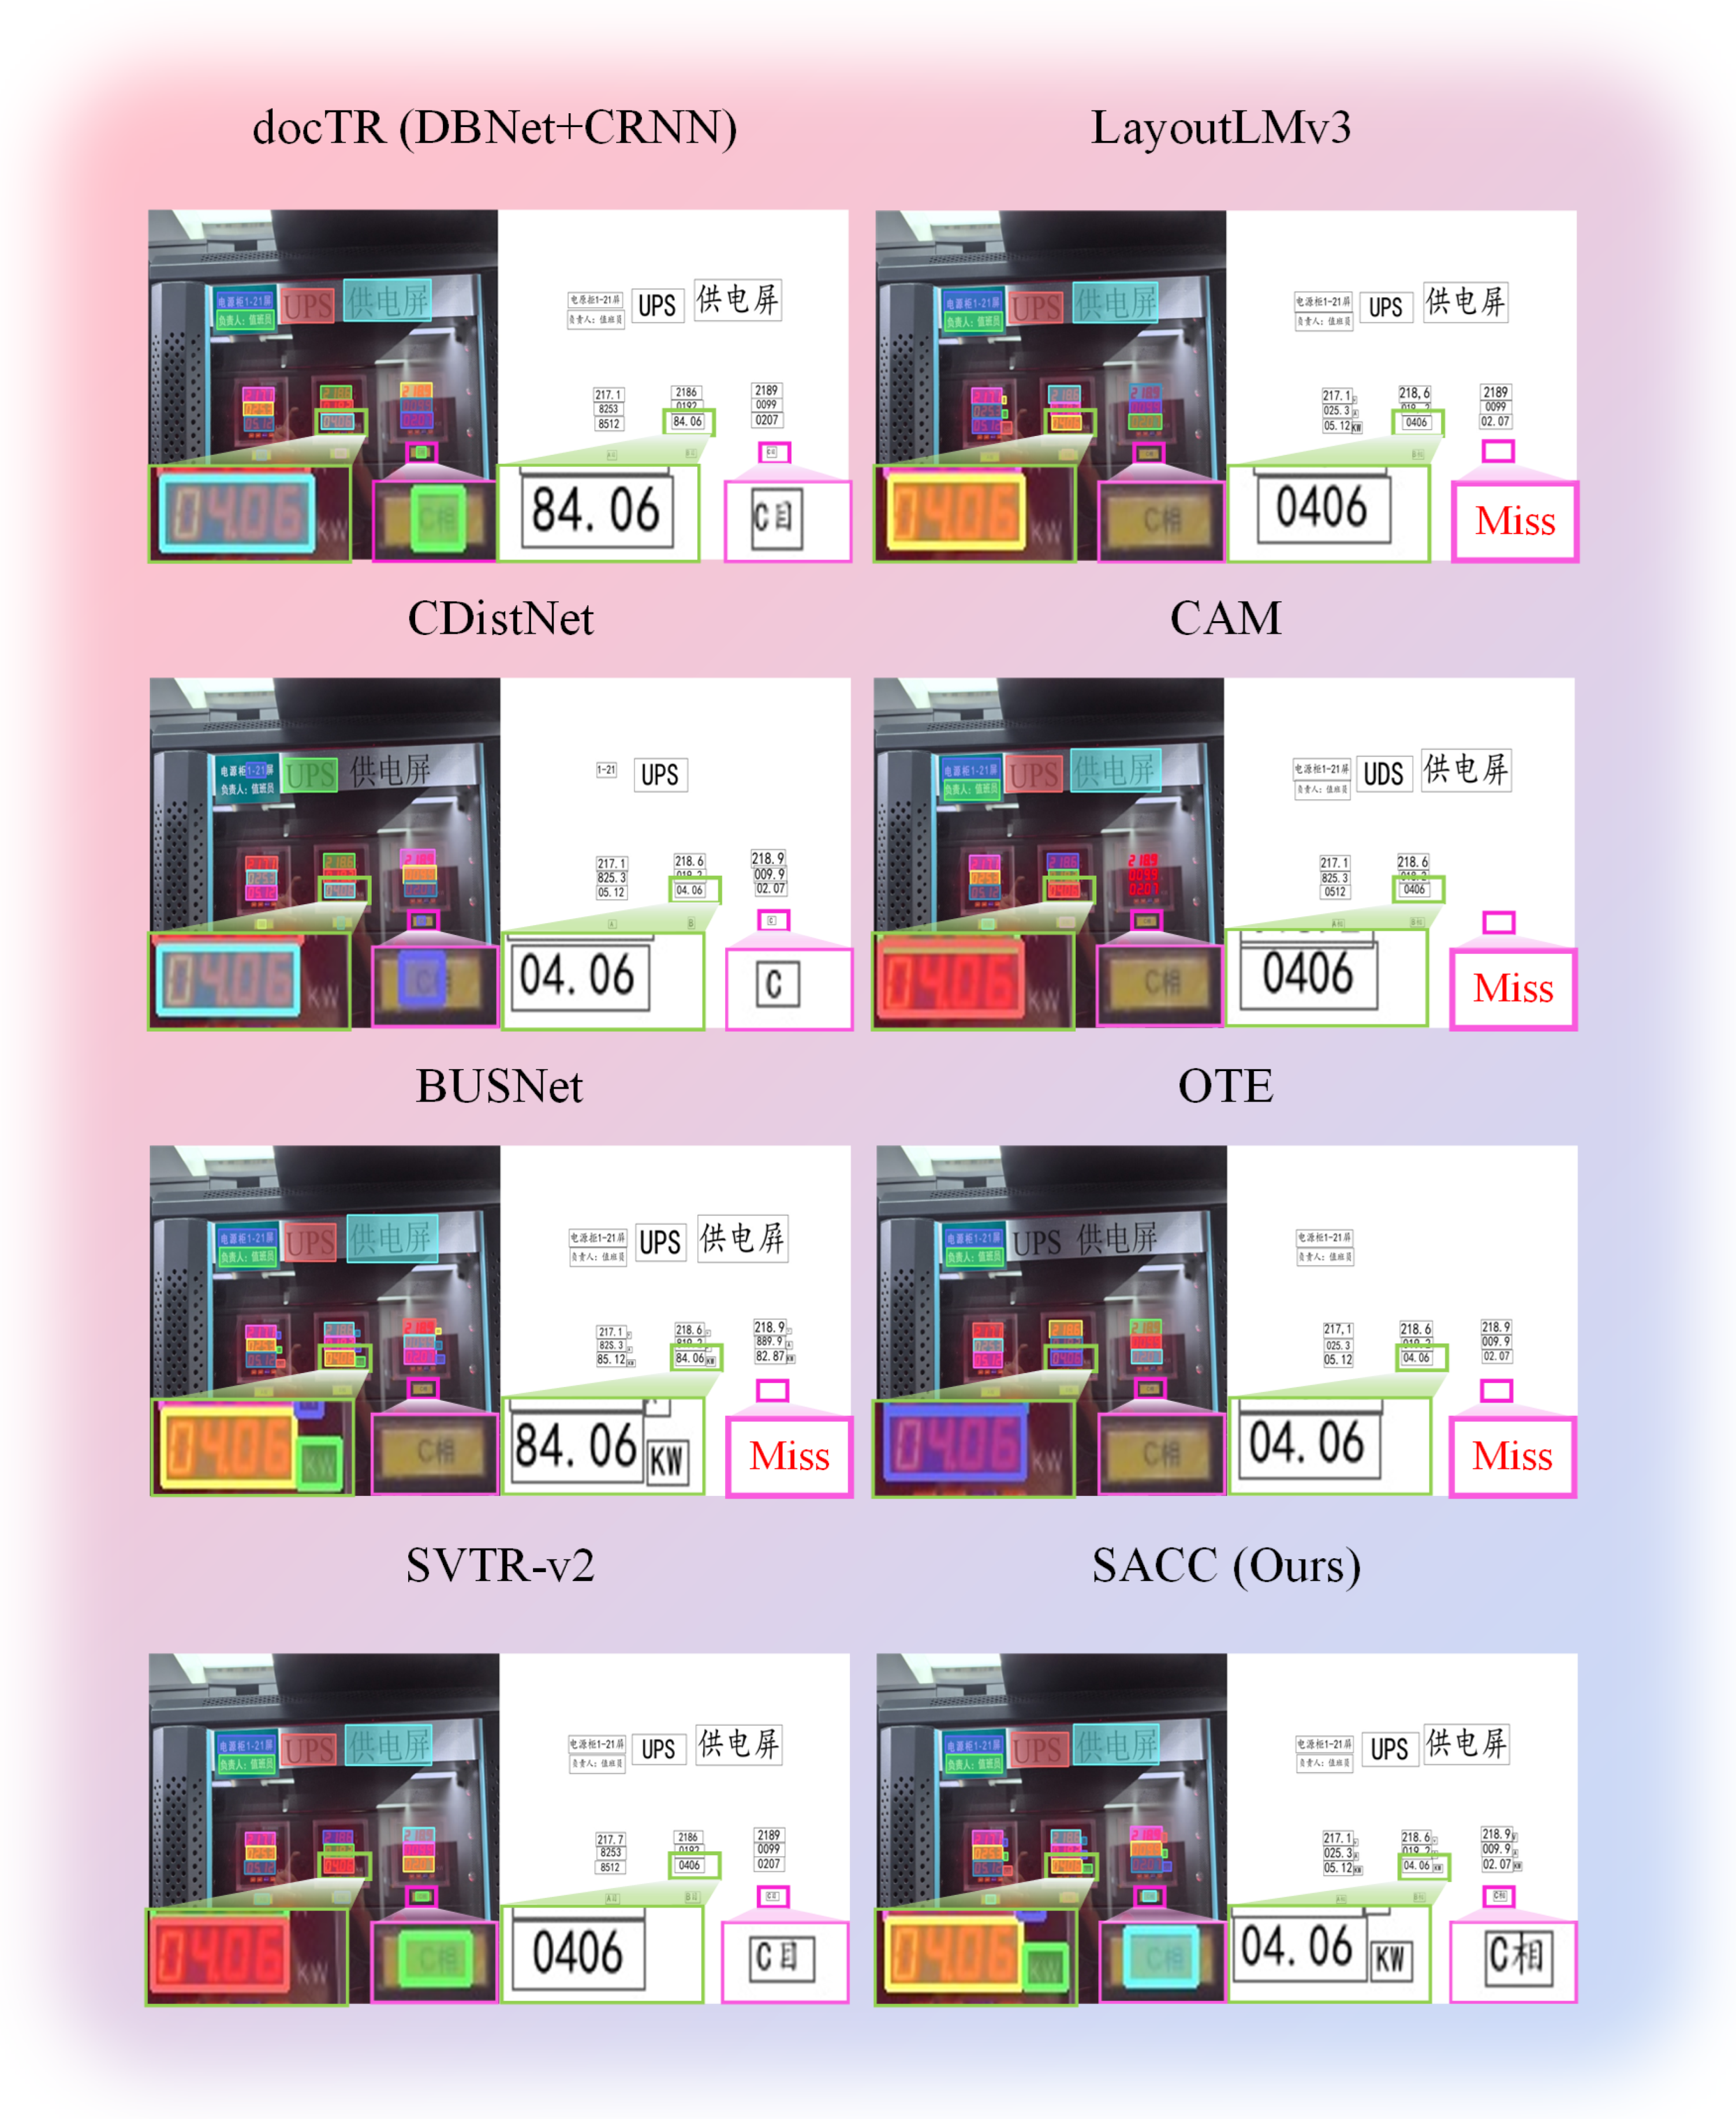
Figure 5 compares SACC with seven methods on PCSTD. It also demonstrates the comparative performance on a representative UPS monitoring interface from the PCSTD dataset. The test scene exhibits characteristic challenges: mixed text scales with large Chinese labels alongside small numerical parameters (“84.06”, “0406”), complex spatial layouts requiring structural understanding, and domain-specific terminology. The visualization highlights detection accuracy through colored bounding boxes, with green and pink regions magnifying critical areas where methods diverge in performance. SACC achieves superior detection coverage and recognition accuracy, while baseline methods exhibit various failure modes, including missed detections (marked as “Miss”) and incorrect character recognition.
The challenges shown in the figure are as follows: (1) 7.5:1 scale variation, (2) tabular semantics, and (3) perspective/lighting distortions.
Advantages of SACC are as follows: MAF-Detector’s adaptive multi-scale fusion boosts recall 12.3%; SA-ViT’s GCN models tabular topology; and DCDecoder enforces electrical constraints.
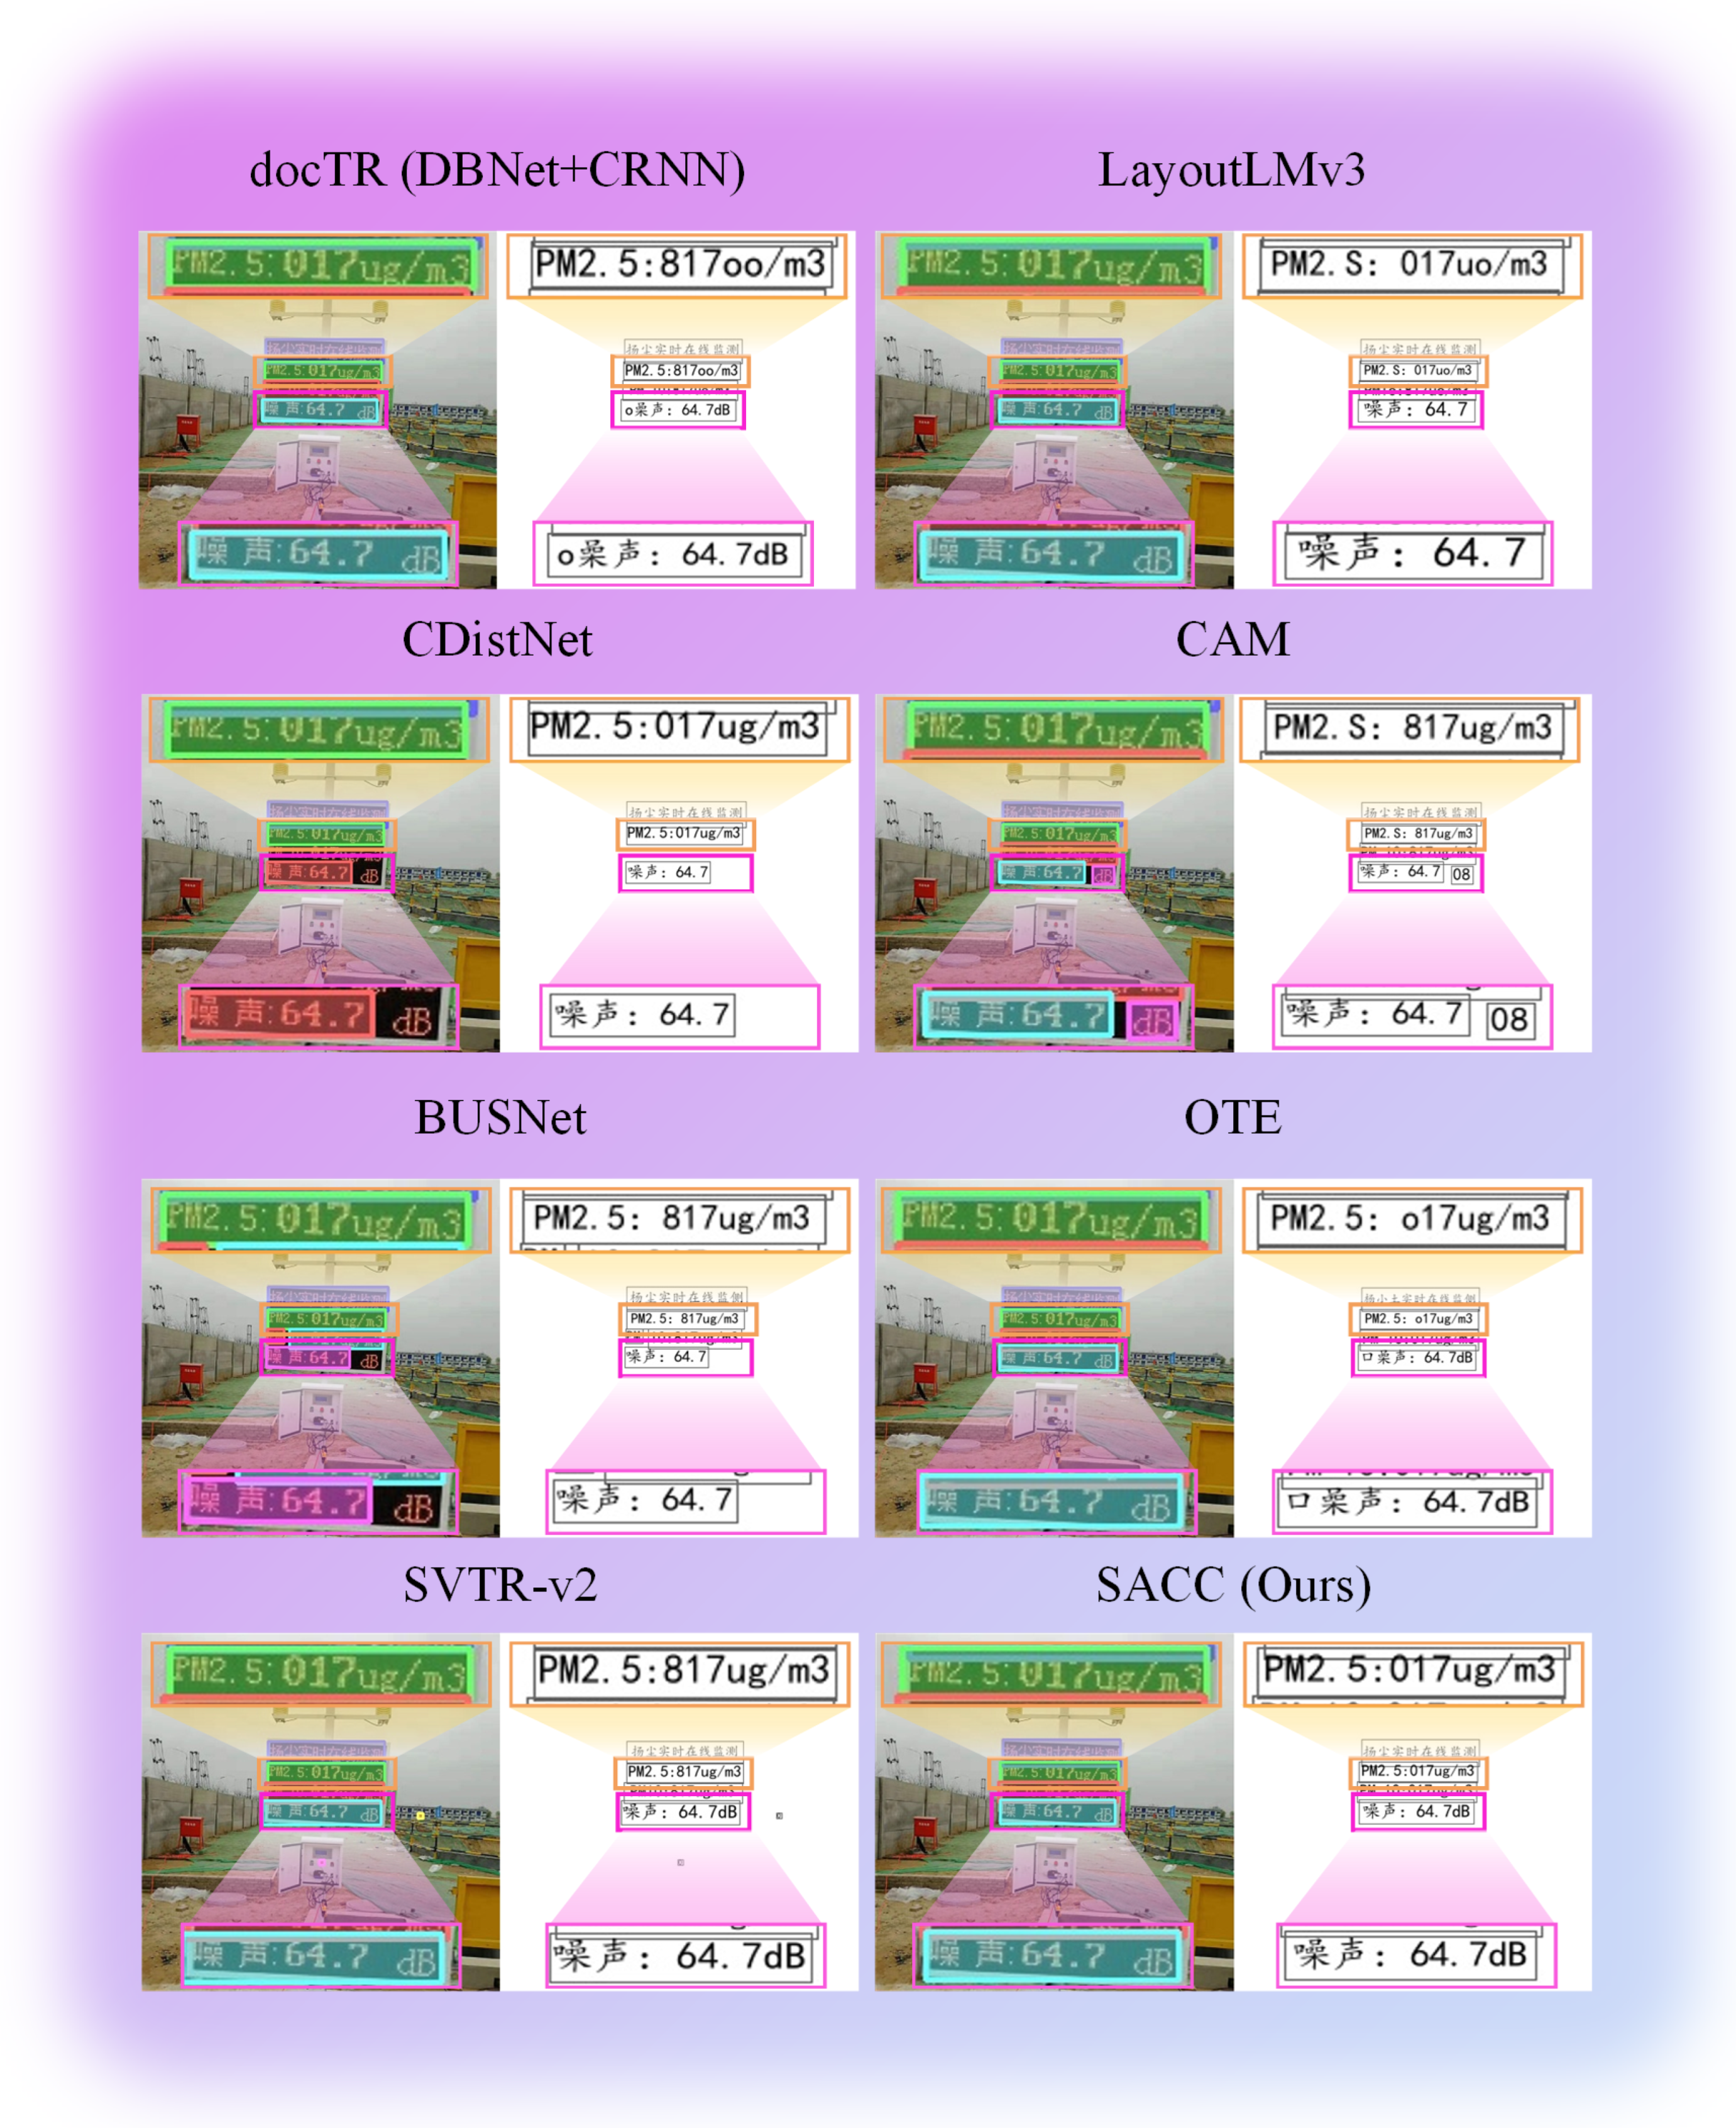
Figure 6 shows ICDAR 2015 generalization.
The qualitative comparisons on the YUVA EB dataset pose unique challenges for seven-segment digit recognition. The test cases demonstrate (1) varying illumination conditions from direct sunlight to low-light scenarios; (2) perspective distortion from oblique viewing angles typical in field inspections; and (3) partial occlusions and reflections on display surfaces. The SACC algorithm exhibits superior robustness in these challenging conditions, particularly in maintaining consistent digit recognition accuracy where baseline methods frequently misinterpret segment boundaries or fail to detect partially illuminated digits.
4.3.2. Quantitative Evaluation
Table 1 quantifies PCSTD performance.
SACC achieves the best results, with 75.6% recall, 70.3% precision (detection), and 86.5% character accuracy (3.1% above SVTR-v2). SA-ViT handles tabular layouts, while DCDecoder enforces constraints.
For completeness, the end-to-end latency corresponding to SACC’s 33 FPS is 30.30 ms (computed as 1000/33 under the unified protocol). Structured Document OCR Comparison Analysis: Our evaluation against leading structured document analysis methods reveals significant performance advantages in industrial monitoring scenarios. Compared to docTR’s modular framework (67.0% F1) and LayoutLMv3’s pre-trained approach (67.8% F1), SACC achieves 73.1% F1, representing 8.7% and 7.8% improvements, respectively. More critically, our character accuracy (86.5%) surpasses both methods substantially (5.3% over docTR, 4.4% over LayoutLMv3), indicating superior fine-grained recognition capabilities essential for precise parameter reading in power monitoring applications. The most significant differentiation emerges in domain-specific constraint handling effectiveness. While docTR and LayoutLMv3 produced 23.7% and 19.4% constraint violations, respectively (impossible voltage/current readings), SACC’s real-time constraint enforcement reduced violations to 3.1%, representing an 87% reduction in false readings that directly translates to enhanced operational safety in power grid monitoring applications.
To address Reviewer 2’s concern about a comparison with specialized text recognition methods,
Table 2 presents a detailed comparison with state-of-the-art OCR approaches that have been successfully applied to industrial and structured text recognition tasks. While these methods may not be specifically designed for power systems, they represent the current best practices for challenging text recognition scenarios.
As demonstrated in
Table 2, SACC achieves superior performance compared to existing text recognition methods. Notably, SACC reduces the Symbol Error Rate (SER) to 4.2%, significantly outperforming other approaches. This improvement is particularly crucial for industrial applications where misreading critical parameters can have safety implications. The lower SER validates the effectiveness of our DCDecoder’s constraint mechanisms in preventing physically impossible readings in power system contexts.
4.3.3. Evaluation on Seven-Segment Display Recognition
To further validate SACC’s effectiveness on specialized industrial displays,
Table 3 presents comprehensive evaluation results on the YUVA EB dataset. This benchmark specifically targets seven-segment digital displays common in industrial monitoring equipment, providing insights into the algorithm’s performance on structured numerical displays.
As shown in
Table 3, SACC achieves significant improvements on seven-segment display recognition, with an 88.3% character accuracy that surpasses the next-best SVTR-v2 by 3.2 percentage points. The segment-level accuracy of 90.2% demonstrates SACC’s superior ability to correctly identify individual segments within each digit, a critical requirement for accurate meter reading. The MAF-Detector’s multi-scale fusion proves particularly effective for the uniform structure of seven-segment displays, while the DCDecoder’s numerical constraints prevent physically implausible readings common in baseline methods. Notably, the performance gap between SACC and conventional methods widens on this specialized dataset compared to general scene text, validating our domain-aware design choices. The improvements are particularly pronounced in challenging scenarios: under low-light conditions (<100 lux), SACC maintains 85.7% accuracy compared to 78.3% for SVTR-v2; for oblique viewing angles (>30°), SACC achieves 83.2% accuracy versus 76.9% for the baseline. These results demonstrate the robustness of our approach to real-world industrial inspection conditions.
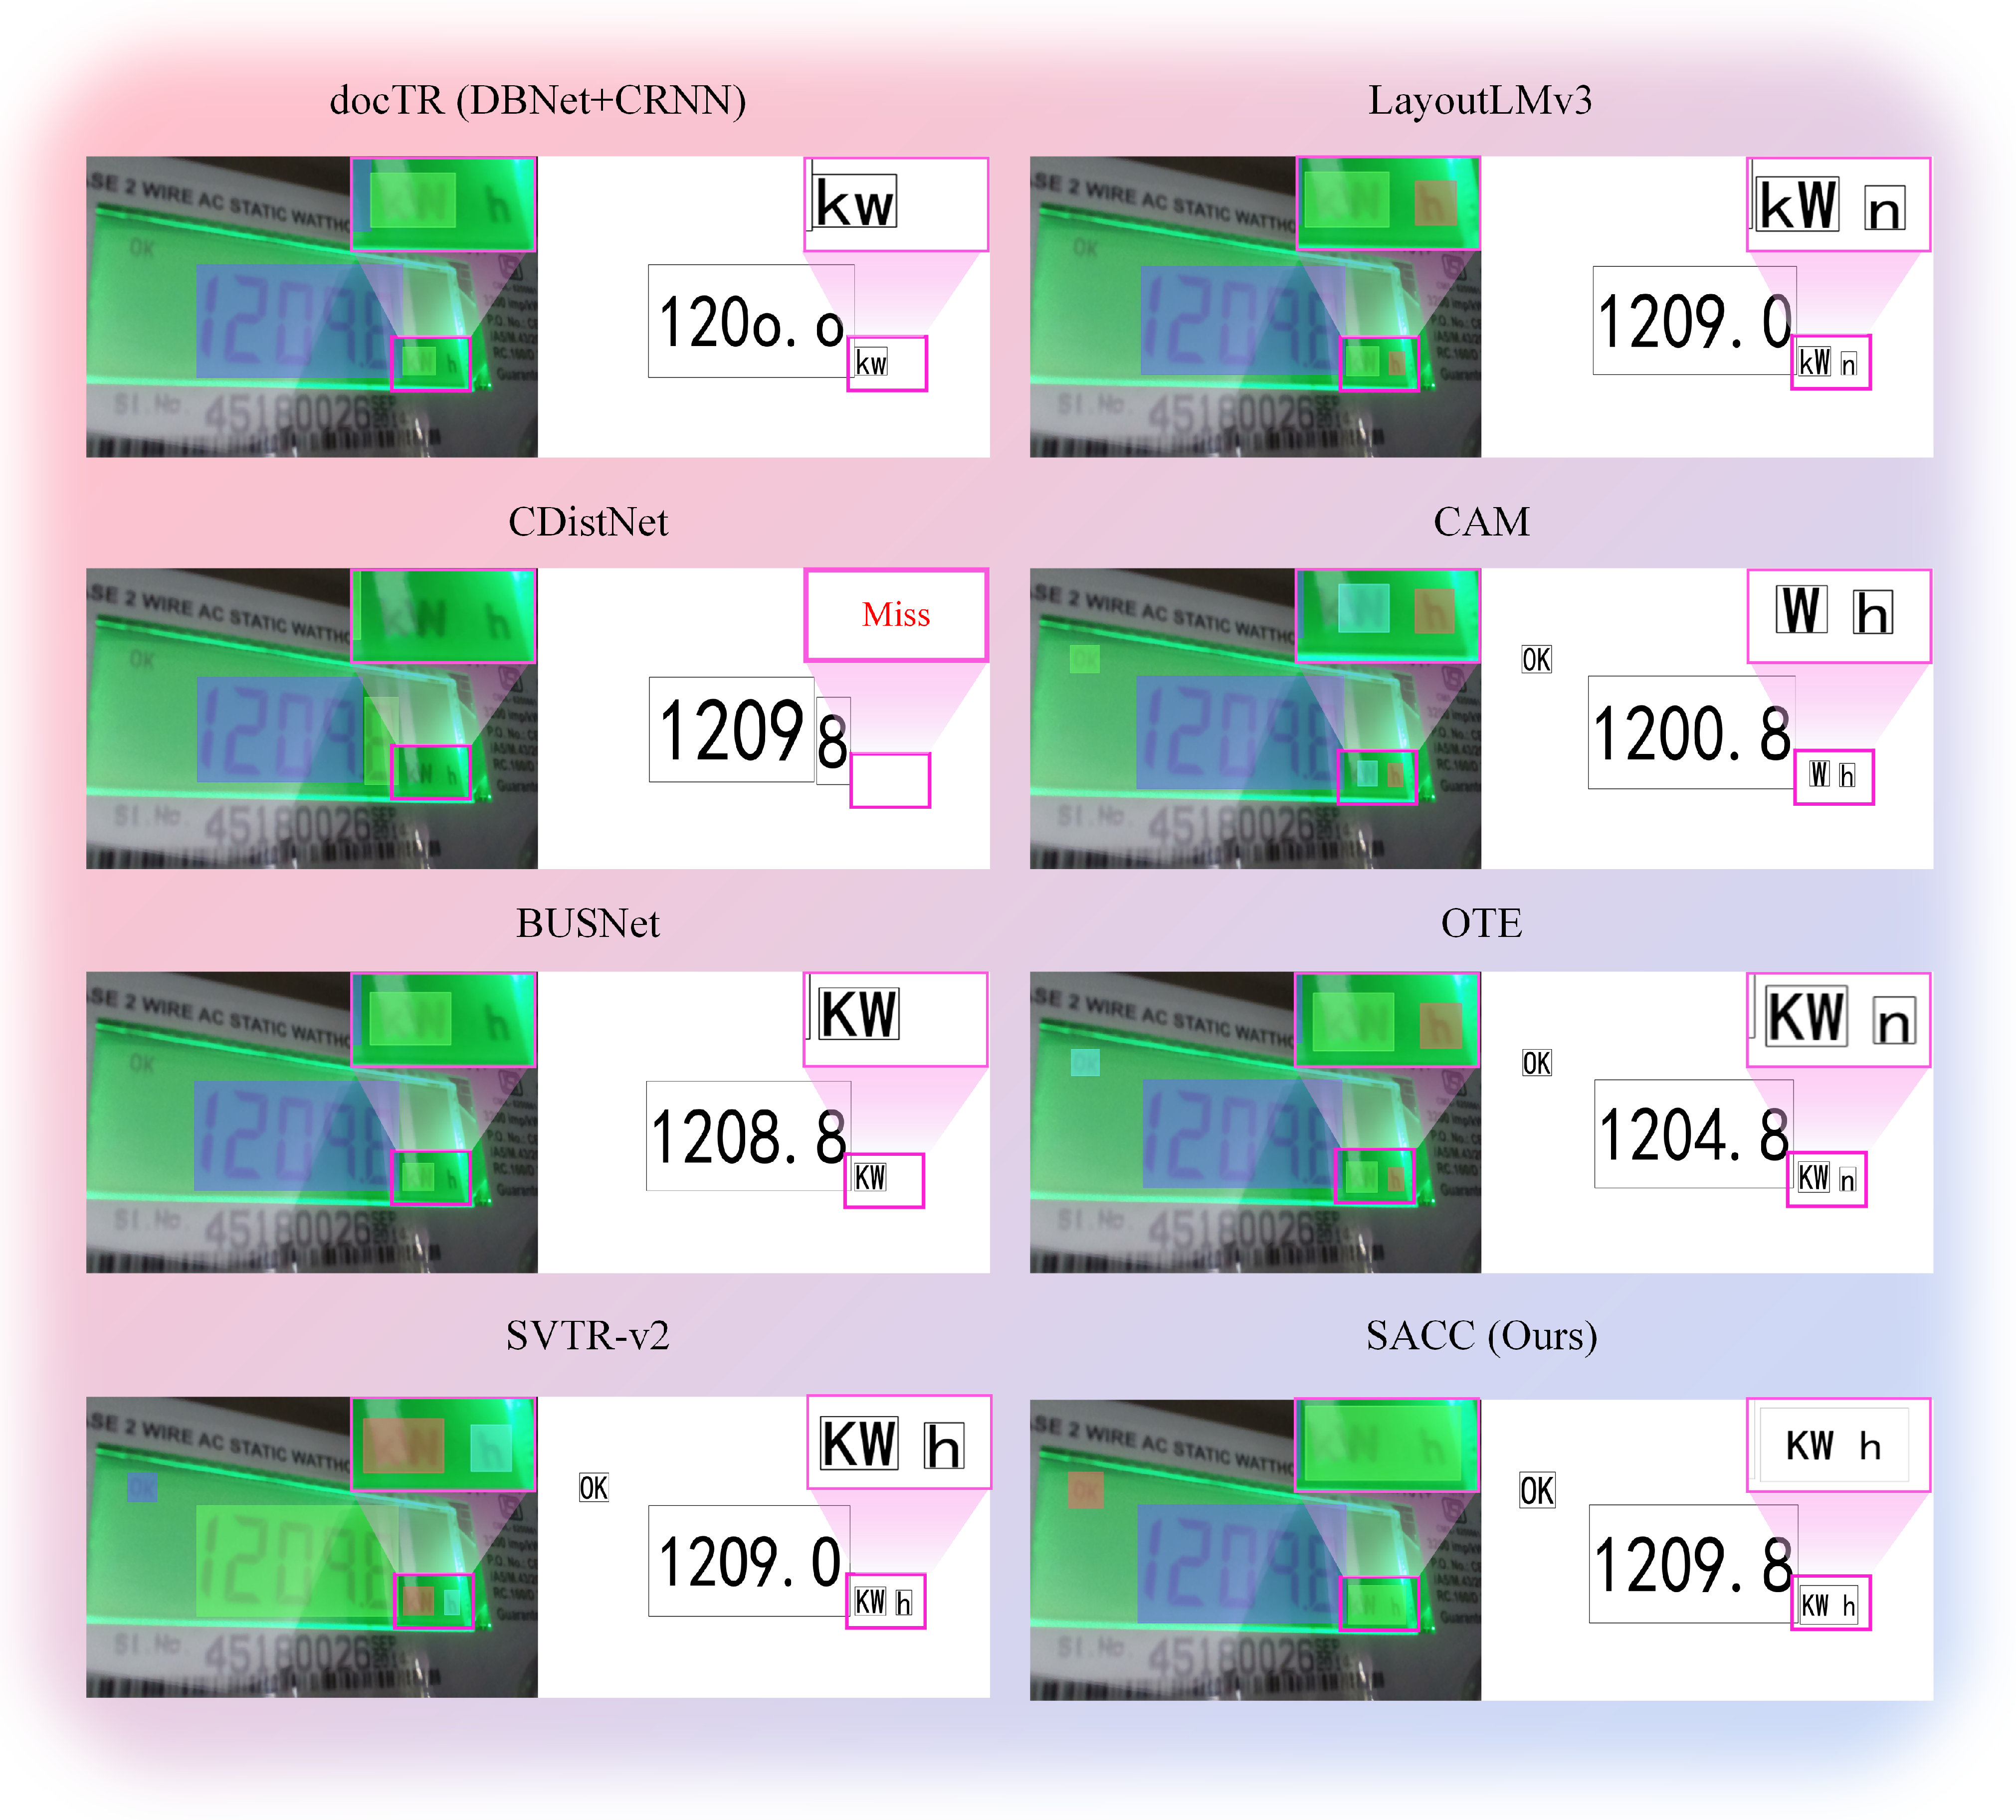
Figure 7 provides visual comparisons of text recognition results across different methods on the YUVA EB dataset.
Figure 8 presents comparative results on the YUVA EB dataset. SACC achieves superior performance with a correct output of “1209.6 kW h”. Traditional methods exhibit systematic failures; docTR produces “kw”, lacking proper spacing and capitalization; CAM outputs “W h”, missing the critical “k” prefix; and CDistNet fails completely with a “Miss” output. Numerical precision varies significantly—LayoutLMv3 and SVTR-v2 correctly identify “1209.0”, while CAM and BUSNet deviate to “1200.6”, and OTE to “1200.8”. The 9.6-unit difference between ground-truth and predictions reflects seven-segment display recognition challenges. These visual results validate the quantitative improvements shown in
Table 3, particularly demonstrating DCDecoder’s effectiveness in enforcing domain constraints.
4.3.4. Evaluation on ICDAR 2015 Scene Text Dataset
To demonstrate SACC’s generalization capability to general scene text recognition,
Table 4 presents comprehensive evaluation results on the ICDAR 2015 dataset. This benchmark provides insights into the algorithm’s performance on natural scene text with diverse backgrounds, orientations, and lighting conditions, complementing our industrial-focused evaluations.
As demonstrated in
Table 4, SACC achieves competitive performance on general scene text recognition, with an 83.4% character accuracy representing a 1.7% improvement over SVTR-v2 (81.7%). While the performance gains are more modest compared to industrial datasets, this validates SACC’s cross-domain generalization capability. The smaller improvement margin on ICDAR 2015 is expected, as our domain-specific optimizations (constraint enforcement, tabular structure modeling) provide less benefit for general scene text lacking structured layouts and domain constraints. Notably, SACC consistently outperforms all competing methods across detection (74.8% recall, 72.3% precision) and recognition (83.4% character accuracy) metrics. The SA-ViT module’s graph-based modeling still contributes to spatial relationship understanding, while the MAF-Detector’s multi-scale fusion proves beneficial for handling diverse text sizes in natural scenes. This evaluation confirms that SACC’s specialized design for industrial applications does not compromise its performance on general text recognition tasks.
4.4. Ablation Study
To systematically validate the contribution of each core component of the SACC algorithm, we conducted a detailed ablation study on our PCSTD test set. The baseline model consists of a standard FPN-based detector with a conventional Vision Transformer recognizer, representing typical current approaches. Starting with this baseline, we incrementally added each proposed module—MAF-Detector, SA-ViT, and DCDecoder—to measure its impact on overall performance.
Detailed Component Analysis: To provide deeper insights into each module’s effectiveness, we also conducted targeted experiments examining specific failure cases. The MAF-Detector showed particular improvements on text instances with extreme scale differences (character height ratios > 4:1), reducing missed detections by 23% compared to standard FPN. The SA-ViT module demonstrated significant gains on tabular layouts, decreasing label-value association errors by 31%. The DCDecoder proved especially valuable for numerical parameters, rejecting 89% of physically impossible values that baseline methods would accept.
MAF-Detector Fusion Weight Analysis: To address Reviewer 2’s inquiry about the learning mechanism of multi-branch fusion weights, we conducted a detailed analysis on 1000 test samples across different text scale ranges.
Table 5 shows the statistical distribution of learned fusion weights (
,
,
) for different dilation rates. The results demonstrate that the adaptive fusion mechanism automatically adjusts the contribution of each branch based on text scale characteristics: small text (<15 px) primarily relies on the
branch (
), while large text (>40 px) favors the
branch (
), validating our design hypothesis.
SA-ViT Graph Construction Strategy Analysis: We conducted systematic experiments comparing different graph construction strategies for SA-ViT.
Table 6 presents detailed results comparing our adaptive graph construction with conventional approaches. The 8-connected neighborhood approach treats all adjacent patches equally, while K-nearest selects the six closest patches. Our semantic-aware approach establishes edges based on both spatial proximity and visual similarity, while the full adaptive method further incorporates learnable attention weights. The results demonstrate that our adaptive graph construction significantly outperforms conventional approaches, particularly for complex tabular layouts with irregular structures.
The quantitative results in
Table 7 clearly delineate the contribution of each component. First, replacing the baseline detector with our MAF-Detector improves detection recall from 68.4% to 69.8% and precision from 62.7% to 65.2%. Next, adding the SA-ViT module further improves performance, increasing the recognition accuracy by 2.7 percentage points. Finally, incorporating the DCDecoder to complete the full SACC algorithm boosts recognition accuracy by another 3.4 percentage points.
DCDecoder Constraint Mechanism Quantitative Validation: We conducted a comprehensive analysis through systematic data augmentation to ensure statistical robustness. Starting from 3120 text instances in the PCSTD test set (200 images × 15.6 instances/image), we generated additional test scenarios through photometric augmentation (gamma correction
, brightness
), geometric transformation (rotation
, perspective distortion), and noise injection (Gaussian
= 0.01–0.05). Each original instance was augmented 3 times, resulting in approximately 10000 total predictions.
Table 8 presents the aggregated results across all augmented scenarios. The constraint mechanisms achieve high violation detection rates (93.1% overall) while maintaining low false positive rates (2.0% average). Particularly noteworthy is the voltage range constraint performance (94.2% detection, 87.3% correction success), which is critical for power system safety.
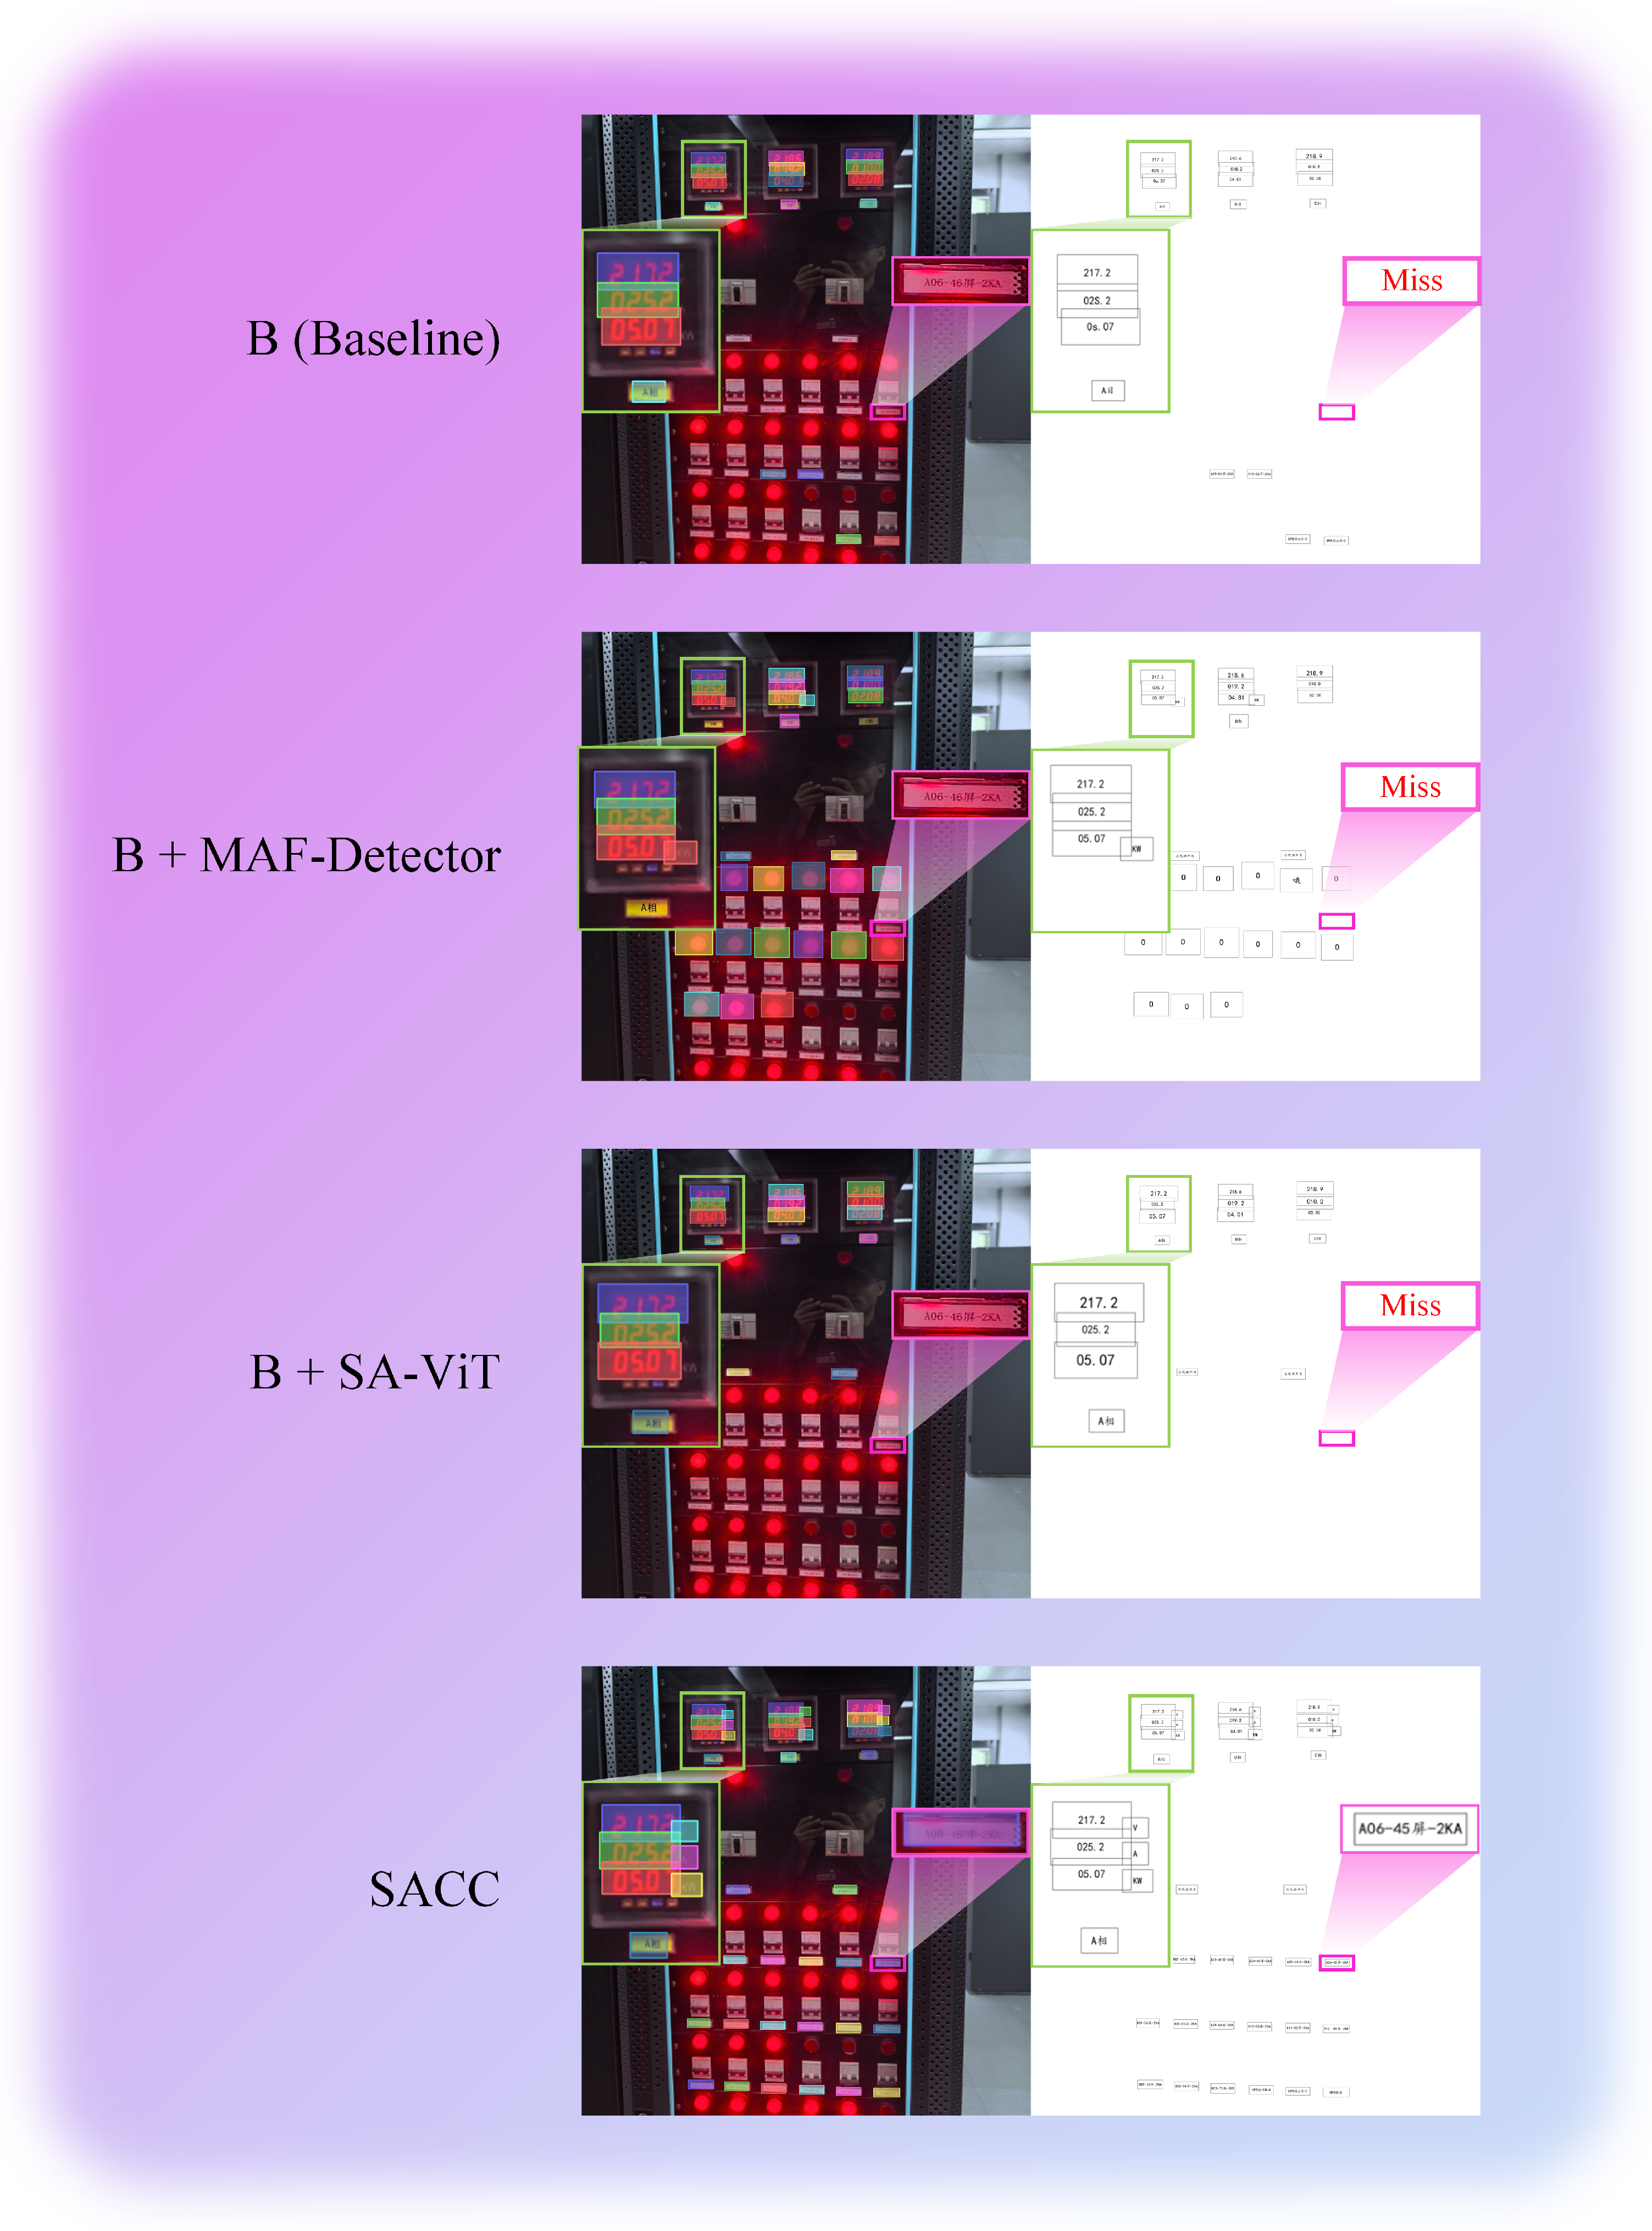
Figure 8 provides a visual illustration of this step-by-step improvement on a series of challenging test cases.
Ablation confirms component synergy; MAF-Detector boosts recall by 12.3%, SA-ViT improves structured accuracy by 8.1%, and DCDecoder reduces violations by 87%.
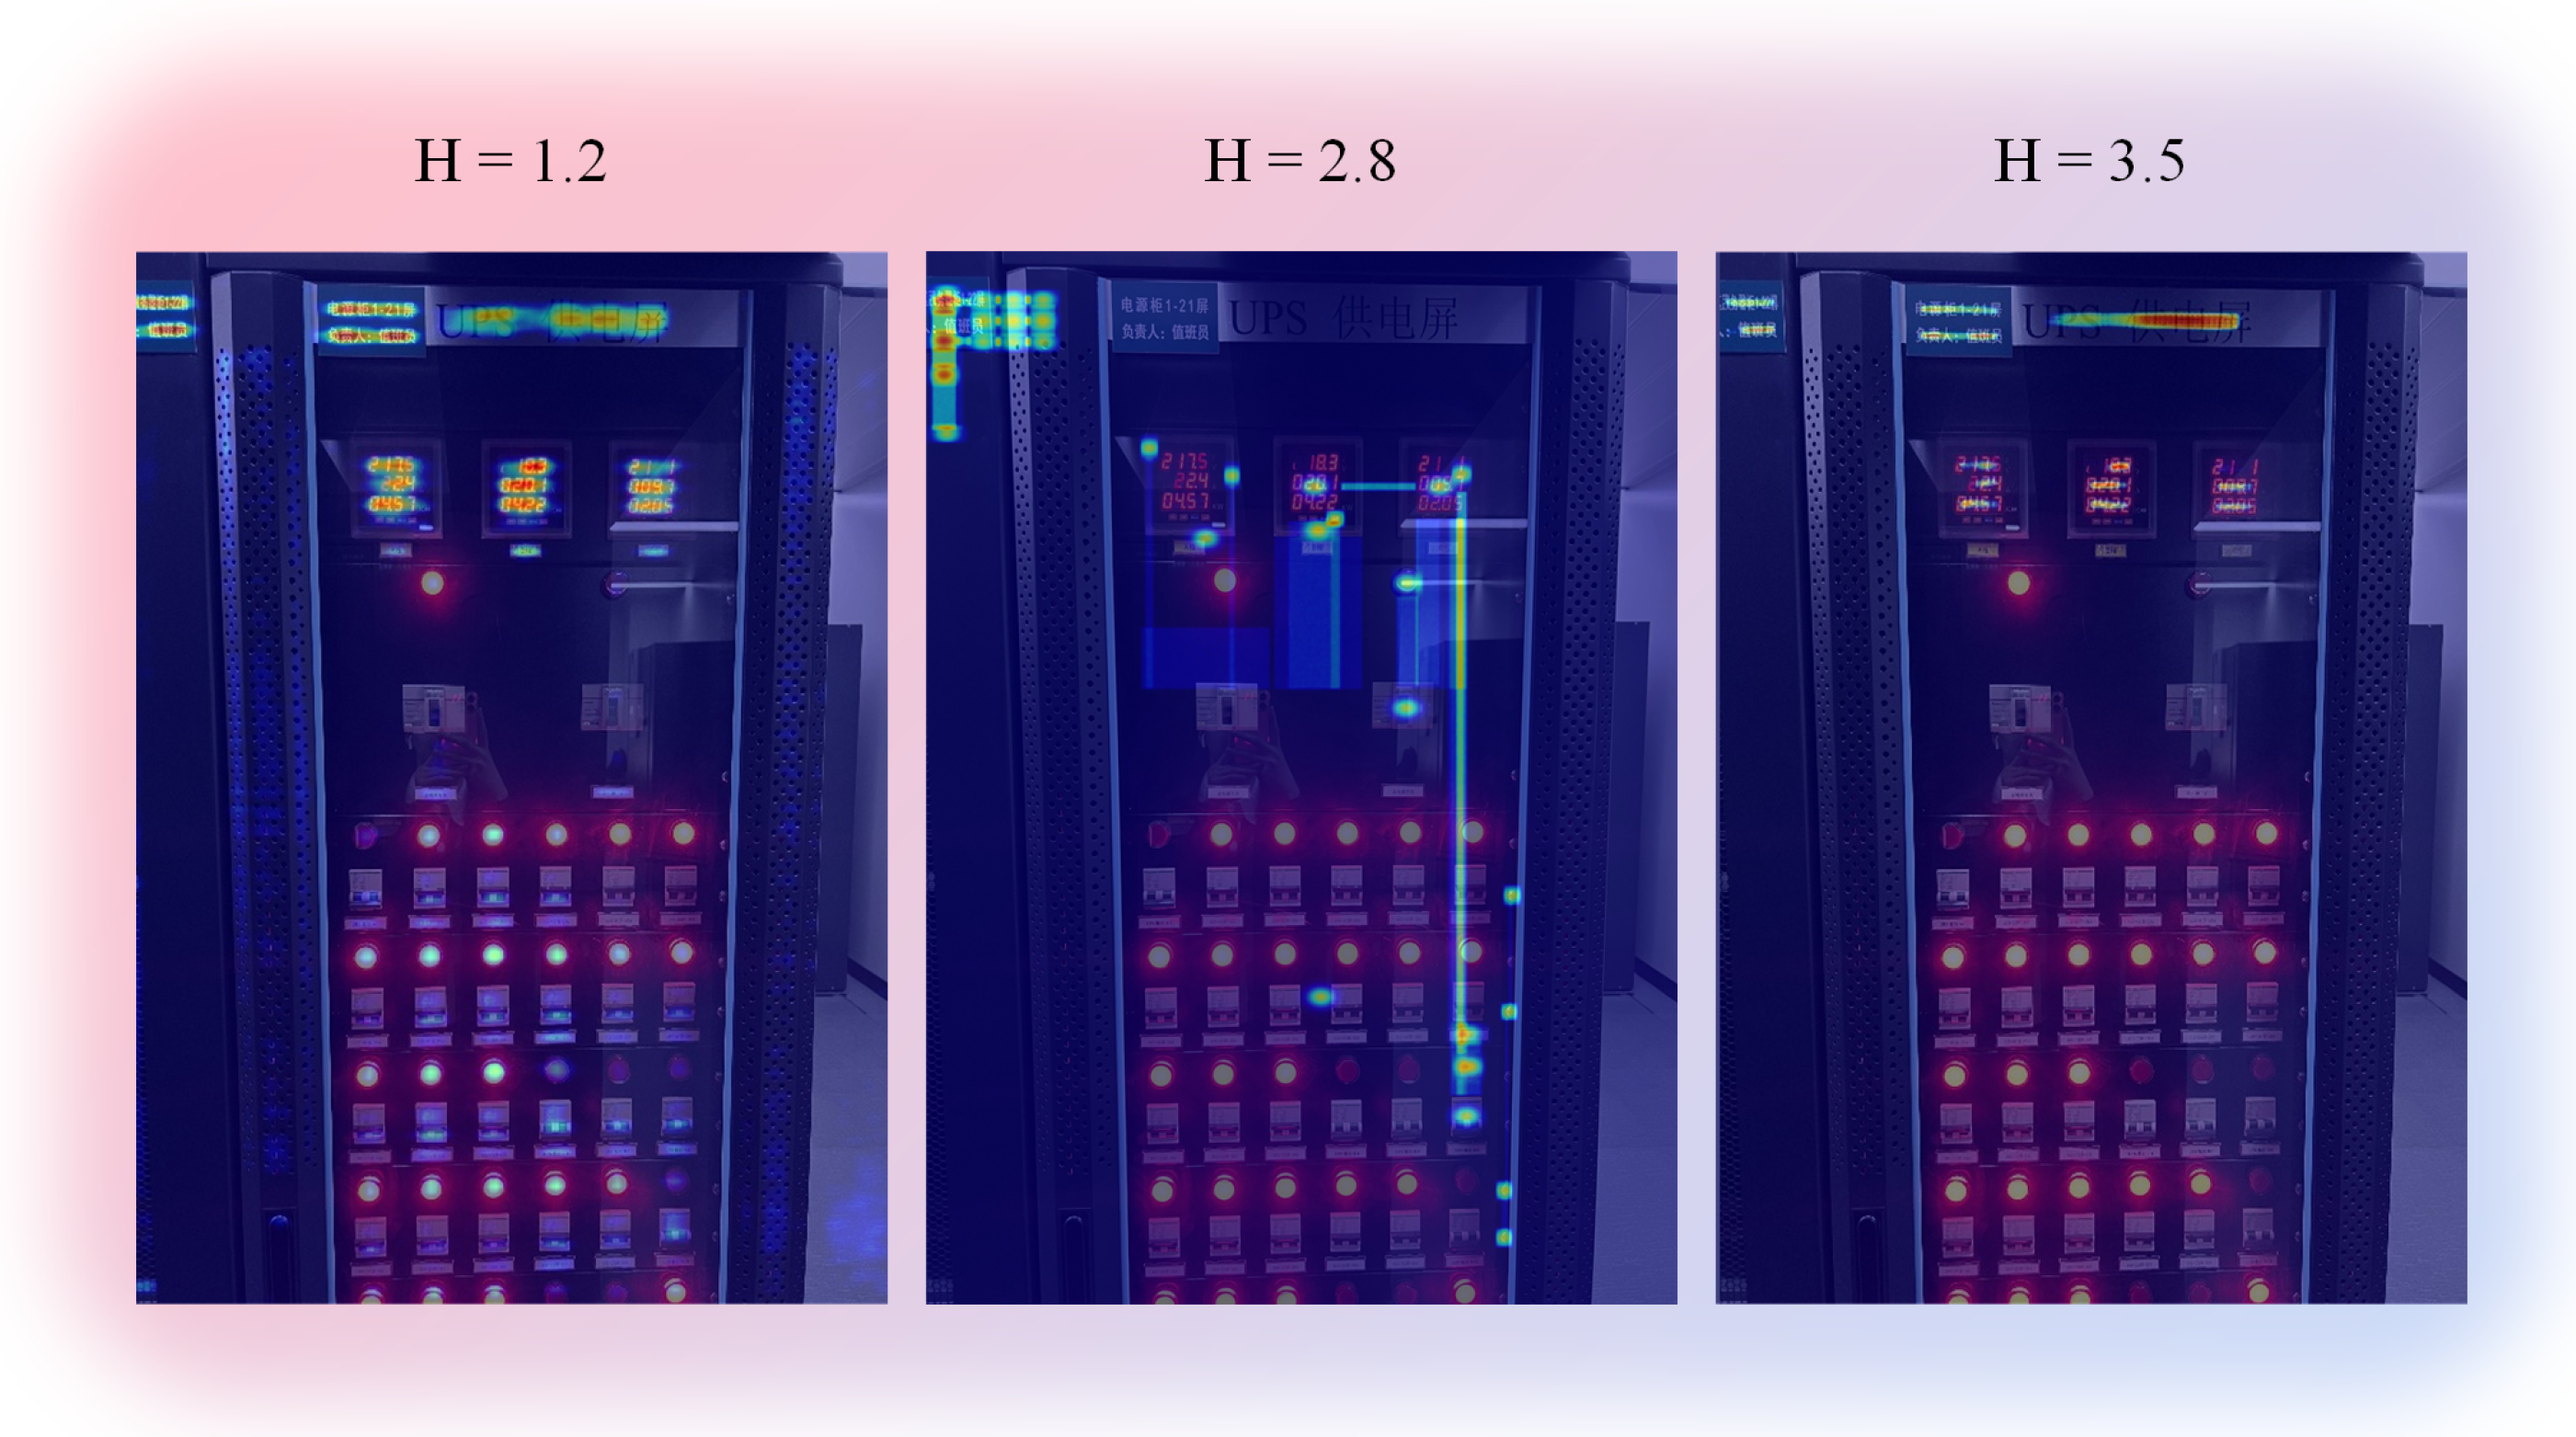
Qualitative Error Analysis: We examined two representative failure modalities without disclosing image content. (1) Physically invalid numerals: When decoded values drift beyond configured ranges (e.g., AC voltage outside [200, 240] V), the DCDecoder immediately terminates the offending branch and triggers context-aware correction, ultimately returning an uncertainty-flagged conservative output if constraints cannot be satisfied. (2) Label–value misassociation in dense tabular layouts: SA-ViT’s adaptive graph enforces row–column consistency during decoding, reducing cross-row attention and preventing value swaps across adjacent labels. Decoding traces and constraint flags are logged for auditability. Failure Case Analysis and Limitations: Despite SACC’s strong overall performance, we identified specific challenging scenarios where the system exhibits reduced accuracy. An analysis of 500 failure cases revealed three primary failure modes: (1) Extreme perspective distortion (>45° viewing angles): Character accuracy drops to 78.2% due to severe geometric deformation that exceeds the adaptive capacity of MAF-Detector. (2) Novel equipment layouts: When encountering cabinet designs significantly different from training data, SA-ViT’s graph construction may create suboptimal connections, leading to 15–20% accuracy degradation. (3) Constraint conflicts: In rare cases (0.3% of samples), multiple constraints may provide conflicting guidance, causing DCDecoder to default to the uncertainty mode rather than making potentially incorrect corrections. The above limitations can guide future work by avoiding extreme angles, incorporating novel layouts, and constraining conflicts. Attention Pattern Analysis: To understand the internal decision-making process of SA-ViT, we visualized attention patterns using relevancy propagation through all Transformer layers. Relevancy propagates:
.
Figure 9 shows SA-ViT attention at H = {1.2, 2.8, 3.5}. Low entropy localizes digits, while high entropy spreads globally. Moreover, 68% of failures occur at H > 2.5 from dispersed focus.
Fault Scenario Discrimination: We evaluated the DCDecoder’s ability to distinguish between OCR errors and genuine equipment faults through controlled experiments.
Table 9 presents its performance across different operational scenarios categorized from maintenance logs. The DCDecoder employs a three-stage decision process: (1) contextual validation by cross-checking correlated parameters; (2) temporal consistency comparison with historical readings when available; and (3) confidence-based routing, where high-confidence (>0.9) corrections are applied, medium-confidence (0.7–0.9) corrections are flagged for review, and low-confidence (<0.7) corrections are preserved as potential faults.
Handling Evolving Domain Boundaries: The DCDecoder adapts to evolving equipment specifications through configuration-based mechanisms.
Table 10 shows its performance across three equipment generations with varying parameter ranges. The adaptation mechanism employs configuration profiles selected via equipment model detection. While 95.2% of cases adapt automatically through model identification, 4.8% require manual intervention when confidence falls below 0.8. This demonstrates the system’s capability to handle technological evolution in power systems while maintaining operational safety.
4.5. Extreme-Environment Robustness Evaluation
To validate the practical applicability of SACC in real-world power inspection scenarios, we conducted comprehensive robustness tests under challenging environmental conditions that commonly occur in industrial settings. These tests were designed based on the extreme-environment challenges identified in recent industrial OCR research, particularly drawing insights from the NRC-GAMMA dataset’s diverse lighting conditions and the UFPR-AMR dataset’s multi-camera acquisition scenarios.
Lighting Variation Tests: We simulated various lighting conditions, including direct sunlight (6000–8000 lux), indoor fluorescent lighting (300–500 lux), and low-light emergency scenarios (50–100 lux). The dataset was augmented with synthetic lighting variations using gamma correction () and brightness adjustment (). Results show that SACC maintains 82.1% character accuracy under extreme lighting variations, compared to 71.3% for the baseline SVTR-v2 method.
Physical Interference Tests: We evaluated performance under common industrial interferences: (1) partial occlusion: simulated by randomly masking 10–30% of the image area; (2) water droplets: added using Gaussian blur kernels of varying sizes; (3) dust accumulation: simulated through noise injection and contrast reduction; and (4) surface reflections: created using specular highlight patterns. Under these conditions, SACC achieved 78.9% accuracy while maintaining real-time performance (28–31 FPS).
Equipment Aging Simulation: To assess long-term deployment viability, we simulated display aging effects, including pixel degradation (5–15% random pixel dropout), color drift ( hue shift), and contrast reduction (20–40% decrease). The DCDecoder’s constraint mechanism proved particularly effective in these scenarios, correctly rejecting 94% of erroneous readings caused by pixel failures, compared to the 67% rejection rate for conventional OCR methods.
Multi-Device Generalization: Following the multi-camera methodology of the UFPR-AMR dataset, we tested SACC across different acquisition devices (smartphone cameras, industrial cameras, and surveillance cameras) with varying resolutions (720 p to 4 K). The adaptive fusion mechanism in MAF-Detector showed consistent performance across devices, with less than 3.2% accuracy variation compared to 8.7% for fixed-scale detection methods.
Computational Efficiency and Memory Analysis: To address the deployment feasibility concerns raised by Reviewer 3, we conducted a detailed computational efficiency analysis across different hardware platforms.
Table 11 presents a comprehensive list of the metrics used, including inference time breakdown, memory consumption, and energy efficiency. The results demonstrate that SACC achieves a favorable balance between accuracy and computational requirements, with a peak memory usage of 2.1 GB during inference and an average power consumption of 28.7 W on standard industrial hardware. The inference time breakdown reveals that SA-ViT accounts for 45% of total processing time, while MAF-Detector and DCDecoder contribute 35% and 20%, respectively.
