Article

A Federated Learning Framework with Attention Mechanism and Gradient Compression for Time-Series Strategy Modeling

1
National School of Development, Peking University, Beijing 100871, China
2
China Agricultural University, Beijing 100083, China
3
Artificial Intelligence Research Institute, Tsinghua University, Beijing 100084, China
*
Author to whom correspondence should be addressed.
Electronics 2025, 14(16), 3293; https://doi.org/10.3390/electronics14163293
Submission received: 5 July 2025 / Revised: 1 August 2025 / Accepted: 15 August 2025 / Published: 19 August 2025
(This article belongs to the Special Issue Security and Privacy in Distributed Machine Learning)

Abstract

With the increasing demand for privacy preservation and strategy sharing in global financial markets, traditional centralized modeling approaches have become inadequate for multi-institutional collaborative tasks, particularly under the realistic challenges of multi-source heterogeneity and non-independent and identically distributed (non-IID) data. To address these limitations, a heterogeneity-aware Federated Quantitative Learning framework, Federated Quantitative Learning, is proposed to enable efficient cross-market financial strategy modeling while preserving data privacy. This framework integrates a Path Quality-Aware Aggregation Mechanism, a Gradient Clipping and Compression Module, and a Heterogeneity-Adaptive Optimizer, collectively enhancing model robustness and generalization. Empirical studies conducted on multiple real-world financial datasets, including those from the United States, European Union, and Asia-Pacific markets, demonstrate that Federated Quantitative Learning outperforms existing mainstream methods in key performance indicators such as annualized return, Sharpe ratio, maximum drawdown, and volatility. Under the full model configuration, Federated Quantitative Learning achieves an annualized return of 12.72%, a Sharpe ratio of 1.12, a maximum drawdown limited to 10.3%, and a reduced volatility of 9.7%, showing significant improvements over methods such as Federated Averaging, Federated Proximal Optimization, and Model-Contrastive Federated Learning. Moreover, module ablation studies and attention mechanism comparisons further validate the effectiveness of each core component in enhancing model performance. This study introduces a novel paradigm for secure strategy sharing and high-quality modeling in multi-institutional quantitative systems, offering practical feasibility and broad applicability.

1. Introduction

In recent years, with the widespread application of deep reinforcement learning (DRL) in quantitative strategy modeling for financial markets, the demand for high-performance trading models has substantially increased, with training effectiveness becoming increasingly dependent on the scale and diversity of the data [1]. The success of quantitative trading strategies depends not only on algorithmic design and optimization but also on the quality and heterogeneity of the input data. The dynamic and complex nature of financial markets requires trading models to be trained on large-scale and multidimensional market data to effectively capture instantaneous changes and make accurate decisions [2]. However, as financial globalization deepens, so too does the need for massive, diverse data, posing a significant challenge in enabling large-scale data sharing and collaborative training under strict data privacy and security constraints [3].
Traditional quantitative models are often trained on historical trading data from a single institution, limiting their generalization ability and cross-market adaptability. Moreover, several inherent difficulties persist in financial modeling, such as the lack of clear labels and inconsistencies between model training and execution [4]. The recent advances in DRL have begun to address some of these challenges. For instance, Li et al. [4] proposed FinRL-Podracer, a high-performance and scalable DRL framework designed to accelerate the development of trading strategies and improve training efficiency. Fan et al. [5] introduced a deep learning method capable of jointly solving and estimating macro-financial models, demonstrating its effectiveness in high-dimensional state spaces. Nevertheless, machine learning processes in finance frequently rely on highly sensitive data, including transaction histories, credit records, and personal identification information [3]. Financial datasets typically contain confidential information, and data breaches may lead to severe financial losses, legal liabilities, and reputational damage for institutions [3]. Furthermore, system heterogeneity, data format inconsistency, and regulatory restrictions across institutions make direct cross-institutional data integration extremely difficult [6]. This phenomenon of “data silos” is particularly pronounced in international financial markets, hindering global-scale data sharing and limiting the potential for collaborative model development and strategy generalization [7]. To address the challenge of privacy-preserving data sharing, Chatzigiannis et al. [8] explored privacy-enhancing technologies, such as homomorphic encryption and federated learning, to ensure data security and compliance during collaboration. He et al. [9] proposed an innovative framework, DPFedBank, which employs local differential privacy mechanisms, enabling financial institutions to collaboratively train models without exposing sensitive information.
In response to these challenges, this study proposes a privacy-preserving framework for quantitative strategy sharing, termed Federated Quantitative Learning (FQL), based on federated learning techniques. Federated learning is a novel paradigm of distributed machine learning that eliminates the need to centralize data by conducting model training locally on participating clients. This framework enables privacy protection while facilitating inter-institutional collaboration, offering an effective solution to the data silo problem in finance [10,11]. The proposed FQL framework supports joint training among multiple international financial institutions without exchanging raw data, thereby improving the performance and cross-market generalization of trading models. Within the framework, a path attention aggregation mechanism is employed to dynamically assess the contribution of each client’s gradient, which is then weighted accordingly during global aggregation. To reduce cross-border communication costs, a gradient clipping and compression mechanism is introduced, optimizing transmission efficiency. Additionally, a heterogeneity-aware optimization module is designed to enhance local adaptation under differing market conditions, thereby improving the overall model robustness in diversified financial environments. Compared with centralized training schemes, the FQL framework provides stronger privacy guarantees while maintaining high performance and adaptability across heterogeneous markets. Experiments were conducted across datasets constructed from NASDAQ-100 constituents, European Stoxx 600 constituents, and major ETFs from the Asia-Pacific region. Results show that the proposed framework significantly outperforms existing methods in terms of return, risk control, and communication efficiency. The main contributions of this paper are summarized as follows:
  • A path attention aggregation mechanism that dynamically evaluates client gradient contributions to enhance strategy performance;
  • A gradient clipping and compression mechanism that reduces cross-border communication costs;
  • A heterogeneity-aware optimization module that improves local adaptability under varying market structures.

2. Related Work

2.1. The Application of Deep Learning in Quantitative Strategy Modeling

In recent years, deep learning approaches such as long short-term memory (LSTM) and Transformer have been widely adopted in the financial domain, demonstrating strong modeling capacity and adaptability in stock price forecasting and trading signal generation tasks. The stock market, characterized by high risk and high return, demands accurate predictions to assist investors and traders in making informed decisions and maximizing returns [12]. Traditional financial forecasting methods often rely on simple statistical models or rule-based algorithms, which, although effective in some contexts, struggle to capture complex nonlinear relationships and long-term dependencies, thus limiting their applicability in real-world financial tasks. As an improved version of simple recurrent neural networks (SimpleRNN), the LSTM network effectively mitigates issues such as gradient vanishing in recurrent neural networks (RNNs), making it more suitable for handling long sequences [12]. Due to its ability to capture long-term dependencies in time-series data, LSTM has been extensively employed in stock price prediction and market trend analysis. The standard update equations for LSTM units are defined as follows [13]:
f t = σ W t · h t 1 , x t + b t ,
i t = σ W i · h t 1 , x t + b t ,
c ˜ t = tanh W c · h t 1 , x t + b t ,
c t = f t · c t 1 + i t · c ˜ t ,
o t = σ W o · h t 1 , x t + b o ,
h t = o t · tanh c t ,
here, i t , f t , and o t denote the input, forget, and output gates, respectively. W t , W c , and W o represent the corresponding weight matrices, and σ denotes the sigmoid activation function. Md et al. [14] proposed a multi-layer sequential LSTM (MLSLSTM) stock prediction model utilizing the Adam optimizer, achieving higher accuracy compared to other machine learning and deep learning algorithms. Moghar et al. [15] introduced an LSTM-based RNN to predict the future values of GOOGLE and NKE stocks, successfully tracking the opening price trends of both assets. Qi et al. [16] developed an event-driven LSTM model that extracts effective signals and provides accurate price forecasts to support investment strategies in foreign exchange markets. The Transformer model, originally developed for natural language processing (NLP), has recently been applied to financial forecasting tasks. Unlike LSTM, Transformer processes input data in parallel and employs self-attention to compute the weighted dependencies across all positions in a sequence, allowing it to capture long-range interactions efficiently. In stock prediction tasks, Transformer offers superior performance and computational efficiency, particularly in modeling large-scale financial time series. The self-attention mechanism in Transformer is defined as follows:
Attention ( Q , K , V ) = softmax Q K T d k V ,
where Q, K, and V denote the query, key, and value matrices, respectively, and d k is the dimension of the key vectors. Muhammad et al. [17] introduced a time2vec encoding scheme with a Transformer-based model to predict future stock prices on the Dhaka Stock Exchange (DSE) in Bangladesh, outperforming the traditional ARIMA benchmark model. Chantrasmee et al. [18] demonstrated that Transformer models are capable of effectively predicting trading signals, aiding investors in decision-making. Zhang et al. [19] proposed the TEANet framework, a Transformer encoder-based attention network designed for financial feature extraction and prediction. Despite their success in stock prediction tasks, both LSTM and Transformer exhibit limitations in generalizing to international markets due to various cross-market differences. These include regulatory policies, market behaviors, and trading protocols across countries, which hinder direct model transferability [20]. Furthermore, the dependency of these models on large volumes of high-quality data constrains their generalization capacity, especially in underdeveloped markets [21]. For example, Ge et al. [22] proposed the Series Decomposition Transformer with Period-Correlation (SDTP), which may require domain-specific tuning to adapt to different market dynamics.

2.2. Federated Learning and Financial Data Privacy Protection

Federated learning (FL) is a novel distributed learning paradigm that performs model training locally on client devices, thereby eliminating the need to centralize sensitive data on a central server [10,11]. In the financial domain, FL has been applied to credit scoring, risk control, and fraud detection tasks. It not only safeguards data privacy but also enables institutions to share learned model parameters collaboratively, thereby addressing the issue of data silos and enhancing model accuracy. Risk control is a critical component of banking and credit systems. Existing data-driven risk modeling methods rely heavily on data integration and sharing across banks [23]. Given increasing regulatory focus on privacy, data silos have emerged as a major concern, which FL frameworks aim to resolve [24]. In fraud detection, FL-based privacy-preserving mechanisms have been employed, but challenges remain in how financial transaction data are partitioned across institutions [25]. FL allows financial institutions to model user behavior across clients, identifying potential high-risk entities. Local training combined with collaborative model aggregation facilitates privacy protection, improves the performance of risk models, and enhances fraud detection. Whitmore et al. [26] proposed FedRisk, a privacy-aware FL-based risk control method that balances model accuracy with data confidentiality across institutions. Abadi et al. [25] introduced a scalable privacy-preserving FL mechanism tailored for financial fraud detection. However, most FL studies have focused on static label prediction tasks, such as credit scoring and fraud detection, and primarily emphasize collaborative training. For dynamic quantitative strategies that require real-time data analysis and adaptive decision-making, existing FL mechanisms lack specialized support.

2.3. Heterogeneous Distributed Modeling and Communication Optimization Mechanism

In the era of big data, deep learning has found widespread application. However, conventional deep models struggle to generalize across domains due to data distribution shifts, which has led to the rise of cross-domain learning. This paradigm aims to transfer knowledge from one domain to enhance learning in another, often under limited data availability or labeling constraints [27]. Yet, due to data heterogeneity and distributional divergence, challenges such as poor generalization between source and target domains, increased training complexity, and reduced computational efficiency persist. To address these challenges, recent approaches have incorporated path attention mechanisms, local regularization terms, and gradient compression techniques. Path attention, an extension of self-attention, enables the model to assign differentiated weights based on the relevance of gradient or parameter update paths, enhancing performance on heterogeneous data [28]. In financial trading, where data originate from diverse sources, path attention can improve model precision by emphasizing critical update paths during training, thereby adapting more effectively to market dynamics. Given input feature maps F R C × H × W , where C is the number of channels and H and W are the spatial dimensions, global average pooling (GAP) and global max pooling (GMP) are computed as follows [29]:
F avg ( c ) = 1 H × W i = 1 H j = 1 W F ( c , i , j ) , c [ 1 , C ] F max ( c ) = max i , j F ( c , i , j ) , c [ 1 , C ]
Local regularization terms are designed to minimize distributional discrepancies between source and target domains by constraining model complexity in local regions. This improves generalization and mitigates overfitting [27]. In heterogeneous environments, local regularization enhances model adaptability and accelerates convergence, particularly under high-frequency trading conditions. Chen et al. [30] argued that local regularization fosters sparse, well-generalized regression models with faster convergence. Gradient compression has become a vital technique in distributed learning. In cross-domain settings with large-scale, unevenly distributed data, compression reduces the overhead of storing and transmitting gradients. By eliminating redundant updates during training, compression accelerates learning, especially in multi-domain or federated environments [31]. Thus, in high-frequency trading with distributed heterogeneity, gradient compression offers high adaptability. Li et al. [32] demonstrated that gradient compression maintains model accuracy while improving efficiency and simplicity.
Techniques such as path attention, local regularization, and gradient compression together form the conceptual foundation of the FQL framework. Specifically, FQL integrates a Quality-Aware Aggregation Mechanism to enhance cross-client update reliability, an adaptive optimization strategy to improve local learning under non-IID conditions, and a communication-efficient gradient processing module to reduce transmission overhead. These components are closely interrelated and jointly address the core challenges of statistical heterogeneity, structural inconsistency, and bandwidth constraints in federated financial modeling.

3. Materials and Method

3.1. Data Collection

The data collection process was conducted across three major global financial regions, namely the United States, Europe, and the Asia-Pacific markets. For the U.S. region, representative constituent stocks from the NASDAQ-100 index were selected, covering sectors such as technology, healthcare, and finance. Data were primarily obtained from Yahoo Finance and the official NASDAQ data API to ensure the authority and timeliness of price and volume information, as shown in Table 1. In the European region, the focus was placed on core constituents of the Stoxx 600 index, which span manufacturing, energy, and financial sectors in countries including Germany, France, and the United Kingdom. Data were collected from Bloomberg Terminal and Eurostat, complemented by macroeconomic indicators publicly released by the European Central Bank (ECB). For the Asia-Pacific region, the top-cap constituents of the MSCI Asia ETF were selected, covering securities traded on exchanges in Hong Kong, Singapore, and Taiwan. Data sources included the Singapore Exchange (SGX), the Taiwan Stock Exchange (TWSE), and Bloomberg Asia databases, reflecting diverse market behaviors under different institutional and regulatory frameworks. All price data include daily open, close, high, low prices, and trading volumes, aligned to a consistent timeline across all assets from 1 January 2014 to 31 December 2023, to ensure synchronized distributions during the training phase. Macroeconomic factors include, but are not limited to, the U.S. VIX index, the Federal Funds Rate, the Eurozone CPI, interest rate spreads, and major exchange rates (USD/EUR, USD/CNY, USD/JPY). These indicators were collected on a daily or weekly basis and validated through historical macro-financial databases such as FRED and Investing.com, with imputation applied where necessary. To ensure data quality, timestamp alignment, multi-source consistency checks, and outlier removal mechanisms were implemented. All data were ultimately stored in a structured daily-frequency format, and time-series samples were independently drawn and partitioned for each region to accommodate the heterogeneous distributions encountered in federated training clients. Through this systematic collection process, a cross-market federated financial dataset was constructed, encompassing both trading records and macroeconomic factors, characterized by high temporal resolution, structural heterogeneity, and strong market representativeness.

3.2. Data Preprocessing and Augmentation

In financial markets, asset prices often exhibit substantial variation, particularly in the stock market where magnitudes and volatilities differ significantly across assets. To enhance comparability among different assets, log return transformation was applied to the price data at each time point. This transformation reduces the impact of scale discrepancies and converts the data into a distribution more closely resembling normality, which is critical for downstream modeling. The formula for log return is defined as follows:
r t = ln P t P t 1 ,
where r t denotes the log return at time t, and P t and P t 1 represent the asset prices at time t and t 1 , respectively. This transformation eliminates scale effects and enables the model to more accurately capture relative asset performance. Due to the significant differences in the value ranges of features such as price, volume, and technical indicators, improper scaling may lead to instability in gradient descent and slower convergence during training. To mitigate the adverse effects of scale imbalance, we applied feature normalization, which rescales the input data to a fixed range, ensuring numerical comparability across features. Specifically, min-max normalization was used to transform the data to a range between 0 and 1, defined as follows:
x = x x min x max x min ,
where x denotes the normalized value, x is the raw input, and x min and x max are the minimum and maximum values of the feature, respectively. Z-score standardization was also used to transform data into data with zero mean and unit variance to stabilize the training process and improve the convergence rate of models that are sensitive to the input distribution (such as models using batch normalization). The standardization formula is given by the following:
x = x μ σ ,
where x denotes the standardized value, x is the raw input, and μ , σ are the mean and standard deviation of the feature, respectively. Missing values are common in financial datasets, often caused by data acquisition errors or trading halts. The presence of missing values can interfere with training and impair model accuracy. To address this issue, we employed multiple imputation by chained Equations (MICE), a widely adopted and robust framework for handling missing data in time series and panel structures. MICE iteratively models each variable with missing values as a regression on the other variables, thereby generating multiple plausible imputations that reflect the joint distribution of the data. In our implementation, we used a regression-based imputation model within the MICE procedure, and employed Markov Chain Monte Carlo (MCMC) sampling to approximate the posterior distribution of the missing entries. This stochastic sampling process reduces bias and better preserves the statistical structure of the dataset by generating a distribution of estimates rather than relying on single-point imputations. The regression step is formalized as follows:
Y mis = X · β + ϵ ,
where Y mis denotes the missing values, X is the matrix of observed predictors, β represents the regression coefficients, and ϵ is the error term. Through this process, the imputed values maintain the structural coherence of the original dataset and support stable downstream learning. Through this method, the imputed values retain the data’s structural properties and minimize the loss of information. To improve model generalization, data augmentation techniques were introduced. Data augmentation aims to increase data diversity through various transformations, enabling models to learn more robust representations of underlying market dynamics. In the context of quantitative modeling, data diversity is essential, as randomly perturbed samples help the model generalize across different market scenarios. Therefore, masked return and Gaussian perturbation techniques were employed. Masked return augmentation randomly selects a time window from the input sequence and replaces its values with missing entries or zeros to simulate data anomalies. This enhances model robustness by exposing it to noise and incomplete information, mimicking real-world disruptions such as news events or corporate announcements. This process improves the model’s tolerance to data imperfections and prepares it for unexpected situations during deployment. Gaussian perturbation introduces stochastic noise into the input data to simulate market randomness. By adding Gaussian noise with zero mean and variance σ 2 to each data point, this method diversifies the training samples and encourages the model to extract stable patterns from noisy inputs. The perturbation is applied as follows:
X perturbed = X + N ( 0 , σ 2 ) .
In financial modeling, historical data are critical for forecasting future trends. To capture temporal patterns in price fluctuations, a sliding window approach was used to generate training samples. A window size of 20 days was applied, sliding forward one day at a time to create sequential training inputs. Each sample corresponds to a 20-day window, with the associated label derived from the subsequent 5-day return signal. The target is set to 1 if prices increase over the next five days and 0 otherwise. The process is formalized as follows:
X t = { P t 20 , P t 19 , , P t 1 }
Y t = { P t , P t + 1 , , P t + 5 } ,
where X t denotes the past 20-day price sequence, and Y t represents the following 5-day price observations. This formulation enables the model to effectively learn short-term price trends and produce timely predictions of directional movements.

3.3. Proposed Method

3.3.1. Overall

The overall architecture of the proposed FQL framework, as shown in Figure 1, is structured around four sequential stages: local modeling, gradient processing, path-level aggregation, and global optimization. Initially, the processed local trading data and macroeconomic indicators are separately fed into the local strategy modeling networks of each financial institution. A unified prediction backbone, such as a Transformer or LSTM variant, is employed to generate local strategy parameters at each client. Upon completing several rounds of local training, clients do not transmit the entire set of model parameters. Instead, the most informative gradients are selected using the Gradient Clipping and Compression Module, wherein the top-K gradients are identified and quantized to significantly reduce transmission volume.
Before being uploaded to the central server, the compressed gradients are appended with path-related metadata, including indicators such as historical gradient volatility and local strategy performance. On the server side, the Path Attention Aggregation Module dynamically evaluates each client’s upload path by computing attention scores and performs weighted aggregation, filtering out unstable or inefficient contributions to enhance the credibility and effectiveness of the global update. The resulting global model is then broadcast to all clients, initiating the next training round. In addition, to address structural and volatility heterogeneity across markets, each client incorporates a Heterogeneity-Aware Optimizer during local training. This module adaptively adjusts optimizer parameters based on local market dynamics, ensuring that the update process conforms to region-specific financial behaviors. The module operates within each round of local training and forms a closed optimization loop with the global aggregation stage, thereby ensuring that the FQL framework simultaneously maintains communication efficiency, privacy preservation, and strong strategic adaptability across institutions.

3.3.2. Path Attention Aggregation Module

In conventional self-attention mechanisms, the input typically consists of vectors or sequences of image patches. The primary objective is to compute the pairwise interaction strength among elements, thereby producing context-sensitive representations. These methods focus on intra-sample relationships and have been widely adopted in NLP and computer vision. In contrast, the Path Attention Aggregation Module proposed in this work is designed for inter-client path-level importance modeling. Specifically, it aims to dynamically evaluate the contribution of each client’s update trajectory—defined by its historical training behavior and transmitted parameter sequences—to the global model’s training process. This approach targets the relative importance and stability of strategic paths across clients and represents a federated-level attention mechanism. As such, it differs significantly from conventional attention in terms of modeling granularity, input semantics, and normalization objectives.
As shown in Figure 2, the Path Attention module is implemented as a lightweight three-layer fully connected neural network. The input to the network is a feature vector for each client’s upload path, comprising two principal categories of information: (1) gradient stability indicators, which capture the consistency of local updates over recent rounds. These include the historical standard deviation of gradient norms, defined as σ i = Std ( θ i ( t j ) ) for j = 1 , , k , and the average pairwise cosine similarity between recent gradients, computed as Cos Sim i = 1 k 1 j = 1 k 1 cos θ i ( t j ) , θ i ( t j 1 ) , which quantifies the directional stability of local updates; and (2) strategy performance indicators, which reflect the economic quality of a client’s local model. These include the average validation return r i = 1 T t = 1 T R i ( t ) , and the Pearson correlation coefficient between the client’s predicted returns and the global model’s predictions over a held-out set, defined as Corr i = corr ( R ^ i , R ^ global ) . These features are concatenated and passed through the attention network to generate client-specific weights for aggregation. The network structure consists of three layers: the input layer with dimensions [ b a t c h _ s i z e , 8 ] , a hidden layer with 64 units activated by ReLU, and an output layer that produces the attention weight α i for each path, normalized using the Softmax function. The computational flow is defined as follows:
h i ( 1 ) = ReLU ( W 1 x i + b 1 ) , W 1 R 8 × 64 ,
h i ( 2 ) = W 2 h i ( 1 ) + b 2 , W 2 R 64 × 1 ,
α i = exp ( h i ( 2 ) ) j exp ( h j ( 2 ) ) ,
here, x i denotes the path feature vector for client i, and α i represents the corresponding attention weight used in gradient aggregation. The global parameter update is computed by performing a weighted summation of the client gradients based on their attention scores:
θ ( t + 1 ) = i = 1 N α i · θ i ( t ) ,
this module operates synergistically with the Heterogeneity-Aware Optimizer. The latter improves the quality and stability of local gradient updates, thereby enhancing the discriminative power of the attention mechanism in evaluating client contributions. As a result, low-quality paths are effectively suppressed during aggregation. At the system level, this forms a positive feedback loop: the heterogeneity-aware optimization improves local training quality, while the path attention module enhances the global aggregation process. This cooperative dynamic ultimately strengthens the robustness and strategic performance of the FQL framework. The aggregation branch illustrated in the system diagram (see the “Aggregate” block in the Figure 2) corresponds to this integrated mechanism.

3.3.3. Gradient Clipping and Compression

The proposed Gradient Clipping and Compression Module is designed to address communication bottlenecks caused by inconsistent cross-border network bandwidth in federated training and to enhance both training robustness and convergence stability. As shown in Figure 3, after completing local training, each client first performs L 2 -norm-based gradient normalization and clipping. Subsequently, sparse selection and quantized compression are applied before transmitting the gradients to the central server for global aggregation. This module does not follow the structure of conventional deep networks but instead functions as a gradient-path compression subsystem, aligned with the router and rescaler structures illustrated in the module diagram.
Let the gradient vector at client i be θ i R d . To prevent gradient explosion or instability, L 2 -norm clipping is applied as follows:
˜ θ i = θ i max 1 , | θ i | 2 C ,
where C is a predefined clipping threshold, typically set to C = 1.0 or adjusted dynamically based on the historical volatility of the client. This operation ensures that | ˜ θ i | 2 C , thereby preventing any single client from disproportionately influencing the global model. Following clipping, the module performs Top-K sparse selection. Let K denote the upload ratio (e.g., 1%), and define the sparse selection operator T K ( · ) , which retains the K % elements with the largest absolute values and sets the rest to zero, as follows:
θ i ( K ) = T K ( ˜ θ i ) .
To further reduce communication overhead, a 1-bit quantization operation is introduced. This retains only the sign of the non-zero elements and transmits their average magnitude, allowing the server to reconstruct the compressed gradient. The quantized representation is defined as follows:
q i = sign ( θ i ( K ) ) · m ¯ i , m ¯ i = 1 K j supp ( θ i ( K ) ) | θ i , j ( K ) | .
The final upload consists of the sparse index set supp ( · ) and the average magnitude m ¯ i , achieving high compression rates. At the server, linear mapping is used to reconstruct the global gradient. This mechanism corresponds to the router–rescaler structure depicted in the diagram, where routers channel gradients into compression paths based on Top-K importance, and rescalers perform normalization and dequantization. Although 1-bit quantization significantly improves communication efficiency, it inherently sacrifices fine-grained information about gradient magnitudes, which may lead to biased updates or hinder convergence in practice. To alleviate this, the FQL framework introduces a Path Attention Module, in which the compressed gradients are aggregated not uniformly, but weighted by attention scores computed from each client’s historical stability and performance. This design ensures that more reliable and consistent updates exert greater influence during aggregation, effectively compensating for the resolution loss caused by aggressive quantization. The synergy between sparsity-aware compression and quality-weighted aggregation leads to a “high-quality, high-weight” optimization scheme that preserves both robustness and convergence. Mathematically, the global aggregation can be expressed as follows:
θ ( t + 1 ) = i = 1 N α i · q i ,
where α i is the attention weight from the path module and q i is the compressed gradient. Theoretically, this joint strategy constructs a weighted minimum-bias estimator in the compressed gradient space, with the upper bound on error given by the following:
E [ | θ ( t + 1 ) θ * | 2 2 ] O 1 K N i = 1 N α i 2 · | θ i θ * | 2 2 ,
this demonstrates that the compression module not only reduces transmission costs but also, when integrated with path-aware weighting, preserves convergence stability and robustness under heterogeneous market data distributions.

3.3.4. Heterogeneity-Aware Adaptive Optimizer

In federated quantitative strategy modeling, substantial structural differences exist among national and regional financial institutions, including disparities in trading mechanisms, asset liquidity, volatility patterns, and policy-driven dynamics. These lead to strongly non-independent and identically distributed (non-IID) client data. Applying a uniform optimization strategy across such environments may result in local overfitting or failure to converge. To address this challenge, a Heterogeneity-Aware Adaptive Optimizer is introduced. This module dynamically adjusts optimization parameters during local training to align with each client’s market-specific characteristics, while maintaining convergence and consistency during global aggregation. The proposed mechanism builds upon the Adam optimizer and incorporates an adaptive controller network. The controller takes market volatility indicators—such as historical volatility, volume variation coefficients, and skewness of return distributions—as input and outputs the optimizer’s learning rate η i , momentum coefficient β i , and weight decay factor λ i for the current round. The controller network consists of two fully connected layers, with input dimension [ b a t c h _ s i z e , 4 ] , a hidden layer of width 32 activated by LeakyReLU, and an output layer of dimension 3 corresponding to the three adaptive hyperparameters. These outputs are directly integrated into the standard Adam update rules as follows:
m t = β i m t 1 + ( 1 β i ) θ t , v t = λ i v t 1 + ( 1 λ i ) ( θ t ) 2 ,
θ t + 1 = θ t η i · m t v t + ϵ ,
the parameters η i , β i , and λ i are thus adaptively determined per client, allowing each to follow a locally optimized update trajectory in line with its market characteristics. This design helps clients avoid suboptimal convergence or divergence arising from structural mismatches. To ensure consistency within the federated system, a cross-round consistency factor c i is computed by the server based on each client’s path variation over the previous three rounds. This feedback is used to adjust learning rates before aggregation, according to the following:
η i ( n e w ) = η i ( o l d ) · ( 1 γ · c i ) ,
where γ is a scaling coefficient. A larger c i indicates greater deviation from the global strategy, warranting a reduced learning rate. This mechanism is particularly valuable in tandem with the Path Attention Module: when a client exhibits significant deviation due to structural heterogeneity, the adaptive optimizer reduces its influence, preventing adverse effects on the global model. Therefore, by jointly leveraging the heterogeneity-aware optimization and path attention mechanisms, the FQL framework achieves greater stability and convergence speed in heterogeneous environments, ultimately improving the generalization and robustness of cross-market trading strategies.

4. Results and Discussion

4.1. Experimental Setup

4.1.1. Evaluation Metrics

To comprehensively assess the performance of the FQL framework across financial markets, several widely adopted financial evaluation metrics were employed. These included Annualized Return, Sharpe Ratio, Maximum Drawdown, Volatility, and Communication Cost (in terms of communication rounds or transmission size). These metrics were designed to quantify various aspects such as profitability, risk-adjusted return, exposure to market downturns, asset price volatility, and overall efficiency and scalability. The mathematical definitions are provided as follows:
Annualized Return = V T V 0 1 T 1 ,
Sharpe Ratio = E [ R p R f ] σ p ,
Max Drawdown = max t [ 0 , T ] max s [ 0 , t ] V s V t max s [ 0 , t ] V s ,
Volatility = σ p
Here, V 0 and V T denote the portfolio value at the beginning and end of the investment period, respectively; V t represents the asset value at time t; R p is the portfolio return; R f is the risk-free interest rate; σ p is the standard deviation of portfolio returns; and E [ · ] denotes the expectation operator.

4.1.2. Baselines

The proposed method was compared against the following baseline methods: FedAvg [33], FedProx [34], FedOpt [35], Local-only [36], Centralized [37], FedNova [38], and MOON [39].
FedAvg (Federated Averaging) alternates between local stochastic gradient updates on clients and global model averaging on the server. It is one of the most commonly used methods in FL due to its simplicity, generality, adaptability, and computational efficiency. FedProx is a generalized and reparameterized version of FedAvg, which introduces additional proximal terms to improve convergence behavior under data heterogeneity. FedOpt is an optimization-based federated framework that integrates local and global updates to enhance performance, achieving high accuracy and fast convergence. The Local-only baseline involves each financial institution independently learning its strategy without any federated aggregation, serving as a privacy-preserving reference. This method offers complete data isolation, zero communication overhead, and high implementation simplicity. The Centralized method, by contrast, aggregates raw data from all institutions to train a unified global strategy, providing a reference for the upper-bound performance. It features higher accuracy and model expressiveness by leveraging complete data integration. FedNova is designed to address the inconsistency in local update steps and data distributions across clients by introducing a normalization factor to standardize local updates. In the experiments, FedNova was applied across all three regional sub-datasets, with optimization parameters configured according to the original implementation to ensure stable and fair aggregation. MOON introduces a contrastive learning mechanism into federated training. In the experiments, MOON adopted the same prediction network as the FQL framework, with the contrastive loss coefficient set to μ = 5 . The global reference model was synchronously updated at each aggregation round to ensure feature stability. The introduction of MOON provides critical support for validating cross-market strategy consistency.

4.1.3. Hardware and Software Platform

All experiments were conducted on a distributed computing environment composed of multiple GPU-enabled nodes. Each local client was simulated on a separate node equipped with an NVIDIA RTX 3090 GPU (NVIDIA Corporation, Santa Clara, CA, USA), 24 GB VRAM, Intel Xeon Gold 6226R CPU (Intel Corporation, Santa Clara, CA, USA), and 256 GB RAM. The central server was deployed on a high-performance computing node with dual NVIDIA A100 GPUs, 80 GB VRAM each, and 512 GB RAM to support global aggregation and model broadcasting. The inter-node communication was implemented via a simulated federated communication framework over TCP/IP with adjustable bandwidth constraints to emulate real-world cross-border network conditions. The entire FL system was implemented in Python v3.9 using the PyTorch v2.0 deep learning library. The federated communication protocol and coordination logic were built using the Flower framework, which supports customized training loops and client-server interactions. For experimental reproducibility, random seeds were fixed, and all clients followed synchronized training schedules. Evaluation metrics were calculated using NumPy and Pandas, while visualization was performed using Matplotlib v3.8.4 and Seaborn v0.13.2. The system environment ran on Ubuntu v20.04 LTS with CUDA v11.8 and cuDNN v8.6 support. All model checkpoints, logs, and configurations were saved and managed via the Weights and Biases platform for version control and experimental tracking.

4.2. Performance Comparison Across Baseline Methods in Cross-Market Financial Strategy Modeling

This experiment was designed to evaluate the overall performance of various FL strategies in cross-market financial strategy modeling, aiming to verify the advantages of the proposed FQL approach in terms of profitability, risk control, and market volatility adaptation. By comparing several representative baseline methods—including traditional averaging (FedAvg), robust heterogeneous optimization approaches (FedProx, FedNova), contrastive learning-enhanced methods (MOON), optimizer-driven strategies (FedOpt), non-federated local models (Local-only), and centralized training schemes (Centralized)—the evaluation covered the major paradigms in federated modeling. The results demonstrate that FQL achieves notable advantages in annualized return and Sharpe ratio, while also maintaining stability in maximum drawdown and volatility, comparable to or surpassing centralized methods. These findings suggest that high-quality strategy learning can be achieved under privacy-preserving constraints.
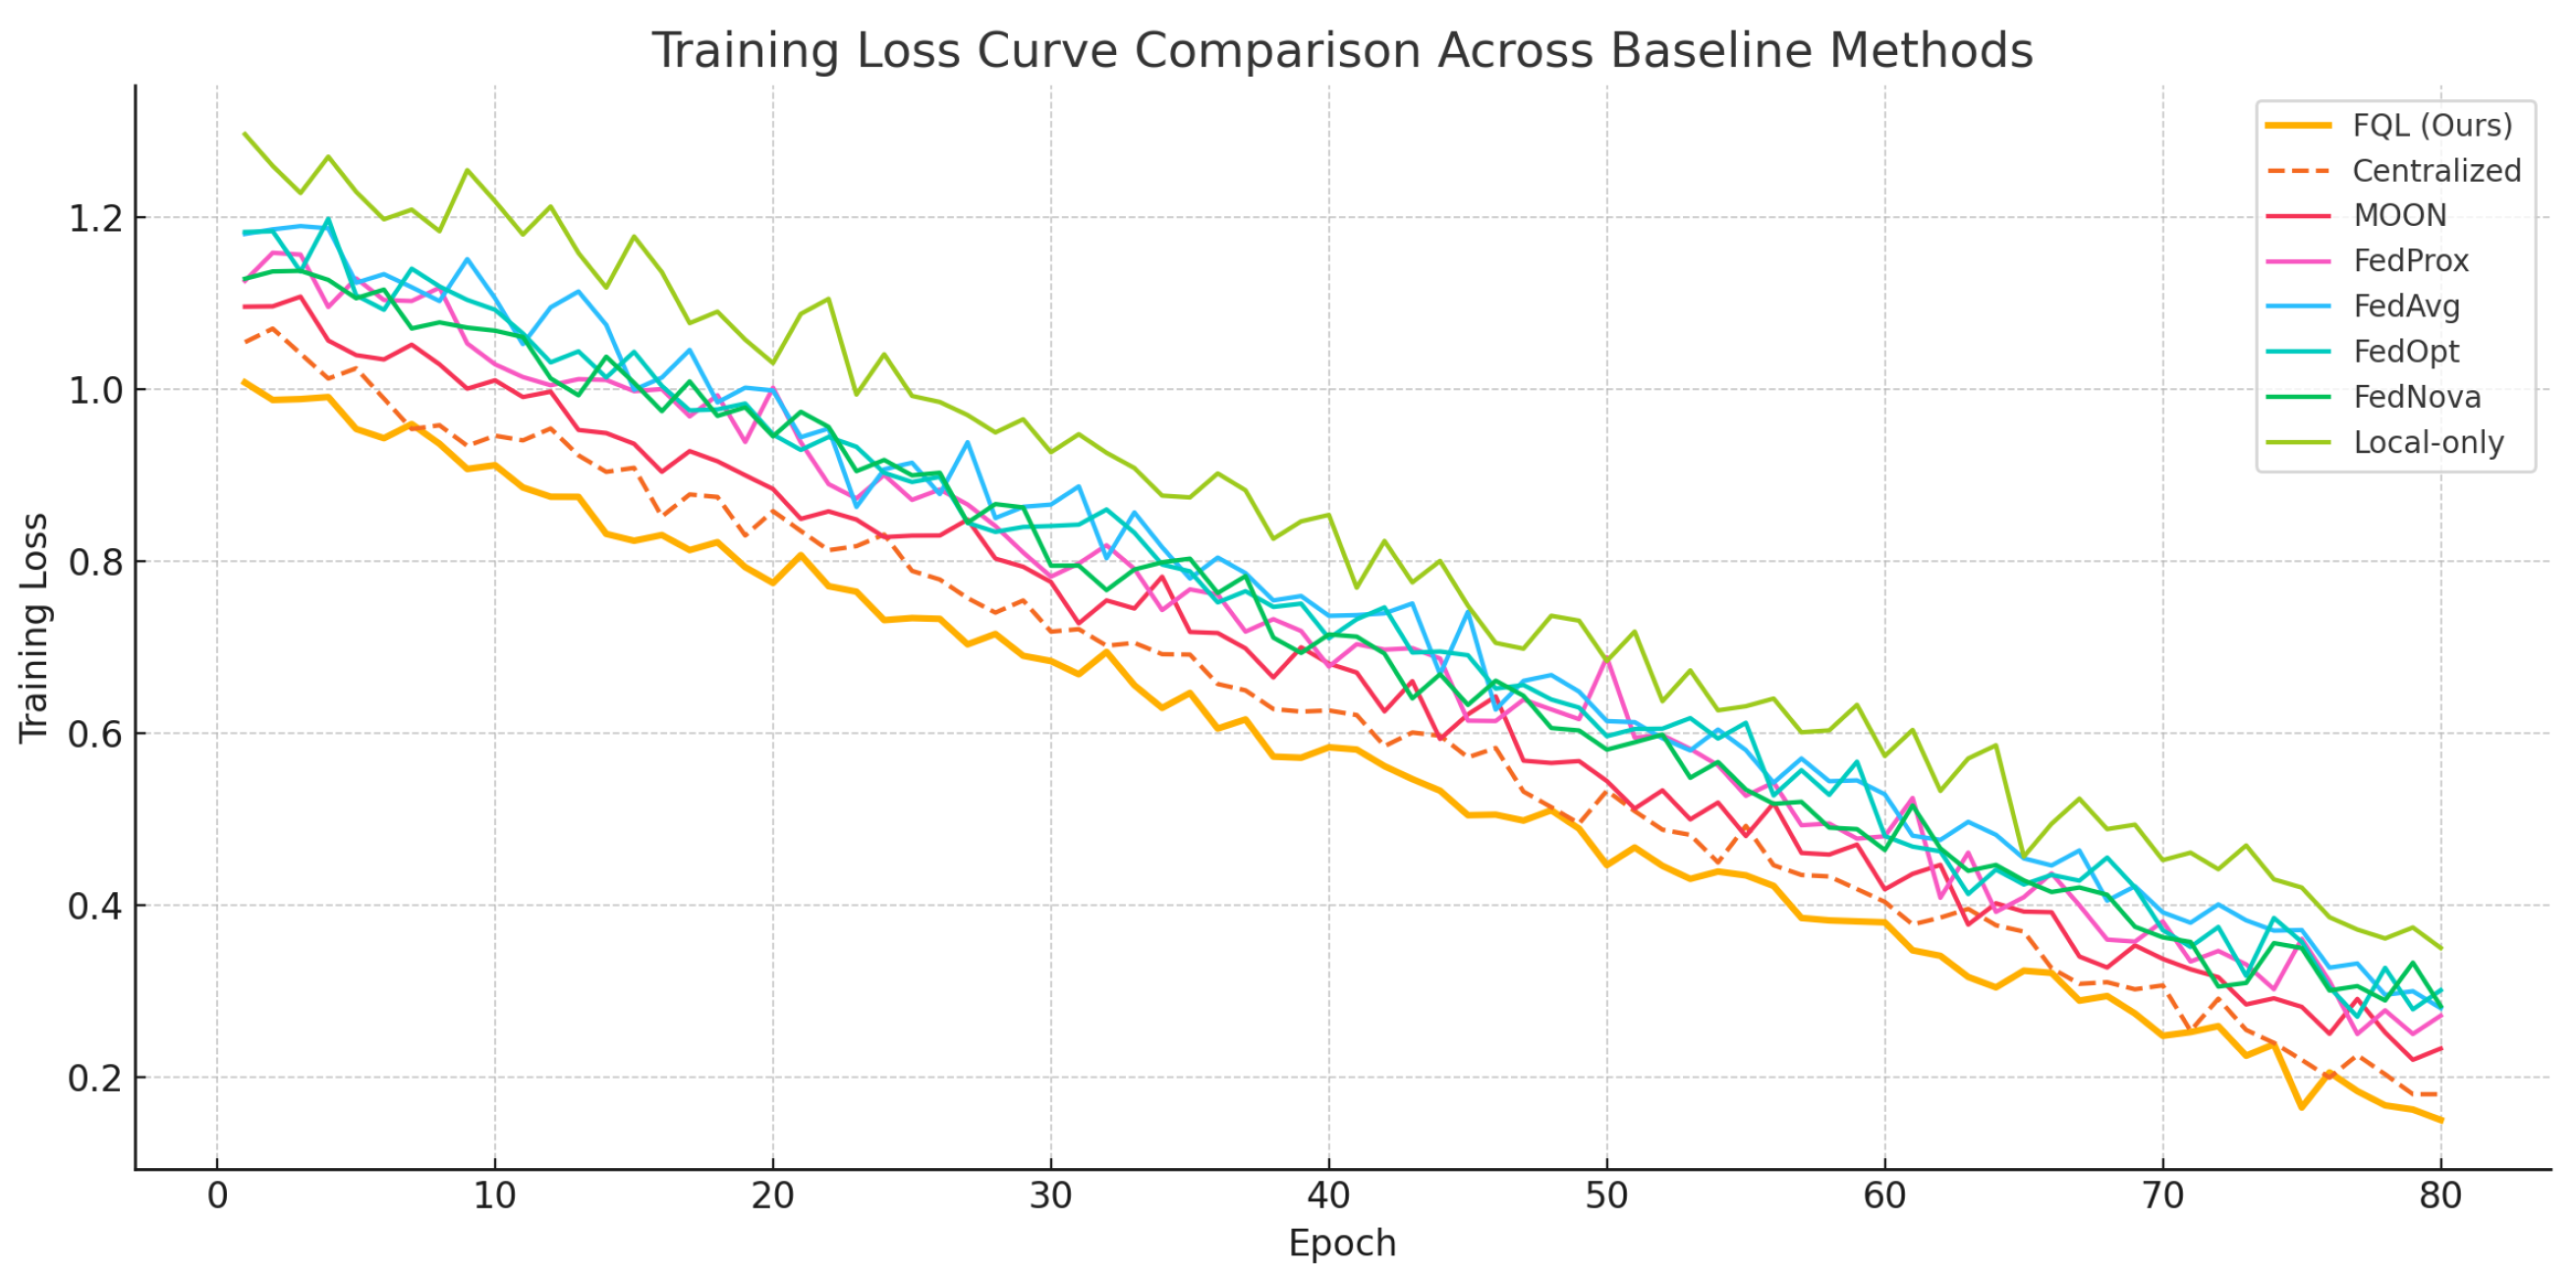
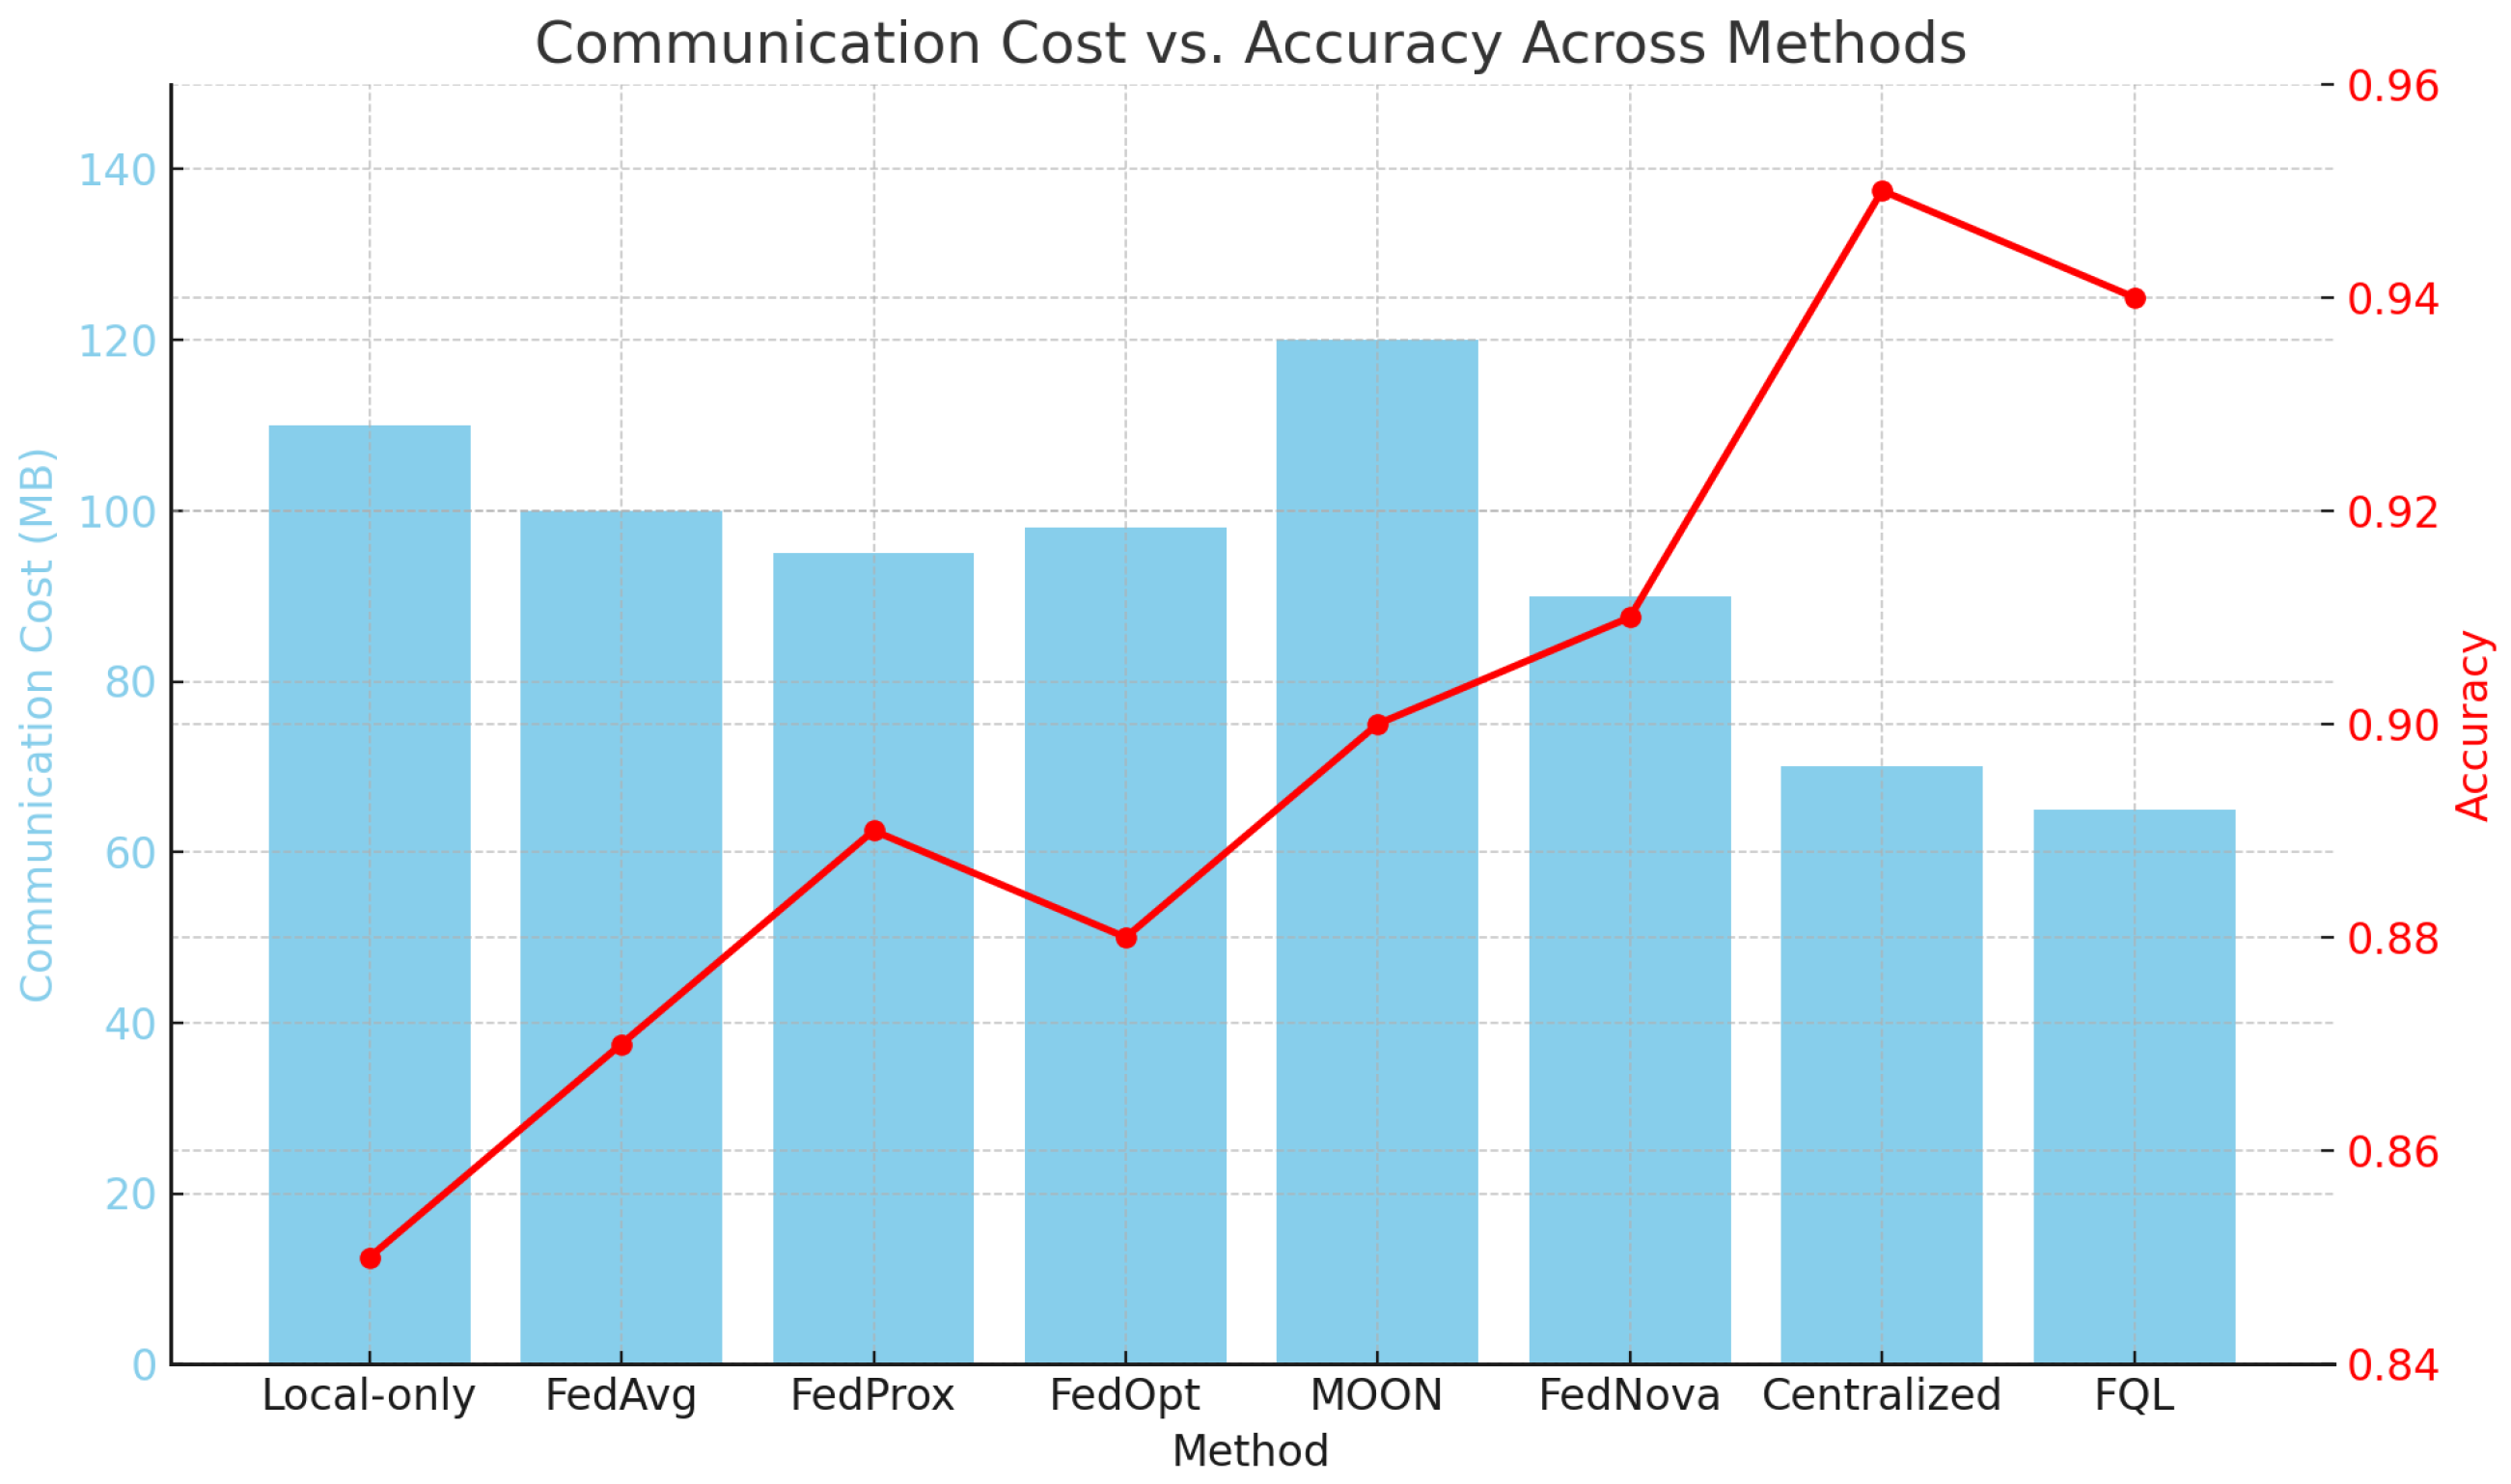
As shown in Table 2 and Figure 4, Figure 5 and Figure 6, the Local-only method, relying solely on local data, fails to capture global market synergy, resulting in the weakest performance. FedAvg adopts uniform averaging without adapting to heterogeneous data, leading to limited effectiveness in risk control. FedProx enhances robustness through regularization during local updates, improving convergence stability. FedOpt improves aggregation efficiency via optimizer-based updates but does not fully leverage inter-market information structures. MOON enhances model consistency under non-IID settings using local-global contrastive constraints, thereby improving generalization. FedNova mitigates data skew through normalized client updates, improving both returns and risk profiles. The Centralized strategy, free from privacy constraints, directly aggregates raw data for unified training, thus having a natural performance advantage. FQL, by jointly incorporating path attention, heterogeneity-aware optimization, and gradient compression, enables high-quality parameter fusion and stable updates across clients. This design theoretically aligns with a joint optimization over the communication and path-weighted spaces, offering superior generalization and robustness in multi-market scenarios.

4.3. Module Ablation Study of FQL Components

This experiment was designed to validate the independent contributions and synergistic effects of key components within the FQL framework, including the Gradient Clipping and Compression Module (GradClip+Compress), the heterogeneity-aware optimizer (Het-Optimizer), and the path attention mechanism (Path-Attention). By selectively removing each module and retraining the model, performance changes in terms of annualized return, Sharpe ratio, maximum drawdown, and volatility were observed to assess their roles in model robustness, convergence efficiency, and strategy stability.
As shown in Table 3, the complete FQL model outperforms all variants, especially in profitability and risk control, confirming the essential roles of each module under non-IID multi-market conditions. Mathematically, removing Path-Attention prevents quality-weighted aggregation of client-uploaded paths, allowing low-quality gradients to distort optimization precision. Eliminating the Het-Optimizer leads to shared learning rates and momentum across clients, disregarding market-specific volatility, which induces local oscillations and update bias. Without GradClip+Compress, gradient transmission lacks sparsity and robustness control, increasing communication redundancy and noise. The full FQL model, through the cooperative optimization of these modules, performs weighted selection and adaptive adjustments over compressed gradients, effectively introducing multi-regularization and mapping in stochastic optimization with non-i.i.d. perturbations. This enhances both the generalization ability and global stability of the strategy.

4.4. Comparison of Different Attention Mechanisms in Federated Aggregation

This experiment was conducted to examine the performance differences of various attention mechanisms in the federated aggregation process, particularly in cross-market financial strategy modeling tasks. Five attention strategies were evaluated: uniform aggregation, entropy-based attention, cosine similarity attention, temporal-decayed attention, and the proposed path quality attention mechanism. The goal was to assess their impacts on model returns, risk control, and convergence quality.
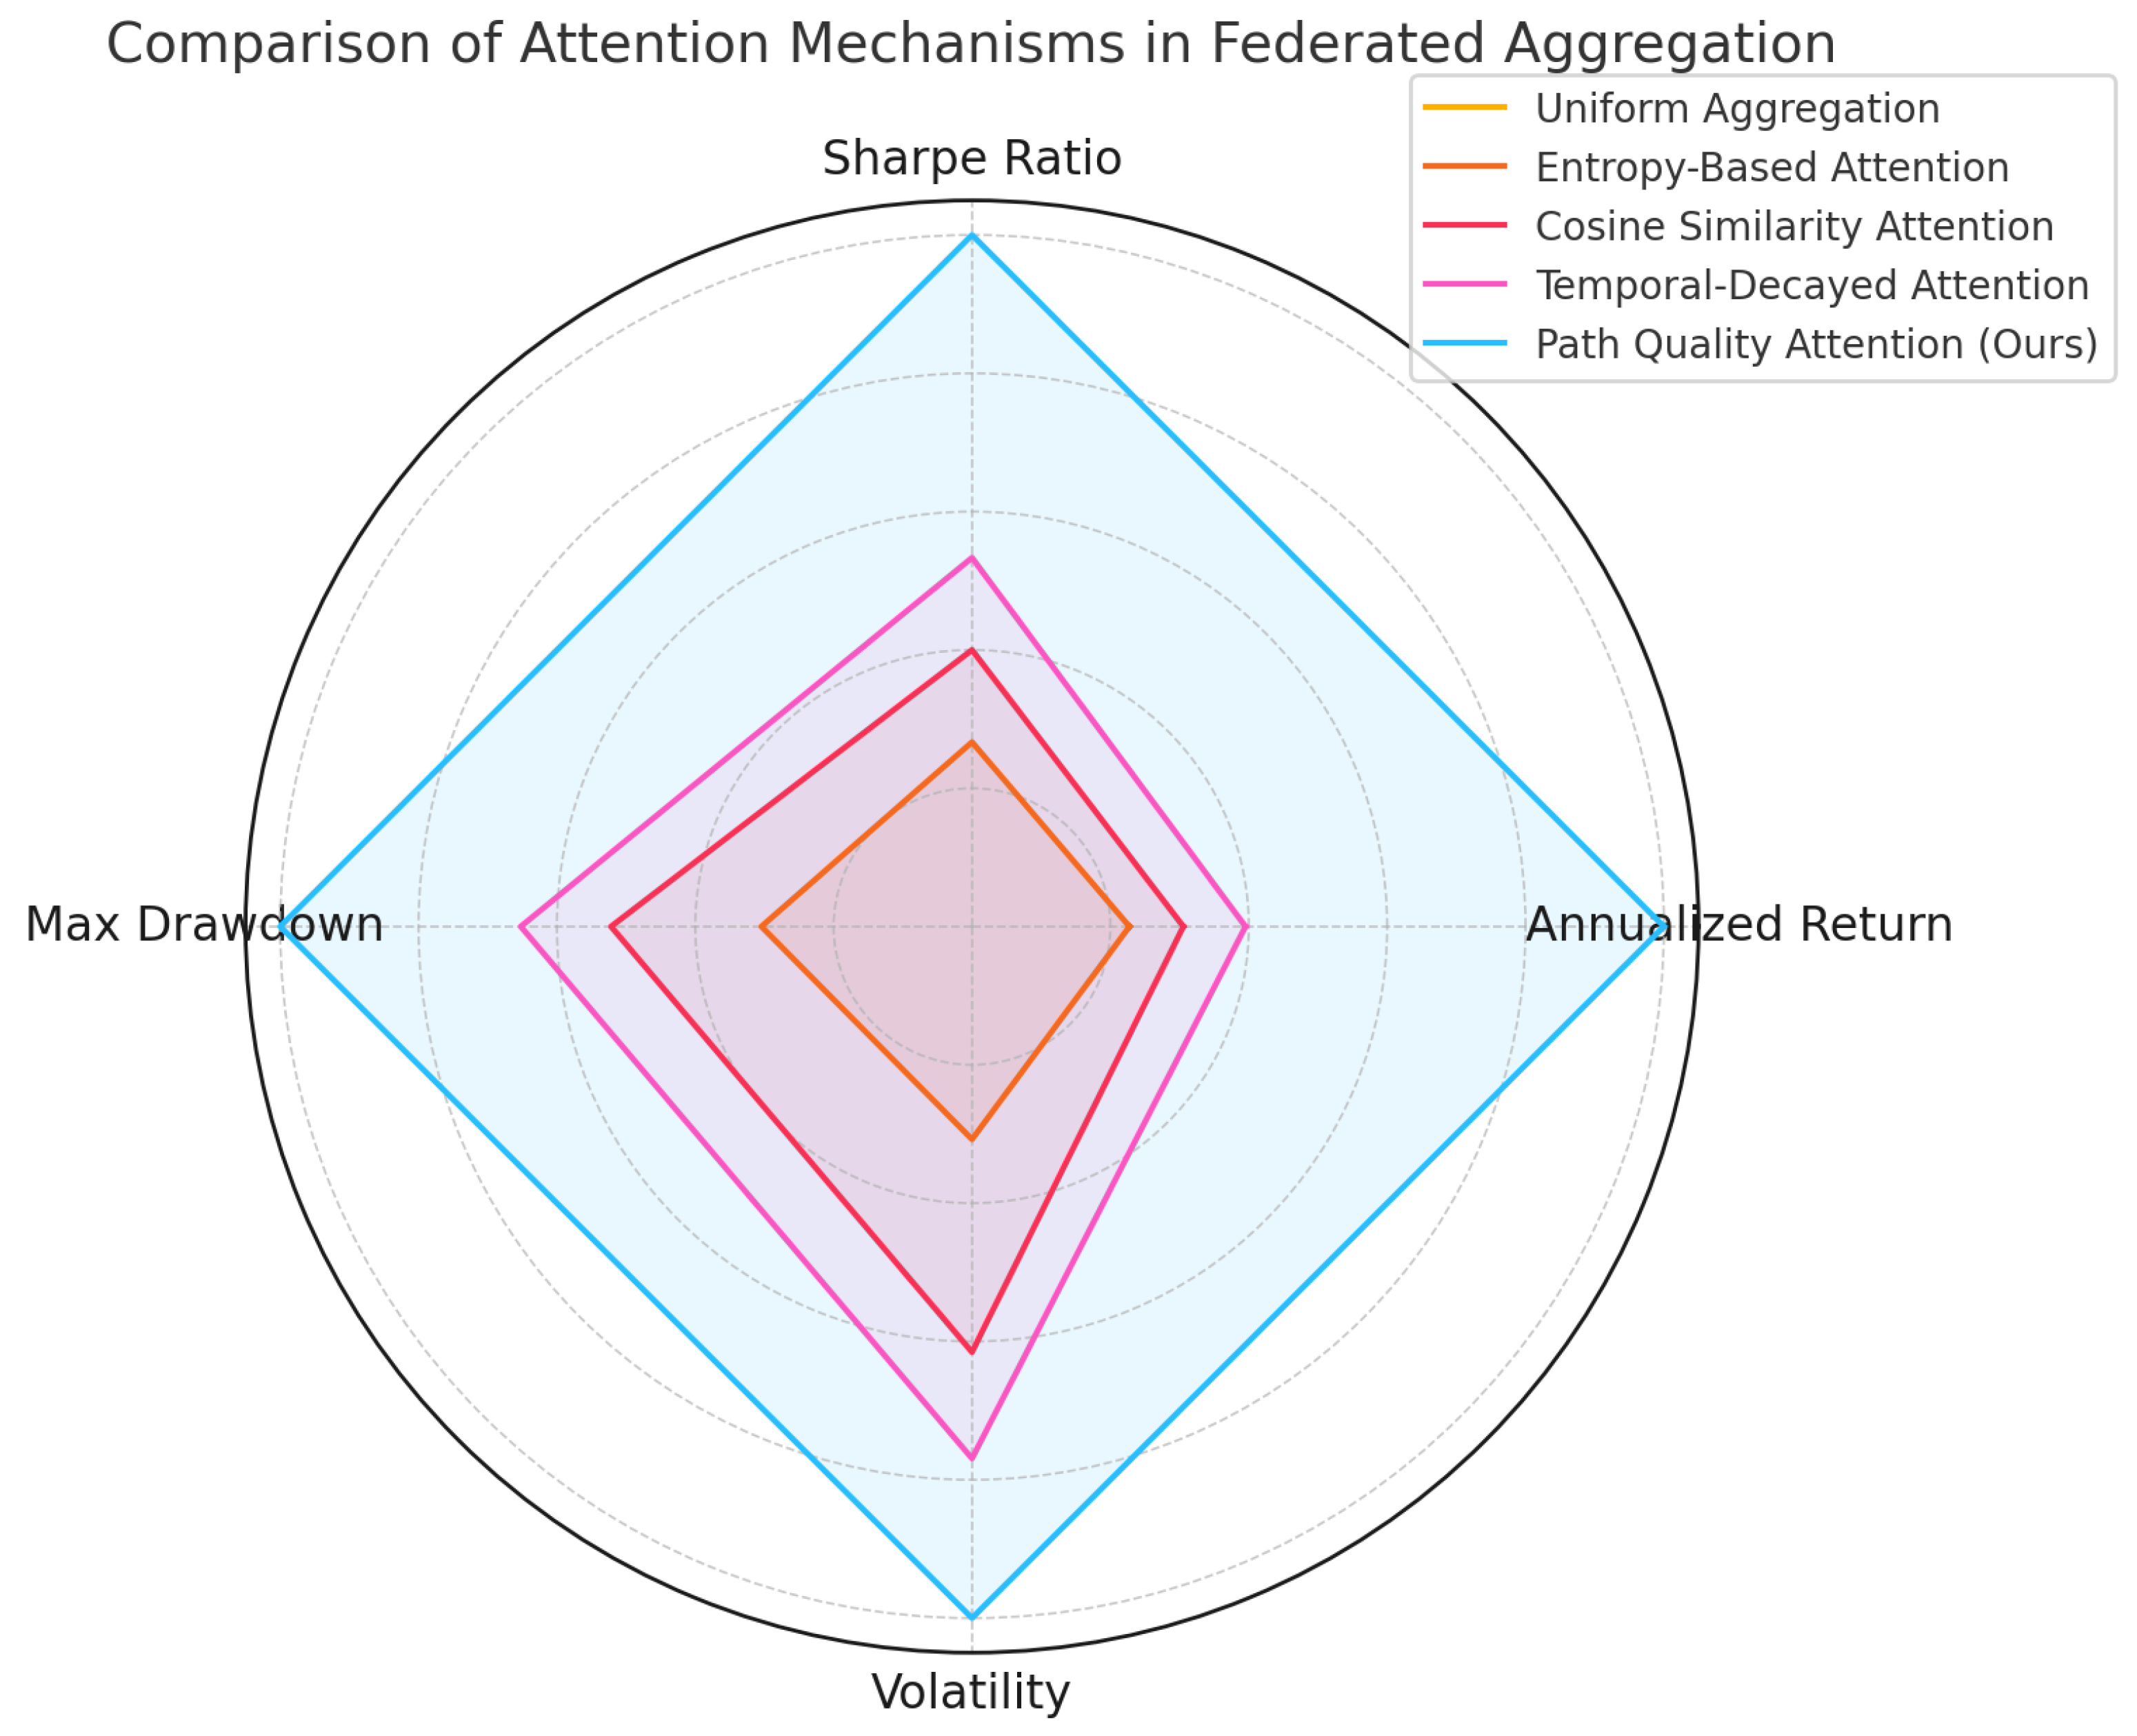
As shown in Table 4 and Figure 7, path quality attention outperforms all other mechanisms across evaluation metrics, delivering higher returns, a better Sharpe ratio, and reduced drawdown and volatility. This indicates superior optimization under non-IID and heterogeneous conditions. Mathematically, uniform aggregation lacks differentiation, introducing noise when client quality varies. Entropy-based attention leverages local uncertainty but neglects historical performance. Cosine similarity evaluates gradient alignment, enhancing local structure matching. Temporal-decayed attention accounts for update trends, promoting temporal coherence. In contrast, path quality attention constructs a high-dimensional quality function based on gradient sparsity, upload stability, and past returns, normalized through attention weights. This effectively forms a weighted variational lower bound on client contributions, stabilizing aggregation under noise and improving solution optimality. This design significantly improves federated utilization of high-quality clients.

4.5. Discussion

4.5.1. Robust Communication Efficiency Across Diverse Network Scenarios

To evaluate the effectiveness of the proposed gradient compression mechanism under various network conditions, three simulated communication scenarios were designed to measure changes in communication cost:
  • Normal Network Environment (10 MB/s bandwidth): This scenario reflects standard enterprise intranet or metropolitan area network speeds. Under such conditions, the proposed method reduced communication volume by an average of 32.7% without sacrificing model accuracy.
  • Bandwidth-Constrained Environment (1 MB/s bandwidth): This setting simulates remote agricultural regions or edge devices connected via cellular networks. In this scenario, conventional methods such as FedAvg experienced significantly increased latency. By contrast, our method maintained training stability while reducing gradient volume, achieving a 49.5% reduction in communication overhead and effectively avoiding model divergence.
  • Dynamic Client Environment (20% intermittent client dropout): This scenario models unstable client participation, a common issue in federated learning. Thanks to the integration of compression and asynchronous aggregation, the proposed method achieved faster and more reliable model updates with a retransmission rate below 5%. Overall, it reduced communication cost by 41.2%, demonstrating strong robustness to network fluctuations.
Table 5 presents the quantitative comparison of communication costs across these scenarios:
These results demonstrate that the proposed communication-efficient mechanism achieves consistent advantages across diverse deployment conditions, making it a robust solution for real-world federated learning environments.

4.5.2. Practical Applications Analysis

In practical applications of cross-market quantitative strategy construction and execution, non-identical data distributions and limited communication resources represent two of the most critical challenges. The proposed FQL framework has been validated across multiple real-world financial submarkets, demonstrating superior performance in terms of profitability, risk control, and convergence stability compared to existing FL strategies. In real-world deployment scenarios—such as strategy collaboration and sharing among multinational financial institutions—FQL enables effective protection of local data privacy, avoiding the direct transmission of raw transaction data. Meanwhile, through the integration of path quality-aware aggregation and heterogeneity-adaptive optimization modules, model contributions from structurally diverse markets can be efficiently quantified and aggregated, ultimately supporting the formation of globally robust investment strategies. For example, in the collaboration between a local brokerage in the Asia-Pacific region and a large asset management institution in Europe or North America, both parties aim to share volatility-driven market factors to optimize strategy parameters. However, constraints in data compliance, network latency, and collaborative modeling hinder the deployment of centralized training approaches. FQL allows local models to be evaluated dynamically for their strategic effectiveness via the path attention mechanism without exposing data. The server assesses the quality of each uploaded path based on historical return stability and gradient direction variability, enabling asymmetric weighted aggregation. Furthermore, given the distinct trading regimes in the Asia-Pacific market relative to mainstream Western markets, the Heterogeneity-Aware Optimizer adaptively adjusts learning rates and momentum based on local volatility characteristics. This effectively mitigates local overfitting and enhances model adaptability. Empirical results show a marked improvement in the robustness of strategies for low-liquidity assets, underscoring the practical applicability of the proposed framework in high-frequency strategy transfer and fine-tuning. It also introduces a novel technical paradigm for the future automation of cross-border strategy deployment.

4.5.3. Analysis of Inter-Module Collaboration Mechanism

Within the FQL framework, the Path Attention Aggregation Module, Heterogeneity-Aware Adaptive Optimizer, and Gradient Clipping–Compression Module operate not as independent components but as an interdependent and self-reinforcing system. The Path Attention Aggregation Module serves as the “quality gatekeeper” of global aggregation, dynamically assigning aggregation weights based on gradient stability metrics (e.g., variance of gradient norms, cosine similarity across recent updates) and economic performance indicators (e.g., stability of validation returns). In doing so, it mitigates the adverse impact of low-quality gradients—often originating from non-IID or highly volatile markets—on the convergence trajectory. The Gradient Clipping–Compression Module substantially reduces communication overhead through sparsification and quantization; however, such compression inevitably introduces information loss and aggregation bias. The attention mechanism compensates for this by amplifying the contribution of stable, high-quality updates during aggregation, effectively implementing a weighted denoising process in the compressed gradient space. Concurrently, the Heterogeneity-Aware Adaptive Optimizer adapts learning rates, momentum, and weight decay in response to local market volatility and structural heterogeneity, where gradient stability itself constitutes a key input to the attention scoring process. This creates an adaptive feedback loop in which optimizer-driven parameter adjustments influence the stability of subsequent local updates, which in turn modify their future attention weights. Theoretically, this interaction can be viewed as a two-level stochastic optimization process: the inner level involves adaptive local optimization shaped by the Heterogeneity-Aware Optimizer, while the outer level performs quality-weighted aggregation under compression constraints, guided by the path attention mechanism. This synergistic system achieves a bias–variance trade-off between the information bottleneck imposed by compression and the uncertainty induced by heterogeneous environments, thereby enabling FQL to maintain both communication and computational efficiency while preserving strong generalization capability and robust convergence.

4.6. Limitation and Future Work

Despite the promising performance and robustness exhibited by the FQL framework across multi-regional financial markets, several limitations remain. When data distributions are extremely imbalanced and certain submarkets contain only a minimal number of samples, model aggregation may suffer from gradient estimation bias. This is particularly evident when client strategies exhibit high heterogeneity without sufficient historical performance data, which can lead to insufficient scoring by the path attention mechanism and result in suboptimal weight assignments during strategy fusion. In addition, although gradient compression has been introduced to reduce communication overhead, further improvements in compression robustness and recovery fidelity are needed to handle gradient loss or distortion in deployment environments with unstable networks or severely resource-constrained client devices. Future research is expected to enhance the adaptability and deployment feasibility of the FQL framework in two directions. First, meta-learning mechanisms combined with domain adaptation strategies may be introduced to allow each submarket’s local model to learn its optimal aggregation pathway over multiple training rounds. This would enable dynamic updates to the path attention computation logic and the more precise integration of personalized strategies. Second, the communication compression layer could incorporate residual caching and periodic recovery modules, enabling recursive compensation mechanisms to mitigate convergence disruption caused by the loss of historical gradient information.

5. Conclusions

With the increasing demand for secure sharing and privacy preservation of quantitative strategies across multi-regional financial markets, traditional centralized modeling methods have gradually revealed their limitations in scenarios requiring regulatory compliance and handling heterogeneity. To address these challenges, a federated quantitative learning framewor, FQL, is proposed in this study for cross-market financial strategy collaboration. The framework integrates a Path Quality-Aware Aggregation Mechanism, a Heterogeneity-Aware Adaptive Optimizer, and a Gradient Clipping and Compression Module, aiming to enhance model stability and convergence efficiency under conditions of non-i.i.d. data distributions and limited network resources. Experimental results on multiple international financial market datasets demonstrate that FQL consistently outperforms mainstream methods in key financial performance metrics, including annualized return, Sharpe ratio, maximum drawdown, and volatility. Specifically, the framework achieves an annualized return of 12.72% and improves the Sharpe ratio to 1.12, showing significant advantages over baseline methods such as FedAvg and MOON. Furthermore, ablation studies validate the contribution of each component to the overall performance, with the path attention mechanism exhibiting a critical role in optimizing cross-client strategy fusion. In addition, through gradient sparsification and 1-bit quantization, FQL significantly reduces communication overhead, enhancing scalability and efficiency in practical deployments. This work provides a novel perspective and technical route for constructing multi-institutional collaborative systems that ensure privacy protection, efficient communication, and generalized strategy modeling.

Author Contributions

Conceptualization, W.C., L.Z., Z.S. and Y.Z.; Methodology, W.C., L.Z. and Z.S.; Software, W.C., L.Z. and Z.S.; Validation, X.C.; Formal analysis, X.C.; Investigation, X.C. and Z.L.; Resources, Z.Z. and Z.L.; Data curation, Z.Z. and Z.L.; Writing—original draft, W.C., L.Z., Z.S., Z.Z., X.C., Z.L. and Y.Z.; Visualization, Z.Z.; Supervision, Y.Z.; Project administration, Y.Z.; Funding acquisition, Y.Z. All authors have read and agreed to the published version of the manuscript.

Funding

This research was funded by National Natural Science Foundation grant number 61202794.

Data Availability Statement

The data presented in this study are available upon request from the corresponding author.

Conflicts of Interest

The authors declare no conflict of interest.

References

  1. Yang, H.; Malik, A. Reinforcement Learning Pair Trading: A Dynamic Scaling Approach. J. Risk Financ. Manag. 2024, 17, 555. [Google Scholar] [CrossRef]
  2. Han, W.; Xu, J.; Cheng, Q.; Zhong, Y.; Qin, L. Robo-Advisors: Revolutionizing Wealth Management Through the Integration of Big Data and Artificial Intelligence in Algorithmic Trading Strategies. J. Knowl. Learn. Sci. Technol. 2024, 3, 33–45. [Google Scholar]
  3. Bentre, S.; Busy, E.; Abiodun, O. Developing a Privacy-Preserving Framework for Machine Learning in Finance. 2024. Available online: https://www.researchgate.net/profile/Abiodun-Okunola-6/publication/386573416_Developing_a_Privacy-Preserving_Framework_for_Machine_Learning_in_Finance/links/675746722c5fa80df7b250c5/Developing-a-Privacy-Preserving-Framework-for-Machine-Learning-in-Finance.pdf (accessed on 4 July 2025).
  4. Li, Z.; Liu, X.Y.; Zheng, J.; Wang, Z.; Walid, A.; Guo, J. Finrl-podracer: High performance and scalable deep reinforcement learning for quantitative finance. In Proceedings of the Second ACM International Conference on AI in Finance, Virtual, 3–5 November 2021; pp. 1–9. [Google Scholar]
  5. Fan, B.; Qiao, E.; Jiao, A.; Gu, Z.; Li, W.; Lu, L. Deep learning for solving and estimating dynamic macro-finance models. arXiv 2023, arXiv:2305.09783. [Google Scholar] [CrossRef]
  6. Jeleel-Ojuade, A. The Role of Information Silos: An Analysis of How the Categorization of Information Creates Silos Within Financial Institutions, Hindering Effective Communication and Collaboration. 2024. Available online: https://papers.ssrn.com/sol3/papers.cfm?abstract_id=4881342 (accessed on 4 July 2025).
  7. Johnny, R.; Marie, C. Achieving Consistency in Data Governance Across Global Financial Institutions. Available online: https://www.researchgate.net/profile/Ricky-Johnny/publication/387174359_Achieving_Consistency_in_Data_Governance_Across_Global_Financial_Institutions/links/6762fd5872316e5855fc2ce2/Achieving-Consistency-in-Data-Governance-Across-Global-Financial-Institutions.pdf (accessed on 4 July 2025).
  8. Chatzigiannis, P.; Gu, W.C.; Raghuraman, S.; Rindal, P.; Zamani, M. Privacy-enhancing technologies for financial data sharing. arXiv 2023, arXiv:2306.10200. [Google Scholar] [CrossRef]
  9. He, P.; Lin, C.; Montoya, I. DPFedBank: Crafting a Privacy-Preserving Federated Learning Framework for Financial Institutions with Policy Pillars. arXiv 2024, arXiv:2410.13753. [Google Scholar]
  10. Li, L.; Fan, Y.; Tse, M.; Lin, K.Y. A review of applications in federated learning. Comput. Ind. Eng. 2020, 149, 106854. [Google Scholar] [CrossRef]
  11. Kang, R.; Li, Q.; Lu, H. Federated machine learning in finance: A systematic review on technical architecture and financial applications. Appl. Comput. Eng. 2024, 102, 61–72. [Google Scholar] [CrossRef]
  12. Zhou, S.; Zhang, S.; Xie, L. Research on analysis and application of quantitative investment strategies based on deep learning. Acad. J. Comput. Inf. Sci. 2023, 6, 24–30. [Google Scholar] [CrossRef]
  13. Wu, K.; Gu, J.; Meng, L.; Wen, H.; Ma, J. An explainable framework for load forecasting of a regional integrated energy system based on coupled features and multi-task learning. Prot. Control Mod. Power Syst. 2022, 7, 1–14. [Google Scholar] [CrossRef]
  14. Md, A.Q.; Kapoor, S.; AV, C.J.; Sivaraman, A.K.; Tee, K.F.; Sabireen, H.; Janakiraman, N. Novel optimization approach for stock price forecasting using multi-layered sequential LSTM. Appl. Soft Comput. 2023, 134, 109830. [Google Scholar] [CrossRef]
  15. Moghar, A.; Hamiche, M. Stock market prediction using LSTM recurrent neural network. Procedia Comput. Sci. 2020, 170, 1168–1173. [Google Scholar] [CrossRef]
  16. Qi, L. Forex Trading Signal Extraction with Deep Learning Models. Ph.D. Thesis, The University of Sydney, Camperdown, Australia, 2023. [Google Scholar]
  17. Muhammad, T.; Aftab, A.B.; Ibrahim, M.; Ahsan, M.M.; Muhu, M.M.; Khan, S.I.; Alam, M.S. Transformer-based deep learning model for stock price prediction: A case study on Bangladesh stock market. Int. J. Comput. Intell. Appl. 2023, 22, 2350013. [Google Scholar] [CrossRef]
  18. Chantrasmee, C.; Jaiyen, S.; Chaikhan, S.; Wattanakitrungroj, N. Stock Trading Signal Prediction Using Transformer Model and Multiple Indicators. In Proceedings of the 2024 28th International Computer Science and Engineering Conference (ICSEC), Khon Kaen, Thailand, 6–8 November 2024; IEEE: Piscataway Township, NJ, USA, 2024; pp. 1–6. [Google Scholar]
  19. Zhang, Q.; Qin, C.; Zhang, Y.; Bao, F.; Zhang, C.; Liu, P. Transformer-based attention network for stock movement prediction. Expert Syst. Appl. 2022, 202, 117239. [Google Scholar] [CrossRef]
  20. Ruiru, D.K.; Jouandeau, N.; Odhiambo, D. LSTM versus Transformers: A Practical Comparison of Deep Learning Models for Trading Financial Instruments. In Proceedings of the 16th International Joint Conference on Computational Intelligence, Porto, Portugal, 20–22 November 2024; SCITEPRESS-Science and Technology Publications: Setúbal, Portugal, 2024. [Google Scholar]
  21. Lin, Z. Comparative study of lstm and transformer for a-share stock price prediction. In Proceedings of the 2023 2nd International Conference on Artificial Intelligence, Internet and Digital Economy (ICAID 2023), Chengdu, China, 21–23 April 2023; Atlantis Press: Dordrecht, The Netherlands, 2023; pp. 72–82. [Google Scholar]
  22. Ge, Q. Enhancing stock market Forecasting: A hybrid model for accurate prediction of S&P 500 and CSI 300 future prices. Expert Syst. Appl. 2025, 260, 125380. [Google Scholar]
  23. Yuxin, M.; Honglin, W. Federated learning based on data divergence and differential privacy in financial risk control research. Comput. Mater. Contin. 2023, 75, 863–878. [Google Scholar]
  24. Fantacci, R.; Picano, B. Federated learning framework for mobile edge computing networks. CAAI Trans. Intell. Technol. 2020, 5, 15–21. [Google Scholar] [CrossRef]
  25. Abadi, A.; Doyle, B.; Gini, F.; Guinamard, K.; Murakonda, S.K.; Liddell, J.; Mellor, P.; Murdoch, S.J.; Naseri, M.; Page, H.; et al. Starlit: Privacy-preserving federated learning to enhance financial fraud detection. arXiv 2024, arXiv:2401.10765. [Google Scholar] [CrossRef]
  26. Whitmore, J.; Mehra, P.; Yang, J.; Linford, E. Privacy Preserving Risk Modeling Across Financial Institutions via Federated Learning with Adaptive Optimization. Front. Artif. Intell. Res. 2025, 2, 35–43. [Google Scholar] [CrossRef]
  27. Chen, C.; Yang, Y.; Liu, M.; Rong, Z.; Shu, S. Regularized joint self-training: A cross-domain generalization method for image classification. Eng. Appl. Artif. Intell. 2024, 134, 108707. [Google Scholar] [CrossRef]
  28. Zhang, H.; Peng, G.; Wu, Z.; Gong, J.; Xu, D.; Shi, H. MAM: A multipath attention mechanism for image recognition. IET Image Process. 2022, 16, 691–702. [Google Scholar] [CrossRef]
  29. Jing, Y.; Zhang, L. An Improved Dual-Path Attention Mechanism with Enhanced Discriminative Power for Asset Comparison Based on ResNet50. In Proceedings of the 2025 5th International Conference on Advances in Electrical, Electronics and Computing Technology (EECT), Guangzhou, China, 21–23 March 2025; IEEE: Piscataway Township, NJ, USA, 2025; pp. 1–10. [Google Scholar]
  30. Chen, S. Local regularization assisted orthogonal least squares regression. Neurocomputing 2006, 69, 559–585. [Google Scholar] [CrossRef]
  31. Abrahamyan, L.; Chen, Y.; Bekoulis, G.; Deligiannis, N. Learned gradient compression for distributed deep learning. IEEE Trans. Neural Netw. Learn. Syst. 2021, 33, 7330–7344. [Google Scholar] [CrossRef]
  32. Li, X.; Karimi, B.; Li, P. On distributed adaptive optimization with gradient compression. arXiv 2022, arXiv:2205.05632. [Google Scholar] [CrossRef]
  33. Collins, L.; Hassani, H.; Mokhtari, A.; Shakkottai, S. Fedavg with fine tuning: Local updates lead to representation learning. Adv. Neural Inf. Process. Syst. 2022, 35, 10572–10586. [Google Scholar]
  34. Li, T.; Sahu, A.K.; Zaheer, M.; Sanjabi, M.; Talwalkar, A.; Smith, V. Federated optimization in heterogeneous networks. Proc. Mach. Learn. Syst. 2020, 2, 429–450. [Google Scholar]
  35. Asad, M.; Moustafa, A.; Ito, T. Fedopt: Towards communication efficiency and privacy preservation in federated learning. Appl. Sci. 2020, 10, 2864. [Google Scholar] [CrossRef]
  36. Kim, S.; Bae, S.; Yun, S.Y.; Song, H. Lg-fal: Federated active learning strategy using local and global models. In Proceedings of the ICML Workshop on Adaptive Experimental Design and Active Learning in the Real World, Baltimore, MD, USA, 22 July 2022; pp. 127–139. [Google Scholar]
  37. Augenstein, S.; Hard, A.; Partridge, K.; Mathews, R. Jointly learning from decentralized (federated) and centralized data to mitigate distribution shift. arXiv 2021, arXiv:2111.12150. [Google Scholar] [CrossRef]
  38. Wang, J.; Liu, Q.; Liang, H.; Joshi, G.; Poor, H.V. Tackling the Objective Inconsistency Problem in Heterogeneous Federated Optimization. arXiv 2020, arXiv:2007.07481. [Google Scholar] [CrossRef]
  39. Li, Q.; He, B.; Song, D. Model-Contrastive Federated Learning. arXiv 2021, arXiv:2103.16257. [Google Scholar] [CrossRef]
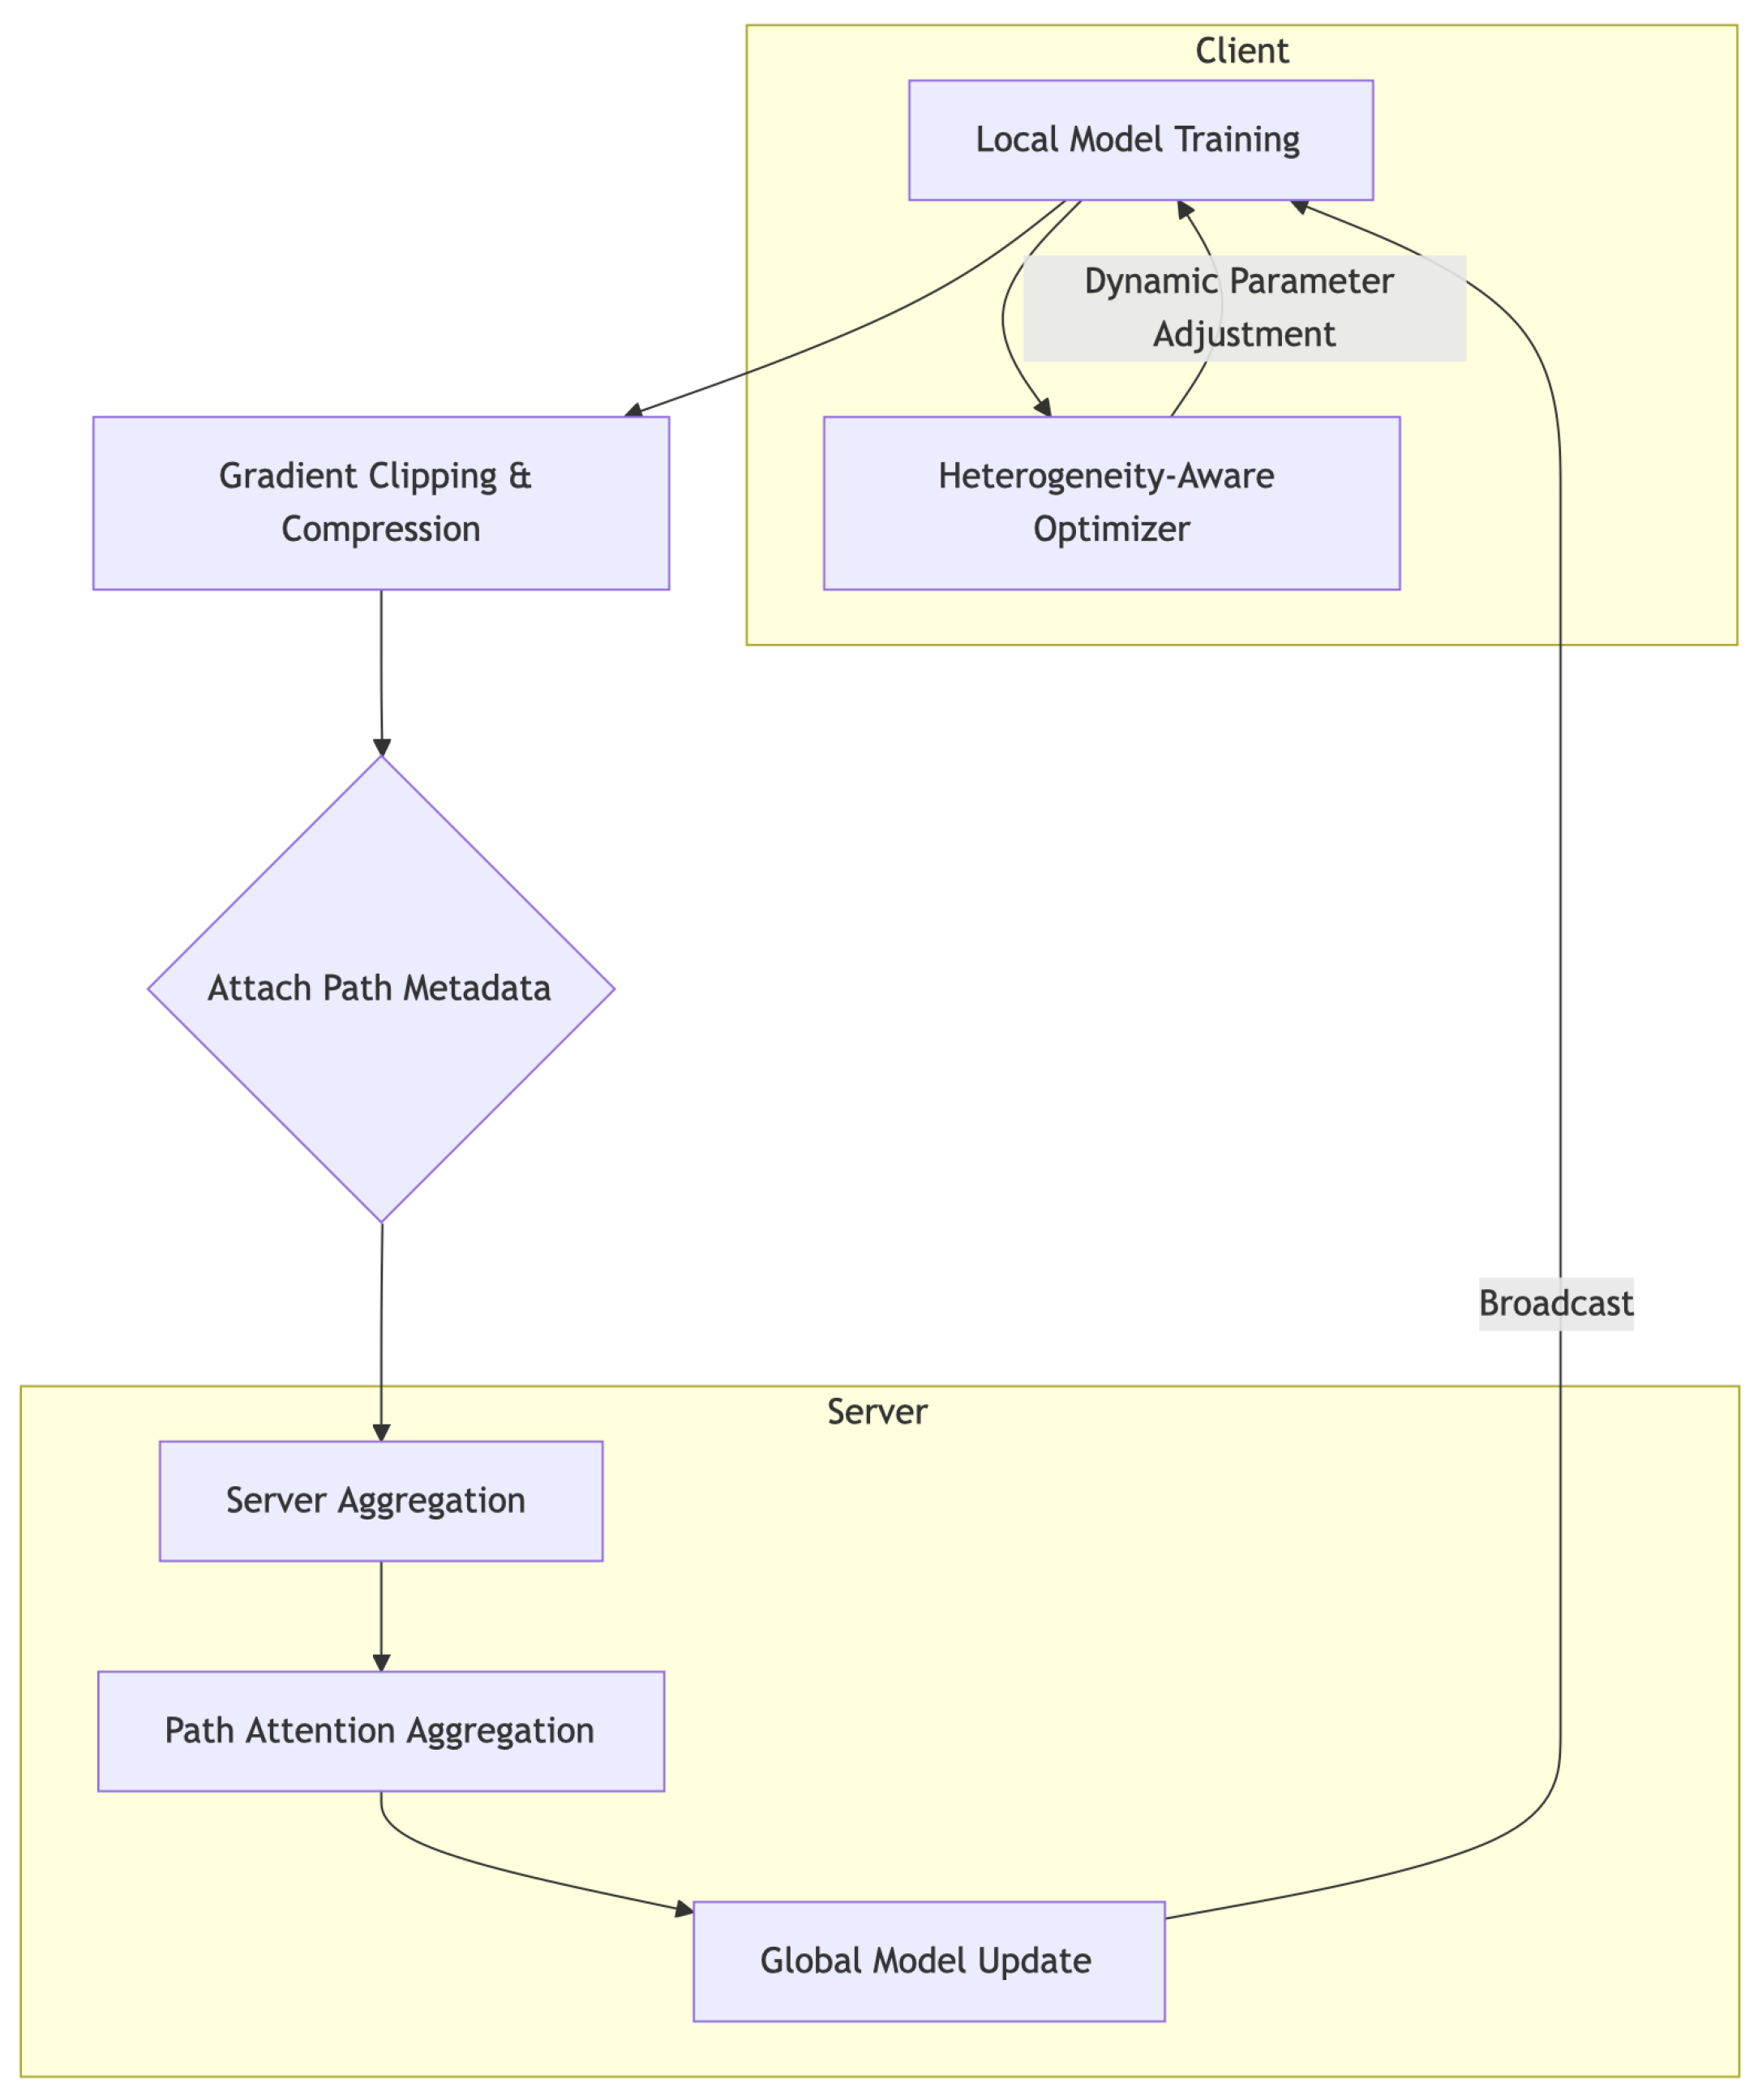
Figure 1. Overview of the FQL framework in a cross-national financial institution scenario. Financial entities from different regions (e.g., banks, insurance companies, and internet firms) perform local model training and upload high-quality updates to the central server through the path attention mechanism. The server conducts heterogeneous-aware optimization and compressed fusion based on path quality, enabling privacy-preserving collaborative strategy modeling and global sharing.
Electronics 14 03293 g001
Figure 2. The diagram illustrates the structure and execution flow of the Path Attention Aggregation Module. The process is divided into two stages—local update and global aggregation. During local updates, each client performs gradient optimization using local data to generate local model update paths. In the aggregation phase, the server evaluates the quality of each path based on performance contribution, transmission stability, and representational similarity.
Electronics 14 03293 g002
Figure 3. Illustration of the Gradient Clipping and Compression Module. Client-side gradients are processed through multiple routing functions (Router R1–R4) and dimension-wise rescaling modules (Rescaler s1–s4) to achieve multi-path sparse compression. This design effectively reduces communication bandwidth while preserving critical gradient information, thereby enhancing aggregation robustness and convergence efficiency in federated strategies under heterogeneous networks.
Electronics 14 03293 g003
Figure 4. Training curve comparison across baseline methods.
Electronics 14 03293 g004
Figure 5. Heatmap comparison across baseline methods.
Electronics 14 03293 g005
Figure 6. Communication cost comparison across baseline methods.
Electronics 14 03293 g006
Figure 7. Comparison of different attention mechanisms in federated aggregation.
Electronics 14 03293 g007
Table 1. Summary of cross-market financial dataset.
RegionAsset ClassNumber of TickersTotal Samples (Daily)
United States (US)NASDAQ-100 Constituents1002,520,000
Europe (EU)Stoxx 600 Representative Stocks1203,024,000
Asia-Pacific (APAC)MSCI Asia ETF Constituents802,016,000
Total3007,560,000
Table 2. Performance comparison across baseline methods.
MethodAnnualized Return (%)Sharpe RatioMax Drawdown (%)Volatility (%)
Local-only [36]8.320.7715.813.6
FedAvg [33]9.210.8714.212.1
FedProx [34]10.350.9113.511.8
FedOpt [35]10.010.8914.012.0
MOON [39]10.820.9513.111.3
FedNova [38]11.050.9812.610.9
Centralized [37]13.441.239.38.8
FQL (Ours)12.721.1210.39.7
Table 3. Module ablation study of FQL components.
Method VariantAnnualized Return (%)Sharpe RatioMax Drawdown (%)Volatility (%)
FQL w/o GradClip+Compress11.921.0411.610.5
FQL w/o Het-Optimizer11.581.0012.310.9
FQL w/o Path-Attention11.230.9612.711.2
FQL (Full Model)12.721.1210.39.7
Table 4. Comparison of different attention mechanisms in federated aggregation.
Attention TypeAnnualized Return (%)Sharpe RatioMax Drawdown (%)Volatility (%)
Uniform Aggregation11.050.9712.611.0
Entropy-Based Attention11.431.0111.910.6
Cosine Similarity Attention11.561.0311.410.2
Temporal-Decayed Attention11.711.0511.110.0
Path Quality Attention (Ours)12.721.1210.39.7
Table 5. Comparison of communication costs under different network scenarios (Unit: MB).
MethodNormal BandwidthConstrained BandwidthClient Dropout
FedAvg102.5108.398.4
FedProx98.1101.296.7
MOON120.4135.6125.1
FedNova91.796.489.5
FQL (Ours)68.954.557.9
Disclaimer/Publisher’s Note: The statements, opinions and data contained in all publications are solely those of the individual author(s) and contributor(s) and not of MDPI and/or the editor(s). MDPI and/or the editor(s) disclaim responsibility for any injury to people or property resulting from any ideas, methods, instructions or products referred to in the content.