Article

Application of Electronic Optimizers to Enhance the Operational Safety of Photovoltaic Installations in Residential Areas

by
Daniela-Adriana Sima
1,2,
Emil Tudor
3,
Lucia-Andreea El-Leathey
2,*,
Gabriela Cîrciumaru
2,
Ionuț Vasile
3 and
Iuliana Grecu
4
1
Doctoral School of Faculty of Entrepreneurship Business Engineering and Management, National University of Science and Technology POLITEHNICA Bucharest, 060042 Bucharest, Romania
2
Renewable Energy Sources Department, National Institute for Research and Development in Electrical Engineering ICPE-CA, 030138 Bucharest, Romania
3
Electromechanic and Electromagnetic Systems and Technologies Department, National Institute for Research and Development in Electrical Engineering ICPE-CA, 030138 Bucharest, Romania
4
Faculty of Entrepreneurship Business Engineering and Management, National University of Science and Technology POLITEHNICA Bucharest, 060042 Bucharest, Romania
*
Author to whom correspondence should be addressed.
Electronics 2025, 14(16), 3290; https://doi.org/10.3390/electronics14163290
Submission received: 14 July 2025 / Revised: 11 August 2025 / Accepted: 14 August 2025 / Published: 19 August 2025
(This article belongs to the Special Issue Energy Optimization of Photovoltaic Power Plants)

Abstract

This article examines the advantages and disadvantages of deploying photovoltaic power plants in residential areas, considering both their current development status and specific operational risks, such as the unpredictability associated with potential faults. It highlights that errors of existing PV technologies can pose risks, including the potential for fire and electrocution. To improve efficiency and address these identified issues, the paper emphasizes the benefits of using additional electronic equipment, called “optimizers”, which, in conjunction with the inverters, can provide arc-fault circuit interruption and rapid shutdown of the photovoltaic systems. These technologies are designed to reduce faults and enhance operational safety, thereby reducing the risk of electrocution for maintenance personnel. They are recommended especially for rooftop PV systems that are affected by shading conditions. Furthermore, experimental results indicate that the use of such optimizers can lead to a power gain of up to 50% in partial shading.

1. Introduction

1.1. Generalities

The rapid growth of industrial production has significantly impacted the development of energy sources and various modes of transportation, creating an urgent need to reduce the carbon footprint. As a result, many countries worldwide are showing a keen interest in developing and optimizing renewable energy sources, including solar, wind, geothermal, hydropower, ocean energy, and bioenergy. Among these, photovoltaic (PV) technology is experiencing the fastest growth. According to the Clean Energy Technology Observatory [1], in 2022, the cumulative global installed capacity of photovoltaic systems surpassed one terawatt (TW), while the total electricity generation from these sources was approximately 158 terawatt-hours (TWh).
In theory, the maximum efficiency of a single-junction p-n solar cell is 30% at 1.1 eV, while the highest laboratory efficiency for this type of cells is about 27%. However, the efficiency of photovoltaic panels is lower than that of individual PV cells due to resistive losses within the solar cells, the used series and parallel connections, and variations in the efficiencies of individual solar cells [2]. Today, the efficiency of converting solar energy to electricity ranges from 22% for first-generation technologies, such as amorphous silicon (a-Si) and crystalline silicon (c-Si) mono/polycrystalline cells, to 32% for tandem solar cells that utilise both silicon and Perovskite materials [3,4].

1.2. Regulations Concerning the Safety of Photovoltaic Plants for Residential Areas

Such a significant problem is treated seriously by the rulers, as stated in the UL 1699 B standard (USA) or IEC 63027 and GB/T 39750 (China). These standards are compared in ref. [5].
The regulation identified as NEC 690.12, which addresses the rapid shutdown of photovoltaic systems on buildings, requires that all PV systems installed on or within buildings must include a rapid shutdown feature. This function is designed to reduce the risk of electric shock for emergency responders. It enables first responders to quickly disconnect the DC conductors of the PV system, ensuring that the voltage is reduced to 30 volts or less within 3 m of the array and within 1.5 m inside the building, all within 30 s of activation [6,7].
Additionally, alongside the safety improvements offered by arc-fault detectors, producers are also concerned about the issues arising from partial shading of the photovoltaic strings [8]. As a result, the performance of photovoltaic systems in residential settings is typically better than that in large PV plants, primarily due to the higher frequency of shading experienced by photovoltaic panels in plant installations.

1.3. Challenges of Implementing a Photovoltaic Power Plant

Solar power generation systems require robust electrical and environmental protections to ensure they operate both safely and efficiently. Among the fundamental electrical protections are:
-
Overcurrent Protection: This is typically achieved using fuses or circuit breakers. These critical components serve to safeguard various parts of the system, such as inverters and wiring, by interrupting the electrical circuit whenever the current exceeds a predefined safety threshold. This mechanism helps prevent overheating and potential damage to the system.
-
Surge Protection: Solar power systems are susceptible to external threats, including lightning strikes or unexpected voltage spikes. Surge protection devices are essential in shielding sensitive electronic components from these dangerous surges, thus ensuring the longevity and reliability of the equipment.
-
Grounding: Grounding plays a vital role in electrical safety by providing a low-resistance pathway for stray currents to dissipate into the Earth. This practice is crucial in preventing electrical shocks to individuals and minimising the risk of equipment damage caused by electrical faults. By ensuring adequate grounding, solar systems can enhance both user safety and operational stability.

1.4. Examples of Papers Focused on Improving the Safety of PVRA

The theoretical approach of electronics involved in improving the safety of the PVRA is primarily described in the literature and the leading producer’s white papers. Various methods are employed to enhance safety and develop commercially available electronics that enable PV systems in residential areas to meet the standards mentioned herewith.
The methods used to diagnose PVRA can be categorised into: electrical, visual, infrared-thermal, Machine Learning, Deep Learning, and Artificial Intelligence methods. In ref. [9], the authors perform a comprehensive state-of-the-art review of such methods and introduce a supervised learning algorithm designed to detect and classify defects in PV systems.
The known electrical methods include (but are not limited to) supervising the variation in current and voltage at the DC input of the inverter, using a pulsating signal as a communication beacon between the optimisers and the inverter, performing spectral analysis of the DC voltage, and monitoring the temperature of the connectors.
Spectral analysis is a pioneering technique that enables real-time examination of the frequency distribution of DC, offering valuable insights into electrical systems. When an arc fault occurs, it generates distinctive high-frequency oscillations that are absent during normal DC operation, making the detection of these anomalies essential [10].
To effectively monitor DC at the individual panel level, we utilize specialized devices such as power optimizers and microinverters. These devices are instrumental in conducting spectral analysis, which allows us to identify the unique frequency patterns associated with arc faults.
Inverters, which connect multiple panels in a string, also track the overall DC and perform their spectral analysis. By comparing their findings with those from the power optimizer, they can confirm the presence of an arc fault and even assist in locating its source.
It is crucial to verify the arc fault signal, often employing a time delay to filter out transient noise and comparing it against a predetermined threshold to reduce false alarms. Exciting advancements in this field involve the integration of advanced artificial intelligence (AI) techniques, which enhance the reliability and precision of arc fault detection by honing in on pertinent frequency patterns.
In photovoltaic power plants used in residential areas (PVRAs), the string maximum output voltage typically ranges from 400 to 1000 Vdc. The installation mistakes located at the electrical connection of such strings, depending on the connectors and cabling being used, are generating the majority of fire hazards in such installations. If multiple connectors are installed in series and one becomes disconnected, an arc-fault event can occur [11].
The DC arc is linked to unpredictable hazards, including energy loss, permanent system damage, and the risk of fire. A comprehensive review of authors and publications discussing arc issues in PV plants from 2013 to 2023 can be found in ref. [12].
Commercially available methods for mitigating the effects of DC arcs are discussed in the whitepaper [13], which reviews the arc-fault circuit interrupter (AFCI) following the UL 1699B arc detection standard.
SolarEdge, a well-known producer of photovoltaic electronics, has implemented a built-in panel-level safety feature designed to minimise the risk of electrocution from high direct current (DC) voltage. The default voltage for the power optimizer is set at 1 VDC, ensuring touch-safe voltage levels and maintaining the string voltage below 30 VDC or 50 VDC, according to various industry standards. The voltage of the power optimizer is only increased to its optimal operating level when the inverter is in production mode and all parameters have been verified [14]. The primary method of detection is supervising the connector’s temperature.
The method for detecting DC arcs involves performing spectral analysis on the DC. When an electric arc is present, there is an increase in high-frequency components. This detection method is based on data collection and analysis carried out at both the panel level (using a power optimizer) and the string level (via the inverter).
Huawei, another major producer of photovoltaic electronics, is employing a similar method, as outlined in ref. [15]. This document analyses the DC arc extinguisher, which incorporates electronic components attached to the panels, supported by several inverter’s software enhancements.
Tigo TS4-A-F is a panel-level optimizer that maximizes energy output of the array by mitigating the impacts of shade and mismatch on the string, being a certified equipment to meet rapid shutdown requirements. It connects to various types of inverters using a wireless connection [16].
SMA Arc-Fix is an AFCI-compliant device integrated into their inverters for PVRA type Sunny-Boy [17] which enables the implementation of AFCI and RSE functions on Sun inverters.
In ref. [18], a shade-tolerant PV microconverter is proposed. This microconverter combines a single-switch quasi-Z-source DC-DC converter with an integrated power optimizer structure to address the challenges posed by partial shading. In a PV panel, shaded substrings can negatively impact the panel’s overall performance, resulting in a reduction in the power harvested compared to the maximum available power. The proposed concept aims to maximize the power output of the PV panel by a factor of 1.5 by balancing the operating points of the substrings.
Ref. [19] proposed a step-down partial-power optimizer (PPO) structure designed to achieve Maximum Power Point Tracking (MPPT) for a series-connected PV optimizer system. In traditional power optimizers, the entire output power of the PV panels is processed by the converter. In contrast, a partial-power optimizer only processes a fraction of the total panel power. This approach reduces both the size and cost of the power optimizer. The proposed PPO structure utilises a buck converter, which primarily consists of an isolated DC/DC converter. Compared to boost converters, buck converters can accommodate more PV panels and, importantly, they can operate effectively even under conditions of significant partial shading.
In ref. [20], the authors introduce a new, simple, and cost-effective distributed Maximum Power Point Tracking (MPPT) technique for energy harvesting in photovoltaic systems. Each PV panel is connected to an individual DC-DC power converter that optimises the extraction of maximum available power. The proposed system effectively manages the MPPT for each panel by utilising the modulation techniques of the inverter system.
Due to its advantages in efficiency, component rating, and power density, the partial-power converter (PPC) is a compelling solution for use as a power optimizer. In reference [21], a new reconfigurable full-bridge-based PPC is proposed.
Reference [22] presents a scheme for instantaneous maximum power extraction, which functions as a PV power optimizer. The control unit of this proposed DC power optimizer comprises a PI power controller and a PWM unit that drives a SEPIC converter, serving as a power conditioner.
In ref. [23], the authors use microconverters proposed to improve the performance of a shaded PVRA, with a simulation for a three-string installation for 30% more harvested power.

1.5. The Article’s Content and Scope

The article discusses the operation of the arc-fault circuit interrupter (AFCI) and RS (rapid shutdown) systems, which are designed to enhance fault mitigation and improve operational safety. These relatively new systems have not been extensively explored in the specialized literature. The article presents the principles of these systems, their practical implementation, along with tests and the results obtained in the field. The article proposed new third-party experimental values for delays in the operation of such devices, in addition to the prior experiments conducted by producers.
The findings presented herein indicate that the implementation of AFCI and RSD systems should be deemed mandatory for roof-mounted photovoltaic systems.
Regarding the influence of the individual optimizers over the yields of the PVRA in the presence of partial shading, the significance of these tests should be understood within the context of the current inefficiency of photovoltaic systems in terms of their specific surface area usage (measured in m2/MWh). This article follows the trend of leveraging the vast roof areas of logistics and industrial buildings for this purpose, including those areas subject to shading.
This article can motivate professionals in the industry to incorporate such optimizers into their offers of PVRA, considering the increased safety and mitigation of production losses during shading.

2. Materials and Methods

According to statistics [24], 38% of fire accidents are caused by installation mistakes: DC connections not mated properly, badly crimped connectors, no strain relief, etc. DC electric arcs are the primary cause of most fire events that are not due to other factors. The DC electric arc cannot be extinguished naturally unless interrupted by an external device.
The electric arc is the leading cause of fires in photovoltaic power plant installations, as it can reach high temperatures of approximately 3000–7000 °C. PV plant components, such as fuses and cables, can burn or melt at these temperatures, thereby increasing the risk of fire. An electric arc can occur in a photovoltaic installation due to poor connections, ageing, or damaged insulating materials, as well as corrosion. Therefore, protection systems are necessary for inverters used in photovoltaic installations. Thus, an AFCI is a critical component in today’s PV installations and is required by all American, European, and Chinese standards (UL 1699 B/IEC 63027/GB-t 39750).
The UL 1699B standard sets the DC PV arc-fault circuit protection requirements for solar PV electrical systems. This standard is designed to mitigate the effects of arcing faults that may pose a risk of fire ignition in PV plants. One of the devices covered in this standard is the DC AFCI, with a rated voltage of up to 1500 V and intended for use in DC electrical systems supplied by a PV source, such as a solar panel. According to the standard, an AFCI is a device installed in the PV system that can interrupt the power delivered to an arcing fault when it is detected. Furthermore, AFCI should protect the PV system from the unwanted effects of arcing.
In 2006, SolarEdge revolutionised the solar industry by inventing a better way to collect and manage energy in PV systems. SolarEdge developed a DC-optimised inverter solution that changed how PV systems harvest and manage power [18]. It maximises power generation and also lowers the PV system’s energy cost, yielding an improved return on investment. Additional benefits include comprehensive and advanced safety features, improved design flexibility, and improved operation and maintenance, with panel-level and remote monitoring.
The AFCI solution presented by Huawei in [19] is represented by a power inverter, which primarily utilises the AFCI function integrated within the inverter technology. For the correct operation of the AFCI function, the inverter must be used in conjunction with some additional hardware, called optimizers (produced by the same manufacturer), which can further enable precise fault localisation and the rapid shutdown function at the panel level, as illustrated in Figure 1. This installation improves the safety of the system and the convenience of operation and maintenance.
To demonstrate the efficiency of the AFCI&RSD system feature, the following field tests were conducted:
-
Test of DC arc detection, with and without AFCI function activated;
-
Test of rapid shutdown, using the DC switch and AC switch.

2.1. Tests of DC Arc Detection

For the solar inverter, the following tests were performed:
-
Test of DC arc detection without AFCI function activated;
-
Test of DC arc detection with AFCI function activated.
Following the tests, the voltage, current, and operating time characteristics were obtained by reducing the inverter’s output current and triggering the fault regime-coded AFCI.
Rapid shutdown is an electrical safety requirement introduced in the United States by the National Electrical Code (NEC) in 2014. The provision applies to solar PV systems and requires the addition of a breaker, known as a Rapid Shutdown Device (RSD), to disconnect circuits, allowing firefighters or solar installers to perform their duties safely and efficiently without risk of electrical hazards.
The rapid shutdown (RS) function is a fundamental safety feature for photovoltaic systems, allowing for quick and safe de-energisation of solar arrays during emergencies or maintenance. Practically, under specific conditions, the inverter reduces the output power, and the input current from the PV panels is reduced accordingly. The RS function is crucial for firefighting operations, as it reduces the risk of electrical shock and enables first responders to work safely and efficiently, thereby protecting people and property. Energised solar arrays pose a significant risk of electrical shock during firefighting operations, as water or other conductive materials used to extinguish the fire can provide an electrical pathway. RS ensures the rapid and safe de-energisation of solar arrays, minimising the risk of electrical shock and allowing firefighters to perform their duties without the added hazards associated with live electrical equipment.
The technical specifications of the components of the PV plant used for the tests were:
-
Solar inverter SUN2000-6KTL-M1 (6 kW, 3 phase)
-
2 PV strings with 8 PV panels/string (total 16 PV panels)
-
Panel type: JKM405N-6RL3-V N-Type Mono-crystalline 405 Wp
-
String nominal power: 3240 Wp per string
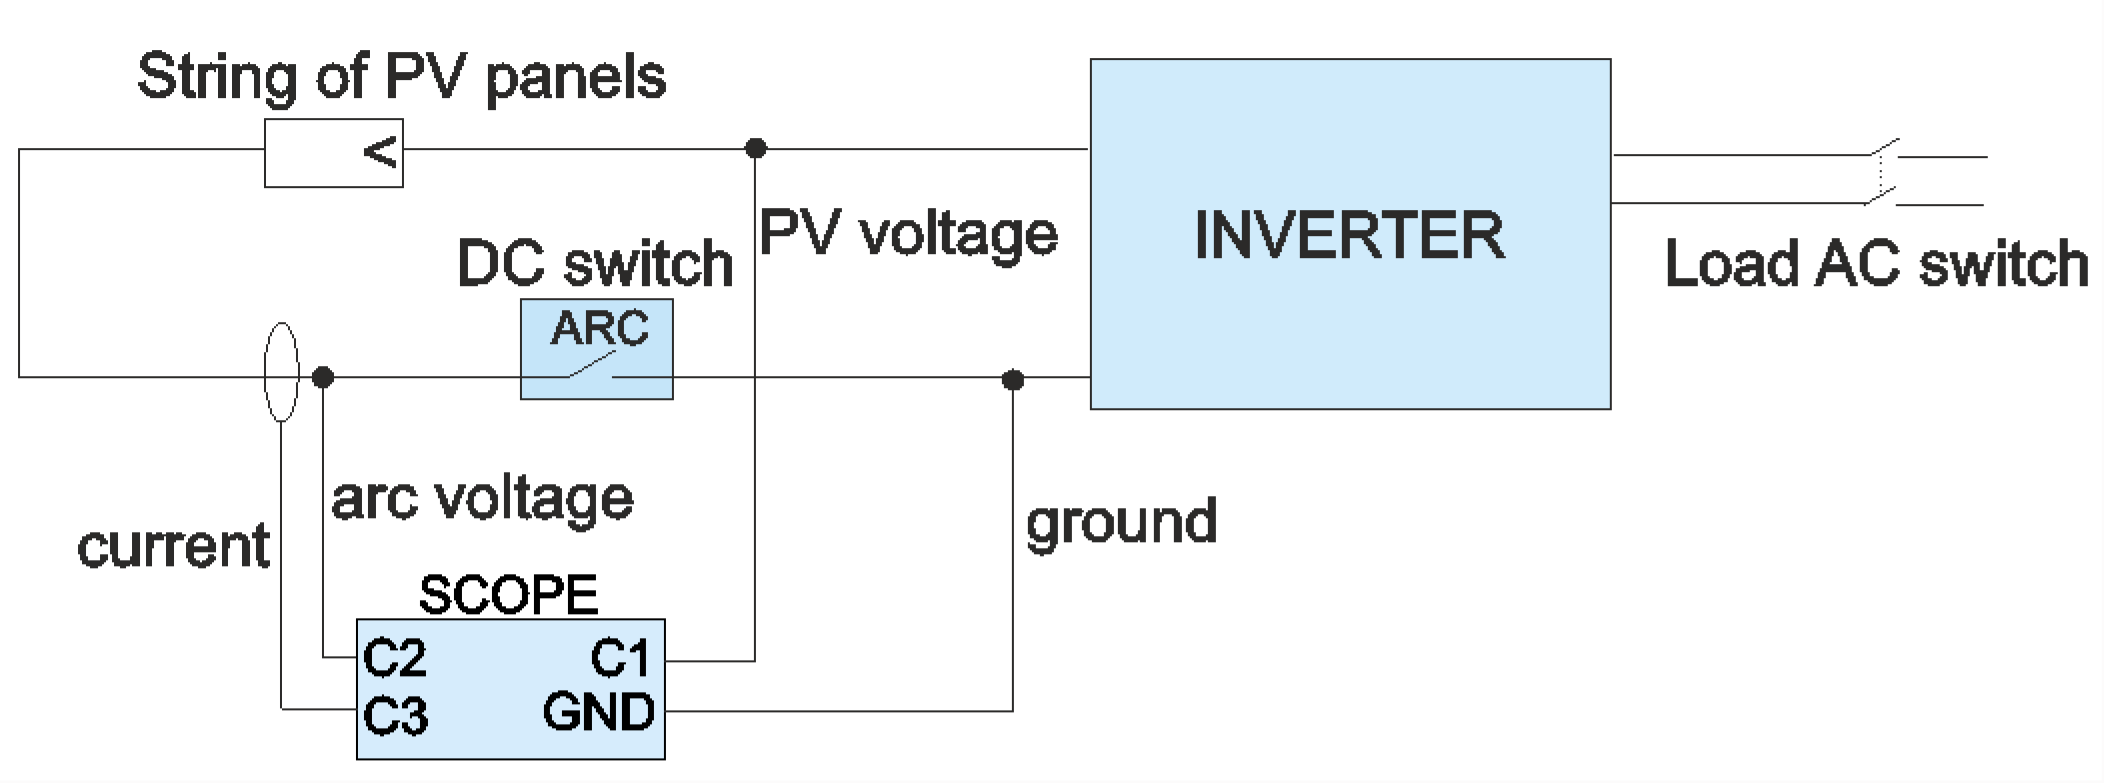
The diagram from Figure 2 shows the test setup used for evaluation of the AFCI operation. The scope uses 3 independent channels as presented in the 3rd chapter.
The tests were performed using the following equipment:
-
Mixed Signal Oscilloscope type MSO54, Tektronix, Beaverton, OR, USA, s/n: B010644
-
HV probe P6015A, 1000X, 3 pF, 100 MOhm, 20/40 kV, Tektronix, Beaverton, OR, USA, s/n: 2040423-1
-
Current probe 30 A TCP0030A, Tektronix, Beaverton, OR, USA, s/n: C006185
-
Digital Multimeter 2712, BK Precision, Yorba Linda, CA, USA, s/n: 140F19180
When the PV inverter is not turned on, the optimizer outputs 0 V by default, ensuring personal safety. After the inverter is turned on and establishes communication with the optimisers, both the optimisers and the inverter start working.

2.2. Test of Rapid Shutdown

To implement the fast shutdown, the following operations are performed to trigger the fast shutdown:
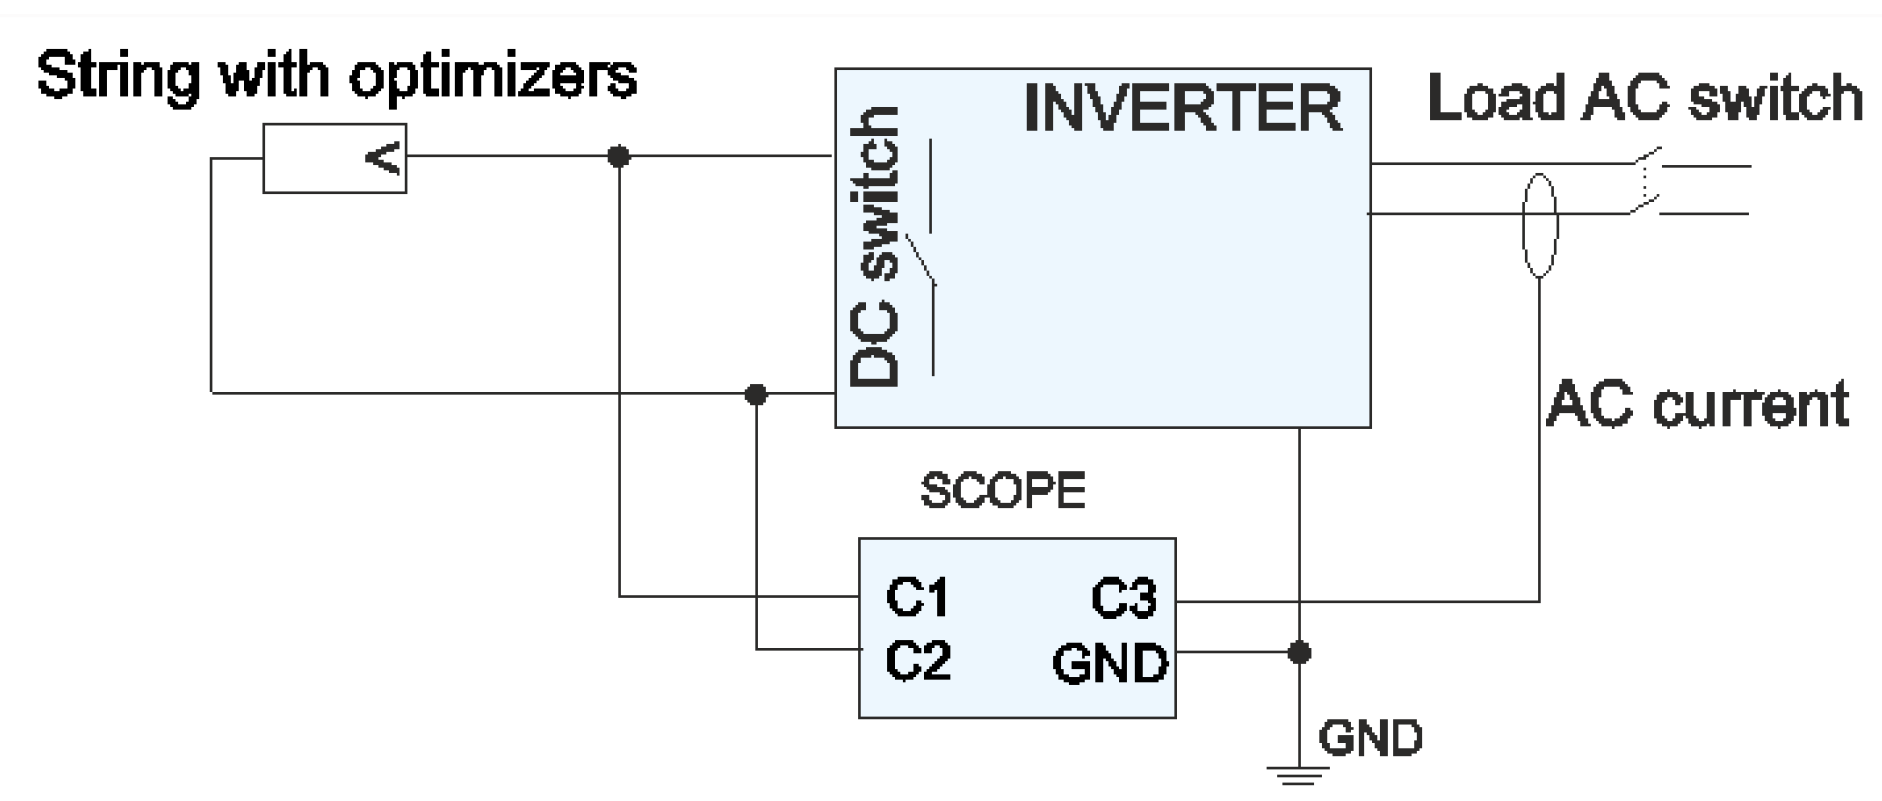
Method 1: The DC switch of the inverter is tripped (only the voltage of the photovoltaic string connected to the inverter is turned off).
Method 2: The AC breaker (output) is disconnected to initiate a shutdown state in the inverter. The voltage of each photovoltaic string connected to the inverter is turned off.
Figure 3 shows that using a broadband oscilloscope with four channels, Channel C1 to channel C2 for DC voltage (PV+, PV−and PV+ to PV−) is measured for the test of an inverter stopped when the DC switch is disabled, with the AFCI function active, and the AC switch is disabled, as seen in Channel C3–output current, having the AFCI function active.

2.3. Test with Partially Shaded PC Panel

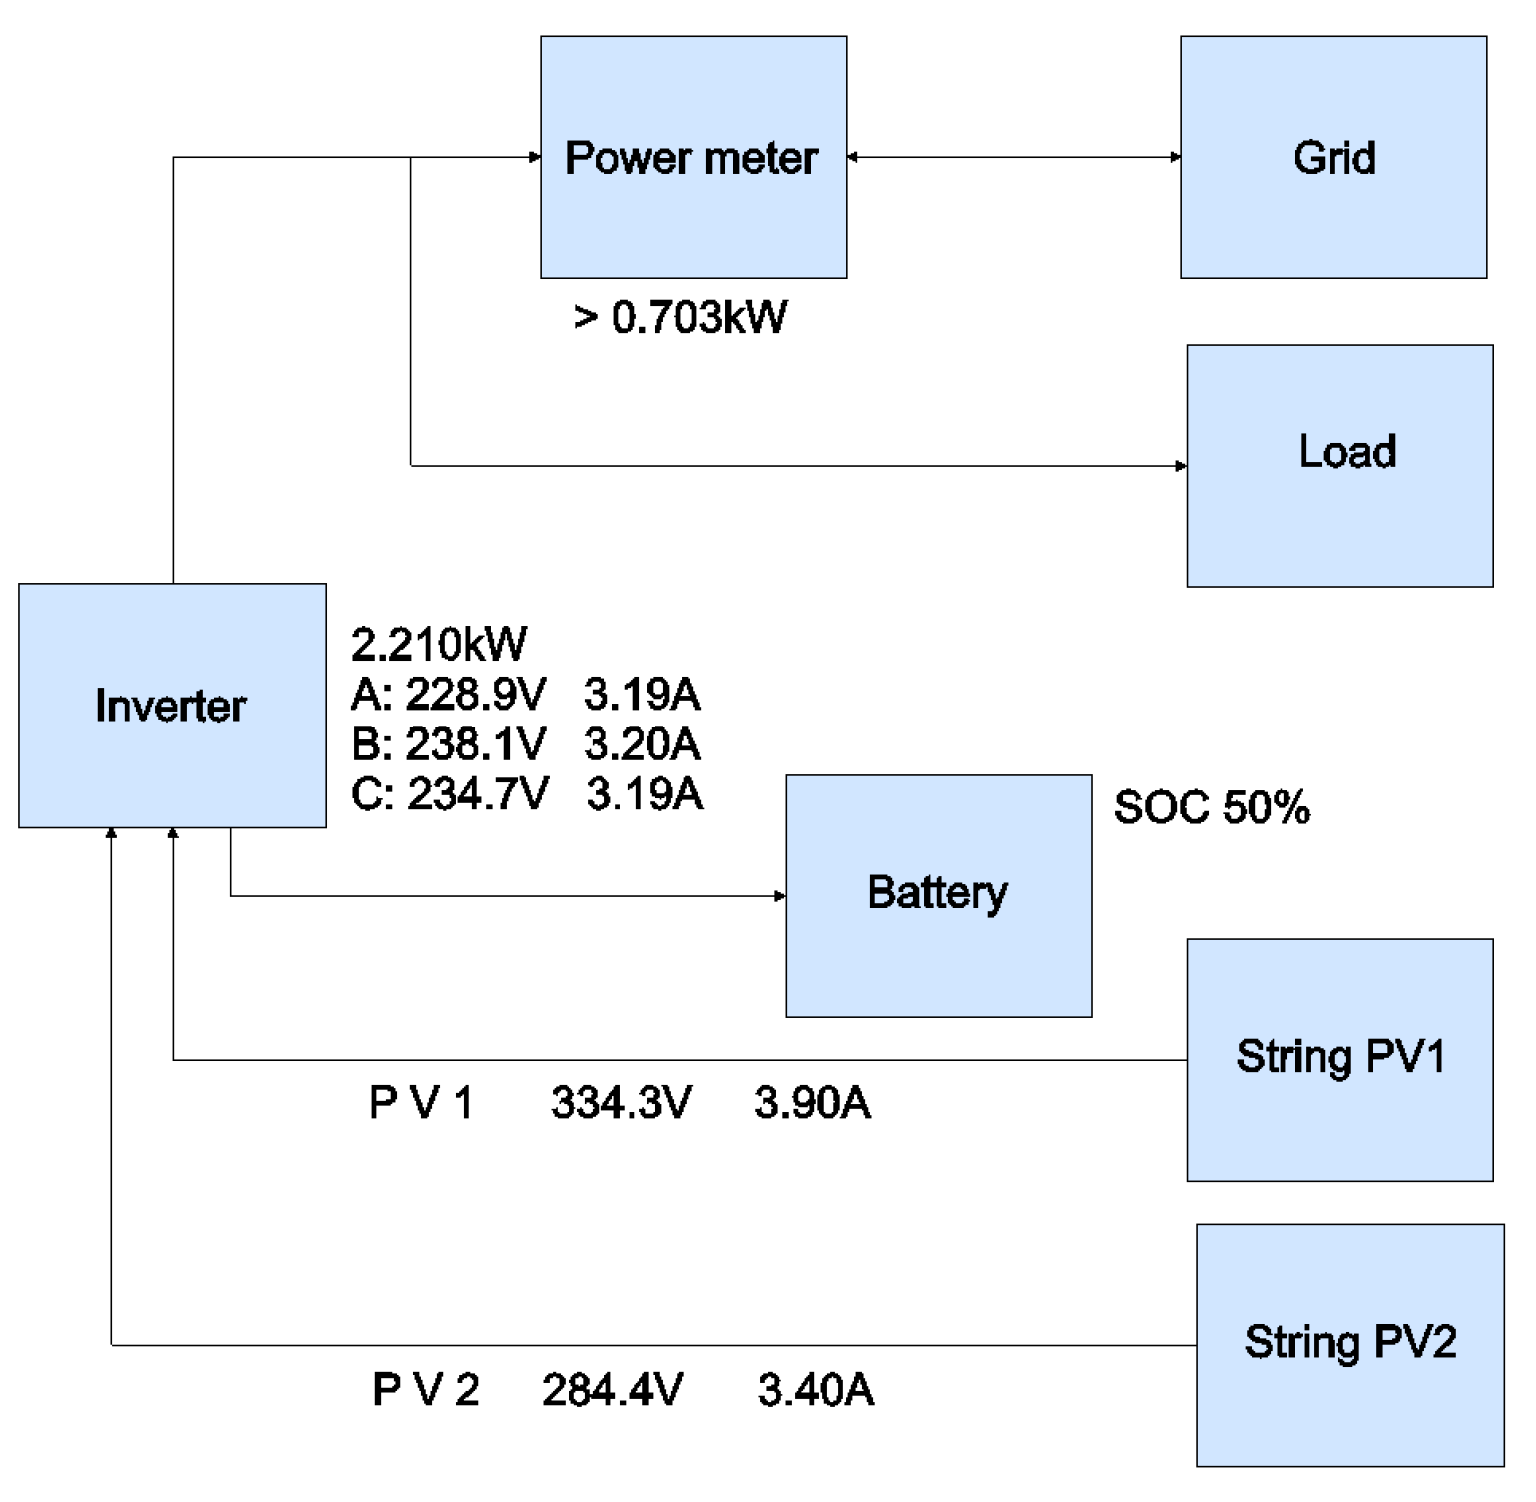
The PV inverter’s function tends to improve the PV panel’s energy yield. Its main uses are as follows: (1) It can track the maximum power point of each photovoltaic panel in real-time, reduce the mismatch between panels and also improve the system energy yield; (2) Actively and quickly shut down the component in case of emergency to ensure firefighting and personnel safety—an 6 kW inverter installed on the roof with 16–405 Wp photovoltaic panels. The 16 PV panels were evenly distributed across two PV strings, with 8 PV panels in each string. Panels from string PV1 were all equipped with a 450 W optimizer (Figure 4), while the panels from string PV2 were not equipped with optimizers.
The PVRA plant from Figure 4 shows dual string PV1 and PV2, a three-phase inverter generating 2.21 kW on load and having a regeneration to the grid of 0.703 kW, with the three phases named A, B and C in an equilibrium.

Test Method and Procedure

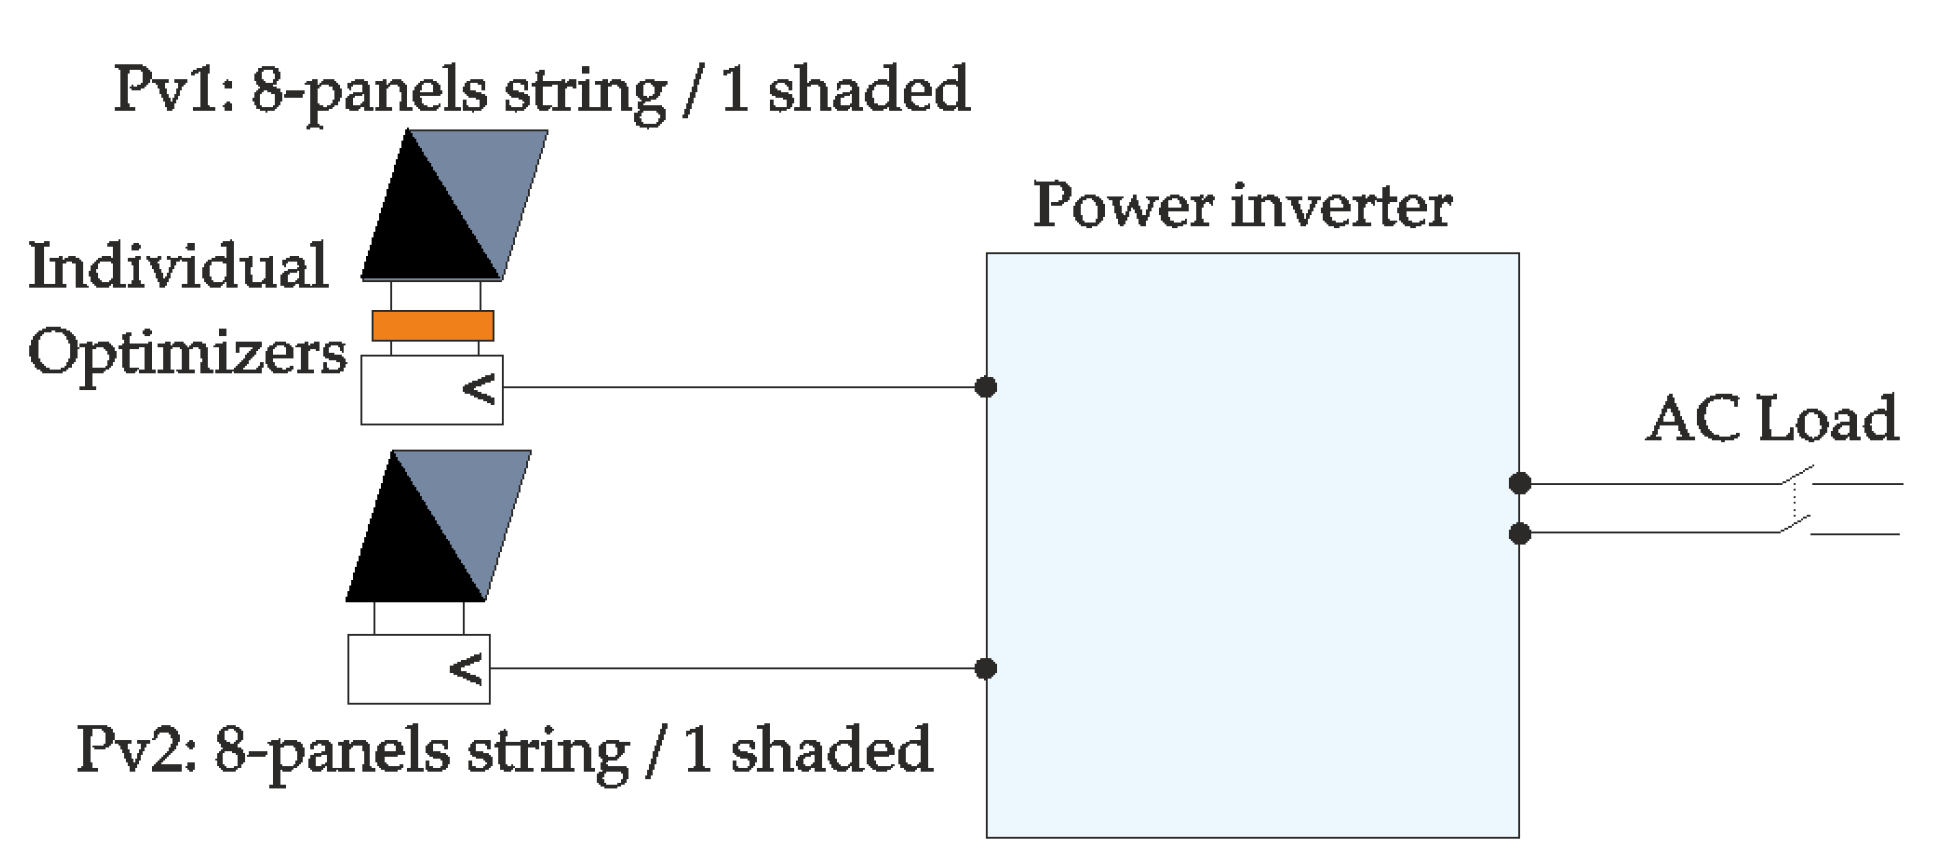
To compare and test the optimizer’s impact on the energy yield of PV panels, all the optimizers of one of the original two PV strings were removed, and a comparison test was conducted. To ensure that the panels in the two PV strings operate under the same working conditions, the PV panels on both sides of the roof were evenly distributed across the PV strings. A diagram of the PV plant layout is presented in Figure 5.
The test procedure was as follows:
A.
Set up the test environment to ensure that each PV panel runs under the same working conditions. Divide 16 PV panels into two strings, Pv1 and Pv2. Each PV string contains eight PV panels. In the test environment, all the Pv1 panels have individual optimizers, but no optimizer is configured for the panels of the string Pv2. The strings are connected to the two Input ports of the inverter, meaning that each string supplies an independent MPPT controller, and the energy yield for each string is not affected by the other one. The output of the inverter is the AC grid of a residential building, with no restrictions on the energy production.
B.
Measure the values of voltage and current to determine the power with external equipment and to validate the accuracy of the FusionSolar data collection.
C.
Select a PV panel from each of the two PV strings and use a black plastic bag of the same size and material to block the PV panel to simulate shadow blocking.
D.
Start the test. The test period was 14 days, and the data were collected daily at the same hour.
E.
After 14 days, we collected the daily data of the yield of each PV string and compared the energy yield for analysis. The inverter report available online is based on instantaneous string voltage (VDC) and current (IDC), and individual MPPT1 and MPPT2 yields, expressed in kWh.

3. Results and Discussion

3.1. Discussion of the Results Regarding the AFCI System’s Operation Testing

Table 1 summarises the main findings and results of the tests performed using the system described in Section 2.1, as shown in Figure 2.
Table 1 displays the results of 27 tests conducted on the system’s disconnection using the AFCI function enabled, for a setup comprising panels equipped individually with optimizers. These tests measured the DC voltage, the open current, and the duration of electric arcs. The maximum arc duration recorded was 168 ms, the minimum was 19.6 ms, and the average duration was 96.4 ms. The DC voltage ranged from 211 Vdc to 318 Vdc, which varied with changing insolation during the tests. The measurements were taken using an oscilloscope, and the recorded data for Test 23, as shown in Table 1, is illustrated in Figure 6.
Figure 6 illustrates the circuit’s disconnection when a 3.9 ADC is applied at 1.734 s. This situation resulted in an electric arc with a current of 4 ADC and a voltage of 20 VDC, lasting 102 milliseconds. The arc ceased at the moment 1.836 s, when the AFCI intervention on the inverter reduced the output load, effectively bringing the arc current to zero.

3.2. Discussion of the Results Regarding the RSD System’s Operation Testing

Performed tests:
-
Measuring the stopping time of the inverter when the DC switch was switched OFF, with the RSD function active.
-
Measuring the stopping time of the inverter when the AC switch was switched OFF, with the RSD function active.
Firstly, the DC switch was turned OFF, with the electronic RSD function activated in the inverter’s settings. All the panels in the string were equipped entirely with individual optimizers. The RSD function was triggered because the optimizers stopped communicating with the inverter when the DC switch was OFF. Table 2 presents the key findings and results from four tests conducted using the system outlined in Figure 3 from Section 2.2.
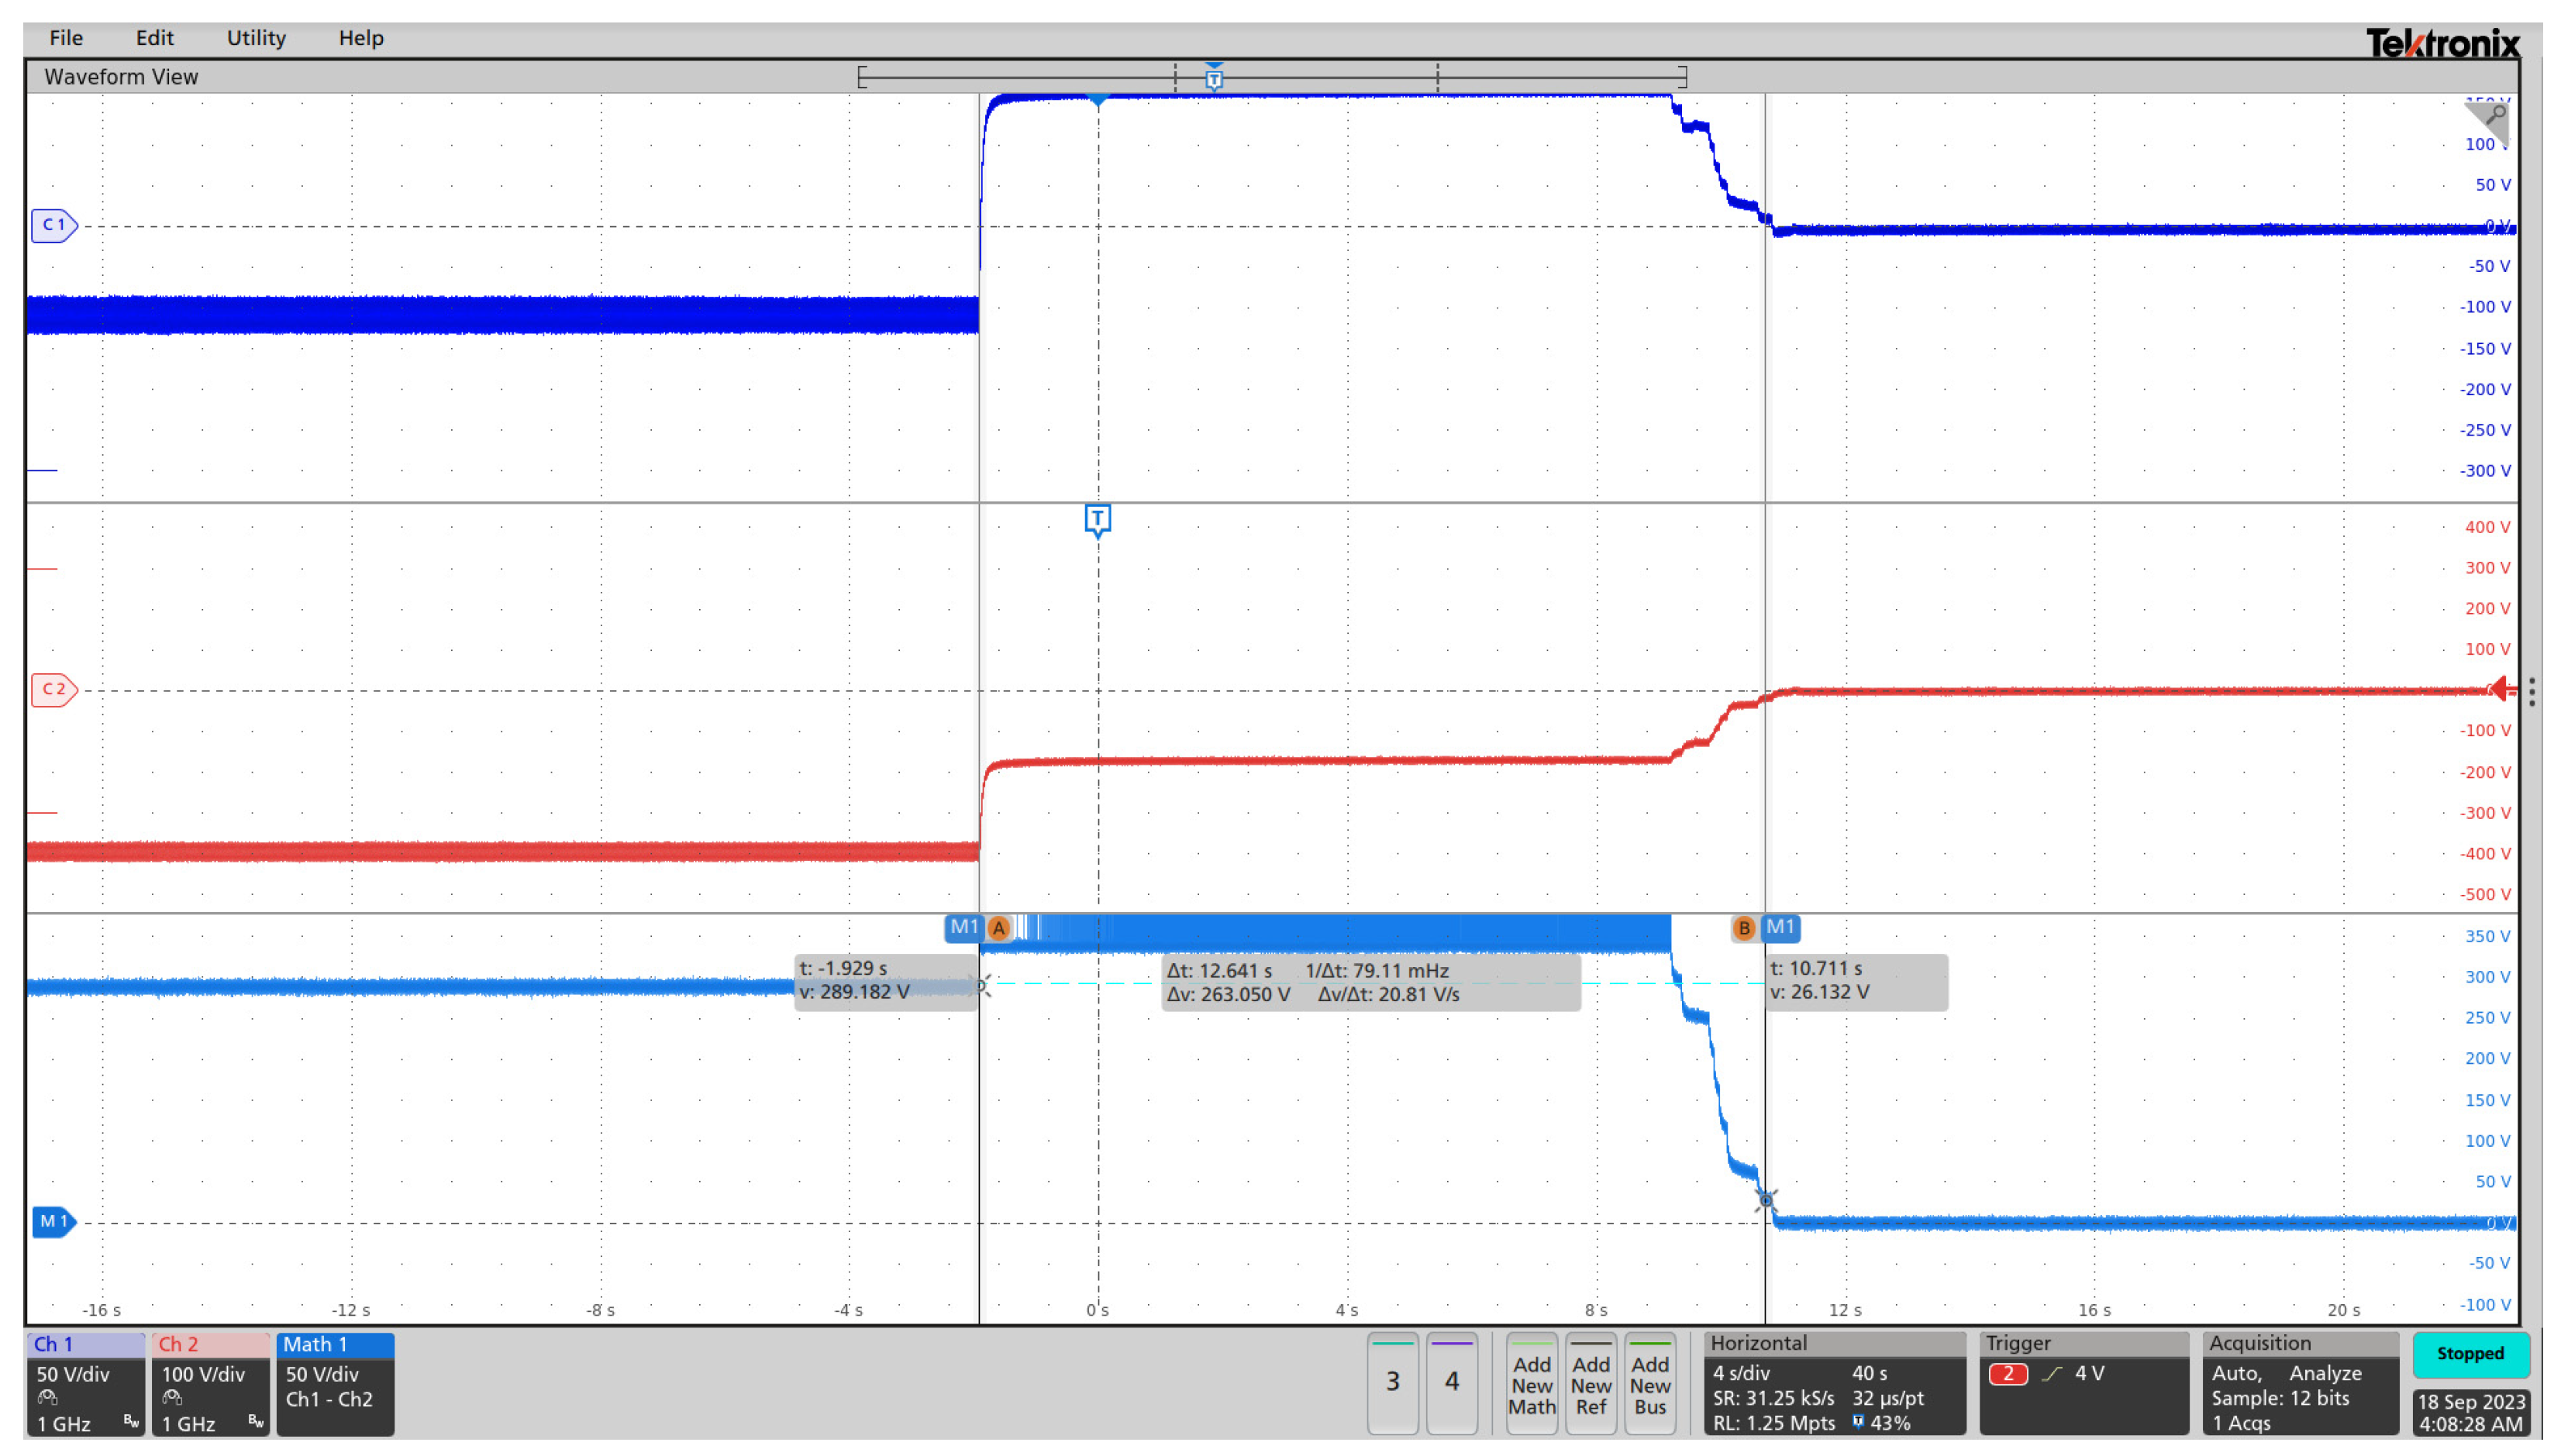
The tests in Table 2 indicate that the electric arc remains stable and can continue for an extended period even after the series switch in the inverter is turned off. The arc’s power is significant, measured at 1000 W, and it can damage the broken contact circuit, potentially leading to a fire. In Figure 7, we show a disconnection using the RSD function.
Given that the arc lasts 12 s and has a significant power output of 1000 W, this energy could easily damage the manual disconnector and potentially cause a fire, especially if there is no RS function to turn off the inverter after a specified time. Figure 8 illustrates the changes in the potential of the input lines measured against the grounding circuit, highlighting that the energy can destroy the DC switch during the arc.
The second test was performed by switching off the AC switch located between the inverter’s output and the load. Table 3 summarises the main findings and results of the tests conducted using the system illustrated in Figure 4. This system activates the RSD function when the main AC circuit breaker is opened.
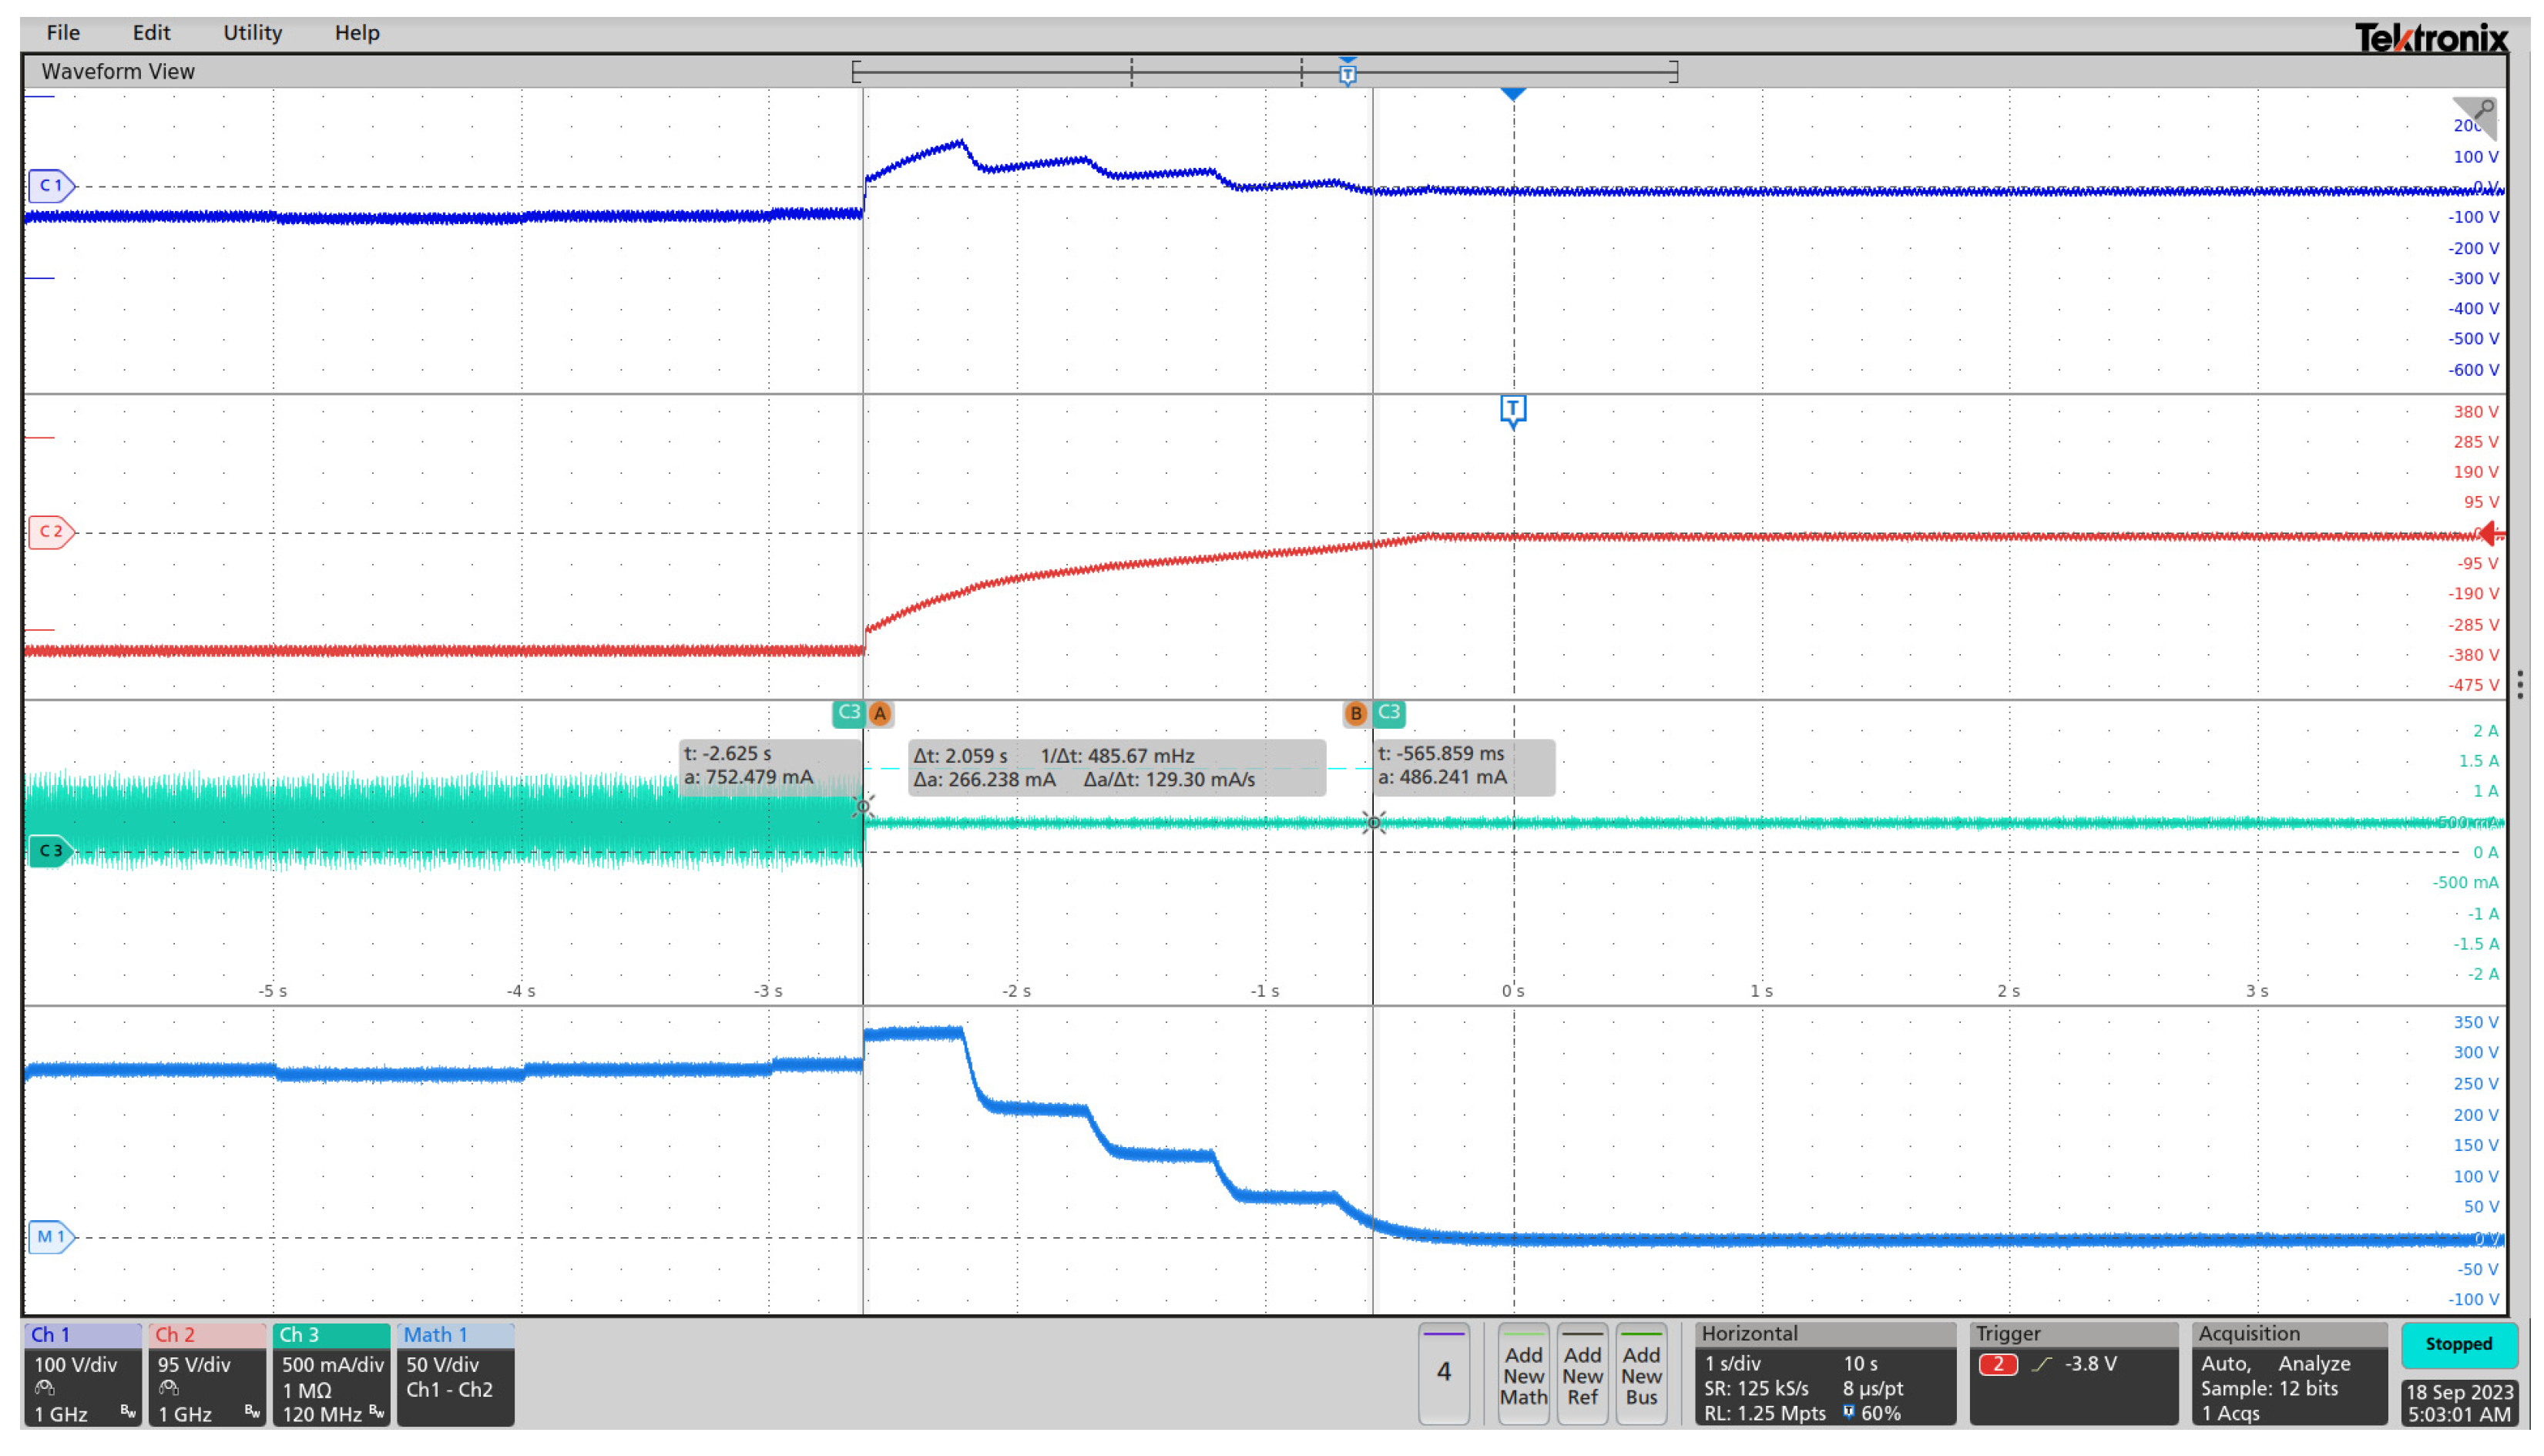
The inverter detects a disconnection on the AC side and, after several seconds, gradually reduces the current. The DC voltage also decreases, causing the inverter to enter a safe stop, as shown in the scope capture from Figure 8.
Figure 7 shows a small current on channel 3, indicating that the output is disconnected after the AC circuit breaker on the inverter’s output circuit is opened (Figure 3).

3.3. Discussion of the Results Regarding the PV Optimizer Testing

In Chapter 2, a test procedure for evaluating the efficiency of the PV optimizers is presented. The calibration records for the string fully equipped with optimizers are shown in Table 4, while the measurements from the string without optimizers are listed in Table 5. In both tables, V1 and I1 represent the values measured on-site, while V2 and I2 are the values reported by the FusionSolar interface software, as depicted in Figure 3.
As shown in Table 4 and Table 5, the method of electronically compensating shadowed PV panels in series enhances the efficiency of the PV plant.
The first conclusion is that the measurements reported by the software are accurate, particularly when considering values rounded to two decimal places.
Values in columns 2 to 5 of Table 6 represent the daily average, computed from data recorded, which represent hourly average values. Each string’s energy is calculated with an absolute cumulative energy counter.
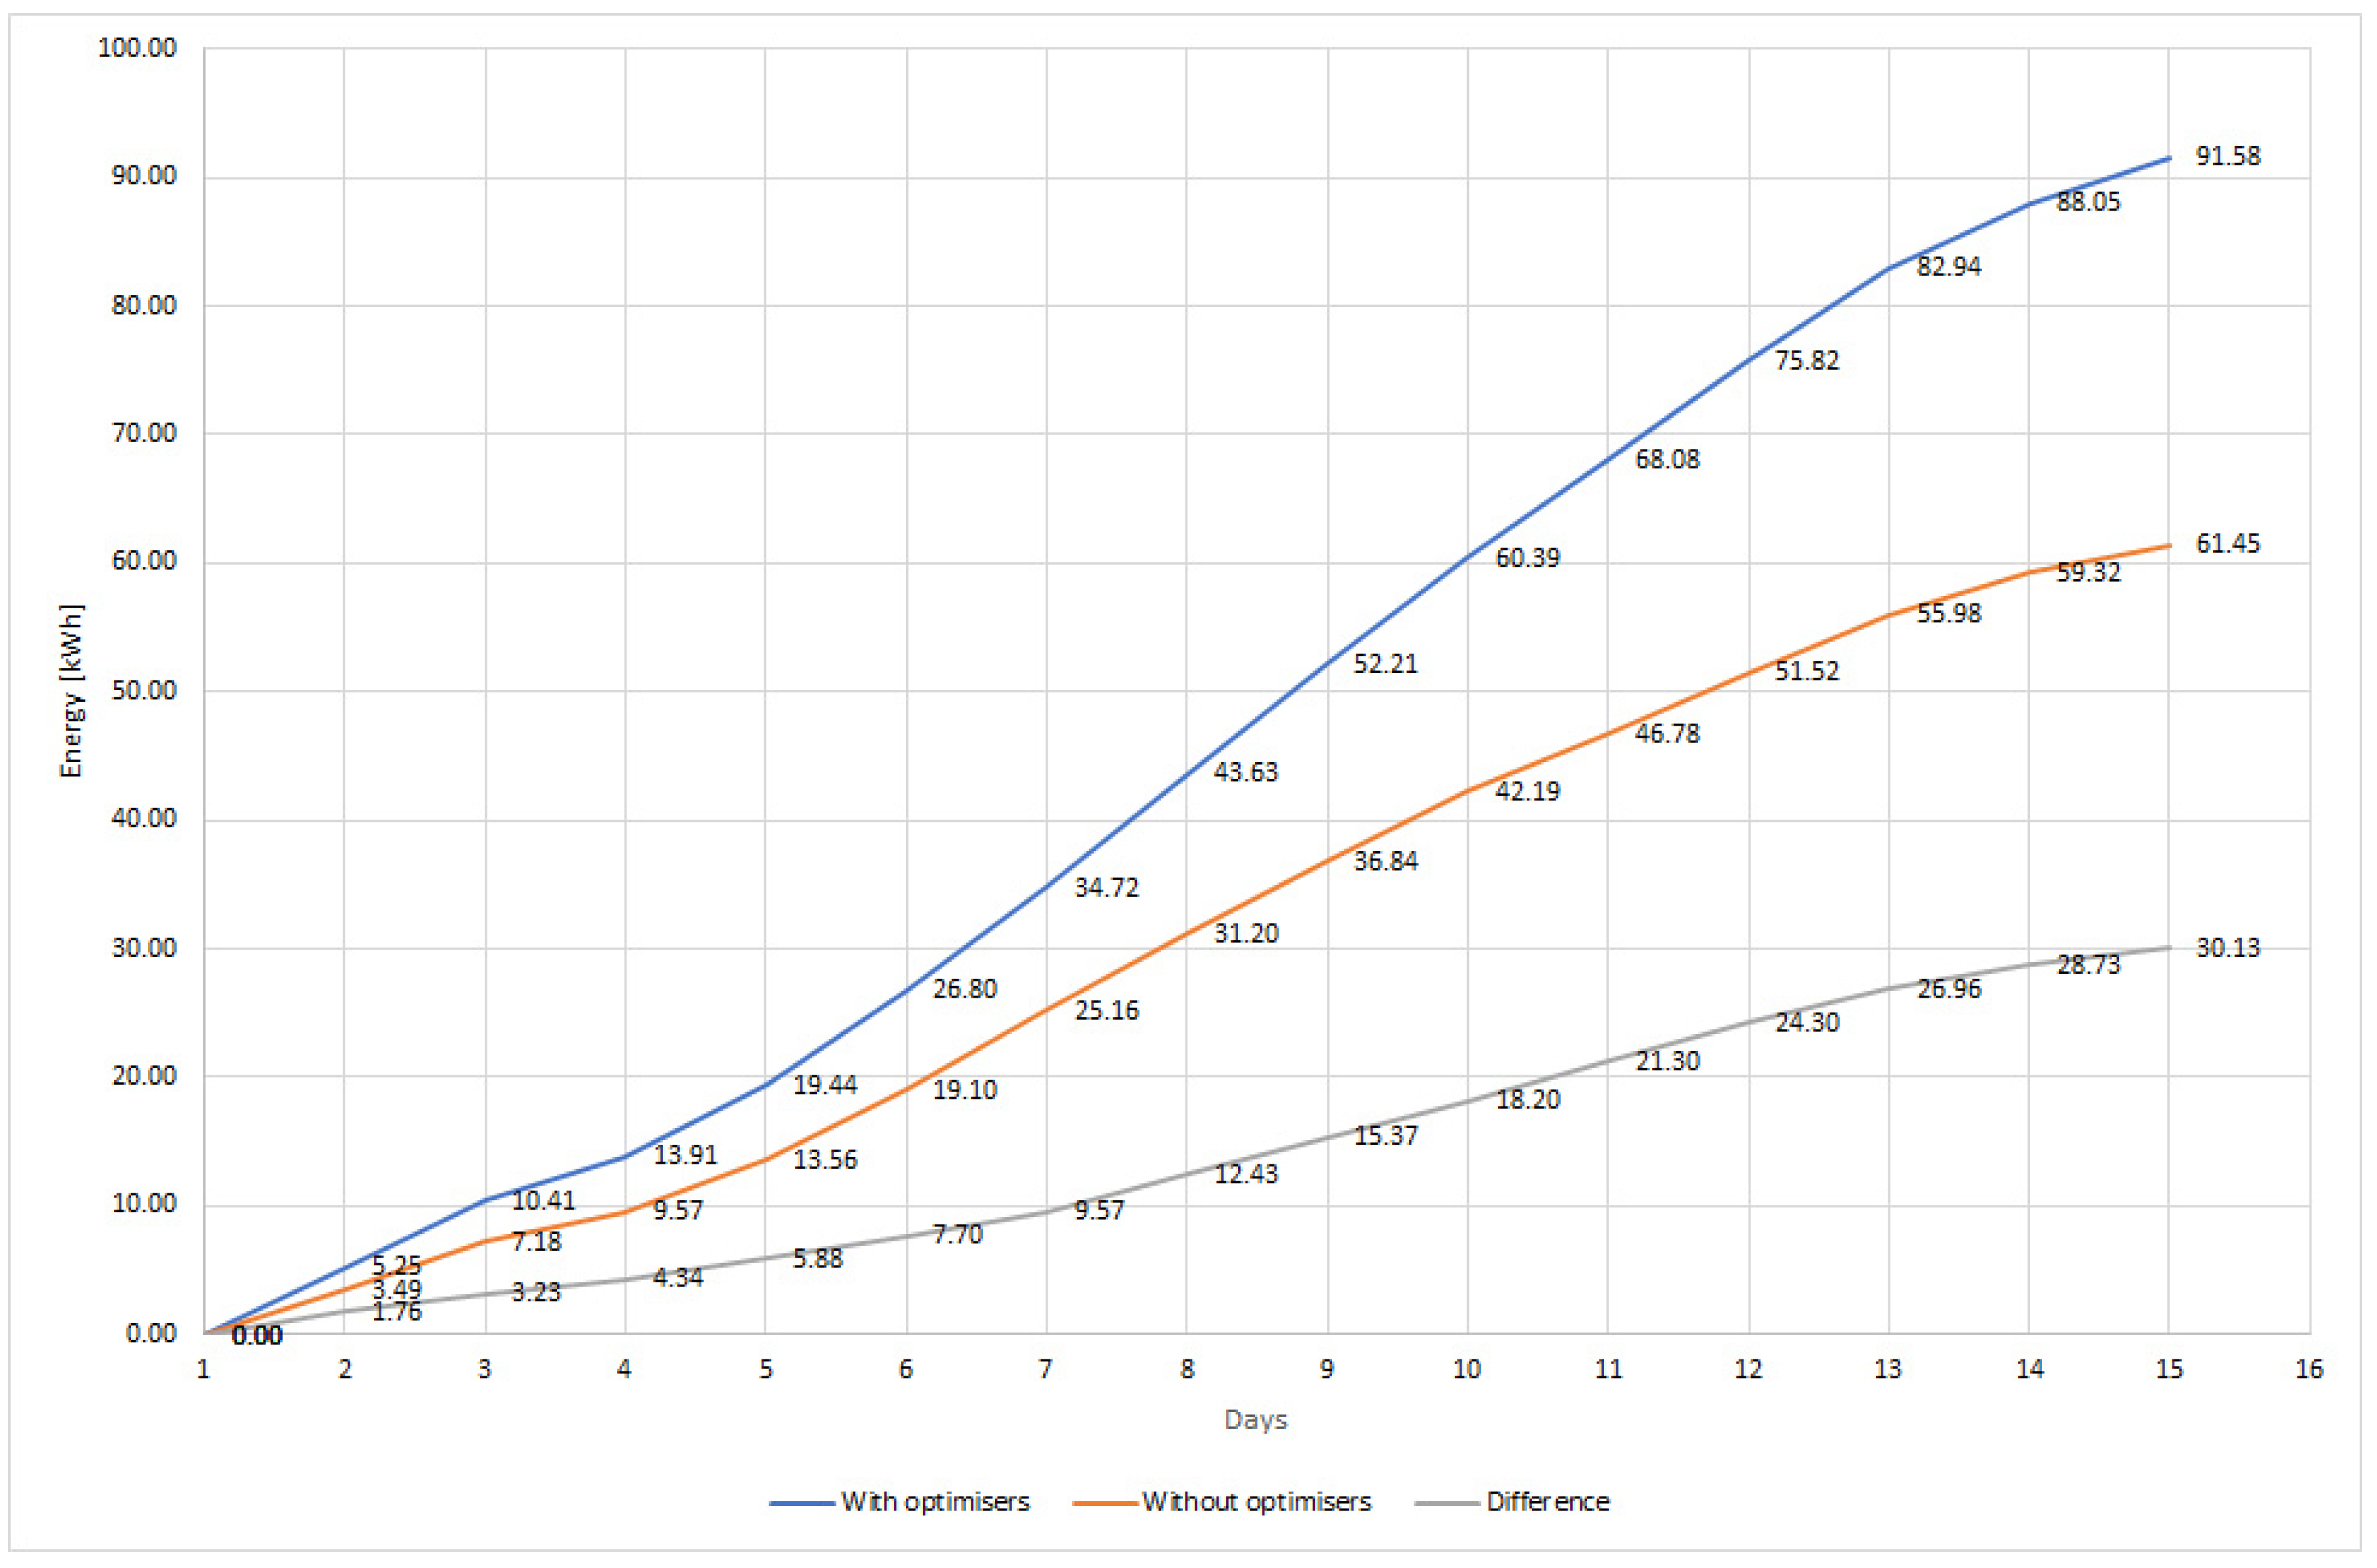
Figure 9 shows the characteristic curves relative to the data in Table 6.
The PV string without optimizers produces less output power than the optimised string. This is primarily because the serially connected PV panels in the former operate at the lowest available current. In contrast, optimizers can reduce the voltage of shaded panels while maintaining a higher output current. As a result, the entire PV string operates at a higher current and a standard voltage. The yield difference is significant, as it can lead to a power gain of up to 50%, which can be pretty beneficial.

4. Conclusions

The article presents the methodology and new experimental results for testing the accuracy of such devices, specifically the AFCI and RSD functions.
The analysis of experimental data concerning testing of the arc-fault circuit interruption function (AFCI) resulted in an average reaction time of 96.4 ms from the arc initiation to arc extinction. Reaction time is below 150 ms, and energy during an arc is kept below 200 W·s.
The influence of the RSD function during the DC switch interruption or the AC load disconnection is limited to 3 s of operation before the inverter stops, thus preventing severe damage to the equipment. The optimizers can enhance maintenance by protecting the main DC switch of the inverter, allowing for safe and quick shutdown of the PV system when optimizers are installed on the panels. Additionally, by limiting the output voltage of the DC link between panels and the inverter, there is a substantial safety improvement in terms of reducing the danger of electrocution for maintenance personnel.
For PV plants developed in residential areas, the safety of the power plant and its maintenance costs are more important than the efficiency or operational costs. Optimizers should be used in this situation, as they can significantly enhance the energy output of a plant with a partially shaded string or panel.
The analysis of 14 days of production from two similar strings of panels connected to the same inverter, with each string having one shaded panel, reveals that the string equipped with optimizers produces 50% more yield than the string with regular panels. As a recommendation, for residential areas where the panels are placed on roofs or near high trees, such an improvement in production has to influence the cost–benefit decision.
From a safety perspective, laws or regulations can recommend an optimizer when installing PV plants in residential areas. Firefighters and insurance companies are willing to impose such devices.

Author Contributions

Conceptualization, D.-A.S. and E.T.; methodology, D.-A.S. and E.T.; software, I.V.; validation, I.V. and I.G.; formal analysis, D.-A.S.; investigation, E.T.; resources, L.-A.E.-L.; data curation, L.-A.E.-L.; writing—original draft preparation, D.-A.S.; writing—review and editing, L.-A.E.-L. and E.T.; visualization, I.G. and G.C.; supervision, G.C.; project administration, L.-A.E.-L.; funding acquisition, L.-A.E.-L. and G.C. All authors have read and agreed to the published version of the manuscript.

Funding

This work was supported by the Ministry of Research, Innovation and Digitization, CCCDI–UEFISCDI, project no. 61/2024 INFUSE (Information Fusion of Multi-Vector Real-Time Data Streams for Energy Management in Emerging Power Grids) and Nucleu contract no. 42N/2023, project no. PN 23140101/2023 (Superior Exploitation of Renewable Energy Sources through Highly Energy-Efficient Equipment Development for Electricity Production and the Intelligent Control of its Distribution and Use).

Data Availability Statement

The original contributions presented in this study are included in the article. For further inquiries, please contact the corresponding authors.

Acknowledgments

We are grateful to Sorin-Cristian Ionescu from the Faculty of Entrepreneurship, Business Engineering and Management, National University of Science and Technology POLITEHNICA Bucharest, for supervising the experiments. Many thanks to the representatives of Huawei Technology Bucharest for their administrative and technical support during the experiments.

Conflicts of Interest

The authors declare that they have no conflicts of interest. The funders had no role in the design of the study; the collection, analysis, or interpretation of data; the writing of the manuscript; or the decision to publish the results.

Abbreviations

The following abbreviations are used in this manuscript:
AFCIarc-fault circuit interrupters
RSDRapid Shutdown Devices

References

  1. Clean Energy Technology Observatory: Photovoltaics in the European Union—2022 Status Report on Technology Development, Trends, Value Chains and Markets. Available online: https://publications.jrc.ec.europa.eu/repository/handle/JRC130720 (accessed on 10 May 2024).
  2. Vodapally, S.N.; Ali, M.H.A. Comprehensive Review of Solar Photovoltaic (PV) Technologies, Architecture, and Its Applications to Improved Efficiency. Energies 2023, 16, 319. [Google Scholar] [CrossRef]
  3. Blakers, A.; Wang, A.; Milne, A.-M.; Zhao, J.; Green, M.-A. 22.8% efficient silicon solar cell. Appl. Phys. Lett. 1989, 55, 1363–1365. [Google Scholar] [CrossRef]
  4. Green, M.A.; Dunlop, E.D.; Hohl-Ebinger, J.; Yoshita, M.; Kopidakis, N.; Bothe, K.; Hinken, D.; Rauer, M.; Hao, X. Solar cell efficiency tables (Version 60). Prog. Photovolt. 2022, 30, 687–701. [Google Scholar] [CrossRef]
  5. Putzke, L.; Michels, L.; Bellinaso, L.-V. Electric Arcs in Photovoltaic Systems: A Comparative Analysis of IEC 63027, UL 1699B, and GB-t 39750 Standards. In Proceedings of the 2023 IEEE 8th Southern Power Electronics Conference and 17th Brazilian Power Electronics Conference (SPEC/COBEP), Florianopolis, Brazil, 26–29 November 2023; pp. 1–5. [Google Scholar] [CrossRef]
  6. Ivins, R. Value Engineering Tips. 2014 NEC 690.12 Rapid Shutdown for String Inverters on Flat Roofs. Available online: https://www.purepower.com/blog/nec-690-12-rapid-shutdown-of-pv-systems-on-buildings (accessed on 30 June 2025).
  7. Ivins, R. Pure Power Engineering, Value Engineering Tips. 2017 NEC 690.12 Rapid Shutdown—Important Changes. Available online: https://www.purepower.com/blog/2017-nec-690.12-rapid-shutdown-important-changes (accessed on 30 June 2025).
  8. de Souza Silva, J.L.; Moreira, H.S.; de Mesquita, D.B.; Cavalcante, M.M.; Villalva, M.G. Modular Architecture with Power Optimizers for Photovoltaic Systems. In Proceedings of the 2019 International Conference on Smart Energy Systems and Technologies (SEST), Porto, Portugal, 9–11 September 2019; pp. 1–6. [Google Scholar] [CrossRef]
  9. Toche Tchio, G.M.; Kenfack, J.; Kassegne, D.; Menga, F.-D.; Ouro-Djobo, S.S. A Comprehensive Review of Supervised Learning Algorithms for the Diagnosis of Photovoltaic Systems, Proposing a New Approach Using an Ensemble Learning Algorithm. Appl. Sci. 2024, 14, 2072. [Google Scholar] [CrossRef]
  10. Gu, Y.; Gong, C.; Chen, H.; Zhang, J.; Wang, Z. Series DC Arc Characteristic and Diagnosis Strategy for Distributed PV Power Generation. Electroteh. Electron. Autom. (EEA) 2022, 70, 1–10. [Google Scholar] [CrossRef]
  11. Beiu, C.; Buică, G.; Antonov, A.-E.; Pasculescu, D.; Dobra, R.; Risteiu, M. Arc Flash Detection on Photovoltaic Systems. Ann. Univ. Petrosani Electr. Eng. 2024, 26, 79–88. [Google Scholar]
  12. Song, L.; Lu, C.; Li, C.; Xu, Y.; Liu, L.; Wang, X. Progress of Photovoltaic DC Fault Arc Detection Based on VOSviewer Bibliometric Analysis. Energies 2024, 17, 2450. [Google Scholar] [CrossRef]
  13. SolarEdge White Paper, “SolarEdge Safety Solution”. 2022. Available online: https://natec.com/wp-content/uploads/2022/11/SolarEdge-Safety-Solution-White-Paper.pdf (accessed on 18 August 2025).
  14. SolarEdge. 2025. Available online: https://knowledge-center.solaredge.com/sites/kc/files/se-power-optimizer-s-series-datasheet.pdf (accessed on 6 August 2025).
  15. Huawei. SUN2000-(3KTL-10KTL)-M0 User Manual. Available online: https://support.huawei.com/enterprise/en/doc/EDOC1100059932/5ed1b520/product-introduction#EN-US_CONCEPT_0141929343 (accessed on 20 June 2024).
  16. Tigo. 2025. Available online: https://www.tigoenergy.com/ (accessed on 6 August 2025).
  17. SUN. Available online: https://manuals.sma.de/SBSExx-US-50/en-US/13317429131.html (accessed on 6 August 2025).
  18. Ramos, F.; Neto, J.; Almeida, F.; Velázquez, S.; Lima, B. Compliance Analysis of Series Arc-fault in AFCI-Equipped Inverters in Accordance with IEC 63027. IEEE Lat. Am. Trans. 2024, 22, 761–770. [Google Scholar] [CrossRef]
  19. Zhang, X.; Chen, M.; Fu, Y.; Li, Y. A Step-Down Partial Power Optimizer Structure for Photovoltaic Series-Connected Power Optimizer System. In Proceedings of the 2018 IEEE International Power Electronics and Application Conference and Exposition (PEAC), Shenzhen, China, 4–7 November 2018; pp. 1–4. [Google Scholar] [CrossRef]
  20. Elmelegi, A.; Aly, M.; Ahmed, E.M.; Alhaider, M.M. An Efficient Low-Cost Distributed MPPT Method for Energy Harvesting in Grid-Tied Three-Phase PV Power Optimizers. In Proceedings of the 2019 21st International Middle East Power Systems Conference (MEPCON), Cairo, Egypt, 17–19 December 2019; pp. 1042–1047. [Google Scholar] [CrossRef]
  21. Muller, N.; Flores-Bahamonde, F.; Pesantez, D.; Renaudineau, H.; Lopez-Caiza, D.; Kouro, S. Reconfigurable Partial Power Converter for Power Optimizers in PV Systems. In Proceedings of the IECON 2022—48th Annual Conference of the IEEE Industrial Electronics Society, Brussels, Belgium, 17–20 October 2022; pp. 1–6. [Google Scholar] [CrossRef]
  22. Azab, M. DC power optimizer for PV modules using SEPIC converter. In Proceedings of the 2017 IEEE International Conference on Smart Energy Grid Engineering (SEGE), Oshawa, ON, Canada, 14–17 August 2017; pp. 74–78. [Google Scholar] [CrossRef]
  23. Maheri, H.M.; Chub, A.; Vinnikov, D.; Blinov, A. Photovoltaic Microconverter with Integrated Sub-Modular Power Optimizer. In Proceedings of the 2021 IEEE 15th International Conference on Compatibility, Power Electronics and Power Engineering (CPE-POWERENG), Florence, Italy, 14–16 July 2021; pp. 1–6. [Google Scholar] [CrossRef]
  24. SMA Solutions. “Fire Safety of PV Systems” by Angelika Löning (Guest Post). Available online: https://www.sma-sunny.com/en/fire-safety-of-pv-systems/ (accessed on 5 June 2024).
Figure 1. Block diagram of a PV plant comprising one panel string connected to an inverter using individual AFCI controllers, with shaded black panels.
Electronics 14 03290 g001
Figure 2. Test setup to evaluate the AFCI operation during PV string interruption, using a scope with three channels, C1, C2 and C3, measured relative to the ground GND.
Electronics 14 03290 g002
Figure 3. Test setup for evaluation of operation during hardware interruptions.
Electronics 14 03290 g003
Figure 4. Human–machine interface, using a configuration with a grid-connected and power-limited system.
Electronics 14 03290 g004
Figure 5. Diagram of PV plant layout used for testing the shading effect, both strings being partially shaded, and only one string using individual optimizers (with orange).
Electronics 14 03290 g005
Figure 6. String current (C2 channel using red line) and DC voltage over sliding contact during provoked arc (C3 channel using green line), during the system’s stopping by AFCI function, in 102 ms.
Electronics 14 03290 g006
Figure 7. DC voltage between input lines (Channel C1 with indigo line and Channel C2 with red line), versus voltage between inputs and ground (M1 channel using blue line) during provoked arc. The DC switch stopped the system after 12 s.
Electronics 14 03290 g007
Figure 8. DC voltage between input lines (Channel C1 using indigo line, Channel C2 using red line), load current (Channel C3 using green line) and voltage between inputs and ground (Channel M1 using blue line) during provoked arc, when the system was stopped by the RSD function activated by load current reduction (green line).
Electronics 14 03290 g008
Figure 9. Cumulative energy comparison for 14 days (string PV1 is fully equipped with PV optimizers, vs. string PV2 is without optimizers).
Electronics 14 03290 g009
Table 1. Disconnection of the system using the AFCI function, with DC voltage, current, and time.
Test IDDC Voltage [VDC]DC Current [ADC]Time Interval [ms]
13184.45144
23064.2053
32824.887
42645.219.6
52804.862.8
62454.754
72414.0294.5
82524.1105
92184.141.8
101983.864
112564.2145
122564.2142
132254.297
142804.2678
152834.57132
162118.1174.6
172505.6868.7
182505.9886.8
192356.2168
202606.6123
212306.9103.5
222687.3101.5
232533.9101.5
242353.897
252403.4128
262353.6122.6
272327.7108
Table 2. Disconnection of the system using a series DC switch, stating the DC voltage and time.
Test IDDC Voltage [VDC]Time Interval [s]
129612.641
229512.641
328912.641
429512.135
Table 3. Disconnection of the system using the RSD function, stating the DC voltage and time.
Test IDDC Voltage [VDC]Time Interval [s]
12503.886
23112.733
32533.529
42462.217
52641.738
62572.059
Table 4. Voltage and current measurement on the input of the inverter, values for the string fully equipped with PV optimisers.
V1
[VDC]
V2
[VDC]
Error
[%]
I1
[ADC]
I2
[ADC]
Error
[%]
333338.61.653.63.531.98
333338.51.623.633.581.40
334338.91.453.583.521.70
3343391.473.563.492.01
Table 5. Voltage and current measurement on input of inverter, values for string without PV optimizers.
V1
[VDC]
V2
[VDC]
Error
[%]
I1
[ADC]
I2
[ADC]
Error
[%]
278277.20.293.473.421.46
279277.10.693.463.47−0.29
278276.80.433.483.49−0.29
277276.10.333.453.450.00
278276.70.473.453.46−0.29
278276.80.433.453.440.29
Table 6. Daily data was recorded regarding energy produced for each string, where string PV1 is fully equipped with PV optimizers, while string PV2 is without optimizers.
DatePV1 Absolute Energy [kWh] PV2 Absolute Energy [kWh]
Day 100
Day 25.253.49
Day 310.417.18
Day 413.919.57
Day 519.4413.56
Day 626.8019.10
Day 734.7225.16
Day 843.6331.20
Day 952.2136.84
Day 1060.3942.19
Day 1168.0846.78
Day 1275.8251.52
Day 1382.9455.98
Day 1488.0559.32
Day 1591.5861.45
Disclaimer/Publisher’s Note: The statements, opinions and data contained in all publications are solely those of the individual author(s) and contributor(s) and not of MDPI and/or the editor(s). MDPI and/or the editor(s) disclaim responsibility for any injury to people or property resulting from any ideas, methods, instructions or products referred to in the content.