3.2. Comparison of Optimal Configurations
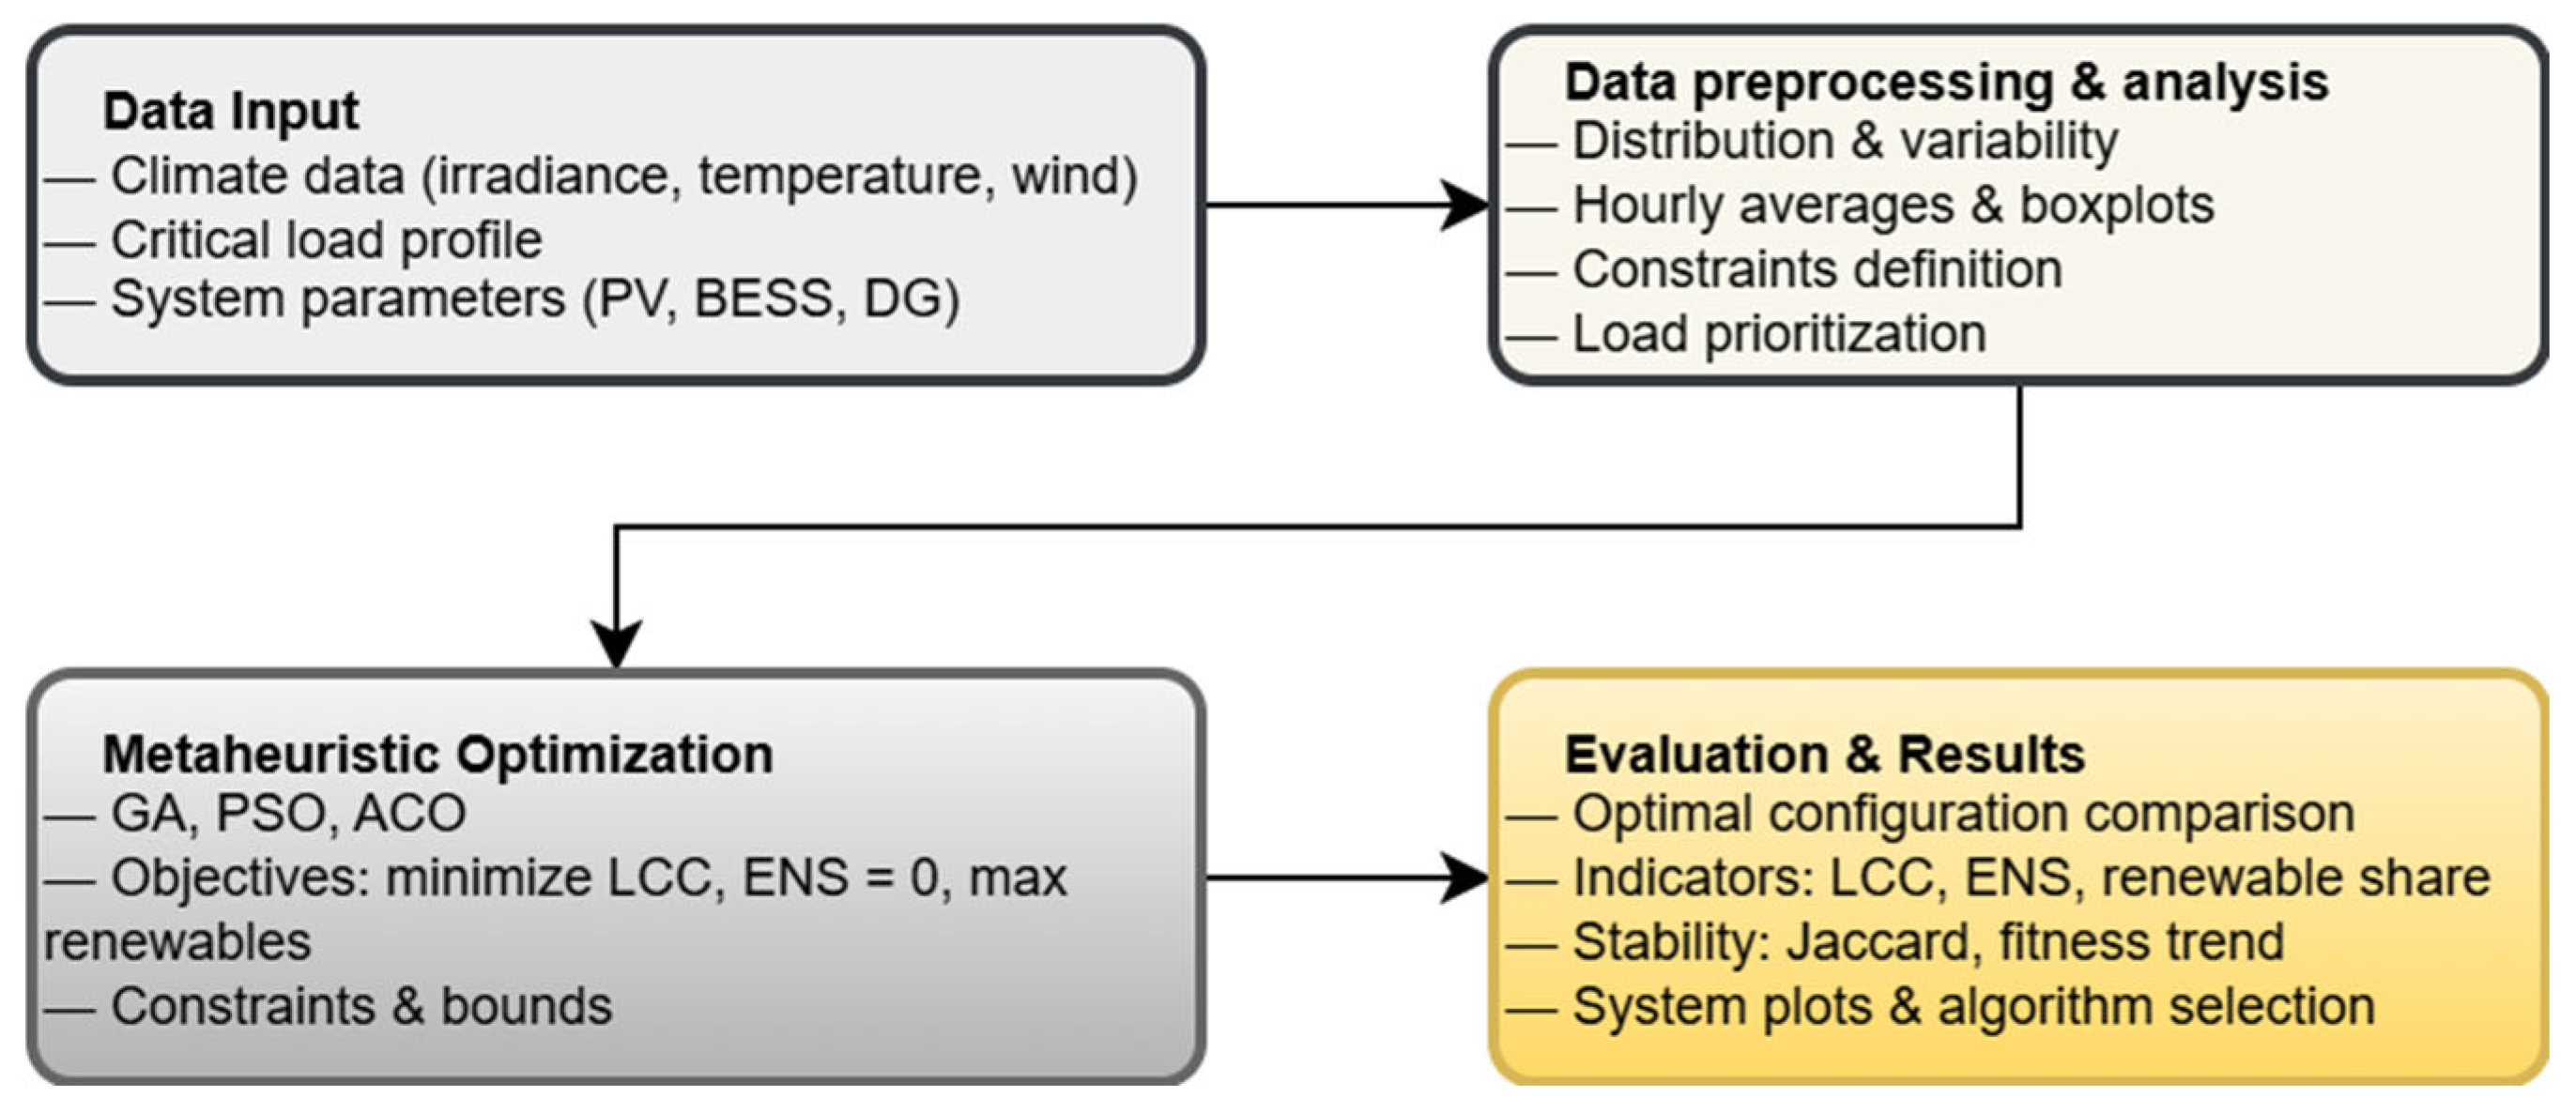
Table 6 presents the results of the annual simulation carried out with climate and electricity demand data corresponding to a medical center located in a remote, high-altitude area of Peru. In this study, the three metaheuristic algorithms (GA, PSO, and ACO) were applied under the same set of technical constraints. The ranges defined for the decision variables allowed for the selection of up to 20 photovoltaic panels, up to 140 kWh of battery storage capacity, and up to 18 kW of power for the diesel generator, in multiples of 2 kW. The objective function combined economic and energy criteria, such as LCC, ENS, renewable energy share, and energy surpluses.
As a result, both the GA and PSO algorithms identified with the same optimal configuration, consisting of 20 photovoltaic panels, 40 kWh of battery capacity, and a 2 kW diesel generator. This solution achieved an ENS of 0%, a renewable share of 64.04%, an LCC of USD 10,213, and an energy surplus of 7.88%. In contrast, the ACO algorithm proposed a solution with greater installed capacity: 20 photovoltaic panels, 140 kWh of storage, and a 12 kW diesel generator. Although this configuration also achieved an ENS of 0% and the same renewable share, it had a considerably higher LCC (USD 26,213) and a higher energy surplus (39.69%), which represents unnecessary oversizing.
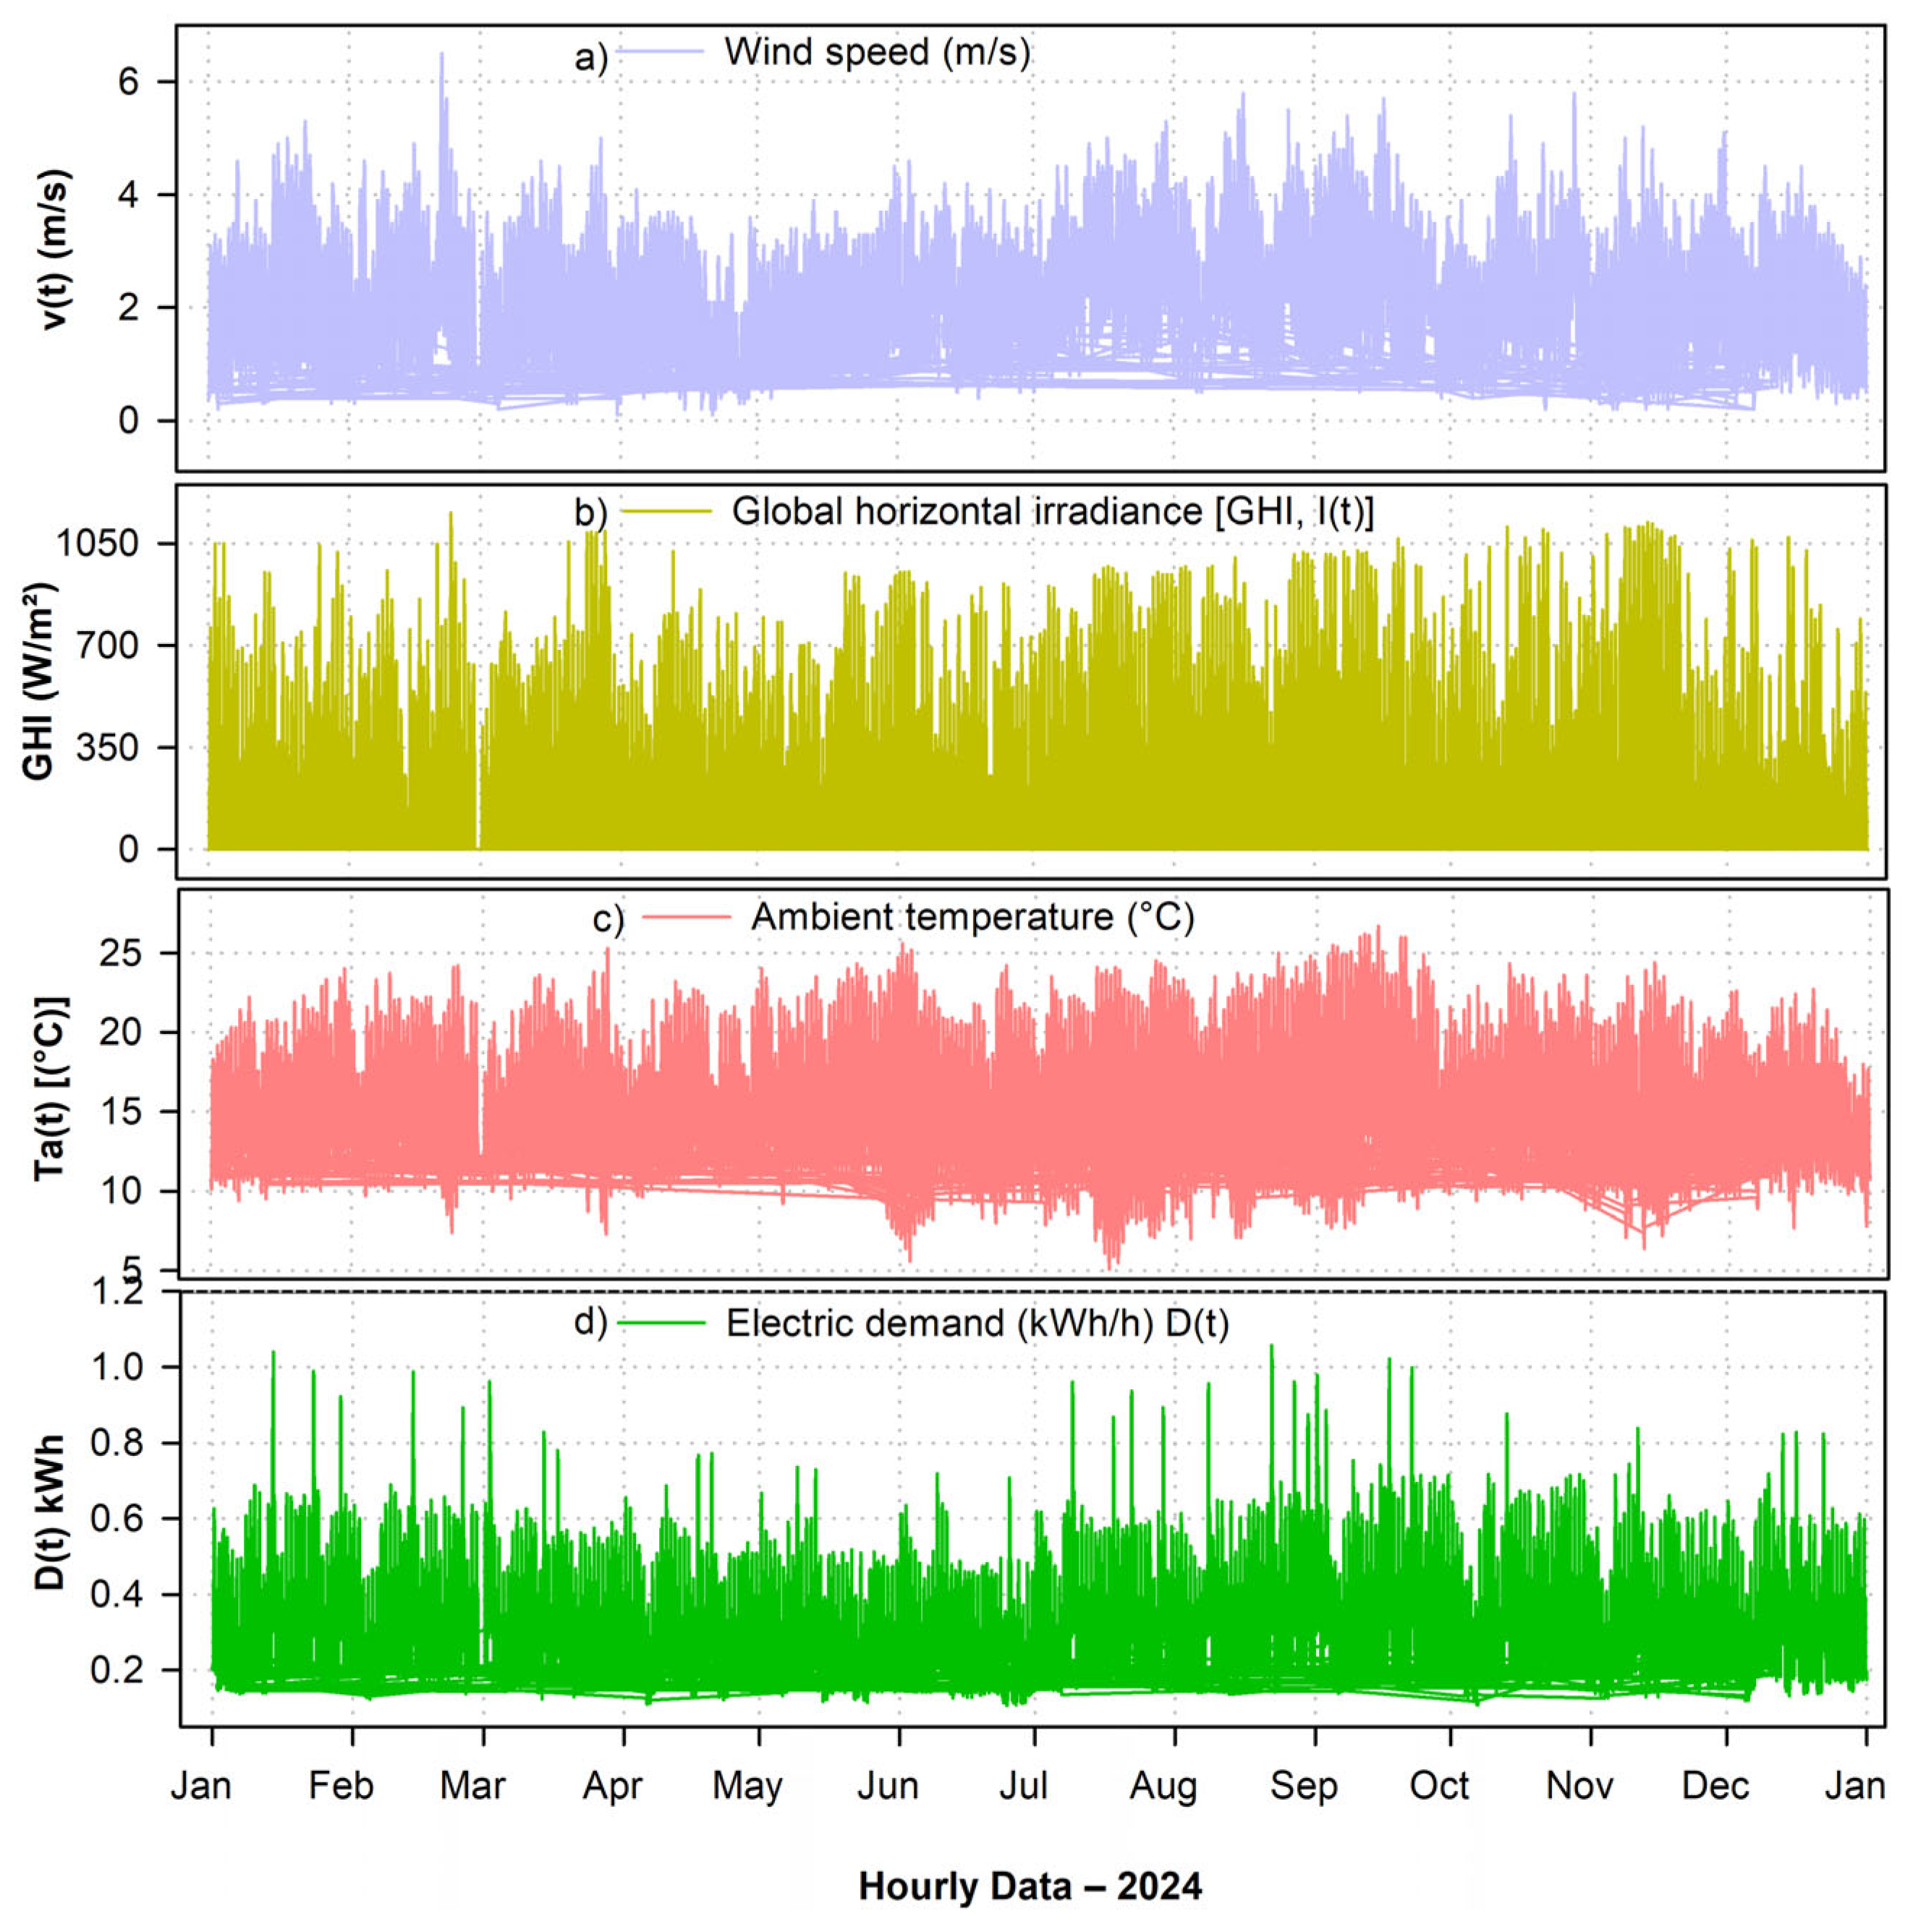
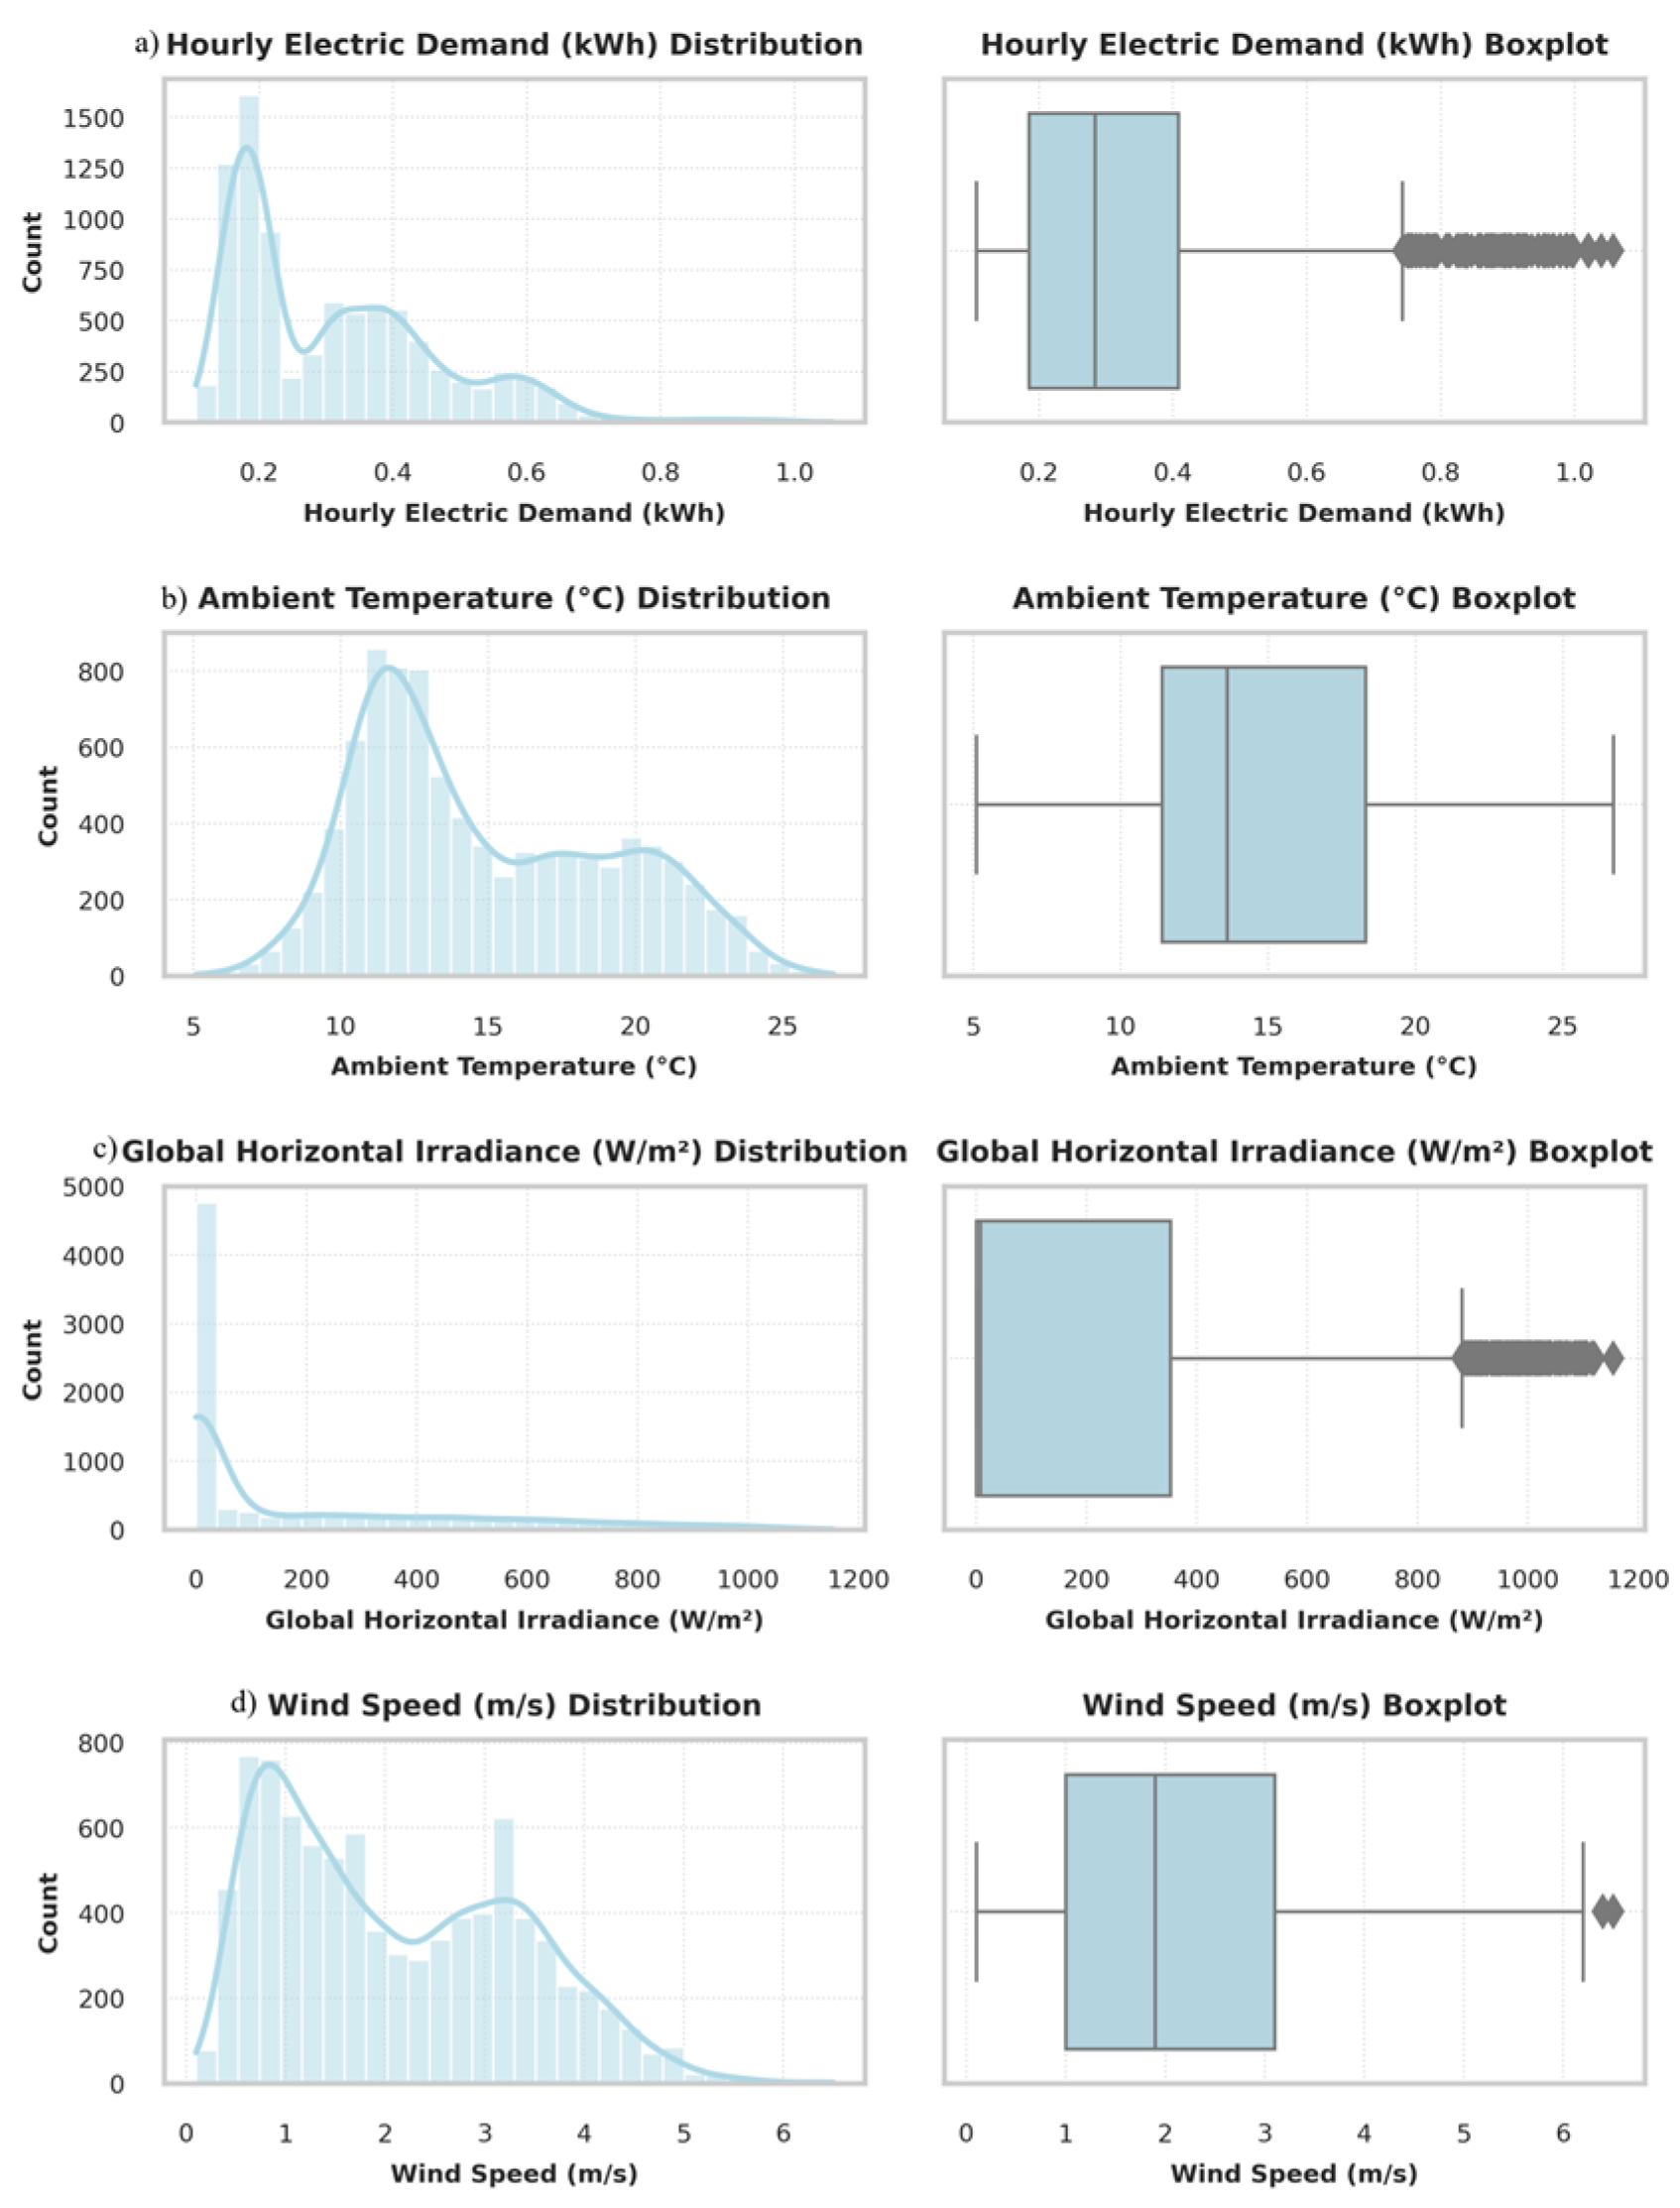
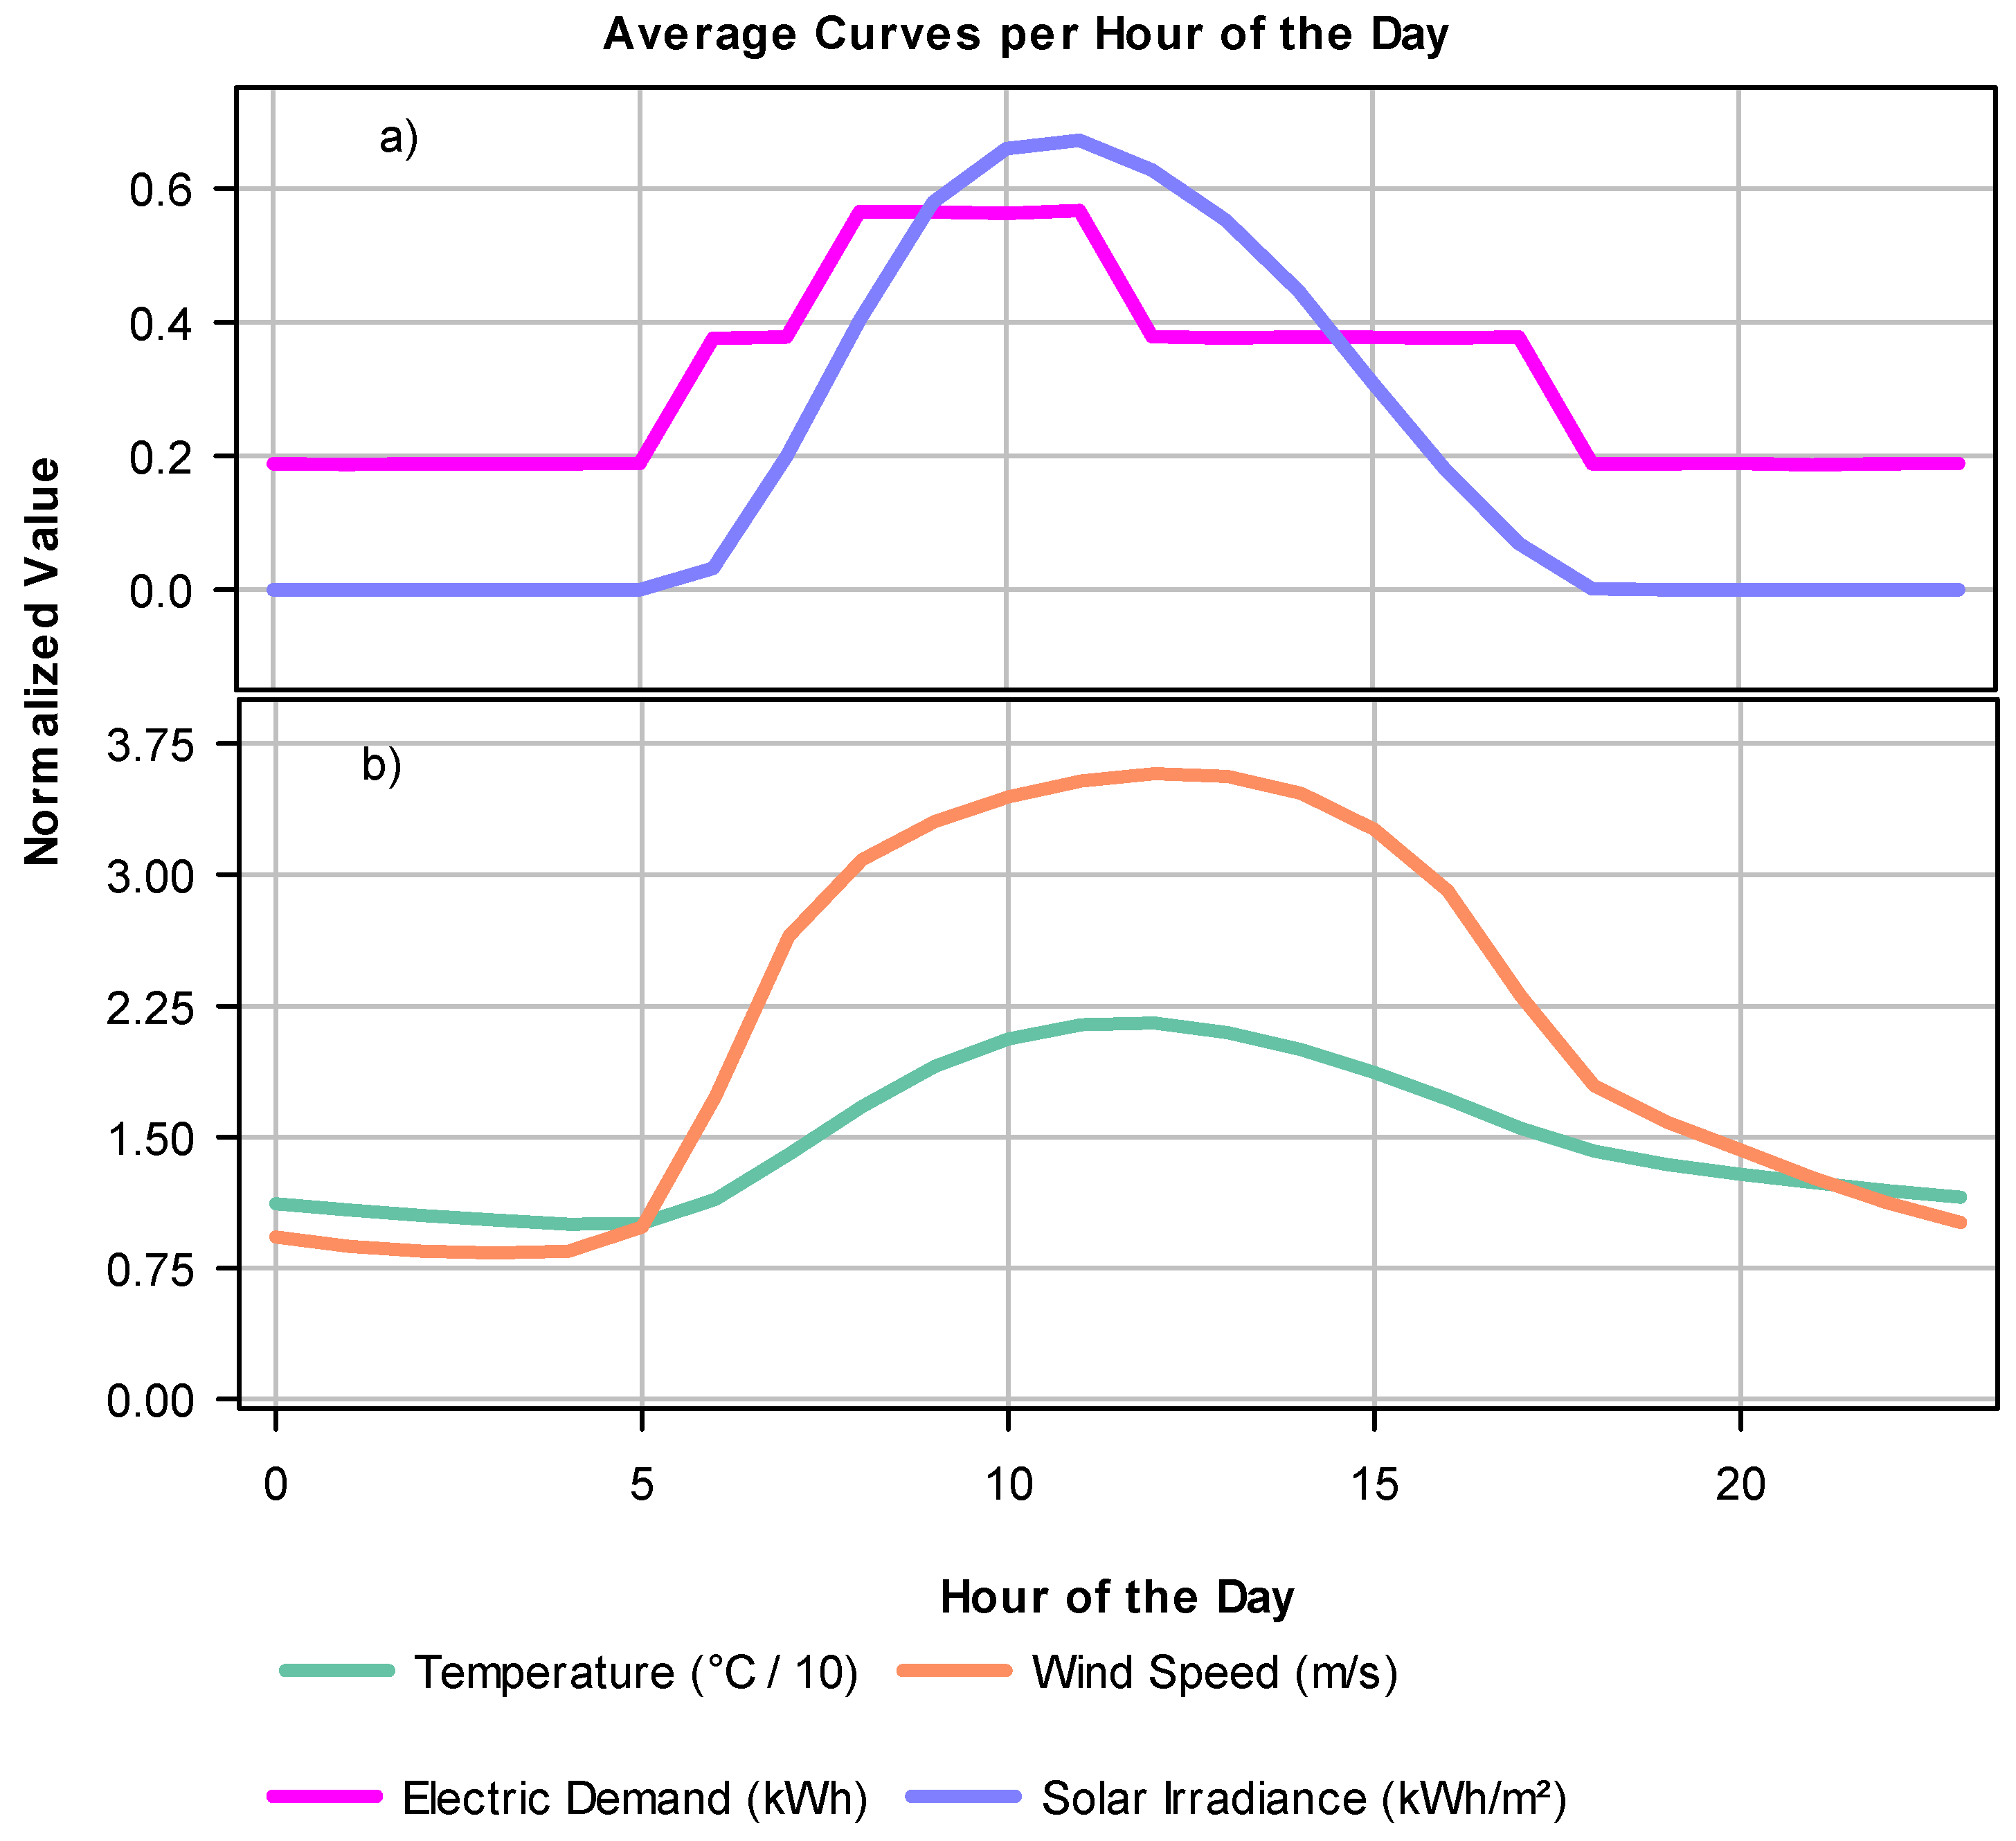
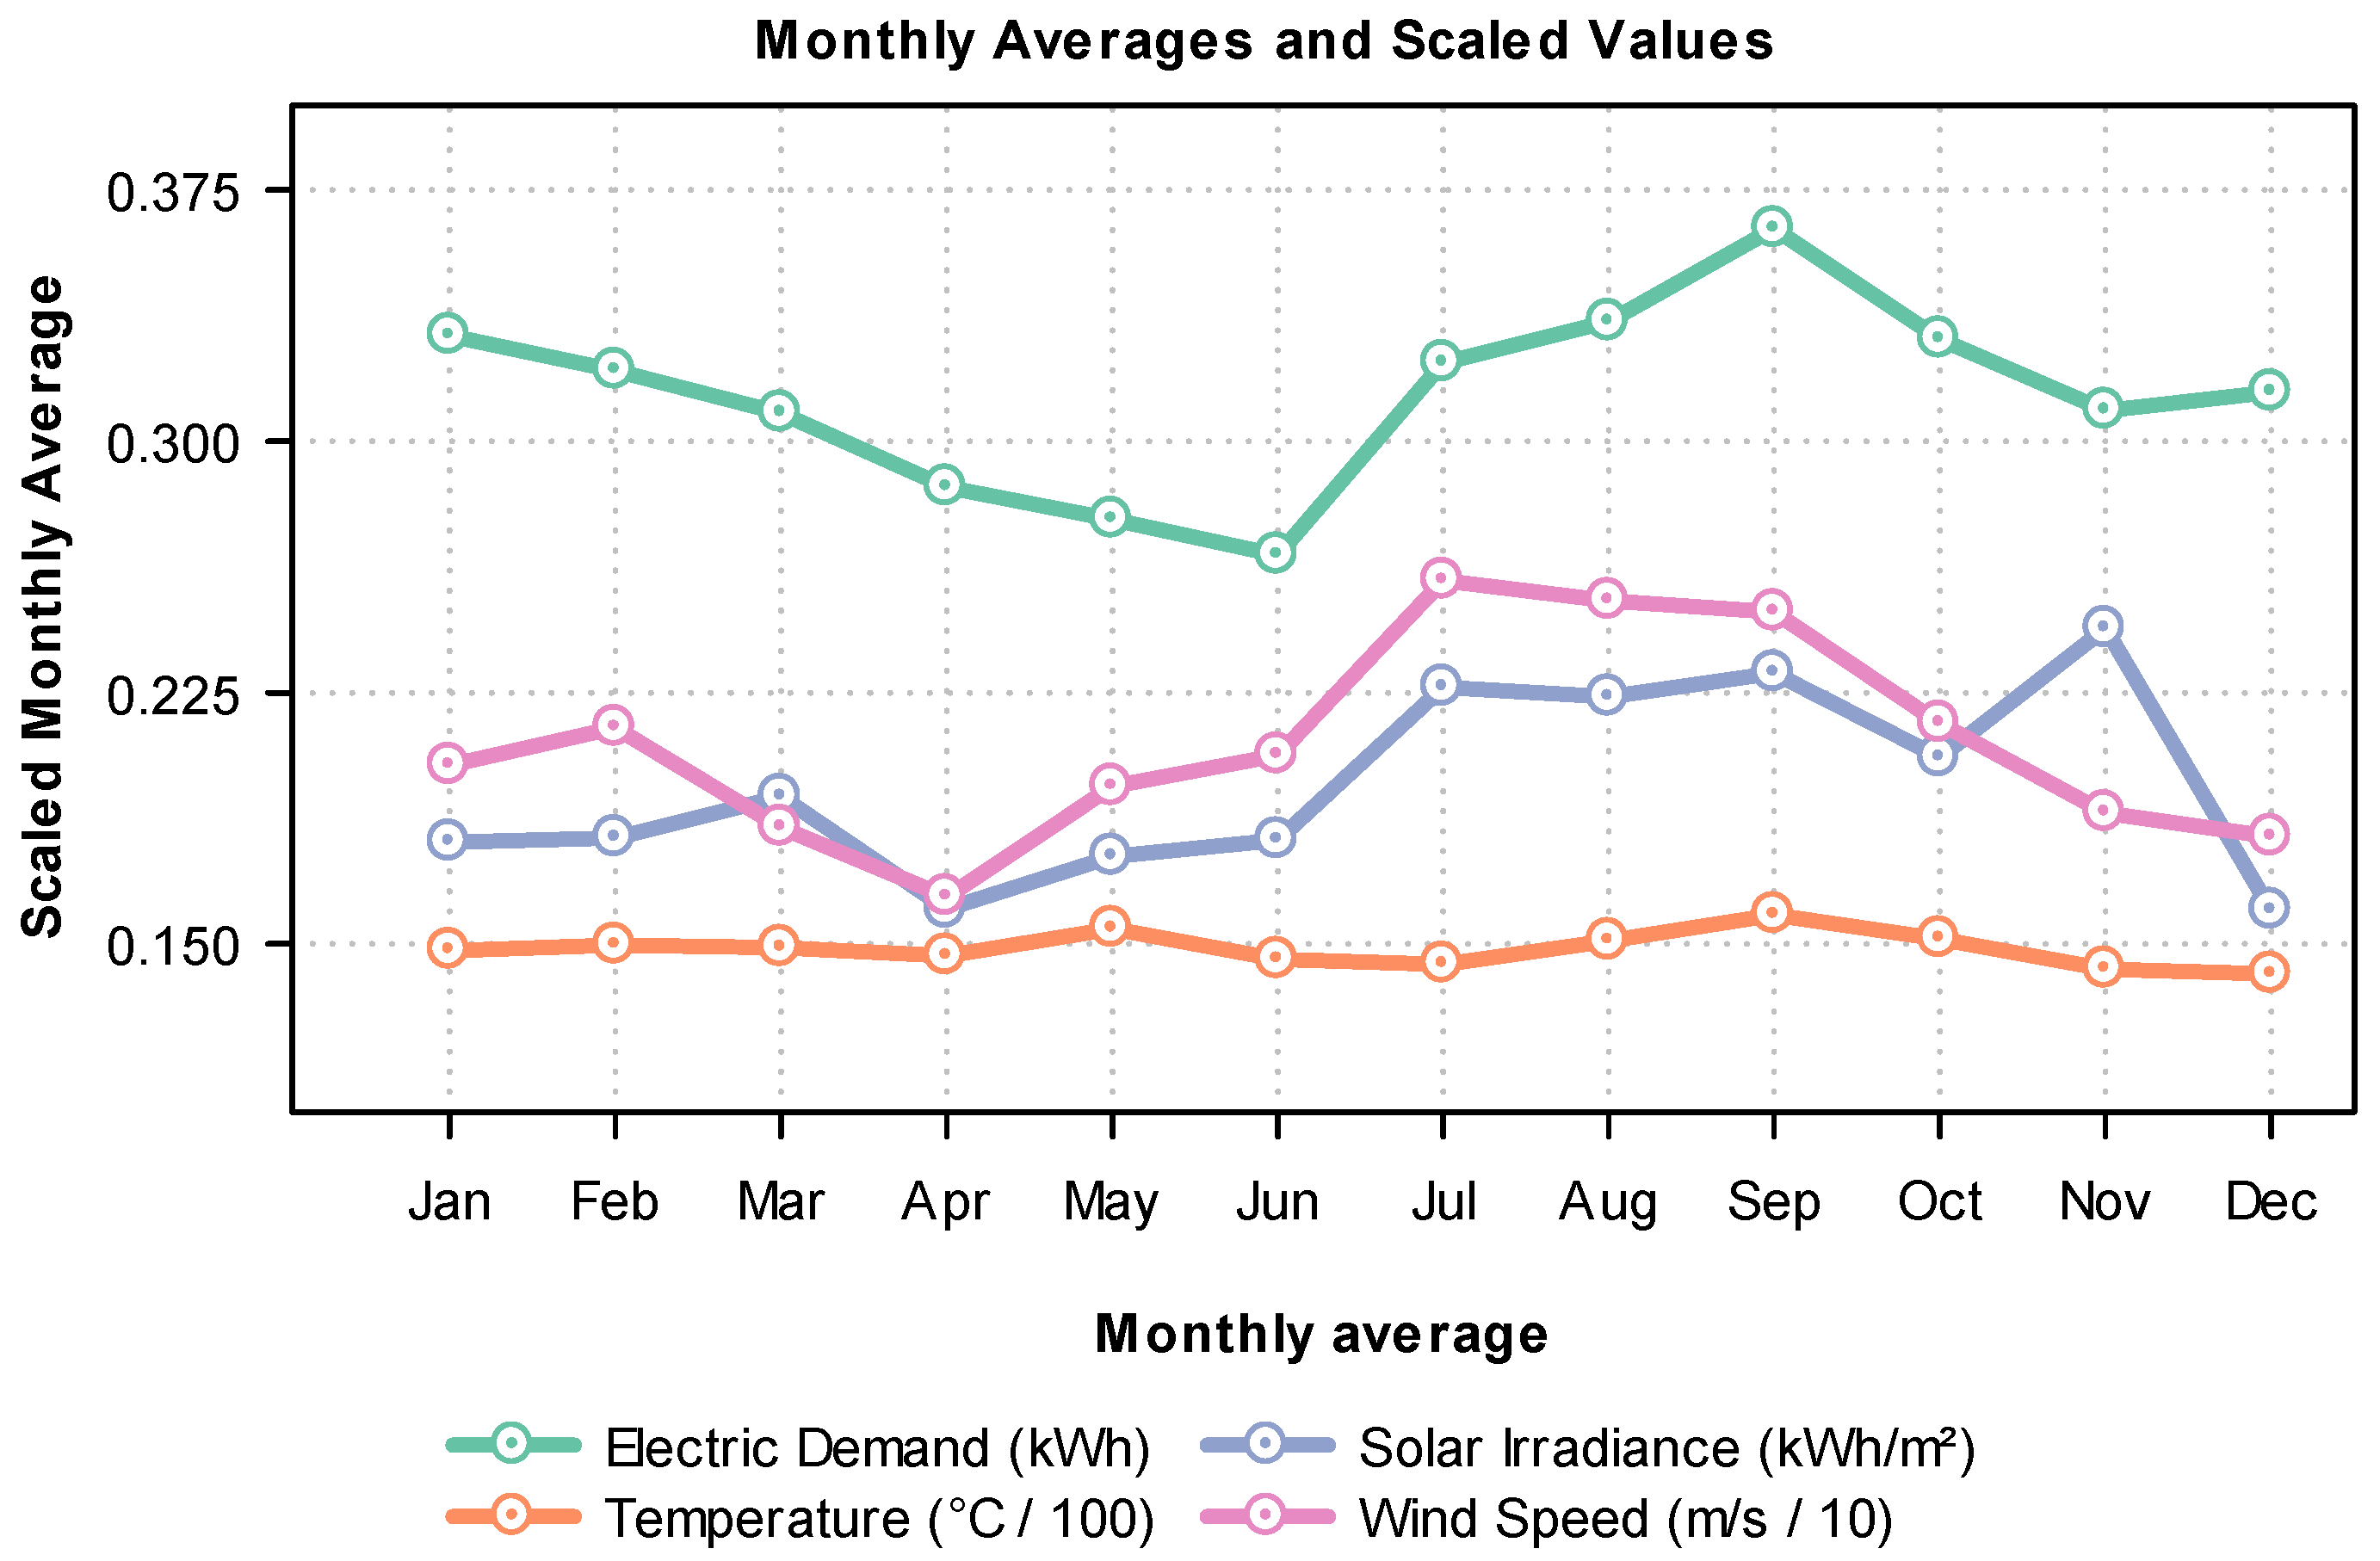
Additionally, none of the three optimized configurations included wind turbines. This result is consistent with the preliminary statistical analysis, which showed predominantly low wind speeds, between 0.4 and 2.0 m/s, which is below the typical minimum start-up threshold for the wind turbines considered (approximately 3.2 m/s). Therefore, the incorporation of wind technology was not feasible in the context evaluated.
It should be noted that the behavior of the ACO algorithm is explained by the absence of a direct penalty for oversizing, which leads it to select configurations with higher installed capacity without obtaining additional improvements in terms of reliability or renewable share. In contrast, both GA and PSO achieved more efficient solutions by identifying compact configurations that optimize the installed infrastructure and reduce the total cost of the system.
Therefore, from a multi-criteria approach, the configuration proposed by GA and PSO represents the most balanced and efficient alternative for the operational context evaluated. This solution guarantees supply reliability (ENS equal to 0%), significant renewable share (64.04%), a low level of surplus (7.88%), and the lowest total cost (USD 10,213). In comparison, the option generated by ACO, although viable, involves additional costs without additional energy benefits. Therefore, the results show that the configuration generated by GA and PSO is the most suitable for the conditions analyzed.
The identical results obtained with GA and PSO indicate that both algorithms converged to the same global optimum under the defined search space and constraints. This convergence is not due to limitations in the model but rather to the optimization landscape, in which the optimal configuration is uniquely defined and robust to variations in algorithmic search strategies.
Figure 6 shows the performance of the GA, PSO, and ACO algorithms considering criteria such as LCC, ENS, renewable energy share, and energy surpluses. To facilitate comparison, the values were normalized on a scale of 0 to 1. The results show that GA and PSO simultaneously achieve the best performance in all evaluated criteria. Both configurations have an ENS of zero, a low LCC, high renewable energy share, and minimal energy surplus. As a result, their polygons completely overlap in the graph, indicating equivalence in both technical and economic efficiency. Similarly, the ACO algorithm maintains the same reliability (zero ENS) and renewable share; however, it exhibits lower performance in the LCC and energy surplus criteria. This penalty is due to an oversized solution, particularly in the capacity of the battery bank and diesel generator, which unnecessarily increases costs and unused energy.
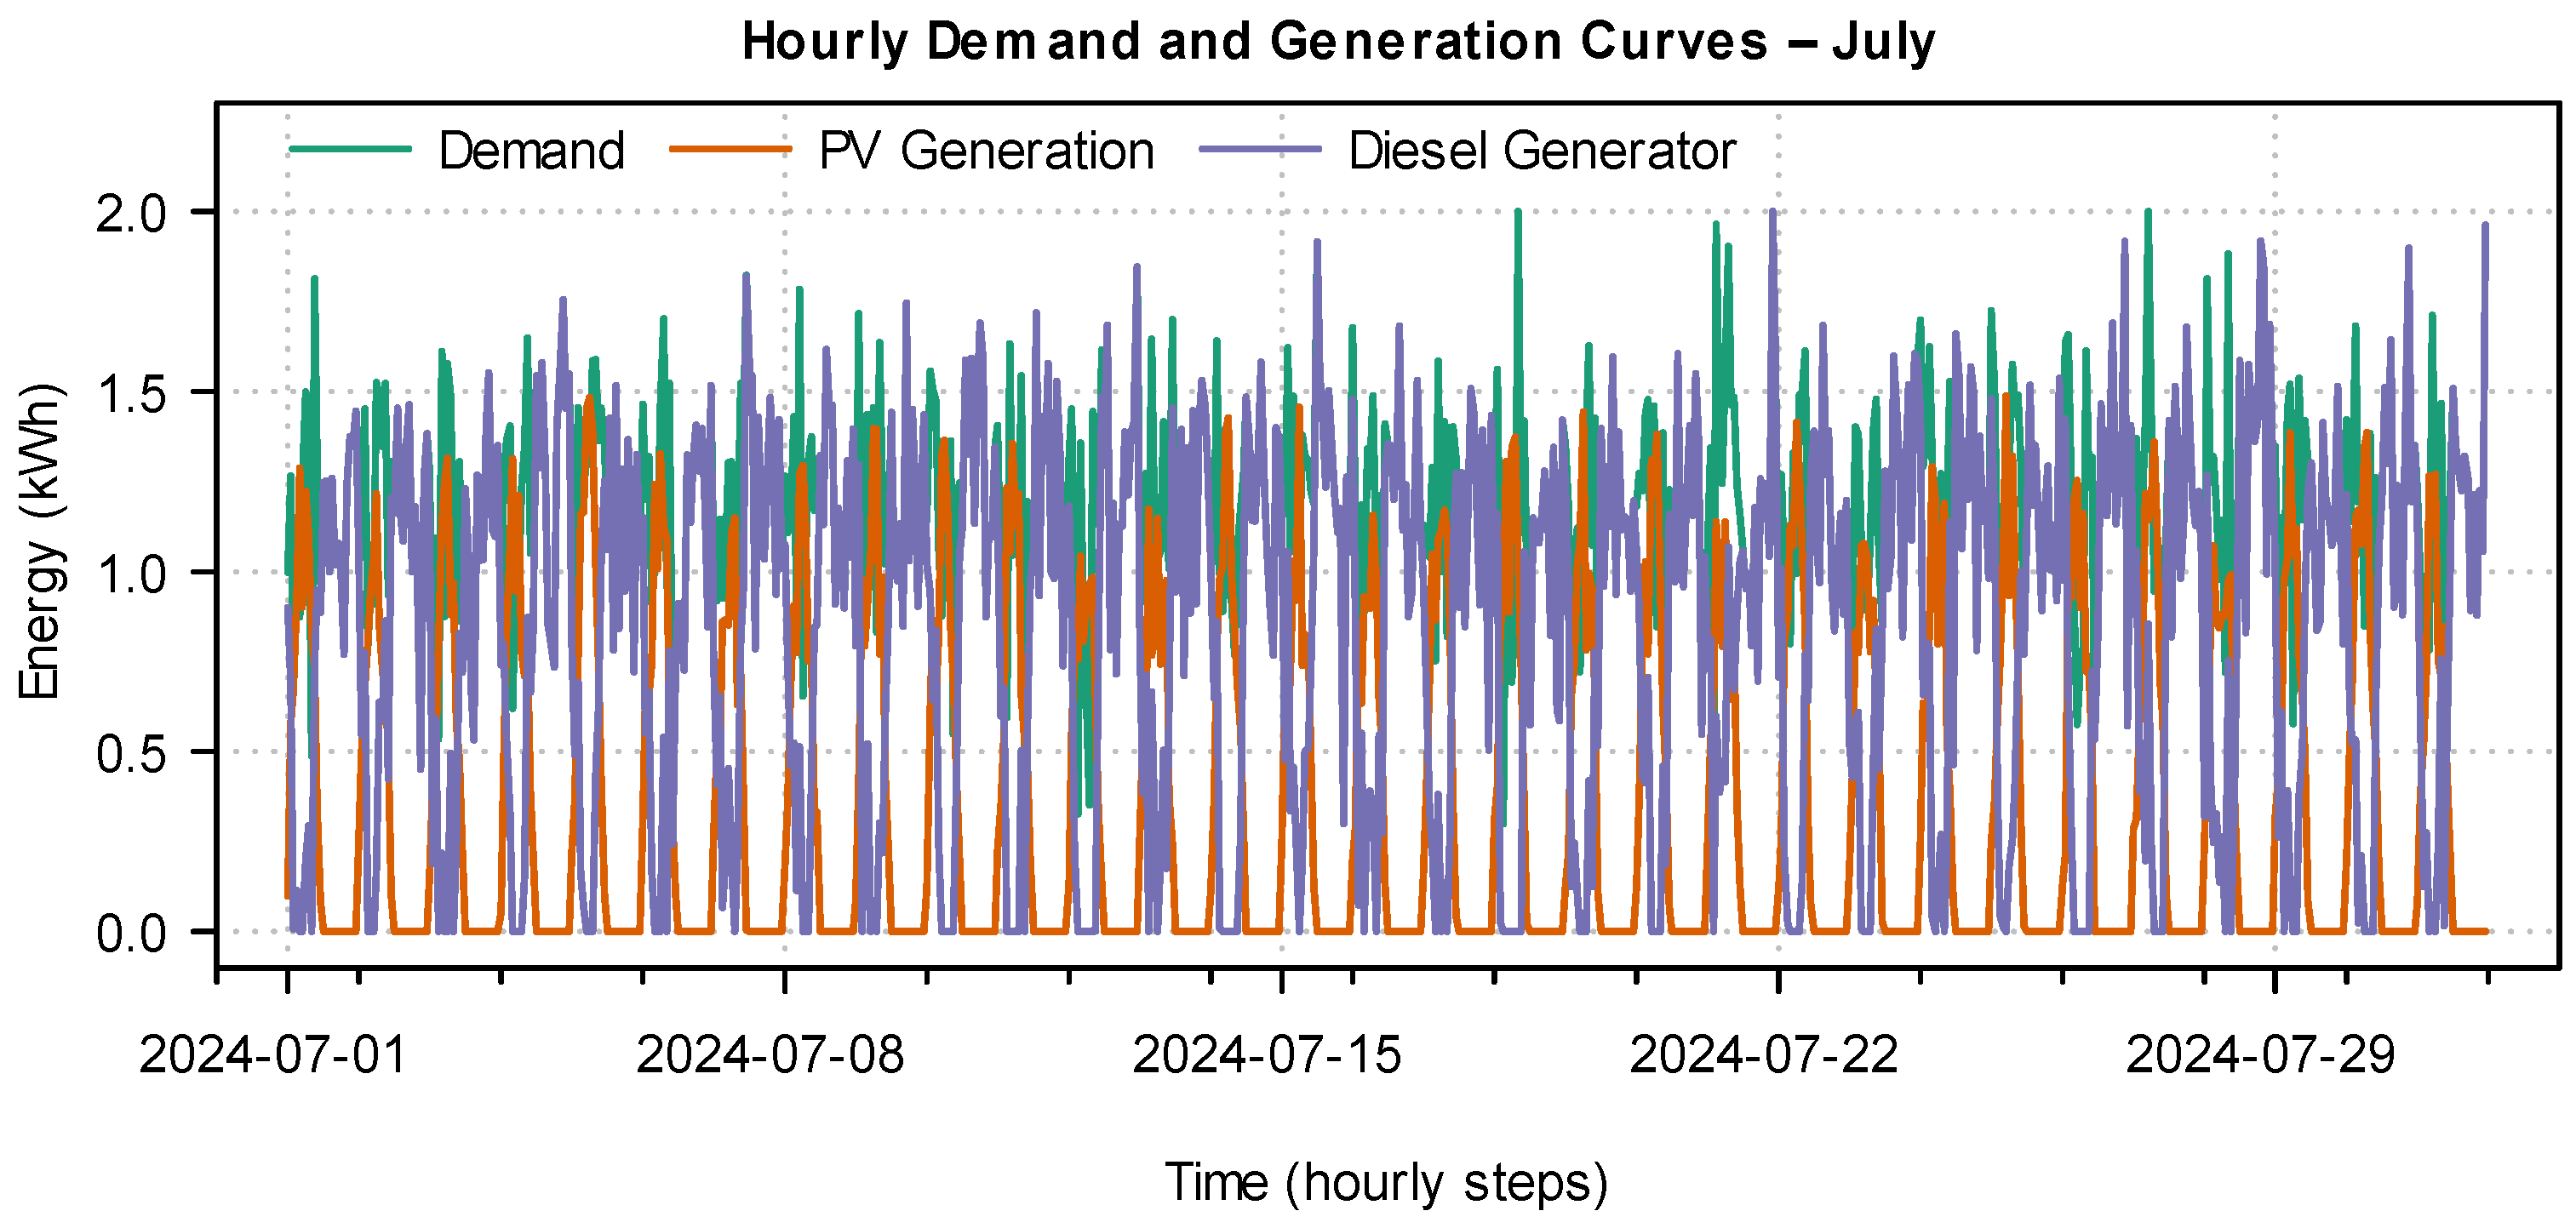
Figure 7 shows the hourly curves for electricity demand, photovoltaic generation, and diesel generator operation during the month of July. Photovoltaic generation follows a regular daily pattern, with production between 6:00 a.m. and 6:00 p.m., reaching its maximum value around midday. Electricity demand remains relatively stable, with slight variations reflecting constant consumption throughout the month. The diesel generator is activated on an ad hoc basis, mainly during nighttime hours or at times when solar generation is insufficient to meet demand and the batteries do not have enough charge. This intermittent operation of the generator highlights the predominantly renewable nature of the system, with fossil fuel serving as an auxiliary backup to ensure continuity of supply.
Figure 8 shows the SOC of the BESS, calculated as the hourly mean for each hour of the day across the entire year. The SOC reaches its peak between 10:00 a.m. and 5:00 p.m. due to maximum PV generation and lower net load and gradually decreases during the evening and night hours. The initial value (at 00:00) and the final value (at 23:00) differ because they represent average values that do not necessarily correspond to a closed daily cycle. The difference is a statistical result of aggregating days with varying demand and generation patterns. The apparent drop after 11:00 p.m. reflects reduced PV input and continued consumption; the curve ends at 23:00 as per the 24 h convention, with the next day beginning again at 00:00.
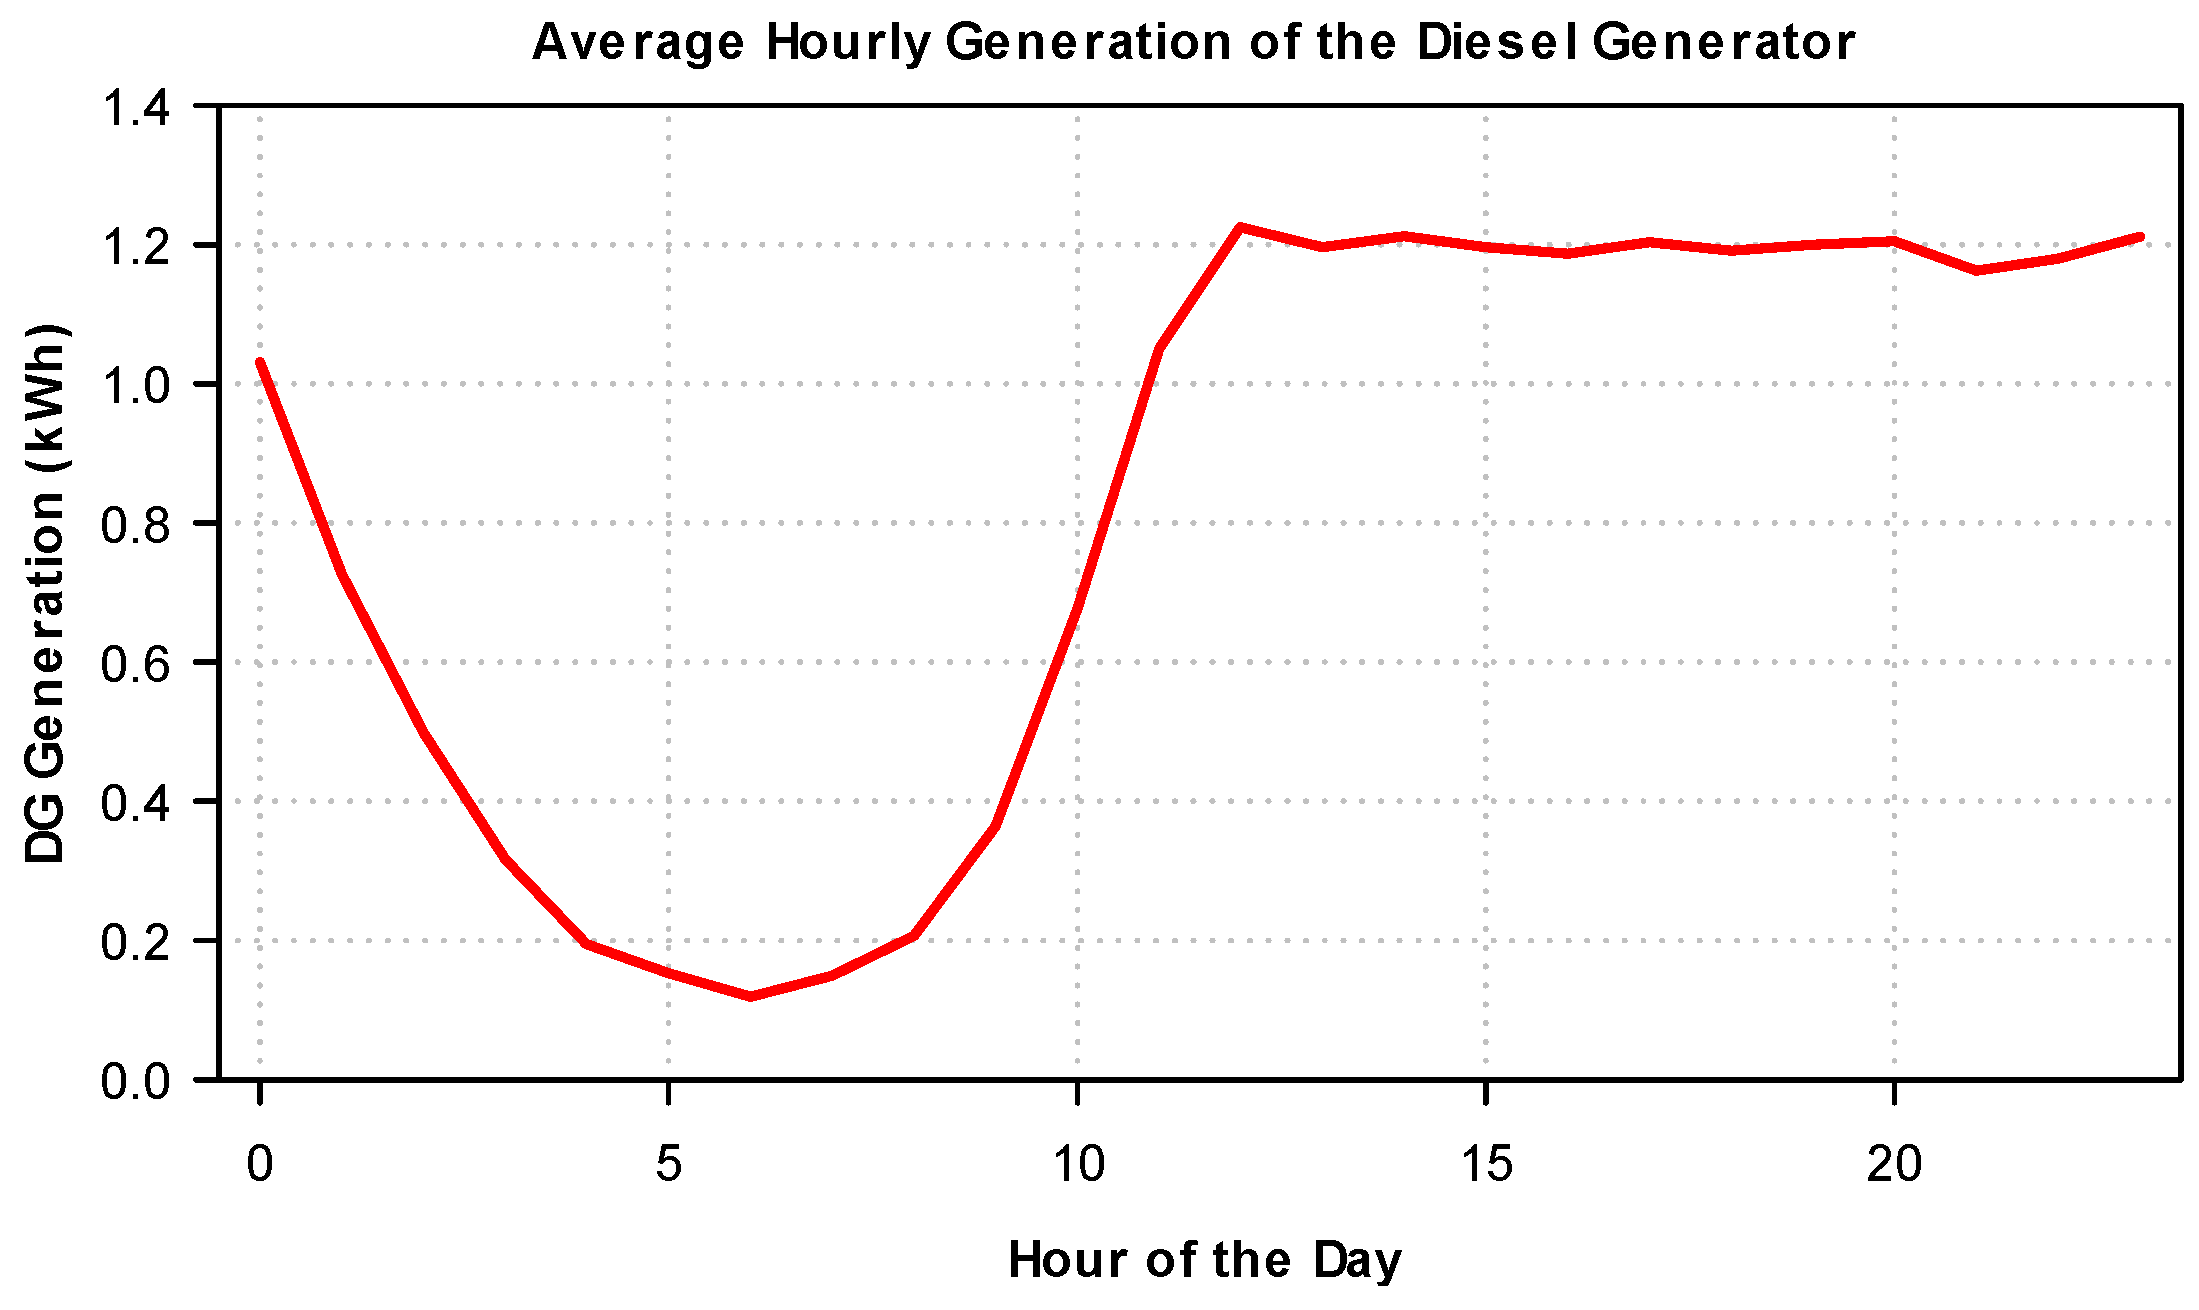
Figure 9 shows the average hourly generation of the diesel generator during the year. Minimal activity is observed between 4:00 and 8:00 a.m., a period that coincides with the peak battery charge resulting from morning photovoltaic generation. From 10:00 a.m. onwards, diesel generation begins to increase progressively, reaching a sustained and high level between 12:00 p.m. and 11:00 p.m. This pattern reflects strategic operation of the generator as a backup source, activated mainly during hours of low irradiance and when the storage system can no longer meet demand. This behavior demonstrates efficient management of fossil resources, aimed at ensuring continuity of energy supply in the absence of solar input. As shown in the figure, part of the battery charging occurs around 4:00 a.m., resulting from the intermittent operation of the diesel generator to maintain a minimum SOC. While this strategy may not be the most energy-efficient, it ensures a reliable electricity supply to critical loads, which is particularly important in remote medical facilities where uninterrupted power is essential.
Figure 10 shows the average hourly energy balance for each month throughout the year. In most months, a positive balance is observed between 5:00 a.m. and 8:00 a.m., coinciding with the onset of photovoltaic generation and moderate demand. However, from 9:00 a.m. to 1:00 p.m., a sharp decline occurs, reaching negative values, particularly in January, June, July, and December. This trend suggests an overlap between peak demand and low solar production, possibly due to adverse weather conditions or reduced seasonal irradiance. During the afternoon and evening, the balance stabilizes at slightly negative or neutral levels, which indicates greater reliance on the storage system or the diesel generator to meet unmet demand. This behavior highlights the importance of implementing differentiated backup and energy management strategies that are adapted to seasonal conditions.
Table 7 summarizes the life cycle cost (LCC) results obtained in 10 independent runs for each optimization algorithm. Both the genetic algorithm (GA) and the particle swarm optimization (PSO) algorithm showed high stability in their results, with LCC values fluctuating within a narrow range between USD 10,000 and USD 10,250. This low dispersion demonstrates consistent and reproducible convergence under the same initial conditions, reinforcing their reliability for energy optimization problems. On the other hand, the ant colony optimization (ACO) algorithm presented significantly higher LCC values, between USD 25,980 and USD 26,200, along with greater variability between runs. This trend suggests a tendency of ACO to oversize certain components of the system, prioritizing operational reliability even at the expense of economic efficiency.
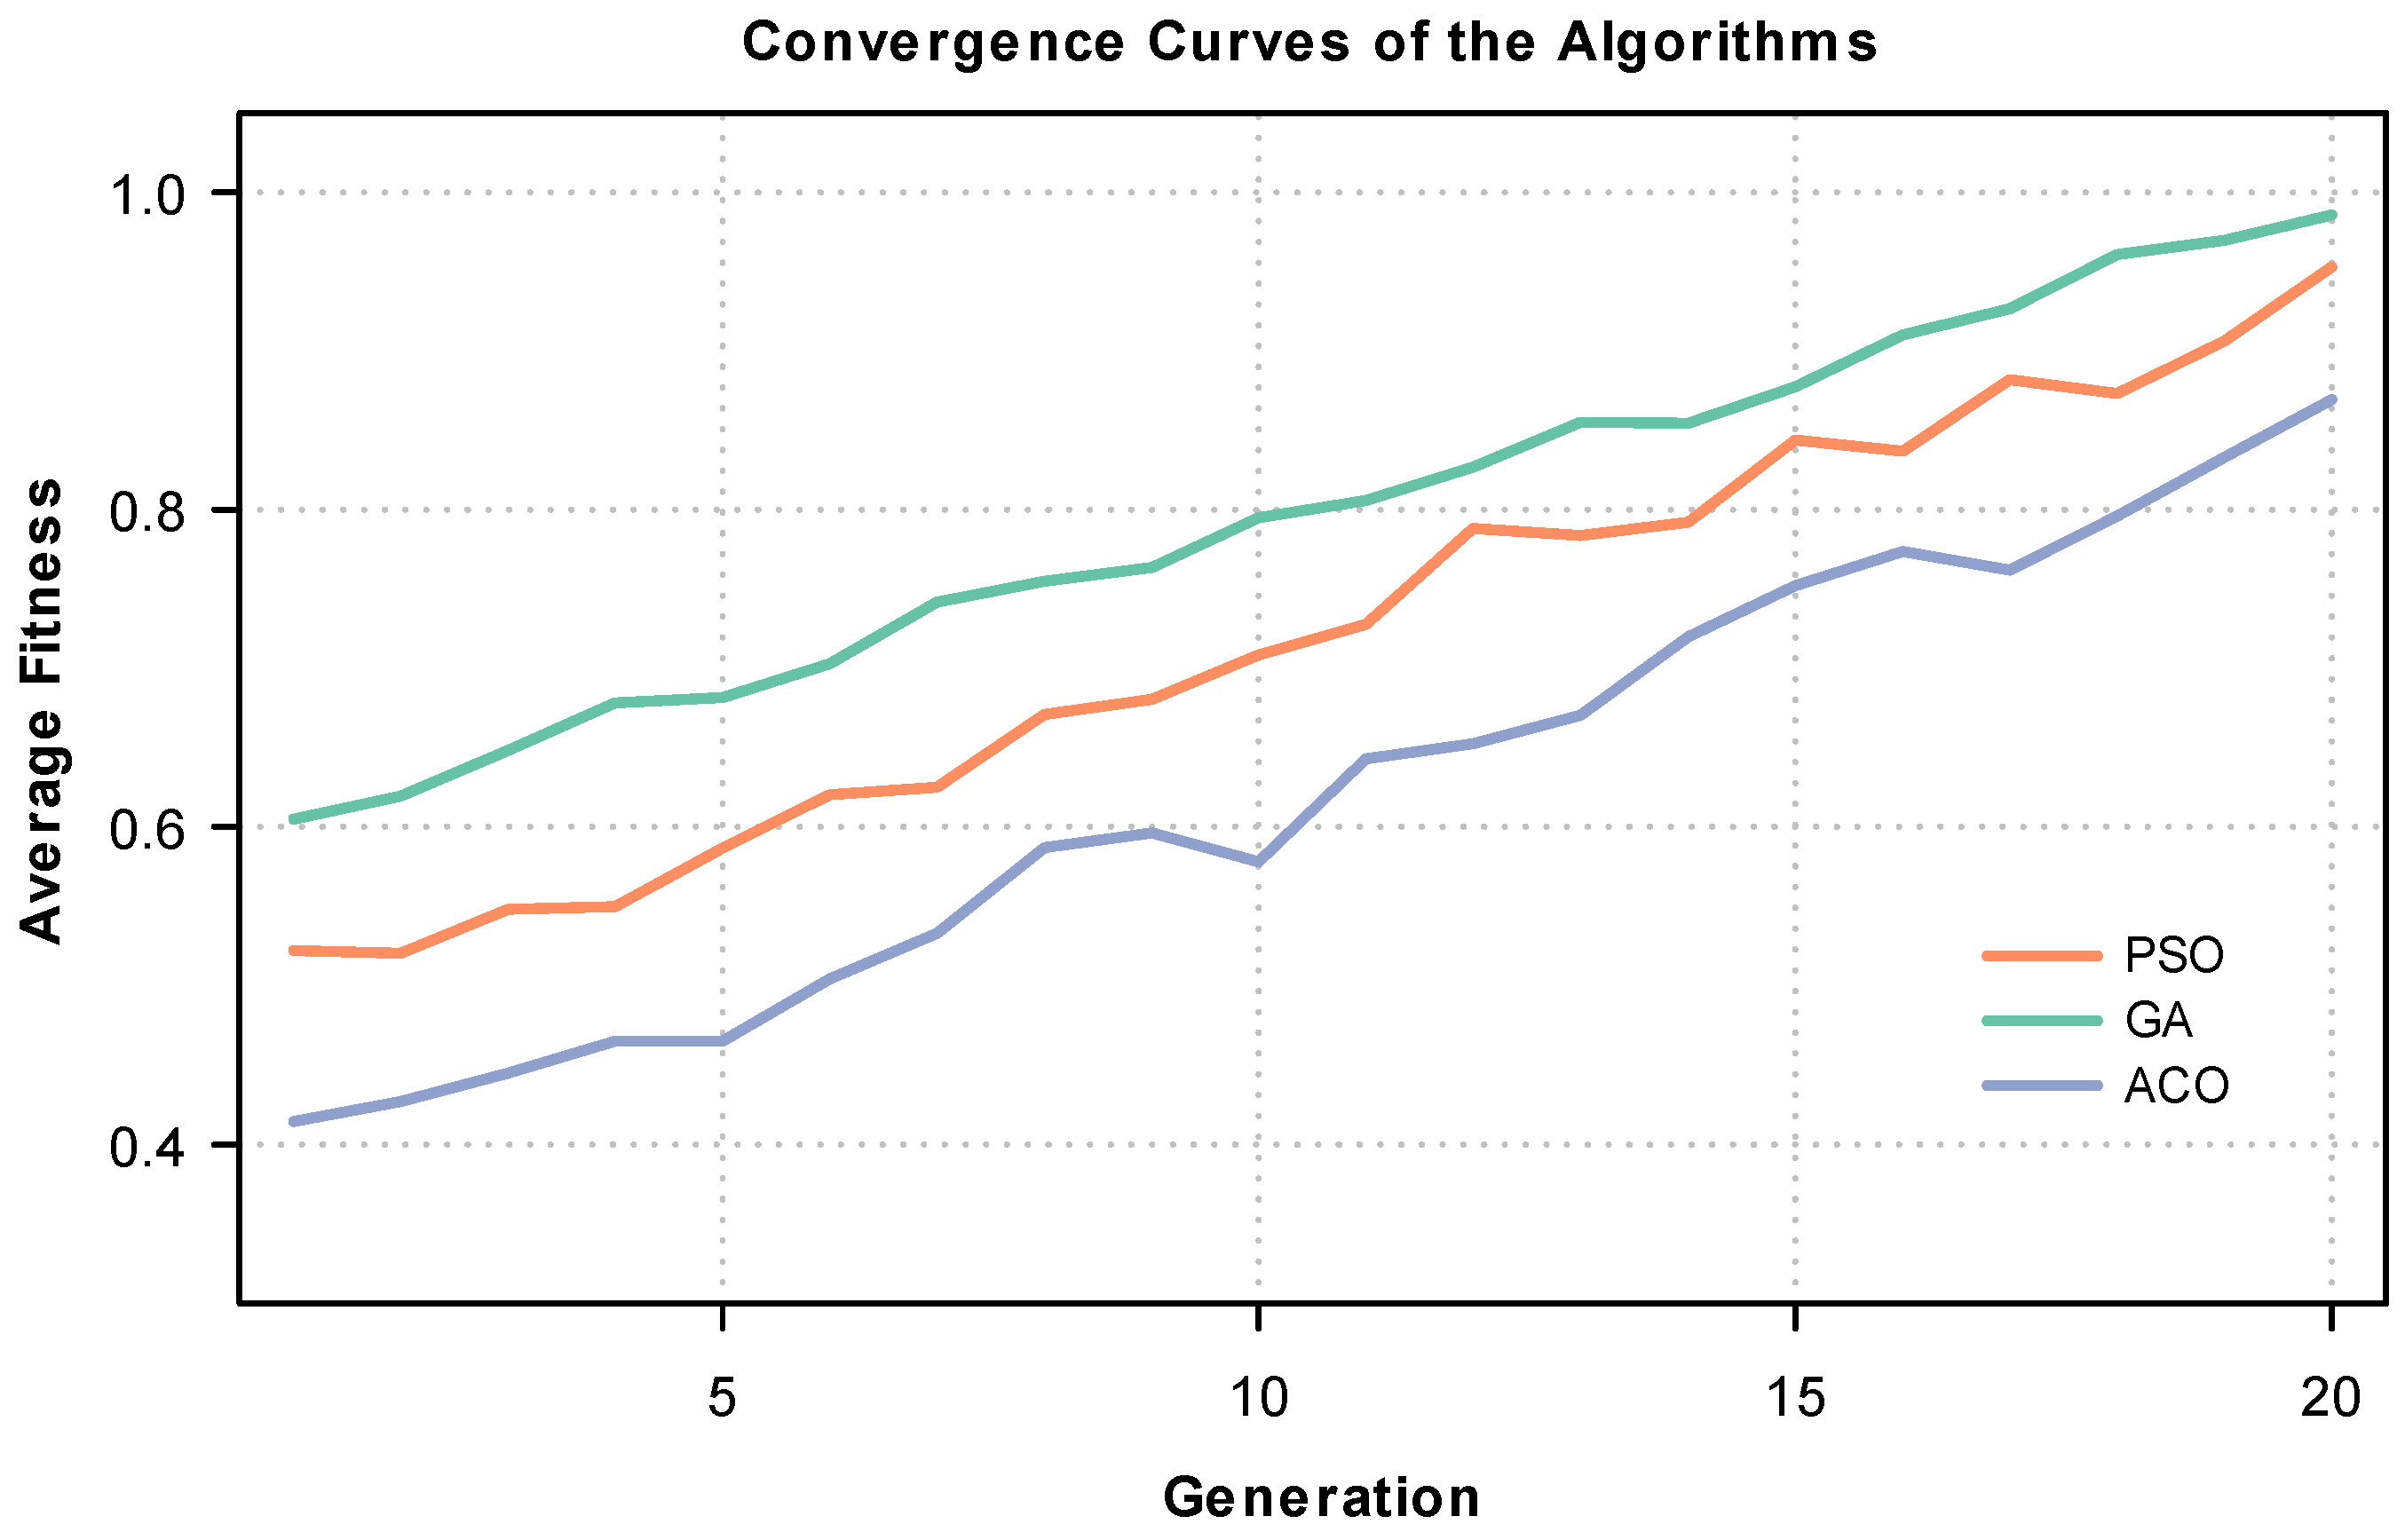
Figure 11 shows the evolution of the average fitness value for the GA, PSO, and ACO algorithms over 20 generations. The genetic algorithm (GA) exhibits the best convergence, reaching the highest fitness values with the least variability, which shows greater efficiency and stability in the search for optimal solutions. In the case of PSO, it also shows an upward trend, although with greater dispersion in its intermediate results. In contrast, ACO converges with lower values and exhibits greater fluctuations, showing a lower exploration capacity under the evaluation conditions proposed.
Table 8 presents the average values of the Jaccard index obtained when comparing the sets of optimal solutions generated in multiple independent runs of each algorithm. The PSO algorithm achieved the highest average value (0.5148), followed by GA (0.4593), while ACO obtained the lowest value (0.2926). These results indicate that PSO and GA tend to converge towards similar solutions in different runs, showing greater stability and consistency in their search processes. In contrast, ACO shows greater dispersion between runs, implying less robustness to variations in initial conditions or randomness in the process.
Table 9 presents the results of the global sensitivity analysis performed using the Morris method, expressed in terms of the absolute mean of the elementary effects (μ) and their dispersion (σ)*. This approach allows the relative influence of each criterion on the response of the GA optimization model to be identified. The results show that the criterion with the greatest influence is Non-Supplied Energy (NSE), with a value of μ* = 0.92 and a dispersion σ = 0.25, indicating a high sensitivity of the model to variations in this parameter. This is followed by Life Cycle Cost (LCC), with μ* = 0.75 and σ = 0.15, confirming its relevance in the decision-making process for the optimal system. On the other hand, the Renewable Share and Excess Energy criteria have significantly lower influence values (μ* = 0.34 and 0.45, respectively), with low dispersion, implying a more limited and stable impact on the model’s response.
Sensitivity analysis using the Sobol method allows the variance of the model to be broken down into contributions attributable to each criterion (
Table 10), where the first-order index (Si) represents the direct effect of a criterion on the output of the GA model, while the total order index (STi) incorporates both direct effects and interactions with other criteria. In this context, the results show that the ENS criterion has the greatest influence at both the individual and total levels (Si = 0.81, STi = 0.89), followed by the LCC criterion (Si = 0.68, STi = 0.75). In contrast, the Renewable Share and Excess Energy criteria show significantly lower sensitivity (Si < 0.45), implying a reduced influence and a limited degree of interaction with other factors.
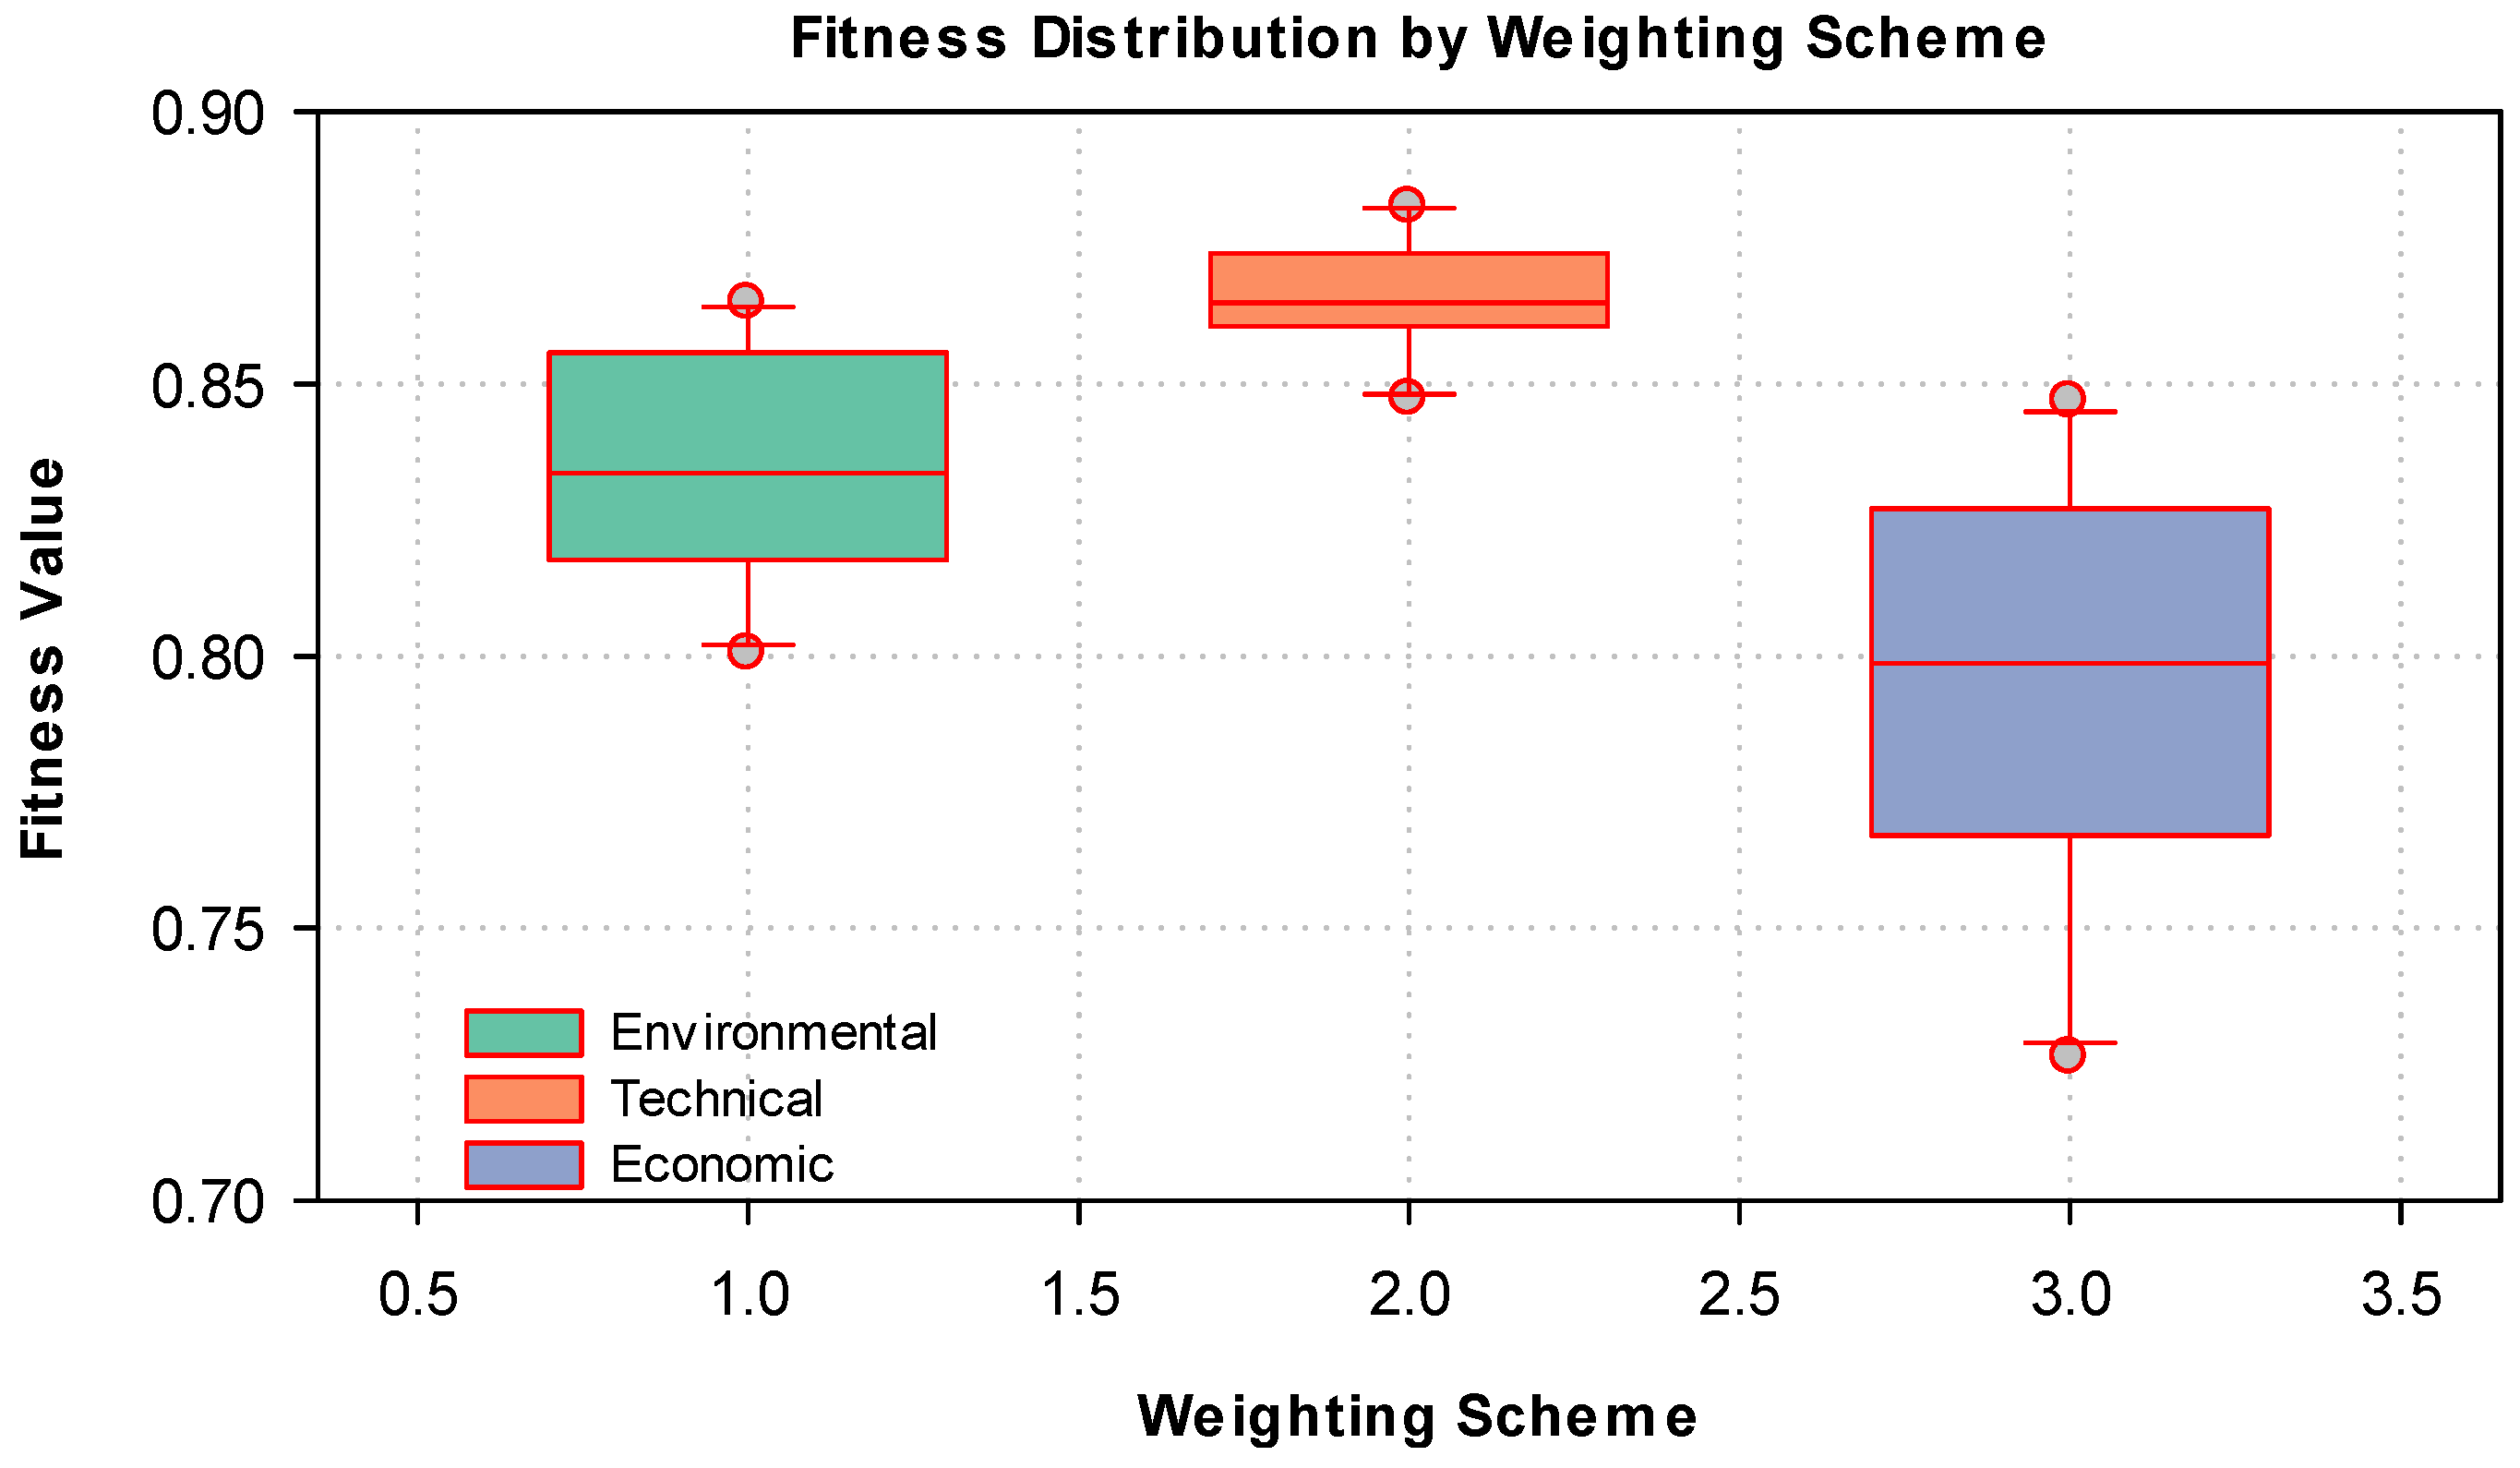
To evaluate the impact of weighting schemes on the performance of the genetic algorithm, three approaches were considered: environmental, technical, and economic. As shown in
Table 11, the technical scheme obtained the highest average fitness (0.78814), the lowest standard deviation (0.01133), and the lowest average range (1.2), which shows more consistent behavior and superior performance in the executions. In comparison, the environmental scheme showed a lower average fitness (0.758961) and greater dispersion in the results (average range of 2.7), while the economic scheme presented the greatest variability, with a standard deviation of 0.020347, implying less stability in the results obtained under this approach.
These findings are consistent with the results shown in
Figure 12, which shows the distribution of fitness values for each weighting scheme of the GA. The technical scheme presents a compact box centered on high fitness values, demonstrating high stability and efficiency in the results. Similarly, the economic scheme presents greater dispersion and the presence of extreme values, which implies less robustness in uncertain conditions. Therefore, the technical scheme offers the best compromise between performance and stability, being the most suitable approach for applications that require high reliability in system optimization. The results obtained in this study reaffirm the effectiveness of metaheuristic algorithms for the optimal design of hybrid microgrids in critical rural environments. In particular, the GA showed superior performance compared to PSO and ACO in terms of system efficiency, stability, and operational reliability. Through annual simulations, GA managed to minimize LCC while maintaining a high renewable share (64.04%) and zero ENS. This performance is consistent with the findings of [
20], who showed that metaheuristic algorithms can solve nonlinear and multivariable problems with reduced computation times and stable solutions.
Likewise, the consistency observed in independent GA runs, reflected in a low range of variability and an average similarity index (Jaccard) of 0.86, implies a high capacity of the algorithm to converge towards robust solutions even under stochastic conditions. This behavior is in line with that reported by [
21], where PSO achieved a significant improvement in the dynamic stability of HESS. Furthermore, the good performance of GA compared to ACO confirms previous observations by [
23], who identified greater robustness and less stress on energy components when using more adaptive and accurate algorithms.
In operational terms, the proposed optimal solution, which includes 20 photovoltaic modules, a 40 kWh storage bank, and a 2 kW diesel generator, demonstrates that it is possible to efficiently meet the energy demand of a rural medical center with a compact and low-cost infrastructure. This result contributes directly to the goal of reducing diesel dependence and associated logistics costs, as proposed in the studies by [
6,
8], where well-sized hybrid systems were shown to improve energy resilience in isolated areas.
Furthermore, the model’s ability to ensure continuous supply by prioritizing critical loads addresses one of the gaps identified in the literature, namely the lack of attention to operational criticality in rural healthcare settings [
10,
11]. The inclusion of this approach ensures the operation of essential medical equipment even in the event of failures or adverse weather conditions, which represents a significant improvement over models focused solely on general economic or technical criteria.
Finally, the superiority of the GA is supported by performance metrics such as LCC, ENS, and renewable share, as well as its behavior under sensitivity analysis, where it showed greater stability in the face of variations in the weighting criteria. This is essential in high Andean contexts with high climate variability and budget constraints, confirming the need for adaptive, robust, and low-operating-cost solutions [
12,
24]. Therefore, the findings reinforce the relevance of the metaheuristic approach to addressing energy design challenges in rural areas of Peru and open new opportunities for the implementation of sustainable hybrid systems in hard-to-reach medical centers.
