Article

A Trustworthy Dataset for APT Intelligence with an Auto-Annotation Framework

1
College of Computer Science, Beijing Information Science and Technology University, Beijing 102206, China
2
Institute of Intelligent Information Processing, Beijing Information Science and Technology University, Beijing 102206, China
*
Author to whom correspondence should be addressed.
Electronics 2025, 14(16), 3251; https://doi.org/10.3390/electronics14163251
Submission received: 10 July 2025 / Revised: 7 August 2025 / Accepted: 13 August 2025 / Published: 15 August 2025
(This article belongs to the Special Issue Advances in Information Processing and Network Security)

Abstract

Advanced Persistent Threats (APTs) pose significant cybersecurity challenges due to their multi-stage complexity. Knowledge graphs (KGs) effectively model APT attack processes through node-link architectures; however, the scarcity of high-quality, annotated datasets limits research progress. The primary challenge lies in balancing annotation cost and quality, particularly due to the lack of quality assessment methods for graph annotation data. This study addresses these issues by extending existing APT ontology definitions and developing a dynamic, trustworthy annotation framework for APT knowledge graphs. The framework introduces a self-verification mechanism utilizing large language model (LLM) annotation consistency and establishes a comprehensive graph data metric system for problem localization in annotated data. This metric system, based on structural properties, logical consistency, and APT attack chain characteristics, comprehensively evaluates annotation quality across representation, syntax semantics, and topological structure. Experimental results show that this framework significantly reduces annotation costs while maintaining quality. Using this framework, we constructed LAPTKG, a reliable dataset containing over 10,000 entities and relations. Baseline evaluations show substantial improvements in entity and relation extraction performance after metric correction, validating the framework’s effectiveness in reliable APT knowledge graph dataset construction.

1. Introduction

Network security defense has traditionally relied on analyzing direct structured data such as traffic and logs. These methods can directly identify behavioral characteristics and reveal the identities of attackers and the techniques used in attacks. However, such approaches typically target attacks that have already occurred or are currently in progress [1], lacking forward-looking and comprehensive information. This limitation is particularly evident in complex Advanced Persistent Threat (APT) scenarios.
With the rise of proactive defense concepts, analyzing indirect intelligence from unstructured textual sources can effectively reduce the information gap between attackers and defenders [2], enabling cybersecurity practitioners to conduct more proactive early warning and defense. In the current CTI (cyber threat intelligence) analysis domain, entity extraction and relation extraction methods based on deep learning are becoming increasingly active. The extracted entities and relations can be used to construct large-scale cyber threat intelligence knowledge graphs (semantic networks composed of multiple triplets <head entity, relation, tail entity>, which integrate heterogeneous threat intelligence data through type definitions of different entities and relations). Particularly in the APT domain, these knowledge graphs can intuitively show behavioral patterns and potential associations. This characteristic gives APT knowledge graphs unique advantages in threat attribution and profiling. Specifically, in threat attribution, we need to conduct a forensic analysis based on different entity–relation–entity triplet paths. In threat profiling, we utilize a group’s habitual attack paths and methods to further analyze their attack habits and characteristics. Furthermore, with the rapid development of large language models, high-quality knowledge graphs can effectively mitigate their hallucination problems and enhance their interpretability.
However, since current methods are primarily implemented through data-driven deep learning models, data quality issues become particularly critical. Comprehensive APT ontology definitions and high-quality entity relationship datasets are notably scarce, which limits research and development in this field. The high cost and quality control challenges of manual data annotation create the primary bottlenecks. This paper summarizes three key challenges facing current APT attack dataset construction: Q1: Current mainstream approaches still rely primarily on manual annotation with low automation levels. Manual annotation not only generates high labor costs but also introduces systematic cognitive biases among annotators. Q2: Current evaluation methods for annotated data rely on model training and lack intuitive and effective metrics. Q3: The entity–relationship ontologies defined in existing research inadequately describe the complex scenarios of APT attacks.
To address these challenges, this paper extends existing ontological definitions and breaks through fixed triplet constraints (head entity type, relation type, tail entity type) to more authentically reproduce APT attack scenarios. We develop an iterative trustworthy annotation framework that combines automated workflows with the complementary strengths of LLMs’ stable knowledge and human experts’ disambiguation capabilities. This framework incorporates quantitative metrics to achieve dynamic quality control over multi-source intelligence annotation.
The main contributions of this paper are as follows:
For Q1, we propose a dynamic trustworthy annotation framework for APT knowledge graphs that introduces LLMs through self-verification mechanisms to perform annotation, improving annotation efficiency while ensuring stable annotation quality. This framework effectively addresses the challenges of manual annotation (proposed in Section 3, validated in Section 4.3).
For Q2, we develop a quantitative measurement system that evaluates annotation data quality from three dimensions: structural, consistency, and APT characteristics. This quantitative approach effectively addresses the issues of limited evaluation methods and insufficient interpretability (proposed in Section 3.3, validated in Section 4.4).
For Q3, we develop an enhanced APT knowledge ontology that incorporates expanded attack entities and semantic relationships from existing research. We then apply the proposed annotation framework to construct the LAPTKG dataset, which contains over 10,000 entities and relations (proposed in Section 3.1.1, validated in Section 4.6).
The remaining sections are structured as follows. Section 2 introduces related work on threat intelligence. Section 3 presents the LLM-based dynamic trustworthy annotation framework for APT knowledge graphs. Section 4 conducts experimental validation. Section 5 summarizes the research methodology. Section 6 discusses future work.

2. Related Work

To thoroughly investigate the dataset construction process of current works, this paper reviews knowledge graph research in the CTI field in recent years. The analysis reveals that although current studies generally construct datasets independently, publicly available datasets are virtually nonexistent. Meanwhile, the ontology structures defined in current research fail comprehensively to describe APT attack processes. This is particularly evident in joint extraction models [3,4], where ontology structures are notably oversimplified. Some studies [5,6] define only a limited number of unique triplet types. Therefore, this paper extends existing APT ontology definitions.
Furthermore, we investigate current approaches for data annotation and quality assessment, as shown in Table 1. Current research primarily relies on manual annotation methods and lacks efficient quality assessment methods. This section discusses these issues from two perspectives: automated annotation patterns and data quality assessment.

2.1. Automated Annotation Methods

Although automated technologies have unique advantages in handling complex data structures [26], manual data annotation remains the most reliable strategy in current CTI graph-related research. However, to achieve a balance between cost reduction, efficiency improvement, and annotation quality, some studies have attempted to explore annotation patterns assisted by automated modules. Several studies employ different automated annotation methods tailored to specific tasks. For example, ref. [27] applies the spaCy library for Named Entity Recognition (NER) tasks, whereas [14] adopts distant supervision methods for RE. Other research utilizes automated tools to improve annotation efficiency, such as [20] using Knuth–Morris–Pratt (KMP, a fast string-matching algorithm [28]) and ref. [29] employing IBM Watson Natural Language Processing (NLP) services. Nevertheless, these studies commonly face the challenge of imbalanced efficiency and quality. This research leverages the advantages of large language models (LLMs) and combines them with a metric system to implement a trustworthy dynamic annotation process primarily driven by automated modules.

2.2. CTI Data Quality Assessment

Current discussions on CTI data quality primarily focus on quality judgment during CTI sharing. Shared CTI refers to intelligence transferred between organizations or institutions through established standards (such as STIX). Therefore, such assessment methods typically conduct subjective and objective quality evaluations around standard fields and intelligence content. For example, ref. [30] employs hierarchical subjective and objective measurements based on attribute–object–report structures. Ref. [31] designs a consensus framework for the subjective evaluation of CTI. Ref. [32] proposes a systematic methodology for developing CTI quality assessment metrics, including relevance metrics for unstructured CTI and weighted completeness metrics for structured CTI. Additionally, ref. [33] utilizes Jaccard similarity coefficients to validate the similarity between keywords extracted by models and those extracted by experts.
However, quality assessment methods for knowledge graph data remain insufficient. In particular, current evaluation methods rely predominantly on deep learning, which inherently limits their interpretability and transferability. These methods are mainly divided into baseline model evaluation and knowledge embedding representation evaluation [21,22]. The former suffers from the restricted learning capabilities of general baseline models, while the latter conducts quality evaluation by training knowledge embedding representations and completion models. This approach also suffers from dependency on dataset quality and lacks interpretability in final evaluation results.

3. Methodology

This section proposes an APT graph dynamic trustworthy annotation framework, as shown in Figure 1. The framework defines three stages: pre-annotation, ongoing annotation, and post-annotation. The pre-annotation stage involves data preparation, while the ongoing annotation stage includes pilot and formal annotation using an automated dynamic workflow with stage-specific objectives.
The pilot annotation evaluates small batches (e.g., 100 instances) using density and coverage metrics, dynamically adjusting ontology and prompt templates based on results. We conduct large-scale annotation in the formal phase (e.g., 500 instances per batch) using refined ontology and prompts from the pilot phase. The evaluation employs category balance, granularity consistency, and attack chain rationality metrics. Expert groups conduct error correction and adjustments to annotation data based on evaluation results. Finally, traditional baseline models provide supplementary validation.

3.1. Pre-Annotation Preparation

3.1.1. APT Dual-Layer Ontology

In defining the ontology, we designed a dual-layer structure (Table 2) to express attack implementation processes and impacts. We observed that APT intelligence typically centers on attackers as the primary actors, targets as objects, and tools or methods as supplements. Therefore, we categorize entities into Threat initiator, Asset, and Implication. Threat initiators focus on attacker descriptions, while Asset and Implication primarily concern attack targets. For relationship definitions, we employ fundamental semantics as the top-level design, divided into Base Relations, Operation, Traceability, and Extension. We emphasize active and passive semantic expressions to strengthen relationship modeling.
Compared to current research, our approach not only encompasses the main foundational entity types [18] but also extends entity types to capture APT attack details [10]. Regarding relationships, existing relation extraction studies [6,23] employ fixed triplet structures that, while improving recognition performance, create a significant gap with real-world application scenarios.
To further investigate overlapping entities and overlapping triplets, we allow Attack-Pattern entities to overlap with other entities and emphasize the continuity of APT attacks (i.e., overlapping triplets) in our relation annotation.

3.1.2. Trusted Data Collection

This paper extensively collects unstructured threat intelligence data. Among these sources, threat intelligence compiled on the ATT&CK official website is widely used due to its high-density attack activities. Additionally, to simulate real-time extraction of the latest threat technique reports, we crawled data from multiple renowned threat intelligence vendors such as Kaspersky. Beyond ensuring data source credibility, we also employ automated crawling scripts and models for efficient collection, as shown in Figure 2. During data crawling, we specifically addressed real-time page response handling and processing of different content types. For data cleaning, we utilized spaCy library pre-trained models for sentence segmentation and applied regular expressions to replace non-semantic information (such as file paths, MD5 hashes, etc.).

3.2. Dynamic Trustworthy Annotation Process

This paper improves efficiency through automated annotation processes during the ongoing annotation stage while ensuring data quality trustworthiness through quantitative metrics and dynamic annotation–evaluation–correction cycles. We introduce LLMs to reduce manual costs and leverage their knowledge bases for stable annotation quality.
We employ a triple verification mechanism: model self-verification evaluation, predefined validation matrices, and expert review discussions. Self-verification combines the rapid response of non-reasoning models with the deliberative advantages of reasoning models. Expert teams adopt a dynamic process involving individual review, peer review, group discussion, and team leader validation. This mechanism effectively reduces subtask error propagation caused by semantic understanding errors and specialized knowledge gaps.
After each annotation batch, we rapidly assess data quality through a quantitative metric system. Senior experts then promptly correct annotation issues or adjust annotation guidelines.

3.3. Annotation Quality Quantitative Indicator System

To intuitively evaluate the annotation data of APT graphs and mitigate existing issues, this paper develops a multi-level quantitative indicator system, as shown in Figure 3. The system comprises three levels: basic structural indicators, logical consistency indicators, and attack chain topological indicators. Each level of indicators provides comprehensive evaluation through multiple dimensions.
Among these, the basic structural indicators analyze the overall characteristics of individual batch datasets. Combined with logical consistency indicators, they jointly assess the quality of data application in deep learning models. Meanwhile, the attack chain topological indicators focus more specifically on evaluating the quality of APT attack characteristics.

3.3.1. Basic Structural Indicators

Structural indicators aim to highlight quality issues in datasets through relevant data characteristics, enabling annotators to make timely adjustments and corrections. The main indicators include category density and category distribution balance.
  • Category Density Anomaly Index (CDA)
In automated entity–relation annotation, aside from filtered texts with zero entities or relations, we enhance attention to anomalous instances through the category density indicator. This indicator utilizes normal distribution characteristics, where approximately 95% of data fall within the interval [34]. The anomaly indicator formula is as follows:
C D A e n / r e = 1   i f   ρ i   μ 2 σ ,   μ + 2 σ 0   o t h e r w i s e                                                     ,
where μ and σ represent the mean and standard deviation of entity or relation density for the current batch of sentence sets, respectively. ρ i denotes the entity or relation density (count/length) of the current sentence.
B.
Category Distribution Balance Index (CDB)
To reflect the distribution balance issues of various categories in datasets, we utilize a comprehensive representation combining the Gini coefficient [35] and entropy [36]. This indicator can detect prominent issues (head concentration and long-tail problems) and pseudo-balance problems (as in Section 4.4.1). First, we define the number of entity and relation categories as K e n / r e , the sample count for each category as n K , and the sample proportion for each category as p i = n i N , where the total sample count is N = i = 1 K n i . The main calculation formula is as follows:
C D B e n / r e = N o r m H e n / r e 1 + G e n / r e 0 D B I 0.5
where G e n / r e is the equivalent transformation of the original Gini coefficient, avoiding O N 2 complexity calculations:
i , j | p i p j | = 2 K i = 1 K p i 1 p i G e n / r e = 2 K p i 1 p i 2 N = 1 p i 2 ,
and the normalized entropy is N o r m H = i = 1 K p i l n p i l n K .

3.3.2. Logical Consistency Indicators

The logical consistency of annotation data directly affects model learning performance. This type of indicator can evaluate annotation consistency from a statistical perspective. During the pilot annotation phase, LAC and CCC indicators are preliminarily used to assess the feasibility of the model and ontology. In formal annotation, EAG and TAG indicators are utilized to evaluate and detect errors in document-level representation, syntax, and semantics.
  • LLMs Annotation Consistency (LAC)
To intuitively evaluate the consistency between LLM annotation and human annotation, we adapted Cohen’s Kappa coefficient [37] to assess the existing consistency between large language models and human annotation:
L A C e n / r e = P o e n / r e P e e n / r e 1 P e e n / r e [ −1 , 1 ] ,
where observed agreement ( P o e n / r e [ 0 , 1 ] ) and expected agreement ( P e e n / r e [ 0 , 1 ] ) are represented as follows:
P o = A + D T o t a l , P e = A + B T o t a l A + C T o t a l + B + D T o t a l C + D T o t a l ,
where T o t a l represents the total count of text positions (entities) or entity pairs (relations). A represents the count where both annotators label as “entity or relation exists,” B represents the count where annotator 1 labels as existing while annotator 2 labels as non-existing, C is the opposite of B, and D represents the count where both annotators label as “entity or relation does not exist.” In this context, annotator 1 and annotator 2 refer to two peer-level annotators working on the same samples, where annotator 1 represents model annotations under different prompts and annotator 2 represents manual annotations.
B.
Category Coverage Consistency (CCC)
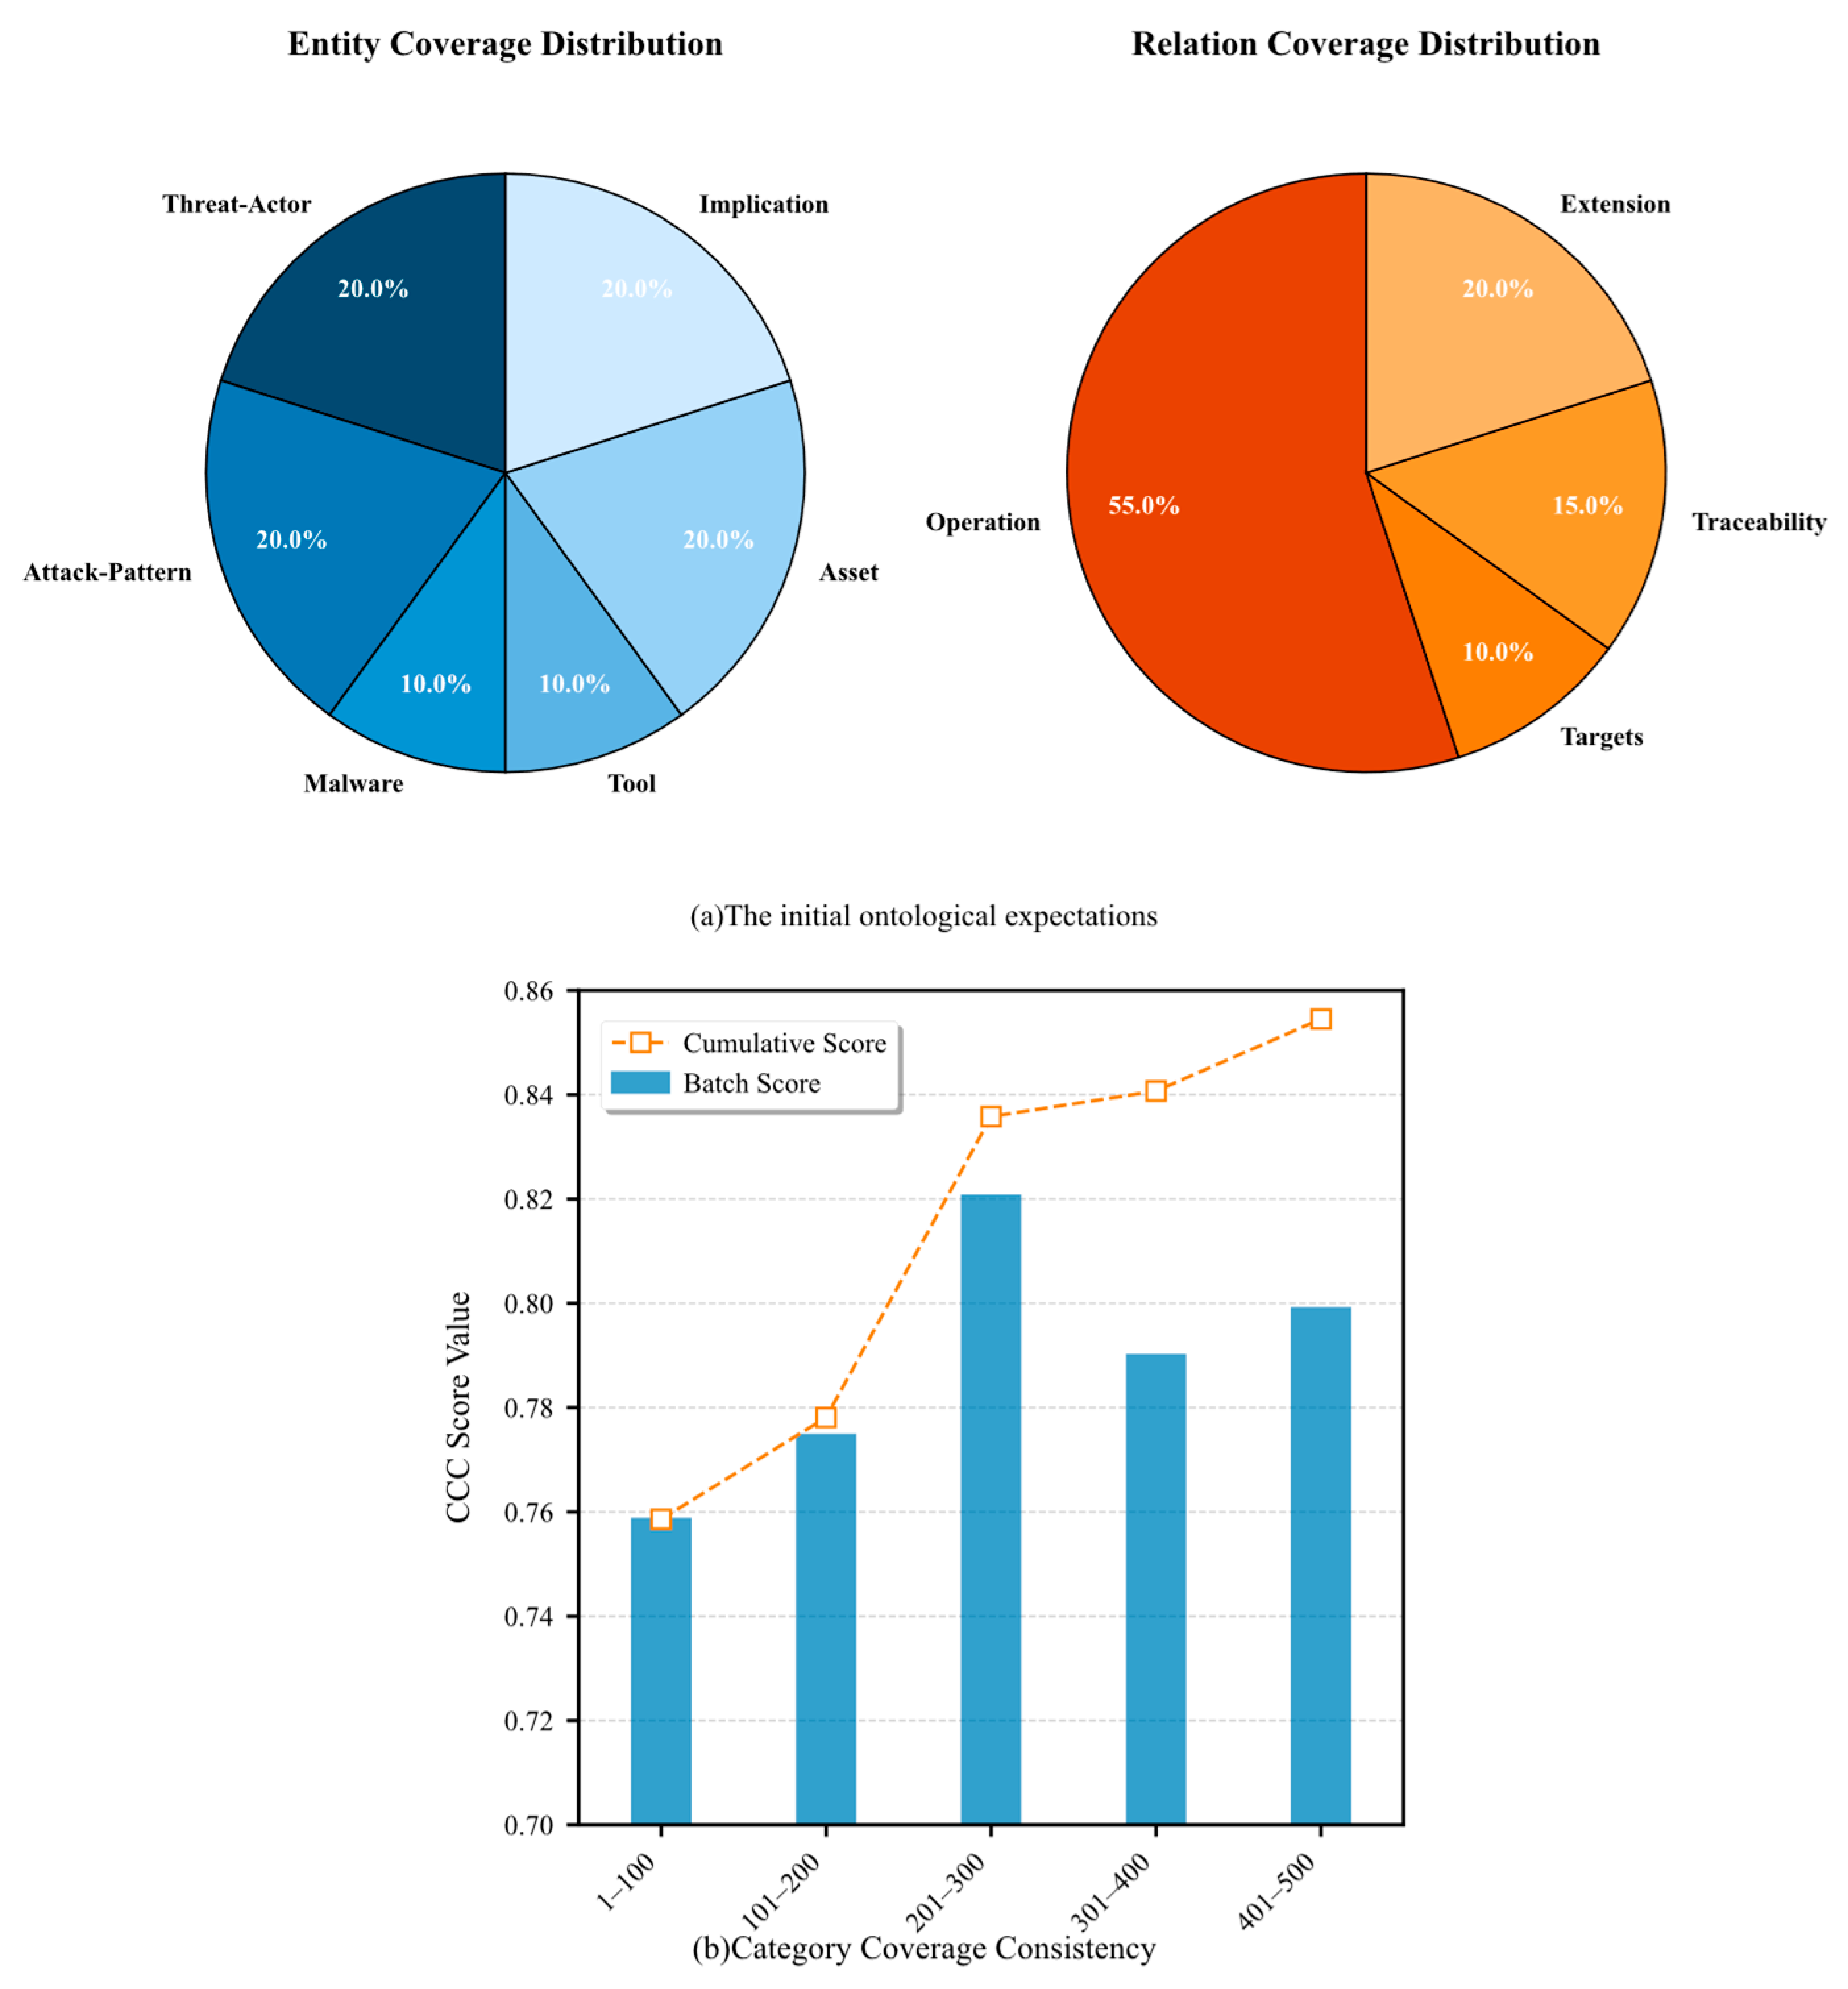
To balance the consistency between annotation data distribution and expected distribution, we define expected weights based on the upper-level ontology for each category in the upper layer, with the lower layer setting minimum restrictions as supplements. The expected weights are shown in Section 4.4.1. The indicator formula is as follows:
S C C C = W a S i m e n + W b S i m r e + W c P K e y [ 0 , 1 ] ,
where the submodule weights sum to i ϵ ( a , b , c ) W i = 1 , P K e y represents the proportion of lower-layer category restrictions that are satisfied, and S i m e n / r e is based on the Hellinger distance [38] to calculate the similarity between the distribution of the upper-layer ontology and the expected distribution in the data:
S i m e n / r e = H w ( P , Q ) = 1 2 i = 1 k w i ( p i q i ) 2 [ 0 , 1 ] ,
where p i represents the actual distribution proportion of the ith category and q i represents the ideal distribution proportion of the ith category. The indicator uses w i = 1 q i 1 + p i q i p i + q i to amplify difference sensitivity for weighting. Normalization is performed through w i = 2 w i j = 1 k w j to ensure the weight w i [ 0 , 1 ] .
C.
Entity Annotation Granularity (EAG)
EAG evaluates annotation consistency across entity categories by integrating representation granularity, contextual semantic similarity, and part-of-speech distribution. The overall formula is as follows:
E A G d a t a s e t = 1 M M ( W a E R G d o c + W b E S G d o c ) ω P O S d o c [ 0 , 1 ] ,
where M represents the number of documents, submodule weights sum to i ϵ ( a , b ) W i = 1 , and E R G d o c , E S G d o c , and ω P O S d o c represent the document-level entity representation, semantic granularity evaluation, and part-of-speech coefficient, respectively.
a. Entity Representation Granularity ( E R G d o c )
E R G d o c = 1 K e n k K e n I l e n e n k T h r e s h o l d e n k N e n k ,
where K e n represents the number of entity categories, I is an indicator function (1 if condition is met, 0 otherwise), and entity granularity l e n e n k for category k falls within T h r e s h o l d e n k μ ¯ e n k ± 2 σ ¯ e n k , where μ ¯ e n k and σ ¯ e n k are based on the mean and standard deviation of entity granularity for each category across all evaluation data.
b. Entity Semantic Granularity ( E S G d o c )
E S G d o c = 1 K e n k K e n i j I ( S i m i j > 0.9 ) C n , 2 ,
where semantic similarity S i m i j is calculated based on secureBERT [39] embedding vector computation:
S i m i j = e i e j e i e j , e i / j = S e c u r e B E R T ( w o r d s i / j ) ,
c. Entity Part-of-Speech Granularity Coefficient ( ω P O S d o c )
The part-of-speech granularity coefficient is jointly determined by the proportional coefficient of nouns (PCoN) and the coverage coefficient of gerunds (CCoG), using stanza [40] for part-of-speech tagging:
ω P O S d o c = P C o N × C C o G ,
where P C o N = 0.8 , n o u n s < 70 % 1 , o t h e r w i s e , C C o G = 0.9 , g e r u n d < 95 % 1 , o t h e r w i s e .
D.
Triples Annotation Granularity (TAG)
Specifically, it evaluates entity spans in the representation component, semantic roles in the syntactic component, and triple phrases in the semantic component. Due to the sparsity of entities and relations in triples, natural language processing based on ontology definitions is required before evaluation. The overall formula is as follows:
T A G d a t a s e t = 1 M M ( W a · T A S d o c + W b · T S y G d o c + W c · T S e G d o c ) ,
where M represents the number of documents in the dataset, submodule weights sum to i ϵ ( a , b , c ) W i = 1 , and T A S d o c , T S y G d o c , and T S e G d o c represent document-level triple representation, syntactic granularity, and semantic granularity evaluation, respectively.
a. Triple Annotation Span ( T A S d o c )
T A S d o c = 1 K t r i p l e k K t r i p l e I s p a n t r i p l e k T h r e s h o l d s p a n k N s p a n k ,
where the span granularity s p a n t r i p l e k for category k triples falls within T h r e s h o l d s p a n k = μ ¯ s p a n k ± α 2 σ ¯ s p a n k , where α represents the sentence complexity factor and μ ¯ s p a n k and σ ¯ s p a n k are the mean and standard deviation of triple granularity for each category based on all evaluation data.
b. Triple Syntactic Granularity ( T S y G d o c )
Since naturalized triples should conform to basic sentence characteristics, they should contain three semantic roles: PRED, ARG0, and ARG1. To ensure consistent evaluation, we strictly define the number and types of semantic roles:
T S y G d o c = 1 N T i = 1 N T I !   P R E D T S i !   A R G 0 T S i A R G 0 P R E D !   A R G 1 T S i A R G 1 P R E D ,
where N T represents the number of triples, T S i represents the ith triple after natural language processing, ! indicates existence and uniqueness, and indicates direct association between semantic roles and predicates.
c. Triple Semantic Granularity ( T S e G d o c )
Triple semantic granularity performs overall evaluation of triple semantics based on the similarity calculation from Formula (11):
T S e G d o c = 1 K T r i p l e k K T r i p l e i j I ( S i m i j > 0.9 ) C n , 2 ,

3.3.3. Attack Chain Topological Indicator

Attack chain topological indicators evaluate the topological structure of document-level knowledge graphs for the multi-stage nature and chain structure of the APT domain. The main approach combines the attack chain depth and structural dispersion penalty for overall evaluation:
A C T = S c o r e a c d × 1 R T P ,
  • Attack Chain Depth Score ( S c o r e a c d )
We traverse attack chains in the document-level annotation data, where the valid attack chain depth set is recorded as d = d 1 , d 2 , , d k . We use the 25th percentile of attack chain depth to filter out excessively short chains as Q25 = Percentile (P, 25%) and calculate the chain strength factor:
β n o r m = t a n h m a x d i Q 25 Q 25 [ 0 , 1 ) ,
We reference the existing attack chain models [41] and our previous three-stage definition [42]. Base weights are set for different depths and continuously adjusted through regression functions:
W a c d = 0.5 × 1 + β , Q 75 2 0.7 × 1 + β , Q 75 = 3 0.8 × 1 + β , Q 75 = 4 1.0 × 1 + β , Q 75 5   0.5 + 0.5 σ 2 Q 75 3 × 1 + β n o r m ,
For convenient calculation and comparison, W a c d is normalized through piecewise linear stretching:
S c o r e a c d = 1 e λ 0 W a c d   L U L [ 0 , 1 ] ,
where λ 0 is the normalization coefficient and L and U are the original upper and lower limit parameters, respectively.
B.
Attack Chain Total Penalty Ratio ( R T P )
Additionally, except for certain entity types that act as head nodes (such as threat organizations), the in-degree and out-degree of chain structures should be relatively balanced. Therefore, we use the in-degree and out-degree Gini coefficient to evaluate the dispersion of chain structures, calculating the penalty value:
P d i v e r g e n c e = m i n ( m a x G o u t , G i n × m i n 1 , N u m r e l a t i o n N u m e n t i t y , 0.6 ) ,
G i n / o u t = i = 1 n j = 1 n | N e i n / o u t , i N e i n / o u t , j | 2 n 2 N e i n / o u t ¯ ,
where N e i n / o u t , i represents the number of times entity i acts as a relation tail or head and N u m r e l a t i o n and N u m e n t i t y represent the number of relations or entities in the document, respectively. Additionally, this indicator systematically accounts for isolated nodes and illegal loop situations by incorporating them into the penalty score P e r r o r , thus calculating the total penalty ratio:
R T P = m i n 0.3 ,   0.15 × P e r r o r λ 1 + 0.15 × P d i v e r g e n c e λ 2 ,
where λ 1 and λ 2 are the normalization coefficients for P e r r o r and P d i v e r g e n c e , respectively.

3.4. Post-Annotation Evaluation

After the overall data annotation is completed, we need to evaluate the annotated dataset as a whole to validate the framework’s effectiveness. The performance of baseline model training on the data provides valuable reference. Therefore, this part employs typical evaluation metrics, specifically including precision, recall, and F1-score for assessment.

4. Experiments

This section validates our dataset construction method and quality from three perspectives. First, we verify the efficiency of the annotation framework. Second, we validate various quantitative indicators. Finally, we provide supplementary validation of the annotation data’s training effectiveness through baseline models.

4.1. Data Collection

We extensively collected open-source report data. Using automated scripts, we extracted a total of 756 reports from ATT&CK and several cybersecurity vendor reports, collecting over 100,000 raw instances. Based on the proposed annotation framework, we annotated 1500 instances each from ATT&CK reports and technical detail reports to validate the framework and construct the foundational dataset.

4.2. Experimental Setup

4.2.1. Model Selection

  • Large Model Selection
This study initially tested four prominent LLMs (Llama3, GPT-4O, KIMI, and Deepseek). We ultimately selected the Deepseek model for automated annotation framework validation based on cost and quality considerations. In our method, Deepseek-V3 performs basic annotation while the Deepseek-R1 model conducts annotation self-verification. Additionally, we designed three prompt templates: joint prompts, pipeline-based key information prompts, and pipeline-based boundary analysis prompts. The boundary analysis prompt template was selected based on experimental results from Section 4.4.1.
B.
Baseline Models
We selected mainstream modules with validated effectiveness to constitute the baseline models for this study. For entity extraction, we employ four architectures: BERT, BERT-BiLSTM-Biaffine, BERT-CRF, and BERT-BiLSTM-CRF. For relation extraction, we use the BERT, BERT-BiLSTM, and BERT-BiLSTM-Biaffine architectures based on the preprocessed dataset.

4.2.2. Parameter Configuration

The experimental objective is to demonstrate the correlation between indicators and various dimensions. Therefore, we perform uniform allocation of sub-dimension weights W i within each indicator i ϵ ( a , b , c , ) W i = 1 .

4.2.3. Experimental Environment

Our evaluation system requires no model training but needs basic model calls. Specifically, the framework employs the Spacy model for sentence segmentation and Stanza for part-of-speech tagging and semantic role labeling. The framework employs SecureBERT for entity and triplet embedding to compute semantic similarity. Additionally, a basic network environment is required for accessing large model APIs. In the baseline model configuration, the BERT model outputs 768-dimensional vectors, while the single-layer LSTM in BiLSTM outputs 128-dimensional vectors. Note that due to space limitations, this paper only presents indicator and baseline experimental results on ATT&CK Groups.

4.3. Annotation Framework Efficiency Validation

To validate the annotation framework’s efficiency, our team was divided into two groups with balanced knowledge levels and tested the cost consumption of two annotation modes on identical data during the pilot annotation phase, as shown in Figure 4. ATT&CK Groups present more complex scenarios than Attack Reports, making annotation more challenging.
In manual annotation, considerable time was wasted filtering low-density samples. Additionally, corrections required re-annotating all data for adjustments, consuming substantial time.
Manual annotation required considerable time to filter low-density samples. Additionally, corrections required re-annotating all data for adjustments, consuming substantial time.
Our annotation framework filtered out 89 instances using the CDA indicator. Due to the sequential nature of framework tasks, model annotation time is negligible. Moreover, manual corrections can be targeted based on document-level indicators, significantly improving validation efficiency. Experiments demonstrate that our proposed annotation framework is more efficient, with only minimal economic costs (approximately 3.8 Chinese yuan per 50 instances).

4.4. Evaluation Indicator Validation

During the ongoing annotation phase, pilot annotation and formal annotation serve different purposes; therefore, the experiment is divided into two parts.

4.4.1. Pilot Annotation Phase Indicator Validation

In the pilot annotation phase, our primary objective is to ensure that the automated models in the framework align with the designed ontological structure as expected. Therefore, we use the LAC indicator to compare the annotation effects of different prompt templates, while CCC and CDB indicators evaluate the degree to which annotation data types conform to expectations.
A.
LAC Indicator Experiment
During the annotation process, we compared the effects of three prompt types across 5 batches of 100 instances each, based on Deepseek-V3. The experimental results are shown in Figure 5.
Experiments demonstrate that LLMs show substantial agreement with human annotators regarding character-level entity identification. However, differences in relation extraction are more pronounced. Joint prompting performs significantly worse than the other two approaches due to length constraints and task complexity. Boundary analysis for confusable types proves more effective than KeyInfo prompts. Additionally, the overall declining trend in relation to extraction performance may result from bias in the initial prompt design, though this does not affect prompt validation.
B.
CCC Indicator Experiment
CCC evaluates the discrepancy between ontological design expectations and actual annotation data; therefore, the experiment compares single-batch and cumulative data. The initial ontological expectations derive from expert experience, as shown in Figure 6a. The CCC indicator experiment, shown in Figure 6b, intuitively reflects the consistency between data proportions in different intervals and expected proportions. As data accumulates, although single-batch data distributions may not conform to expectations, the overall dataset increasingly converges toward expectations.
C.
CDB Indicator Experiment
CDB evaluates the balance of dataset classification across different types, addressing the limitations of the CCC indicator. This section visualizes the indicator through category frequencies for entities and relations (Figure 7). We comprehensively assess dataset category balance by examining category equilibrium and head monopolization. This experiment demonstrates a pseudo-balance scenario, where head categories (top three) do not completely monopolize cumulative data, while categories with similar data volumes are relatively averaged. Additionally, this indicator is more sensitive to extremely imbalanced scenarios such as long-tail distributions.

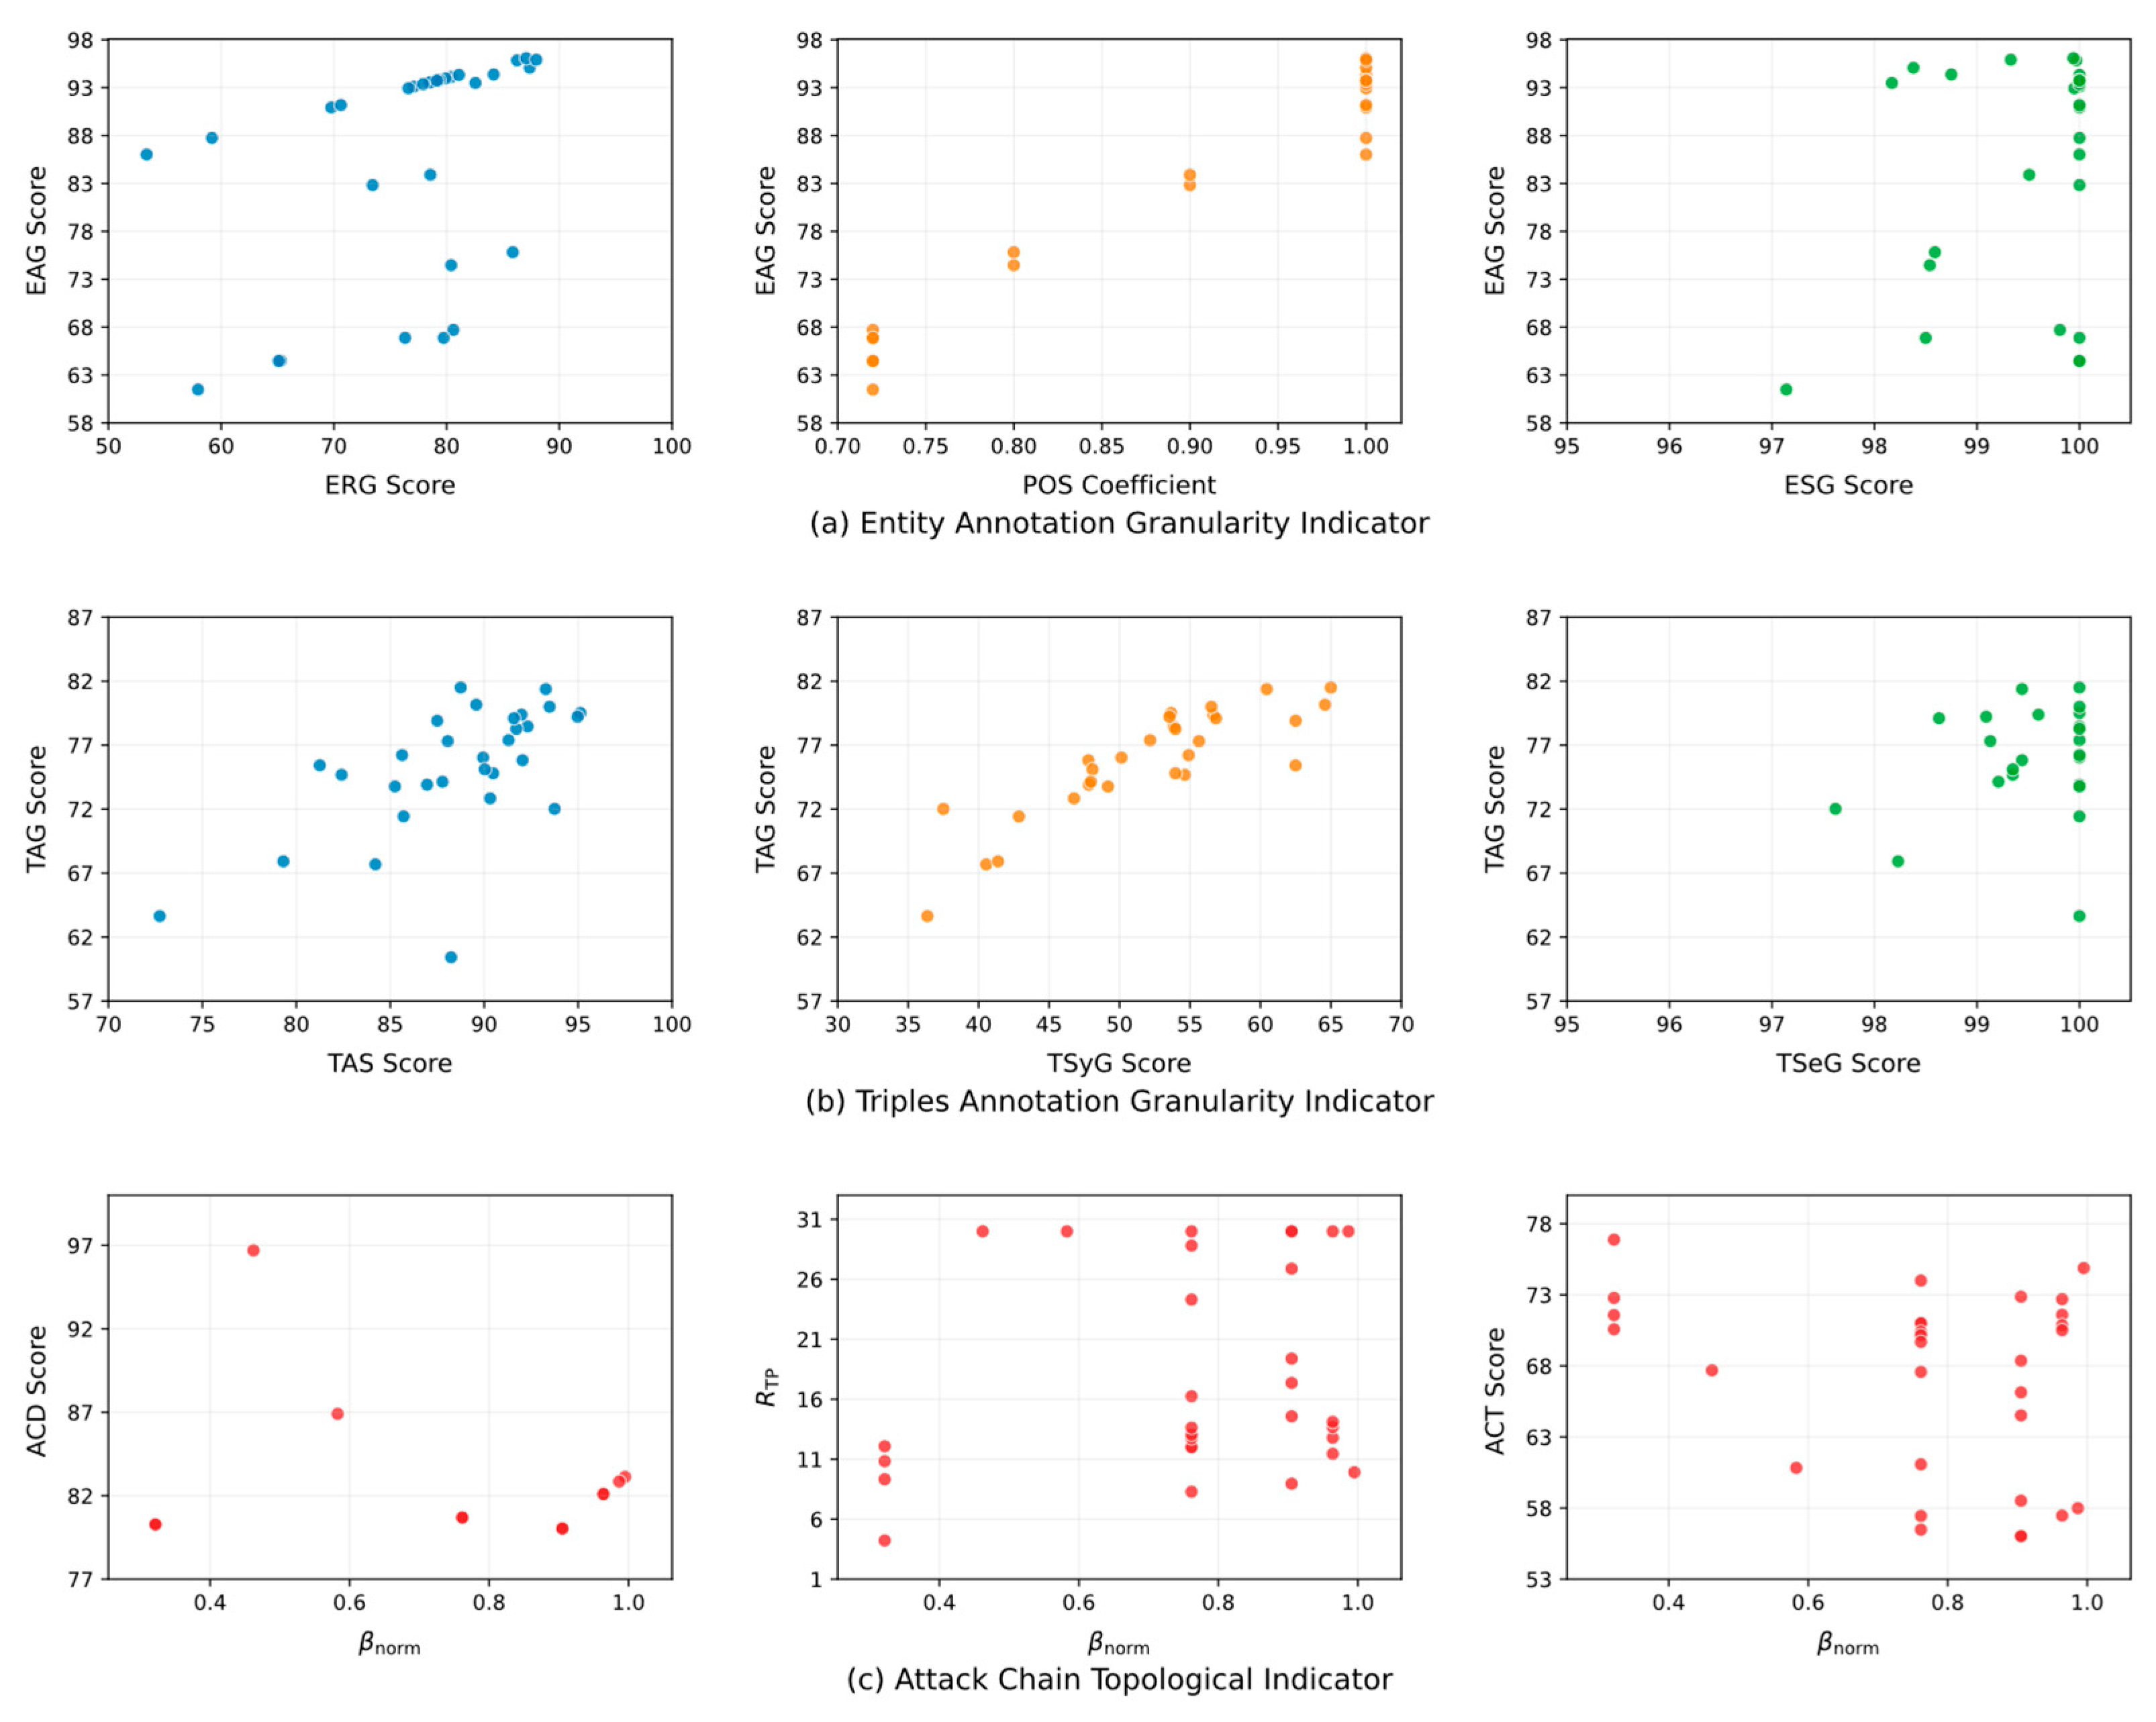
4.4.2. Formal Annotation Phase Indicator Validation

In the formal annotation phase, Entity Annotation Granularity (EAG), Triplet Annotation Granularity (TAG), and Attack Chain Integrity (ACT) indicators are all document-level indicators. They aim to rapidly lock annotation quality issues to specific documents. We use scatter plots to experimentally validate the inter-dimensional correlations of these indicators (as shown in Figure 8). In EAG and TAG indicators, overall characteristics and trends are most pronounced, as shown in Figure 8a,b. However, in sub-dimensions, semantics are constrained by the embedding space limitations of pre-trained models for vertical domains. Additionally, entity granularity exhibits greater discriminability than triplet granularity, indicating more stable annotation characteristics among triplets of the same type.
In the ACT indicator shown in Figure 8c, we use chain tail strength ( β n o r m ) as the horizontal axis to observe the correlation between ACT and its sub-dimensions. Here, stronger β n o r m leads to decreased ACD, indicating overall chain length bias in this portion of documents. The relationship between entropy and chain tail strength shows inverse symmetry, suggesting that when β n o r m is stronger, structural changes are more complex, entropy is higher, and overall scores are lower. This indicator comprehensively reflects the structural and phase characteristics of attack chains.
Additionally, we found that evaluating semantic consistency between similar texts through similarity calculations using SecureBERT word embeddings results in consistently high scores. This leads to poor discrimination in the semantic consistency scoring component. The analysis suggests this may be due to the similar nature of word embedding vectors in vertical domains.

4.4.3. Generalizability Experiments of Evaluation System

We evaluated publicly available datasets using our proposed evaluation framework. However, due to the inherent limitation that open-source datasets often do not contain original data, it was challenging to apply all indicators in our evaluation system comprehensively. For instance, some datasets only support entities or relations, lack pre-processing information, such as document boundaries, or provide only extracted data without annotation data. Additionally, due to the absence of original contextual information, such as full articles, we calculated overall scores by averaging the applicable evaluation indicators supported by the entire dataset. Table 3 presents the types of indicators supported by each dataset and their corresponding scores.
Overall, our dataset achieved the highest score due to its superior balance across all dimensions. Among the other datasets, entity-focused datasets scored higher (DNRTI and APTNER), while APTNER received a lower score due to its inclusion of non-semantic entities and relatively imbalanced structure. Furthermore, the evaluation of HACKER and CVTIKG was limited by incomplete annotation data. CVTIKG, in particular, scored lowest as it only provided inferred extracted triplet data rather than original annotation data.

4.5. External Consistency Experiment

External consistency and internal consistency constitute key dimensions of knowledge graph evaluation. This study employs semantic similarity-based clustering to evaluate consistency between APT knowledge graphs and external knowledge bases, specifically MITRE ATT&CK, from which the original data were sourced. Results are presented in Figure 9, where thresholds represent similarity boundaries between semantic clusters. Higher thresholds generate more clusters, yielding elevated similarity scores for individual triplets and correspondingly higher consistency ratings.
However, the overall external consistency scores approach 1, consistent with our observations during internal consistency metric construction (Section 4.4.2). Two factors may explain this phenomenon: overlap between annotated data and knowledge base sources, and similar embedding vectors generated by domain-specific word embedding models trained on similar corpora for APT-related terms. This suggests that relying solely on semantic similarity when using natural language knowledge bases such as MITRE ATT&CK or CAPEC is insufficient for adequately evaluating the external consistency of knowledge graphs.
Based on these findings, future work will investigate knowledge graph alignment-based techniques for external consistency evaluation. Our annotated dataset will help address the current scarcity of open-source, high-quality APT knowledge graph data, enabling further investigation of inter-graph external consistency evaluation approaches.

4.6. Dataset Information

The overall dataset information for our final annotations is shown in Table 4 with both entity and relation counts exceeding ten thousand. In the annotated data, the number of unique relation triplet types exceeds 400. However, most triplet types have relatively small quantities; therefore, we plan to fine-tune large models based on existing data to further expand the dataset scale and promote further research in this field.

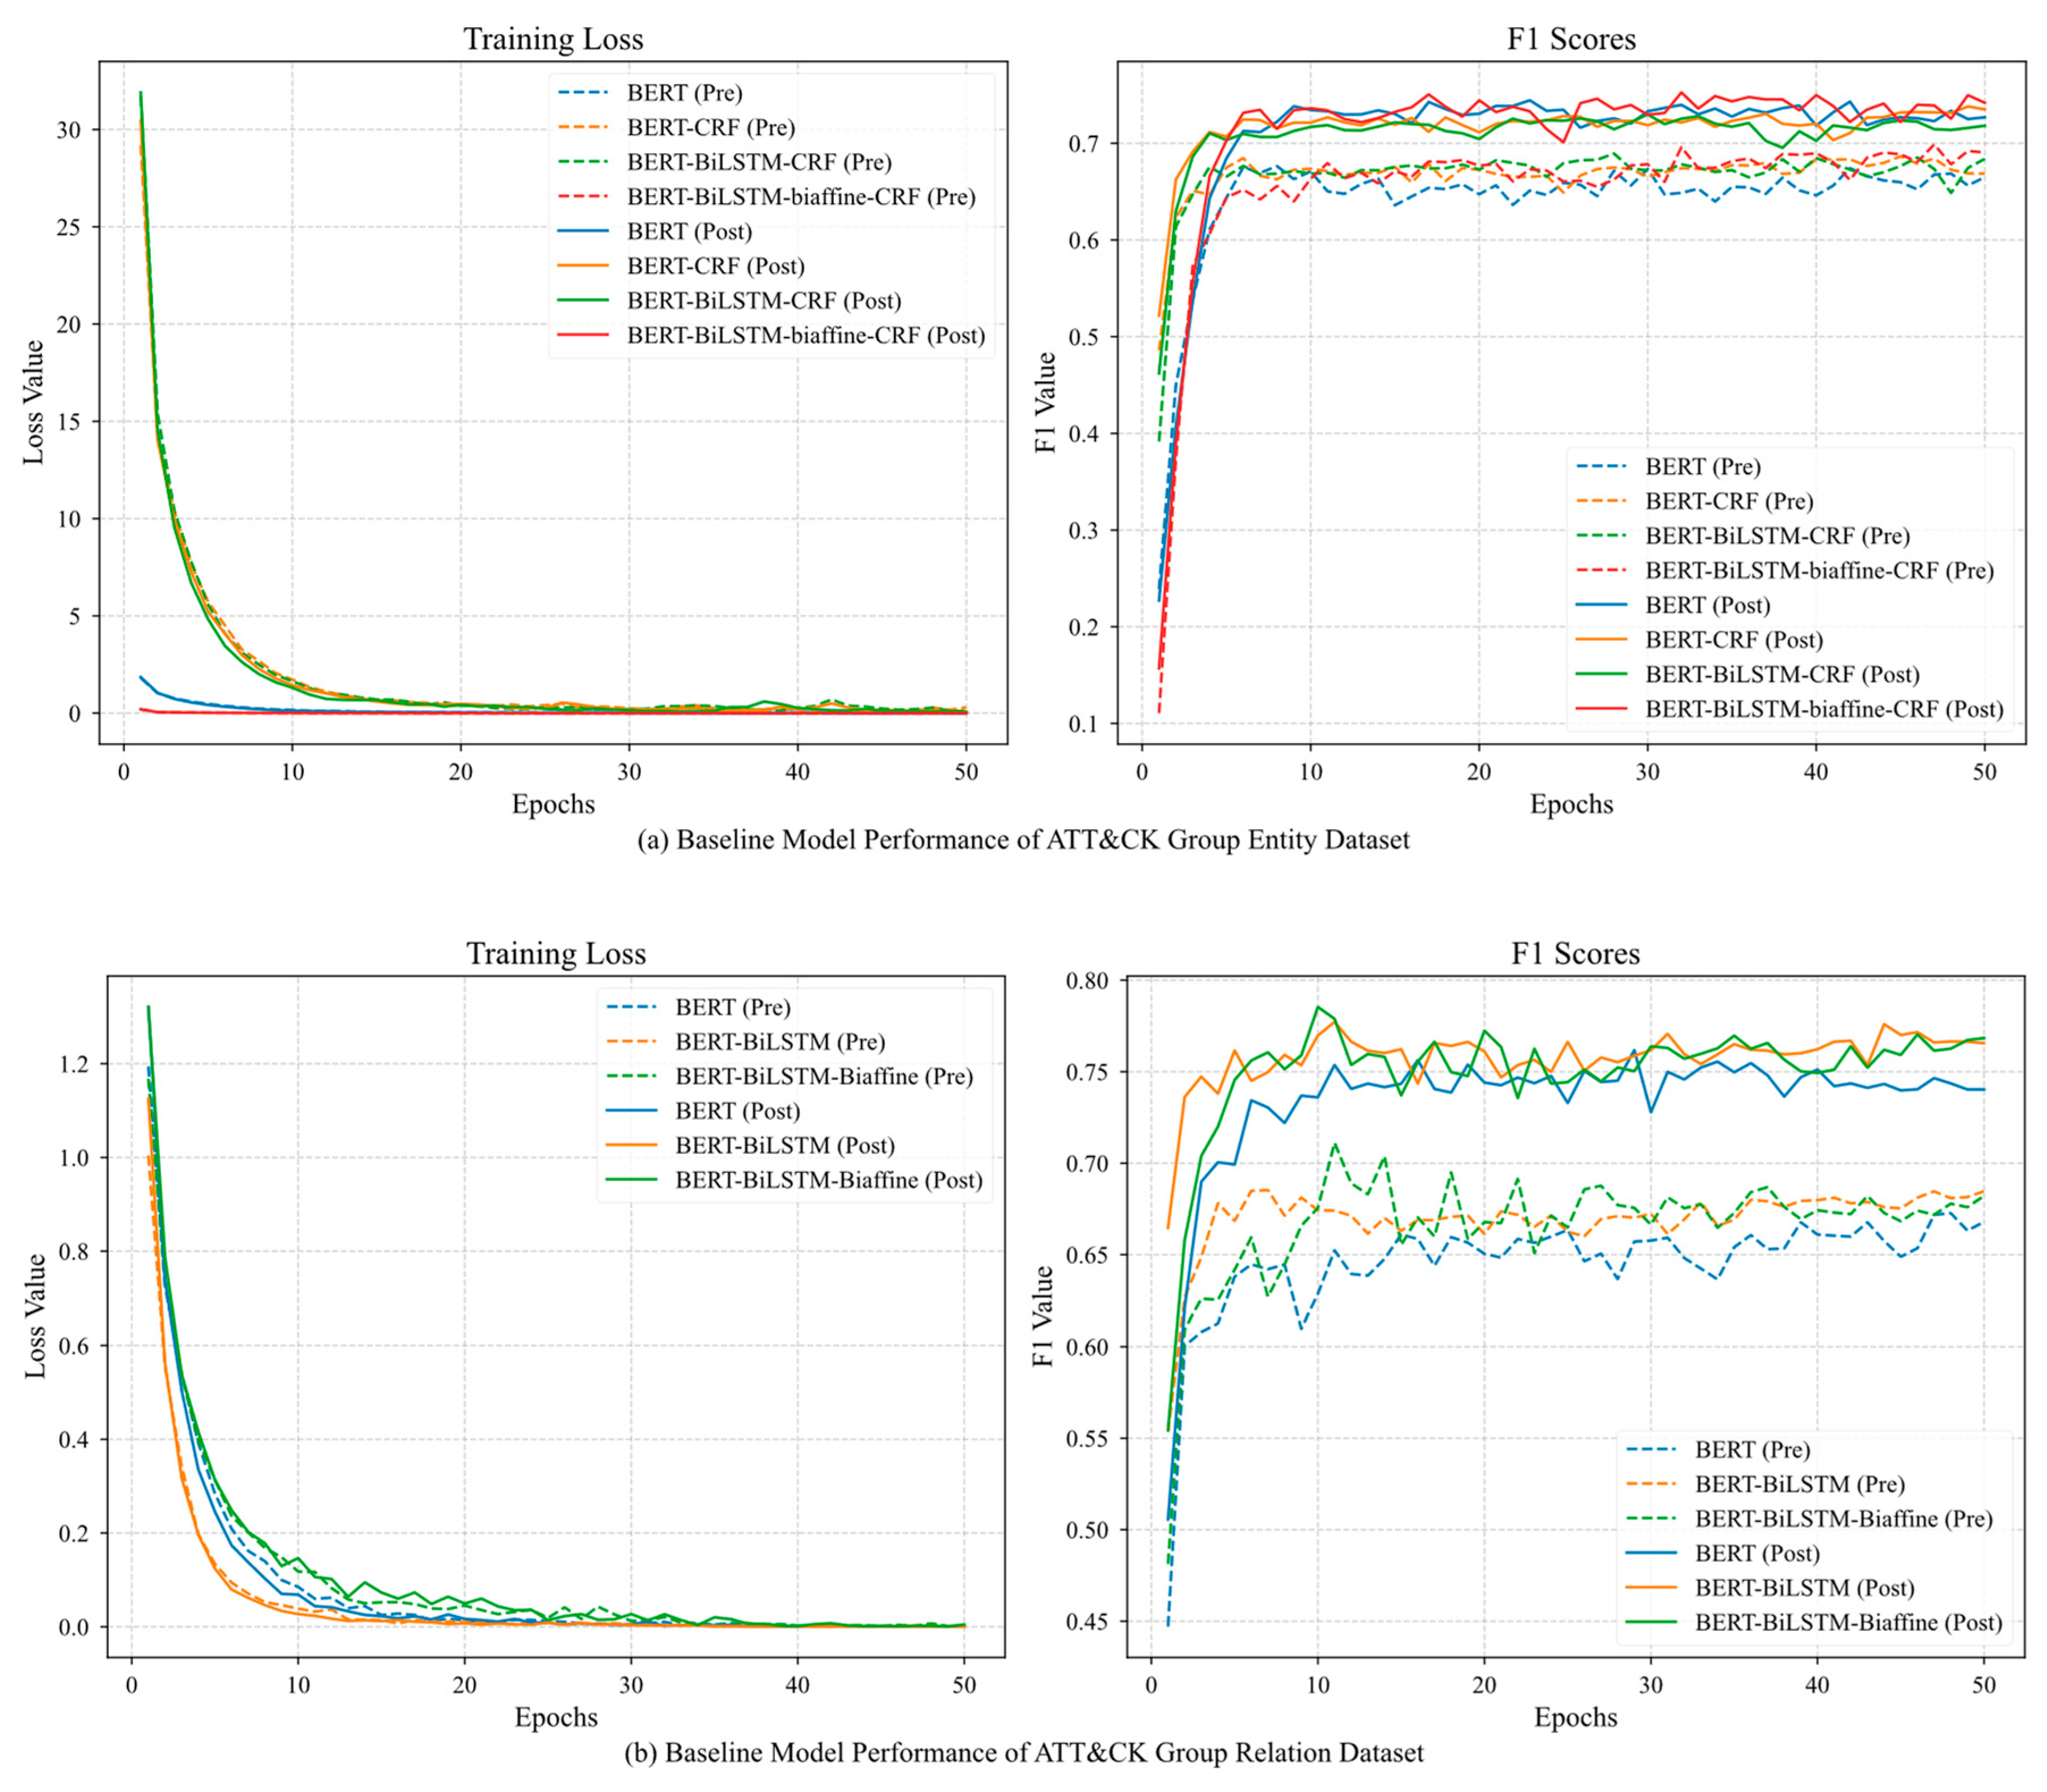
4.7. Baseline Model Experiments

To supplement the validation of data training effects before and after correction, we further verified using baseline pipeline models on the ATT&CK Group dataset, as shown in Figure 10a,b. The experiments demonstrate that our method can effectively improve recognition performance after indicator validation. In the entity recognition task, the two CRF-based recognition models achieved slightly lower scores on the corrected data compared to the other two non-CRF model types. This is possibly because CRF-based sequence labeling models can only assign one label per token, introducing ambiguity in overlapping entity annotation. The fluctuations observed in relation recognition may result from pipeline models training entity pair relationships by duplicating sentences, thereby introducing noise in overlapping relation identification.

5. Conclusions

This study addresses three critical problems in APT entity relation extraction datasets: insufficient ontological structure completeness (Q3), low annotation efficiency (Q1), and insufficient quality assessment systems (Q2). We propose a dynamic trustworthy annotation framework based on knowledge graph data to simultaneously improve the efficiency and quality of APT knowledge graph construction.
The framework systematically extends existing ontological definitions from attack technical and semantic perspectives, targeting complex APT scenarios. We design a quantitative indicator system based on continuous annotation objectives, providing objective standards for data quality assessment. By integrating LLM technology, we construct a process-oriented framework that automates and intelligentizes the annotation process.
To validate effectiveness, we constructed a large-scale dataset with over ten thousand entity relations. Experimental results demonstrate that our annotation framework significantly reduces costs, the quantitative indicator system accurately identifies quality differences and effectively accelerates data correction. Comparative experiments before and after correction further validate the system’s practicality and effectiveness.

6. Future Work

In subsequent research, we will focus on addressing the current low discriminative power of external consistency evaluation. Building upon the high-quality dataset established in this work, we will concentrate on developing more effective external consistency assessment methods. Inspired by recent advances in network structure analysis for BGP community recognition [43], we plan to investigate the application of graph-level classification in knowledge graph annotation quality assessment. In future large-scale dataset expansion efforts, we plan to replace prompt templates with fine-tuning methods during the model annotation phase. This approach will not only enhance automated annotation quality and reduce manual costs, but also further validate the generalizability of our evaluation methods across different data annotation pipelines.

Author Contributions

R.Q.: Conceptualization, Methodology, Software, Validation, Writing—original draft. G.X.: Funding acquisition, Methodology, Writing—review and editing. Y.Z.: Conceptualization, Methodology, Writing—review and editing. Q.Y.: Project administration, Visualization. M.C.: Data curation, Formal analysis. H.Z.: Resources. M.M.: Investigation. L.S.: Resources. Z.M.: Investigation. All authors have read and agreed to the published version of the manuscript.

Funding

This work was supported by the R&D Program of Beijing Municipal Education Commission (No. KM202311232014), the Curriculum Construction Project of Beijing Information Science and Technology University (No. 2024YKJ03), the General Program of Beijing Higher Education Association (No. MS2024277), and the XingGuang Program of Beijing Information Science and Technology University (No. XG2025ZD20). 2024 Beijing University Student Innovation and Entrepreneurship Training Inter school Cooperation Plan (No. 202498100).

Data Availability Statement

The raw data supporting the conclusions of this article will be made available by the authors on request.

Conflicts of Interest

The authors declare no conflicts of interest.

References

  1. Guo, Z.; Zhu, G.; Yang, Y. Research on Railway Network Security Performance Based on APT Characteristics. Netinfo Secur. 2024, 24, 802–811. [Google Scholar] [CrossRef]
  2. Zhou, Y.; Tang, Y.; Yi, M.; Xi, C.; Lu, H. CTI View: APT Threat Intelligence Analysis System. Syst. Secur. Commun. Netw. 2022, 2022, 9875199. [Google Scholar] [CrossRef]
  3. Liu, Y.; Han, X.; Zuo, W.; Lv, H.; Guo, J. CTI-JE: A Joint Extraction Framework of Entities and Relations in Unstructured Cyber Threat Intelligence. In Proceedings of the 2024 27th International Conference on Computer Supported Cooperative Work in Design, CSCWD 2024, Tianjin, China, 8–10 May 2024; pp. 2728–2733. [Google Scholar] [CrossRef]
  4. Lv, H.; Han, X.; Cui, H.; Wang, P.; Zuo, W.; Zhou, Y. Joint Extraction of Entities and Relationships from Cyber Threat Intelligence based on Task-specific Fourier Network. In Proceedings of the 2024 International Joint Conference on Neural Networks (IJCNN), Yokohama, Japan, 30 June–5 July 2024; pp. 1–8. [Google Scholar] [CrossRef]
  5. Zuo, J.; Gao, Y.; Li, X.; Yuan, J. An End-to-end Entity and Relation Joint Extraction Model for Cyber Threat Intelligence. In Proceedings of the 2022 7th International Conference on Big Data Analytics, ICBDA 2022, Guangzhou, China, 4–6 March 2022; pp. 204–209. [Google Scholar] [CrossRef]
  6. Ahmed, K.; Khurshid, S.K.; Hina, S. CyberEntRel: Joint extraction of cyber entities and relations using deep learning. Comput. Secur. 2023, 136, 103579. [Google Scholar] [CrossRef]
  7. Huang, Y.; Su, M.; Xu, Y.; Liu, T. NER in Cyber Threat Intelligence Domain Using Transformer with TSGL. J. Circuits Syst. Comput. 2023, 32, 12. [Google Scholar] [CrossRef]
  8. Wei, T.; Li, Z.; Wang, C.; Cheng, S. Cybersecurity Threat Intelligence Mining Algorithm for Open Source Heterogeneous Data. Comput. Sci. 2023, 50, 330–337. [Google Scholar] [CrossRef]
  9. Gao, Y.; Li, X.; Peng, H.; Fang, B.; Yu, P.S. HinCTI: A Cyber Threat Intelligence Modeling and Identification System Based on Heterogeneous Information Network. IEEE Trans. Knowl. Data Eng. 2022, 34, 708–722. [Google Scholar] [CrossRef]
  10. Li, Z.; Zeng, J.; Chen, Y.; Liang, Z. AttacKG: Constructing Technique Knowledge Graph from Cyber Threat Intelligence Reports. In Computer Security—ESORICS 2022. ESORICS 2022; Lecture Notes in Computer Science; Springer: Cham, Switzerland, 2022; Volume 13554 LNCS, pp. 589–609. [Google Scholar] [CrossRef]
  11. Wang, X.; Liu, X.; Ao, S.; Li, N.; Jiang, Z.; Xu, Z.; Xiong, Z.; Xiong, M.; Zhang, X. DNRTI: A large-scale dataset for named entity recognition in threat intelligence. In Proceedings of the 2020 IEEE 19th International Conference on Trust, Security and Privacy in Computing and Communications, TrustCom 2020, Guangzhou, China, 29 December 2020–1 January 2021; pp. 1842–1848. [Google Scholar] [CrossRef]
  12. Wang, X.; He, S.; Xiong, Z.; Wei, X.; Jiang, Z.; Chen, S.; Jiang, J. APTNER: A Specific Dataset for NER Missions in Cyber Threat Intelligence Field. In Proceedings of the 2022 IEEE 25th International Conference on Computer Supported Cooperative Work in Design, CSCWD 2022, Hangzhou, China, 4–6 May 2022; pp. 1233–1238. [Google Scholar] [CrossRef]
  13. Liu, Y.; Shi, R.; Chen, Y.; Gong, X.; Guo, Q.; Zhang, X. APTTOOLNER: A Chinese Dataset of Cyber Security Tool for NER Task. In Proceedings of the 2023 3rd Asia-Pacific Conference on Communications Technology and Computer Science, ACCTCS 2023, Shenyang, China, 25–27 February 2023; pp. 368–373. [Google Scholar] [CrossRef]
  14. Luo, Y.; Ao, S.; Luo, N.; Su, C.; Yang, P.; Jiang, Z. Extracting threat intelligence relations using distant supervision and neural networks. In Advances in Digital Forensics XVII; IFIP Advances in Information and Communication Technology; Springer: Cham, Switzerland, 2021; Volume 612, pp. 193–211. [Google Scholar] [CrossRef]
  15. YLi, Y.; Guo, Y.; Fang, C.; Liu, Y.; Chen, Q.; Cui, J. A Novel Threat Intelligence Information Extraction System Combining Multiple Models. Secur. Commun. Netw. 2022, 2022, 8477260. [Google Scholar] [CrossRef]
  16. Cheng, S.; Li, Z.; Wei, T. Threat intelligence entity relation extraction method integrating bootstrapping and semantic role labeling. J. Comput. Appl. 2023, 43, 1445–1453. [Google Scholar] [CrossRef]
  17. Shang, W.; Wang, B.; Zhu, P.; Ding, L.; Wang, S. A Span-based Multivariate Information-aware Embedding Network for joint relational triplet extraction of threat intelligence. Knowl. Based Syst. 2024, 295, 111829. [Google Scholar] [CrossRef]
  18. Ren, Y.; Xiao, Y.; Zhou, Y.; Zhang, Z.; Tian, Z. CSKG4APT: A Cybersecurity Knowledge Graph for Advanced Persistent Threat Organization Attribution. IEEE Trans. Knowl. Data Eng. 2023, 35, 5695–5709. [Google Scholar] [CrossRef]
  19. Piplai, A.; Mittal, S.; Joshi, A.; Finin, T.; Holt, J.; Zak, R. Creating Cybersecurity Knowledge Graphs From Malware After Action Reports. IEEE Access 2020, 8, 211691–211703. [Google Scholar] [CrossRef]
  20. Zhou, Y.; Ren, Y.; Yi, M.; Xiao, Y.; Tan, Z.; Moustafa, N.; Tian, Z. CDTier: A Chinese Dataset of Threat Intelligence Entity Relationships. IEEE Trans. Sustain. Comput. 2023, 8, 627–638. [Google Scholar] [CrossRef]
  21. Rastogi, N.; Dutta, S.; Gittens, A.; Zaki, M.J.; Aggarwal, C. TINKER: A framework for Open source Cyberthreat Intelligence. In Proceedings of the 2022 IEEE 21st International Conference on Trust, Security and Privacy in Computing and Communications, TrustCom 2022, Wuhan, China, 9–11 December 2022; pp. 1569–1574. [Google Scholar] [CrossRef]
  22. Li, H.; Shi, Z.; Pan, C.; Zhao, D.; Sun, N. Cybersecurity knowledge graphs construction and quality assessment. Complex Intell. Syst. 2023, 10, 1201–1217. [Google Scholar] [CrossRef]
  23. Wang, G.; Liu, P.; Huang, J.; Bin, H.; Wang, X.; Zhu, H. KnowCTI: Knowledge-based cyber threat intelligence entity and relation extraction. Comput. Secur. 2024, 141, 103824. [Google Scholar] [CrossRef]
  24. Sarhan, I.; Spruit, M. Open-CyKG: An Open Cyber Threat Intelligence Knowledge Graph. Knowl.-Based Syst. 2021, 233, 107524. [Google Scholar] [CrossRef]
  25. Jo, H.; Lee, Y.; Shin, S. Vulcan: Automatic extraction and analysis of cyber threat intelligence from unstructured text. Comput. Secur. 2022, 120, 102763. [Google Scholar] [CrossRef]
  26. Lu, H.; Jin, C.; Helu, X.; Du, X.; Guizani, M.; Tian, Z. DeepAutoD: Research on Distributed Machine Learning Oriented Scalable Mobile Communication Security Unpacking System. IEEE Trans. Netw. Sci. Eng. 2022, 9, 2052–2065. [Google Scholar] [CrossRef]
  27. Barron, R.; Eren, M.E.; Bhattarai, M.; Wanna, S.; Solovyev, N.; Rasmussen, K.; Alexandrov, B.S.; Nicholas, C.; Matuszek, C. Cyber-Security Knowledge Graph Generation by Hierarchical Nonnegative Matrix Factorization. In Proceedings of the 12th International Symposium on Digital Forensics and Security, ISDFS 2024, San Antonio, TX, USA, 29–30 April 2024. [Google Scholar] [CrossRef]
  28. Knuth, D.E.; Morris, J.H., Jr.; Pratt, V.R. Fast Pattern Matching in Strings. SIAM J. Comput. 2006, 6, 323–350. [Google Scholar] [CrossRef]
  29. Behzadan, V.; Aguirre, C.; Bose, A.; Hsu, W. Corpus and Deep Learning Classifier for Collection of Cyber Threat Indicators in Twitter Stream. In Proceedings of the 2018 IEEE International Conference on Big Data, Big Data 2018, Seattle, WA, USA, 10–13 December 2018; pp. 5002–5007. [Google Scholar] [CrossRef]
  30. Schlette, D.; Böhm, F.; Caselli, M.; Pernul, G. Measuring and visualizing cyber threat intelligence quality. Int. J. Inf. Secur. 2021, 20, 21–38. [Google Scholar] [CrossRef]
  31. Zibak, A.; Sauerwein, C.; Simpson, A.C. Threat Intelligence Quality Dimensions for Research and Practice. Digit. Threat. Res. Pract. 2022, 3, 1–22. [Google Scholar] [CrossRef]
  32. Sakellariou, G.; Fouliras, P.; Mavridis, I. A Methodology for Developing & Assessing CTI Quality Metrics. IEEE Access 2024, 12, 6225–6238. [Google Scholar] [CrossRef]
  33. Ge, W.; Wang, J. SeqMask: Behavior Extraction Over Cyber Threat Intelligence Via Multi-Instance Learning. Comput. J. 2024, 67, 253–273. [Google Scholar] [CrossRef]
  34. Grafarend, E.W. Linear and Nonlinear Models. Fixed effects, random effects, and mixed models. Geomatica 2006, 60, 382–383. Available online: https://go.gale.com/ps/i.do?p=AONE&sw=w&issn=11951036&v=2.1&it=r&id=GALE%7CA674565700&sid=googleScholar&linkaccess=fulltext (accessed on 2 July 2025).
  35. Ceriani, L.; Verme, P. The origins of the Gini index: Extracts from Variabilità e Mutabilità (1912) by Corrado Gini. J. Econ. Inequal. 2012, 10, 421–443. Available online: https://link.springer.com/article/10.1007/s10888-011-9188-x (accessed on 2 July 2025). [CrossRef]
  36. Shannon, C.E. A Mathematical Theory of Communication. Bell Syst. Tech. J. 1948, 27, 379–423. [Google Scholar] [CrossRef]
  37. Cohen, J. A Coefficient of Agreement for Nominal Scales. Educ. Psychol. Meas. 1960, 20, 37–46. [Google Scholar] [CrossRef]
  38. Beran, R. Minimum Hellinger Distance Estimates for Parametric Models. Ann. Stat. 1977, 5, 445–463. Available online: https://www.jstor.org/stable/2958896 (accessed on 2 July 2025). [CrossRef]
  39. Aghaei, E.; Niu, X.; Shadid, W.; Al-Shaer, E. SecureBERT: A Domain-Specific Language Model for Cybersecurity. In Security and Privacy in Communication Networks; Lecture Notes of the Institute for Computer Sciences, Social-Informatics and Telecommunications Engineering, LNICST; Springer: Cham, Switzerland, 2023; Volume 462, pp. 39–56. [Google Scholar] [CrossRef]
  40. Bauer, J.; Kiddon, C.; Yeh, E.; Shan, A.; Manning, C.D. Semgrex and Ssurgeon, Searching and Manipulating Dependency Graphs. April 2024. Available online: https://arxiv.org/pdf/2404.16250 (accessed on 2 July 2025).
  41. Li, Y.; Luo, H.; Wang, Q.; Li, J. An Advanced Persistent Threat Model of New Power System Based on ATT&CK. Netinfo Secur. 2023, 23, 26–34. [Google Scholar] [CrossRef]
  42. Xiang, G.; Shi, C.; Zhang, Y. An APT Event Extraction Method Based on BERT-BiGRU-CRF for APT Attack Detection. Electronics 2023, 12, 3349. [Google Scholar] [CrossRef]
  43. Tan, Y.; Huang, W.; You, Y.; Su, S.; Lu, H. Recognizing BGP Communities Based on Graph Neural Network. IEEE Netw. 2024, 38, 282–288. [Google Scholar] [CrossRef]
Figure 1. APT knowledge graph dynamic trustworthy annotation framework.
Electronics 14 03251 g001
Figure 2. Trustworthy data collection process flow.
Electronics 14 03251 g002
Figure 3. Annotation quality quantitative indicator system. The different colors only indicate different levels of indicators system.
Electronics 14 03251 g003
Figure 4. Comparison of annotation time costs: manual vs framework approaches.
Electronics 14 03251 g004
Figure 5. LAC indicator comparison effects for different prompt templates. LAC inherits the characteristics of the Kappa coefficient, where 0.21–0.40 indicates fair agreement, 0.41–0.60 indicates moderate agreement, and 0.61–0.80 indicates substantial agreement. The entity portion of joint prompting is consistent with boundary analysis.
Electronics 14 03251 g005
Figure 6. Ontological structure expected thresholds and CCC indicator effects.
Electronics 14 03251 g006
Figure 7. CDB indicator and visualization display. The green line represents the cumulative percentage of different categories, ordered from highest to lowest by sample count.
Electronics 14 03251 g007
Figure 8. Scatter plot of formal annotation indicators. (a,b) display representations, syntax, and semantics respectively. (c) shows the relationship between indicators and penalty terms with chain tail strength factors. Blue, orange, and green denote the representation, syntactic, and semantic factors for EAG and TAG respectively, while red indicates the factors of the ACT metric.
Electronics 14 03251 g008
Figure 9. APT triplet external consistency by clustering threshold.
Electronics 14 03251 g009
Figure 10. Baseline model validation results before and after indicator correction.
Electronics 14 03251 g010
Table 1. Annotation modes and quality assessment methods in related studies.
LiteratureOntologyModeAnnotation Quality Evaluation
ENREExpertFlowArchitectureBaseline
[2,7,8] manual
[9] manual
[10] manual
[11,12,13] manual
[14] auto
[6,15,16]manual
[17,18,19]manual
[20,21] (CS40K)auto
[21] (CS3K) [22,23,24,25]manual
OURsauto
Note: A checkmark (√) indicates that the work supports the corresponding category, such as ontology entities or relations, expert evaluation of annotation quality, evaluation flow, metric architecture, and baseline model validation. A blank cell indicates no support.
Table 2. Dual-layer APT ontological structure definition.
TaskTypeSubType
EntityThreat initiatorThreat-Actor, Malware, Tool, Attack-Pattern
AssetVulnerability, Configuration, File, Infrastructure, Credential
ImplicationLocation, Identity, Industry, Observed-Data
RelationBase Relationstargets
Operationuses, exploits, interacts-with, requires
Traceabilitylocated-at, indicates, attributed-to, has
Extensionvariant-of, affects, related-to
Table 3. Generalizability experiments of the evaluation system based on open-source datasets.
LiteratureBasic Structural
Indicators
Logical Consistency IndicatorsACTScore
CDACDBLACCCCEAGTAG
DNRTI [11]Electronics 14 03251 i001Electronics 14 03251 i002Electronics 14 03251 i001Electronics 14 03251 i002Electronics 14 03251 i003Electronics 14 03251 i001Electronics 14 03251 i00178.89
APTNER [12]Electronics 14 03251 i001Electronics 14 03251 i002Electronics 14 03251 i001Electronics 14 03251 i002Electronics 14 03251 i003Electronics 14 03251 i001Electronics 14 03251 i00165.67
HACKER [14]Electronics 14 03251 i001Electronics 14 03251 i002Electronics 14 03251 i001Electronics 14 03251 i002Electronics 14 03251 i001Electronics 14 03251 i002Electronics 14 03251 i00161.14
CVTIKG [17]Electronics 14 03251 i001Electronics 14 03251 i001Electronics 14 03251 i001Electronics 14 03251 i002Electronics 14 03251 i001Electronics 14 03251 i002Electronics 14 03251 i00257.44
Ours (LAPTKG)Electronics 14 03251 i003Electronics 14 03251 i003Electronics 14 03251 i003Electronics 14 03251 i003Electronics 14 03251 i003Electronics 14 03251 i003Electronics 14 03251 i00383.65
Note: Electronics 14 03251 i001 indicates that the indicator was not evaluated at all, Electronics 14 03251 i002 indicates that the indicator was partially evaluated, and Electronics 14 03251 i003 indicates that the indicator was fully evaluated according to the design.
Table 4. Entity dataset scale.
EntityRelation
TypeATT&CKReportTypeATT&CKReport
Threat-Actor1490493uses1250801
Attack-Pattern1472859requires1095487
Infrastructure726650interacts-with827571
Tool635474targets497540
Malware562748attributed-to446205
Configuration416378related-to367877
Identity396635exploits33679
File393293has321391
Observed-Data382458affects301212
Credential20679located-at295216
Location141449indicates98157
Industry117306variant-of74147
Vulnerability11772---
Total70535895Total59074687
Disclaimer/Publisher’s Note: The statements, opinions and data contained in all publications are solely those of the individual author(s) and contributor(s) and not of MDPI and/or the editor(s). MDPI and/or the editor(s) disclaim responsibility for any injury to people or property resulting from any ideas, methods, instructions or products referred to in the content.