Article

A Fractional-Order State Estimation Method for Supercapacitor Energy Storage

by
Arsalan Rasoolzadeh
*,†,
Sayed Amir Hashemi
and
Majid Pahlevani
ePower Laboratory, Electrical and Computer Engineering Department, Queen’s University, Kingston, ON K7L 3N6, Canada
*
Author to whom correspondence should be addressed.
Current address: ePOWER, Walter Light Hall, 19 Union Street, Kingston, ON K7L 3N6, Canada.
Electronics 2025, 14(16), 3231; https://doi.org/10.3390/electronics14163231
Submission received: 15 July 2025 / Revised: 28 July 2025 / Accepted: 4 August 2025 / Published: 14 August 2025
(This article belongs to the Special Issue Hybrid Energy Harvesting Systems: New Developments and Applications)

Abstract

Supercapacitors (SCs) are emerging as a dependable energy storage technology in industrial applications, valued for their high power output and exceptional longevity. In high-power applications, SCs are not used as single cells but are configured in a series–parallel combination to form a bank. Accurate state-of-charge estimation is essential for effective energy management in power systems employing SC banks. This work presents a novel state estimation approach for SC banks. First, a dynamic model of an SC bank is derived by applying a fractional-order Thévenin equivalent circuit to a single-cell SC. Then, an observability analysis is conducted, which reveals that the system is empirically weakly observable. This is the fundamental challenge for state-of-the-art observers to robustly perform state estimation. To address this challenge, an implicitly regularized observer is developed based on generalized parameter estimation techniques. The performance of the proposed observer is benchmarked against a fractional-order extended Kalman filter using experimental data. The results demonstrate that incorporating a regularization law into the observer dynamics effectively mitigates observability limitations, offering a robust solution for the SC bank state estimation.

1. Introduction

As the use of renewable energy and electric vehicles continues to expand, Electrochemical Energy Storage Systems (EESSs) play an increasingly critical role in supporting sustainable and efficient energy infrastructure. Key types of EESSs include rechargeable batteries [1], fuel cells, and supercapacitors (SCs). SCs uniquely serve as an intermediate between conventional capacitors and batteries, offering a balance between energy density and power density. Although batteries offer higher energy density than SCs, they fall short in power density. SCs effectively fill this gap, making them an ideal solution for applications demanding high power output [2]. A notable real-world example is the Lamborghini Sián FKP 37, a hybrid electric super sports car that employs a supercapacitor bank as its energy storage system [3].
SCs are distinguished by their extremely long service life, broad operating temperature range, resilience in harsh conditions, high cycling efficiency, and minimal maintenance requirements. These characteristics have established SCs as essential components across diverse sectors, including transportation and renewable energy systems [4].
Precise modeling, parameter identification, and state estimation of SCs (e.g., state-of-charge (SOC) estimation) have become instrumental for SC energy management, thermal management, power control, safety supervision, and health condition monitoring. There are three primary modeling approaches for EESSs: physics-based models, which rely on electrochemical analysis to describe system dynamics [5,6]; frequency-domain data-driven models, which utilize Electrochemical Impedance Spectroscopy (EIS) and frequency-domain techniques for model identification [7,8]; and equivalent circuit models, the most widely used in practice due to their simplicity and sufficient accuracy [9,10,11,12,13,14,15,16,17,18].
SC dynamic models are generally categorized as either integer-order or fractional-order [9]. Analytical results in [5] show that fractional-order models more accurately capture SC behavior. A comparative study in [10] further supports this, reporting that fractional-order models offer 15–30% higher accuracy than their integer-order counterparts. This improved performance highlights their superiority for SC modeling [11].
Numerous equivalent circuit models for EESSs, particularly for SCs, have been proposed in the literature, with their complexity often tailored to specific applications. Although increased model complexity can enhance accuracy, it can also complicate parameter identification and may reduce practical usability. Consequently, an engineering trade-off arises between model fidelity and the feasibility of reliable state estimation [11].
The identification of SC parameters can be broadly classified into online and offline identifications and hybrid approaches. Online identification typically employs regularization-based techniques such as Least Squares Estimation (LSE) [19], Recursive Least Squares Estimation (RLSE) [20], state-estimation-based methods [21,22], Lyapunov-based observers [23], and gradient-based methods [24]. In contrast, offline identification relies on global optimization techniques, such as Genetic Algorithms (GAs) and Particle Swarm Optimization (PSO), as demonstrated in [15,25,26]. A representative example is provided in [12], where primary parameter estimation is performed offline using global optimization, followed by online refinement via a subspace system identification algorithm.
After system identification, state estimation is performed using state observers. Various observers have been designed for SC dynamics, where the choice of observer depends on the type of dynamic model, as different models often require specific observer structures. For instance, Refs. [27,28] employ a Luenberger observer, as the model used in these studies is linear and integer-order. In contrast, the observer designed in [25] utilizes a fractional-order extended Kalman filter (FOEKF), which is suited for nonlinear fractional-order models. Similarly, Ref. [22] adopted an unscented Kalman filter, and [29,30,31,32] used an extended Kalman filter given that the dynamic model in those cases is a nonlinear integer-order model. The authors of [33] used an H observer, since the utilized dynamic model is a linear and an uncertain one. Additionally, Ref. [17] combines Kalman filters with a particle filter (a stochastic-based signal processing technique) to enhance the estimation of the SOC. The study in [34] utilizes a sub-observer for SC banks with a balancing system. While the observer is linear, it needs to be reconfigured according to the switching conditions of the balancing circuit. In addition, Refs. [22,35,36] employ a sliding mode observer for state-of-health (SoH) estimation, as the system dynamics are nonlinear. The authors in [37] utilize artificial neural networks, which treat the entire system as a black box, eliminating the need for prior knowledge of system behavior or a specific model.
Different observers aim to address various specific engineering challenges in state estimation. For instance, the proposed methods in [28,32] tackle the limitations of the pure Coulomb-counting method for a single SC cell. The work in [25] enhances the estimation accuracy by leveraging a fractional-order SC model. The issue of parameter variations is addressed through online parameter identification in [17,22,30]. To account for temperature-dependent state variations, Ref. [29] incorporates temperature dynamics into the estimation process. In [31], a dual extended Kalman filter simultaneously estimates SoC, internal resistance, and capacitance based on a first-order equivalent circuit. The studies in [38,39] introduce event-triggered state estimation for fractional-order neural networks, reducing unnecessary continuous signal transmission by updating measurement vectors only under specific event-triggering conditions, an effective approach for conserving communication resources. The authors of [33] develop a robust scheme that ensures high estimation accuracy without requiring prior knowledge of process and measurement noise statistics. Additionally, Refs. [27,34] address the challenge of estimating individual cell voltages in the presence of a balancing system, utilizing an R-C series model for each cell.
Many observers are designed to best fit specific applications or address particular engineering challenges. However, a key limitation of existing observer-based state estimation methods in the literature is that they all assume the SC to be a single cell. In reality, an SC bank consists of multiple cells configured in series and parallel, requiring additional effort to extrapolate a multi-cell model from a single-cell model. In an SC bank, system states are weakly observable, and under practical conditions such as noise-polluted environments, aging effects, and parameter uncertainties, the system can become effectively unobservable. This is particularly the case in SC banks, since noise-prone switching converters are ubiquitously used as an interface for SC banks.
This paper presents a novel implicitly regularized observer based on generalized parameter estimation techniques, which is depicted in Figure 1. It is shown that incorporating a regularization law into the observer dynamics effectively mitigates observability limitations, offering a robust solution for SC bank state estimation. The list of novelties and roadmap for implementing the proposed method are summarized as follows:
  • SC single-cell dynamics: Section 2 reviews the equivalent circuit model (ECM) and the governing equations for a single-cell SC.
  • SC bank dynamical model: In Section 3, a new model for the SC bank is proposed, leveraging information from single-cell models. In previous studies, the model of a single SC cell has typically been used to represent the entire SC bank. However, in this work, a model specifically for a series–parallel combination of SC cells is derived based on the characteristics of a single-cell model. To the best of our knowledge, this is the first time such an approach has been proposed. This ECM is subsequently utilized for designing the observer.
  • Observability analysis: The SC bank observability is analyzed in Section 4, demonstrating that its dynamic model is not inherently observable (the root cause for conventional observers to fail in accurately estimating the states). This is a novel approach that has not been previously explored.
  • Qualitative study on the proposed observer: Section 5, for the first time, elaborates on the proposed observer to address the weak observability issue, and an implicit regularization law is subsequently proposed. This feature is embedded into a generalized parameter estimation-based observer (GPEBO). The red dashed line in Figure 1 highlights this module.
  • Experimental study: To validate the proposed observer and its parameter identification method, a series of experiments was conducted, with results presented in Section 6. To this end, a novel approach for identifying the fractional-order system using the MATLAB integer-order identification tool is proposed for the first time.
These contributions collectively advance the current state-of-the-art research in SC bank modeling, state estimation, and identification.

2. Modeling of a Single-Cell Supercapacitor

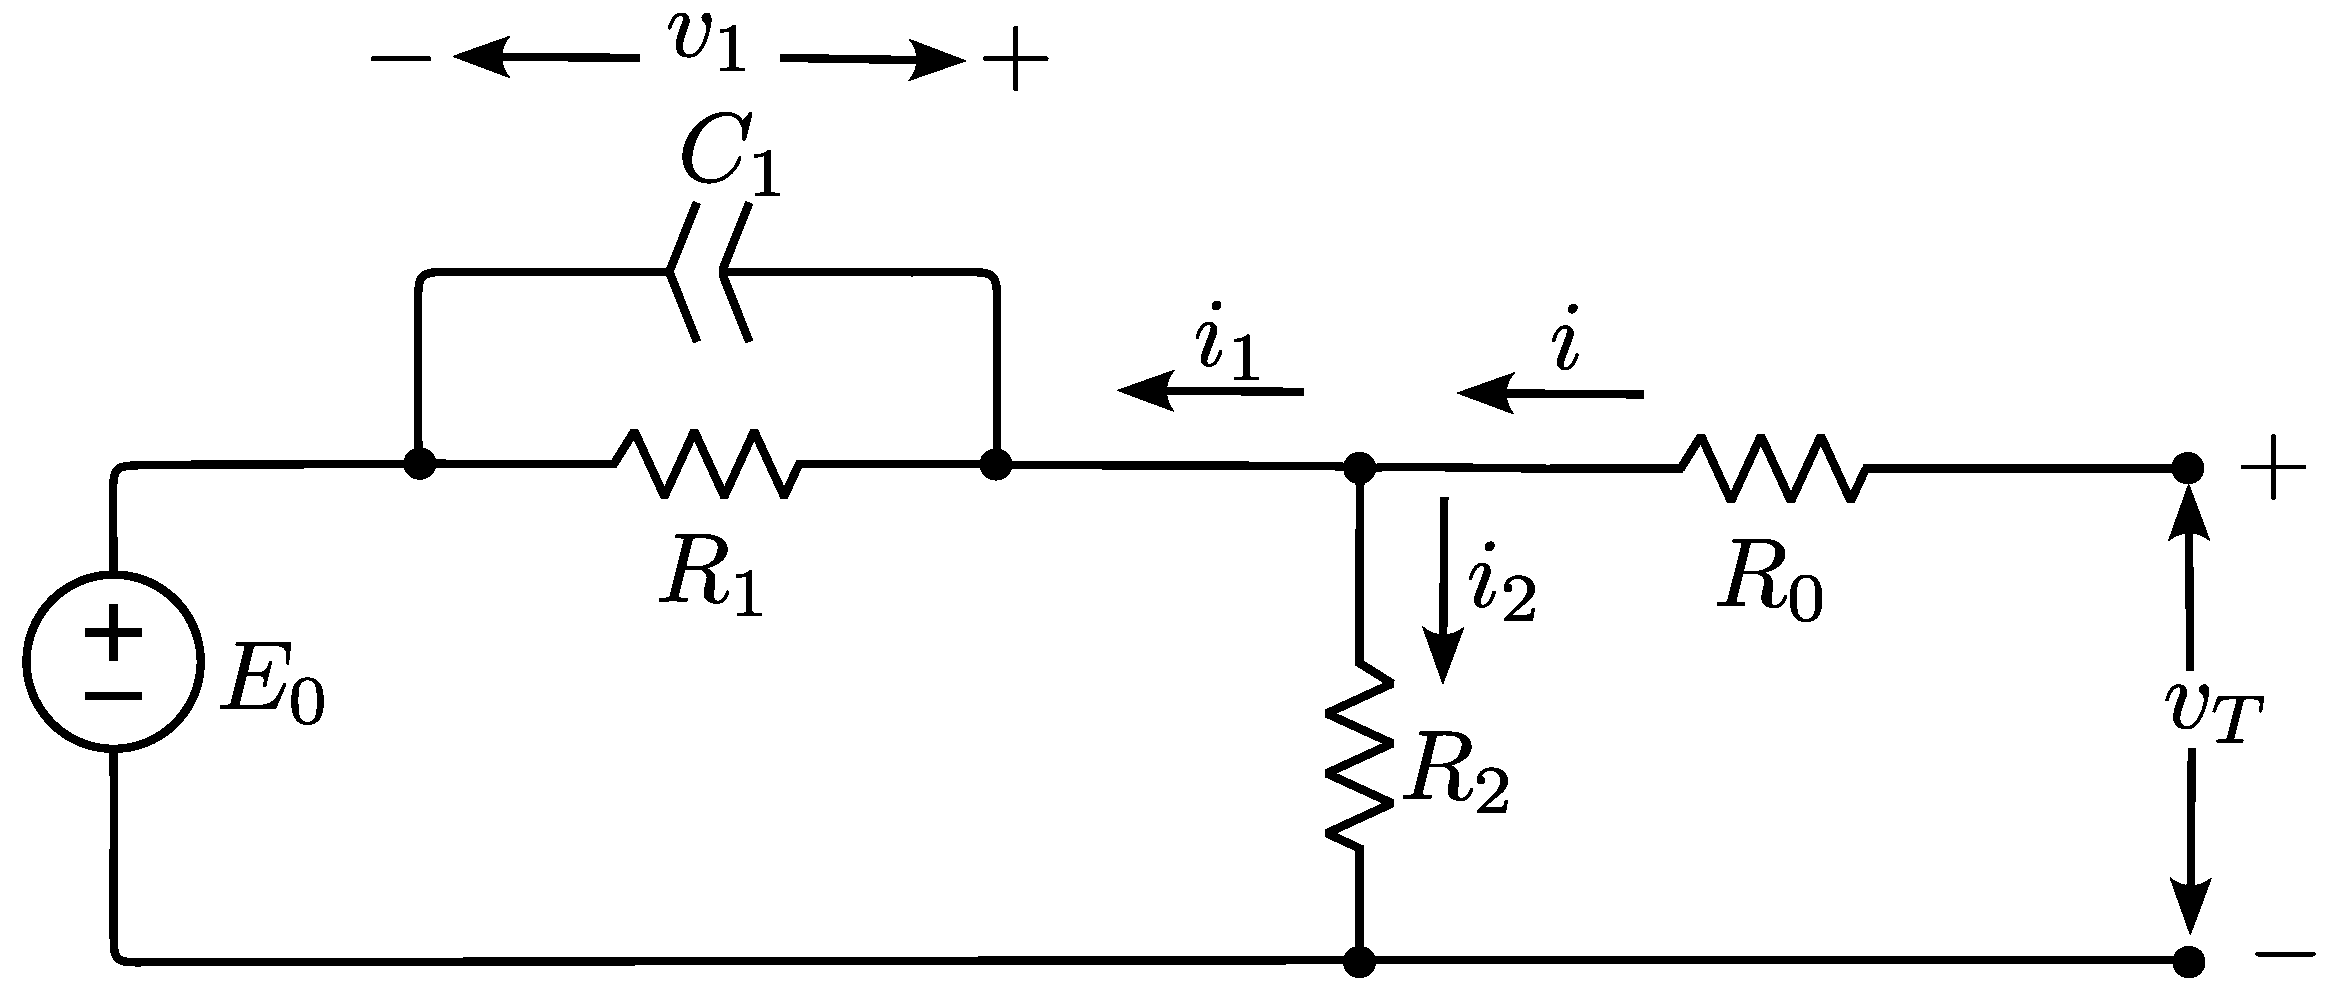
To derive the dynamic model of an SC bank, understanding the dynamics of a single-cell SC is essential. Among the various modeling approaches for a single-cell SC, the model depicted in Figure 2 is selected in this paper, as it strikes an optimal balance between accuracy and the feasibility of effective parameter identification. Fractional-order models, which rely on non-integer-order differential equations, often provide a more accurate representation of SC dynamics compared to integer-order equivalent circuit models. In fact, a fractional-order model can effectively capture the dynamical behavior of multiple integer-order RC branches. The selected model leverages the advantages of the fractional-order constant phase element (CPE), which enhances its dynamic flexibility while maintaining a minimal number of parameters. Additionally, by incorporating leakage resistance, this model is one of the most comprehensive models.
However, there are several simplifying assumptions considered in this work to offer a practical identification technique that provides accurate parameter identification. There is always a trade-off between model accuracy and complexity. In complex scenarios involving extreme climate variations, aging, and SoH changes, the model parameters may drift from their original values used in the observer. This is where an online parameter estimation algorithm such as [40] becomes useful, allowing the observer coefficients to adapt to new conditions. In cases where SOC is required for online parameter estimation, a rough estimation obtained through Coulomb counting is often sufficient. Despite all this, since the model structure remains consistent, the proposed observer based on this model remains feasible, requiring only parameter adjustments to maintain accuracy. Furthermore, it is important to recognize that increasing model complexity also increases the sophistication of the designed observer. This, in turn, imposes greater computational and memory burdens when implementing the model on microcontrollers.
To analyze the ECM, Kirchhoff laws are applied to derive the following equations from the fractional-order representation, as detailed in [25]:
i 1 ( t ) = v 1 ( t ) R 1 + C 1 d α v 1 ( t ) d t α , i 2 ( t ) = v 1 ( t ) R 2 + E 0 R 2 , v T ( t ) = v 1 ( t ) + E 0 + R 0 i ( t ) ,
In this model, C 1 represents a CPE, with  α denoting its fractional order. The  R 1 C 1 branch captures the charge redistribution and diffusion characteristics of the SC. R 2 corresponds to the leakage resistance, while R 0 denotes the Equivalent Series Resistance (ESR). The voltage across the CPE is represented by v 1 ( t ) , and  i 2 ( t ) denotes the leakage current. The terminal current and voltage are denoted by i ( t ) and v T ( t ) , respectively. The open-circuit voltage (OCV), E 0 , reflects the SC voltage at a given SOC under resting conditions and is defined as a function of SOC: E 0 = h ( SOC ) . The SOC itself can be estimated using the Coulomb counting method [25]:
d d t S O C ( t ) = η i 1 ( t ) = η ( i ( t ) i 2 ( t ) ) ,
in which η = 1 / ( 3600 C A h ) and C A h = C n V n / 3600 . Here, C n denotes the nominal capacitance of SC, and  V n represents its nominal voltage. The complete dynamic of SC can be expressed using (1) and (2) as follows:
x ( γ ) = f ( x , u ) , y = g ( x , u ) ,
in which γ is the order of derivation and equals α and 1 for the first and the second state variables, respectively; and
f ( x , u ) = A 1 x + B u + A 2 h ( x 2 ) , g ( x , u ) = C x + D u + h ( x 2 ) ,
where
x = v 1 S O C T , A 1 = ( 1 R 1 C 1 + 1 R 2 C 1 ) 0 η R 2 0 , B = 1 C 1 η , A 2 = 1 R 2 C 1 η R 2 , C = 1 0 , D = R 0 .

3. Supercapacitors Bank Model

To design an observer, a model for the entire SC bank is required. According to Figure 2, the single-cell model includes a leakage current path, without which all components in the series multi-cell configuration model would be in series, simplifying the process of combining them to derive the SC bank model parameters from the single-cell model parameters. However, the presence of R 2 introduces another loop into the circuit, causing E 0 to no longer align perfectly in series. In this section, an extended model for the whole SC bank is proposed. As the first step, the Thevenin equivalent of a single-cell SC is derived:
E O C = R 2 R 2 + ( R 1 | | Z C 1 ) E 0 = R 1 R 2 C 1 s α + R 2 R 1 R 2 C 1 s α + R 1 + R 2 E 0 ,
I S C = E 0 ( R 1 | | Z C 1 ) + ( R 0 | | R 2 ) E 0 ( R 1 | | Z C 1 ) + R 0 = R 1 C 1 s α + 1 R 1 + R 0 R 1 C 1 s α + R 0 E 0 ,
Z t h = E O C I S C = R 2 R 1 + R 0 R 2 + R 0 R 1 R 2 C 1 s α R 1 R 2 C 1 s α + R 2 + R 1 ,
in which Z C 1 = 1 / ( C 1 s α ) , E O C is the open-circuit voltage, I S C is the short-circuit current, and  Z t h is the Thevenin impedance of a single-cell SC. The other parameter definitions are the same as in (1). The terms E o c and E 0 both represent open-circuit voltage but serve different purposes in the model. E o c refers to the open-circuit voltage used in deriving the Thevenin equivalent circuit. Specifically, it is obtained as a part of the process that involves calculating E o c , the short-circuit current I S C , and the Thevenin impedance Z t h = E o c I S C . On the other hand, E 0 represents the voltage source in the model, commonly referred to as the OCV, which is a function of the SOC, expressed as E 0 = h ( S O C ) .
Considering that all SC cells are selected from the same type, with identical age and operating conditions, if there are N number of the equivalent circuit in series and also M number of them in parallel, equivalent impedance Z t h b a n k and the total open-circuit voltage E O C b a n k are given as follows:
Z t h b a n k = N M Z t h , E O C b a n k = N E O C .
By utilizing the first equation, the relationship between the impedance circuit of SC bank and that of the single-cell SC can be derived as follows:
Z t h b a n k = N M R 2 R 1 + ( N M R 0 ) R 2 + ( N M R 0 ) R 1 R 2 C 1 s α R 1 R 2 C 1 s α + R 2 + R 1 = R 2 R 1 + ( N M R 0 ) R 2 + ( N M R 0 ) R 1 R 2 C 1 s α R 1 R 2 C 1 s α + R 2 + R 1 + ( N M 1 ) R 2 R 1 R 1 R 2 C 1 s α + R 2 + R 1 = Z t h + Z t h e x t e n d ,
which is Z t h in series with Z t h e x t e n d , where
Z t h = R 2 R 1 + ( N M R 0 ) R 2 + ( N M R 0 ) R 1 R 2 C 1 s α R 1 R 2 C 1 s α + R 2 + R 1
is similar to Z t h of a single-cell SC in which R 0 is replaced by R 0 = ( N / M ) R 0 , and 
Z t h e x t e n d = ( N M 1 ) R 2 R 1 R 1 R 2 C 1 s α + R 2 + R 1 = ( N M 1 ) 1 1 / Z C 1 + 1 / R 1 + 1 / R 2 = ( N M 1 ) ( Z C 1 | | R 1 | | R 2 )
is a parallel branch of C 1 / k , k R 1 , k R 2 where k = N / M 1 . Having derived the impedance circuit of the SC bank, its open-circuit voltage can be determined. Considering E 0 as the voltage source, the resulting expression is
E O C b a n k = R 1 R 2 C 1 s α + R 2 R 1 R 2 C 1 s α + R 1 + R 2 E 0 .
By comparing (10) with the second equation of (7), it can be concluded that E 0 = N E 0 . Hence, the ECM of the SC bank can be represented as the ECM of a single-cell SC with updated parameters R 0 and E 0 , denoted as R 0 and E 0 , respectively, connected in series with Z t h e x t e n d . Consequently, the ECM depicted in Figure 3 represents the ECM of the entire series–parallel combination of SCs. The dynamic equations corresponding to the circuit in Figure 3 are as follows:
i 1 ( t ) = v 1 ( t ) R 1 + C 1 d α v 1 ( t ) d t α , i 2 ( t ) = v 1 ( t ) R 1 + E 0 R 2 , i ( t ) = v 2 ( t ) k ( R 1 | | R 2 ) + C 1 / k d α v 2 ( t ) d t α , v T ( t ) = v 1 ( t ) + E 0 + R 0 i ( t ) + v 2 ( t ) ,
in which v 2 ( t ) is the voltage across Z t h e x t e n d and
E 0 = N E 0 , R 0 = N M R 0 , k = N M 1 .
The state-space representation of the above equations can be expressed as
x ( γ ) = A 1 x + B u + A 2 h b ( x 3 ) , y = C x + D u + h b ( x 3 ) ,
where
x = v 1 v 2 s o c T , γ = α α 1 T
and the function h b ( · ) is the relation E 0 = h b ( S O C ) , which can be obtained as described in the Appendix A. α is also the fractional order of the CPE as described for a single-cell SC in (1) and
A 1 = R 1 + R 2 C 1 R 1 R 2 0 0 0 R 1 + R 2 C 1 R 1 R 2 0 η R 2 0 0 , B = 1 C 1 k C 1 η , A 2 = 1 R 2 C 1 0 η R 2 , C = 1 1 0 , D = R 0 , η = η M .

4. Observability of the SC Bank System

In this section, the observability of the system is analyzed. Here, the state estimation poses challenges due to the significant differences in the magnitudes of the system parameter values. It is important to note that while the linearized system is theoretically observable, the large condition number of the observability Gramian indicates that the system is weakly observable. In such cases, weakly observable modes can become practically unobservable in the presence of noise. As instructed in [41], for nonlinear systems, an empirical observability Gramian can be defined as follows:
W o ε ( τ , x 0 , u ) = 1 4 ε 2 0 τ Φ ε ( t , x 0 , u ) T Φ ε ( t , x 0 , u ) d t .
If the system is smooth, then the empirical local observability converges to the local observability Gramian as ε 0 [41]. For SC bank system (13), Φ ε ( t , x 0 , u ) in (14) is
Φ ε ( t , x 0 , u ) = y + 1 y 1 , y + 2 y 2 , y + 3 y 3 ,
where
y ± 1 = C x x 1 ( 0 ) ± ε x 2 ( 0 ) x 3 ( 0 ) , u ( t ) + D u ( t ) + h b x 3 x 1 ( 0 ) ± ε x 2 ( 0 ) x 3 ( 0 ) , u ( t ) , y ± 2 = C x ( x 1 ( 0 ) x 2 ( 0 ) ± ε x 3 ( 0 ) , u ( t ) + D u ( t ) + h b x 3 x 1 ( 0 ) x 2 ( 0 ) ± ε x 3 ( 0 ) , u ( t ) , y ± 3 = C x x 1 ( 0 ) x 2 ( 0 ) x 3 ( 0 ) ± ε , u ( t ) + D u ( t ) + h b x 3 x 1 ( 0 ) x 2 ( 0 ) x 3 ( 0 ) ± ε , u ( t ) .
It can be proved that W o ε ( τ , x 0 , u ) is not full-rank. Specifically, when the leakage current is ignored, the first and second rows of the empirical observability Gramian matrix are identical, which leads to unobservability.
In the case of the SC bank system, by ignoring the leakage current, SOC can be regarded as solely a function of the input current and the initial value of SOC. Hence,
y ± 1 C x x 1 ( 0 ) ± ε x 2 ( 0 ) x 3 ( 0 ) , u ( t ) + D u ( t ) + h b x 3 x 3 ( 0 ) , u ( t ) , y ± 2 C x x 1 ( 0 ) x 2 ( 0 ) ± ε x 3 ( 0 ) , u ( t ) + D u ( t ) + h b x 3 x 3 ( 0 ) , u ( t ) , y ± 3 C x x 1 ( 0 ) x 2 ( 0 ) x 3 ( 0 ) ± ε , u ( t ) + D u ( t ) + h b x 3 x 3 ( 0 ) ± ε , u ( t ) .
By ignoring the effect of leakage discharge, it can be assumed that SOC depends only on the current and its initial value. Hence, the terms D u ( t ) and h b ( x 3 ( t ) ) are independent of the initial values x 1 ( 0 ) and x 2 ( 0 ) . As a result, y ± 1 and y ± 2 are affine linear functions of initial values x 1 ( 0 ) and x 2 ( 0 ) . Consequently, y ± 1 and y ± 2 are linear with respect to the difference in initial values x 1 ( 0 ) and x 2 ( 0 ) . Given that C = 1 1 0 and h b ( x 3 ) = h b / x 3 , and also knowing that ε 0 , (14) can be approximated by
W o ε ( τ , x 0 , u ) 1 4 ε 2 0 τ 2 ε ϕ 1 ( t ) 2 ε ϕ 2 ( t ) 2 h b ( x 3 ( t ) ) ε × 2 ε ϕ 1 ( t ) 2 ε ϕ 2 ( t ) 2 h b ( x 3 ( t ) ) ε d t .
Considering h b ( x 3 ( t ) ) as an input for states x 1 and x 2 , and applying the superposition principle for initial values and input values in a linear system, it can be inferred that the trajectory effects of the initial values x 1 ( 0 ) and x 2 ( 0 ) are ϕ 1 ( t ) and ϕ 2 ( t ) in (16). Note that no input excitation is considered, as only the effect of changes in the initial values on the output is being investigated (i.e., the effects of D u ( t ) and A 2 h b ( x 3 ( t ) ) are not included in this analysis):
ϕ 1 ( α ) ( t ) ϕ 2 ( α ) ( t ) = R 1 + R 2 R 1 R 2 C 1 0 0 0 R 1 + R 2 R 1 R 2 C 1 0 ϕ 1 ( t ) ϕ 2 ( t ) ϕ 3 ( t ) .
Thus,
ϕ 1 ( α ) ( t ) = ϕ 2 ( α ) ( t ) = ϕ ( α ) ( t ) = R 1 + R 2 R 1 R 2 C 1 ϕ ( t ) , ϕ ( 0 ) = 1 .
Hence, (15) can be rewritten as follows:
W o ε ( τ , x 0 , u ) 1 ε 2 0 τ ε 2 ϕ 2 ( t ) ε 2 ϕ 2 ( t ) ε 2 ϕ ( t ) h b ( x 3 ( t ) ) ε 2 ϕ 2 ( t ) ε 2 ϕ 2 ( t ) ε 2 ϕ ( t ) h b ( x 3 ( t ) ) ε 2 ϕ ( t ) h b ( x 3 ( t ) ) ε 2 ϕ ( t ) h b ( x 3 ( t ) ) ε 2 h b 2 ( x 3 ( t ) ) d t ,
which is not full-ranked.
In conclusion, although the leakage current has been ignored in this calculation, this approximation illustrates that the condition number of the empirical observability Gramian matrix, defined as the ratio of the largest singular value to the smallest, is large. In such cases, the output is significantly affected by a small change in the initial condition in one direction, which can overshadow the effect of a change in another direction, i.e., the state estimation problem is rendered ill-conditioned. In other words, whether R 2 is absent, rendering the system unobservable, or present, making the system weakly observable, a conventional observer alone may not provide accurate estimations, and some additional data and insights must be incorporated into the model to achieve reliable results.
In addition to the nonlinear analysis, linearization can also provide insight into the underlying challenge. Approximating the SOC–OCV relationship as a linear function results in the following linearized system:
C ¯ = 1 1 h b A ¯ = R 1 + R 2 C 1 R 1 R 2 0 1 R 2 C 1 h b 0 R 1 + R 2 C 1 R 1 R 2 0 η R 2 0 η R 2 h b
This system is observable if the observability matrix O = C ¯ T ( C ¯ A ¯ ) T ( C ¯ A ¯ 2 ) T T is full-rank. In the case study of this article, in which R 1 R 2 , O is as follows:
O 1 1 h b 1 C 1 R 2 + η R 2 h b 1 C 1 R 2 1 R 2 C 1 h b η R 2 h b 2 ( 1 C 1 R 2 ) 2 + h b η R 2 × ( 2 C 1 R 2 + η R 2 h b ) ( 1 C 1 R 2 ) 2 h b ( R 2 C 1 ) 2 + ( η R 2 ) 2 h b 3 + η R 2 2 C 1 h b 2
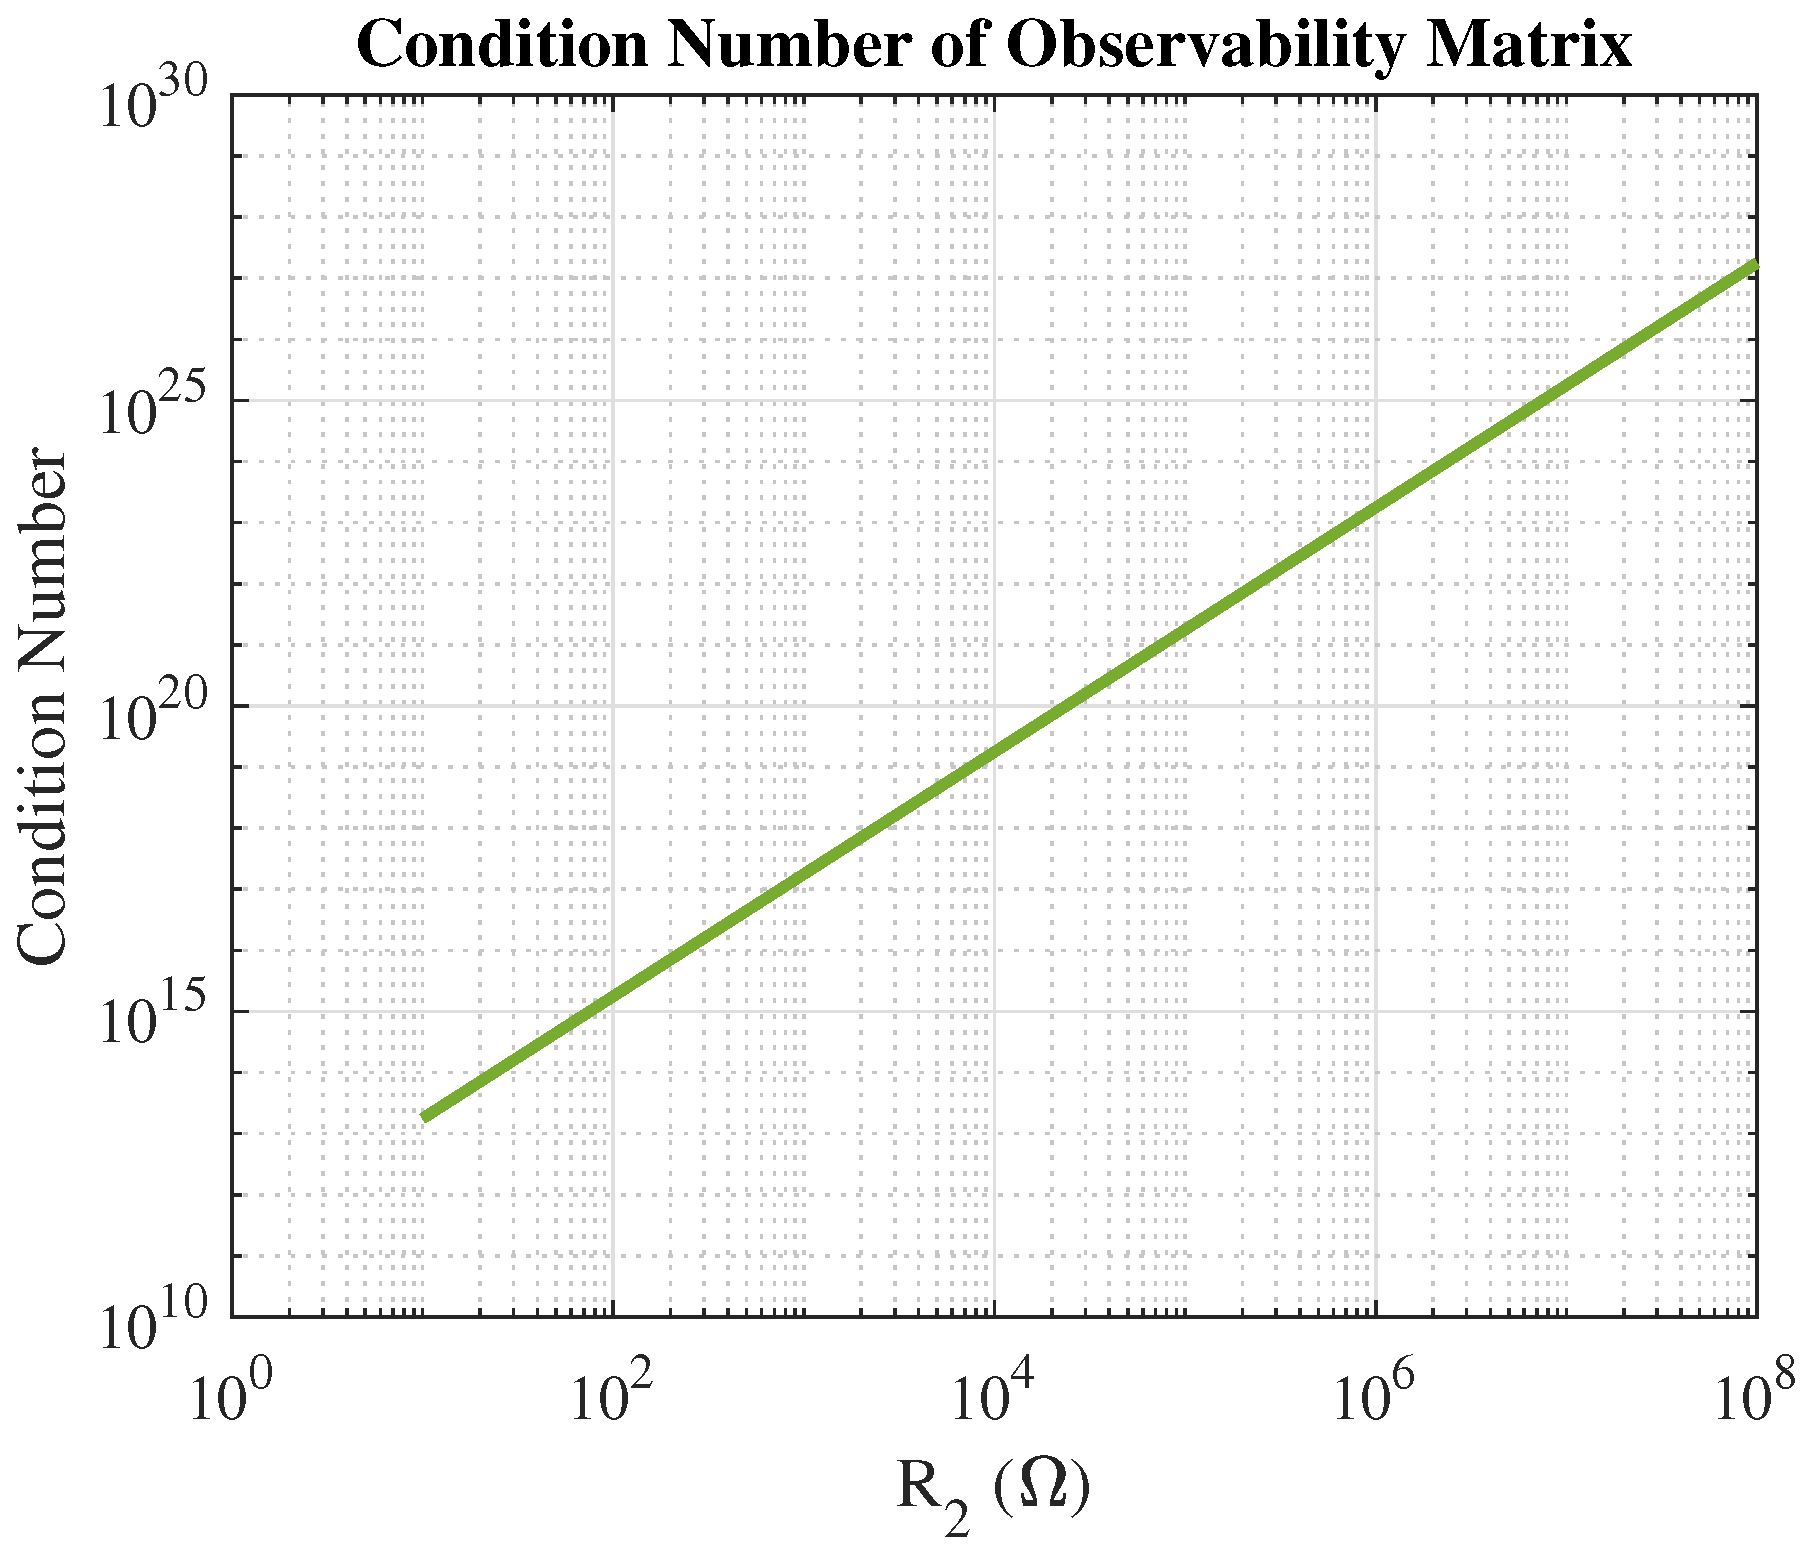
To determine whether the matrix is full-rank, its condition number can be evaluated, i.e., the condition number of a matrix is a common indicator of how close the matrix is to being rank-deficient. A higher condition number implies that the matrix is less invertible and more ill-conditioned. Figure 4 illustrates how the condition number varies with the magnitude of R 2 in this case study. As observed, the condition number increases with increasing R 2 , indicating a growing challenge in maintaining numerical observability. In addition, due to the differences in the orders of magnitude among the elements of the observability matrix, its condition number remains high even for smaller values of R 2 . An increase in R 2 escalates this condition.

5. Observer Design for the Weakly Observable System

As discussed in the previous section, the dynamic system of the SC bank is weakly observable. As a result, regular observers may not perform correctly. In this section, we attempt to implement a more specialized observer tailored to such systems. The designed observer is based on a generalized parameter estimation-based observer (GPEBO) introduced in [42], with specialization for weakly observable scenarios as discussed in [43]. As it is declared in [42], to exploit GPEBO, the system must be transformable to an affine-in-the-state form. In the following, it will be demonstrated that the SC bank dynamics can be transformed into an affine-in-the-state form:
ξ ( γ ) = Λ ( u , y ) ξ + Ω ( u , y ) .
To construct this structure for the SC bank dynamics, h b ( x 3 ) should be extracted from y:
h b ( x 3 ) = y C x D u .
Now, h b ( x 3 ) can be substituted with the above term in the state dynamics:
x ( γ ) = A 1 x + B u + A 2 h b ( x 3 ) , x ( γ ) = ( A 1 A 2 C ) x + ( B A 2 D ) u + A 2 y .
Comparing the above equation with (21), it can be concluded that
Λ = ( A 1 A 2 C ) = 1 R 1 C 1 1 R 2 C 1 0 0 R 1 + R 2 C 1 R 1 R 2 0 0 η R 2 0 ,
Ω ( u , y ) = ( B A 2 D ) u + A 2 y = 1 C 1 + R 0 R 2 C 1 k C 1 η + η R 0 R 2 u + 1 R 2 C 1 0 η R 2 y .
Therefore, (24) and (25) demonstrate the applicability of GPEBO to the SC bank dynamics. The above subsystem serves as a “copy” of the original system, generating state variables based on the model, inputs, and outputs. In addition, the observer system requires a critical subsystem to adjust the estimation error defined as
e = x ξ .
By defining e ( t ) = ϕ ( t ) θ , where θ = e ( 0 ) is treated as an unknown parameter, and referencing (26), the estimated state can be expressed as
x ^ = ξ + e = ξ + ϕ θ .
In the above equation, ξ is generated by the “copy” subsystem (21), θ is identified as an unknown parameter, and  ϕ is derived from the error dynamics as follows:
e ( γ ) = Λ e ,
ϕ ( γ ) θ = Λ ϕ θ ,
ϕ ( γ ) = Λ ϕ ,
in which ϕ ( 0 ) equals I 3 , an identity matrix of size 3 × 3 .
This dynamic generates ϕ , which is used in (27). The variable y ˜ is formulated as
y ˜ = y y ^ = C x + D u + h b ( x 3 ) C ξ D u h b ( ξ 3 ) .
In the case of the SC bank system, since h b ( x 3 ) exhibits a semilinear behavior and its derivative is approximately constant, for simplicity, the equation can be rewritten as
y ˜ 1 1 h b ( x ^ 3 ) ϕ θ = L ϕ θ ,
where L = 1 1 h b ( x ^ 3 ) .
As can be seen, all the steps from (21) to (32) remain valid for fractional-order dynamics, although the approach in [42] was originally proposed for integer-order dynamics.
Finally, with defining Ψ = L ϕ and applying the least-squares method to (32), parameter estimation θ straightforwardly can be obtained as the following:
θ ^ ( t ) = 0 t Ψ Ψ T d τ 1 0 t Ψ T y ˜ d τ .
However, in the case of the SC bank system, where the system is weakly observable, the condition number of the observability Gramian is large, making the calculation of its inverse matrix inaccurate. Thus, in addition to the observability Gramian matrix 0 t Ψ Ψ T d τ , some additive information is necessary to solve the state estimation based on the input and output trajectories. The next subsection tries to add this information.

Regularization Law

In a weak observability scenario with noise, the system function is described as a non-injective function, meaning that several combinations of state variable values could correspond to the same output. Considering Ψ is a strongly convex function ψ ( · ) , along with the natural gradient-like adaptation law, these equations can be written [43]:
θ ^ ˙ = 2 ψ ( θ ^ ) 1 P Ψ T ( y ˜ Ψ θ ^ ) ,
P ˙ = P Ψ T Ψ P , P ( 0 ) = P ( 0 ) T > 0 ,
in which θ ^ is an estimate of θ and 2 is the Hessian operator, which is the transpose of the Jacobian matrix of the gradient of a function. y ˜ and Ψ are as defined in (31) and (33), respectively. P ( 0 ) is an arbitrary positive definite matrix. The estimation converges to the value θ ^ that minimizes the convex function ψ ( · ) . Intuitively, the function ψ ( · ) serves as a potential function that incorporates additional prior information, such as expected behavior or constraints of the system, to improve the robustness of the state estimation. This helps to regularize the estimation process, making the problem more well-posed even in weakly observable scenarios with noise. By minimizing ψ ( · ) , the observer effectively filters out uncertainties and noise, improving the accuracy of state estimates and ensuring more reliable convergence of the observer in practical applications. In the following, an appropriate ψ ( · ) will be derived for the dynamics of the SC bank. It should be noted that this adaptation law is independent of the state dynamics, making it applicable regardless of whether the system follows integer-order or fractional-order dynamics.
The relation between v 1 and v 2 is obtained using the superposition law in the SC bank model, as shown in Figure 5. The superposition law is demonstrated in this figure in two parts: one considering the blue components and the other considering the red components. In the case of the blue circuit, by neglecting the leakage effect of N E 0 through R 2 , the value of v 1 can be disregarded; v 2 is also zero because there passes no current through the v 2 branch. In the case of the red circuit, the relation v 2 = k v 1 holds, since the impedance of the v 2 branch is k times the impedance of the v 1 branch, and the same current passes through the branches. An approximate equation can be expressed as v 2 k v 1 . Using this information, the convex potential function ψ ( · ) can be defined to incorporate this constraint, ensuring that the estimation problem is no longer ill-conditioned. Thus, the function ψ ( · ) can be formulated as
ψ ( θ ) = 1 2 ( 2 + k 2 ) θ 2 k θ 1 θ 1 θ 2 θ 3 2 2 ,
where θ i = x i ( 0 ) ξ i ( 0 ) for i = 1 , 2 , 3 is the initial error of state estimation for the three states of the system. The term θ 2 k θ 1 in the cost function ψ ( θ ) ensures that the optimal value of θ 2 = k θ 1 will be met. Minimizing this cost function ψ ( · ) ensures that the estimation process respects the system’s weakly observable nature and provides a stable, well-posed solution despite the ill-conditioned problem. With reference to (36), the Hessian matrix of the function ψ ( · ) can be expressed as
2 ψ ( θ ^ ) = 1 2 + k 2 1 + k 2 k 0 k 2 0 0 0 1
and the inverse form is
2 ψ ( θ ^ ) 1 = 2 k 0 k 1 + k 2 0 0 0 2 + k 2 .
Figure 1 presents the conceptual diagram of the proposed observer, illustrating the strategy used to address the challenge of unobservability. The red-highlighted components represent the key novel elements introduced to resolve this issue.
The space and time complexities are of great importance for any real-time implementation. The computational complexity of the proposed method is manageable for real-time implementation on the microcontroller. Taking the truncation number of the GLD approximation as N = 100 , in the worst case, the GLD approximation requires 6 × 60 N CPU cycles, which equals 180 μs on a 200 MHz CPU—significantly less than the required sampling time of 1 s. Moreover, considering that each float occupies 4 bytes of memory, the GLD computation demands 4 × 2 × N × 2 bytes of memory. Taking N = 100 leads to the allocation of 1600-byte memory, which is much less than the memory of today’s microcontrollers and DSPs. For the implementation, the following steps should be taken:
  • The observer should be discretized.
  • A proper number of samples should be chosen for truncation of the Grunwald–Letnikov Derivative (GLD); for this system, depending on the processor speed and RAM, 10 to 100 samples provide sufficient accuracy while keeping the computational burden low.
  • Based on the the characteristics of E 0 = h b ( S O C ) and using the Newton–Raphson method, the initial value of S O C is calculated.
  • A timer with a period of 1 sec is activated. Every 1 s, the following routines will be executed:
    -
    The new data of voltage and current get updated.
    -
    The voltage and currents of the 10–100 latest samples should be saved by shifting the old samples and entering the new sample.
    -
    One round of the discretized observer is executed.
    -
    New state estimations can be extracted from the new run of the observer.
    -
    The state variables of the 10–100 latest samples should be saved by shifting the old samples and entering the new sample.
A quantitative analysis of the truncation error in the Grünwald–Letnikov (GLD) approximation is presented in Table 1. The system is simulated using the continuous-time fractional integral as well as various truncated discretized variants of the integral. The error is computed by comparing the results of the truncated and discretized simulations against those obtained from the continuous-time model. As can be seen, even the 10-term truncated approximation demonstrates promising accuracy.

6. Experimental Results

6.1. Test Setup

To validate the proposed approach experimentally, a 58,000 mF, 16.2 V supercapacitor is employed. The setup incorporates essential measurement instruments for applying input current and recording output voltage, enabling precise data collection for state estimation, as detailed in Table 2. Following the methodology in [44], data acquisition is conducted using specialized equipment connected via a GPIB interface. The experimental configuration is depicted in Figure 6. The supercapacitor module used is a Maxwell BMOD0058 E016 B02, Maxwell Technologies, San Diego, CA, USA, comprising six series-connected BCAP0350 E270 T11 cells, Maxwell Technologies, San Diego, CA, USA, each rated at 350 Farads and 2.7 V.

6.2. Test Procedure

The system identification is performed using training data consisting of a one-minute charging or discharging pulse followed by a three-hour rest period. This long-term pulse train input allows the system to settle and provides sufficient data for accurately capturing the dynamic behavior of the SC bank. This is essential for both the derivation of S O C and the identification of large time-constant-related parameters such as R 2 and C a h . The details are as follows.

6.2.1. Pulse Train Charging Mode

  • Current injection: A pulse train of 1 A charging current, with an active duration of 1 min followed by a 279 min rest period, is injected into the SC bank. The current setpoint is continuously transmitted from MATLAB to the DC power supply via GPIB.
  • Rest mode: During the rest period, the diodes between the power supply and SC bank prevent the SC from discharging through the power supply output.
  • Voltage measurement: The DC voltage across the SC bank is measured using a multimeter, controlled by measurement commands sent from the computer. The internal leakage resistance of the multimeter is approximately 10 M Ω , which is sufficiently high to avoid significant disturbance to the SOC or the measurements.
  • Current measurement: The current injected into the SC bank is measured by the SC power supply via a GPIB query command. The power supply current measurement is calibrated beforehand and exhibits an accuracy of 1%.
  • Data logging: The measured voltage, current, and corresponding time stamps for each sample are recorded and stored in a .txt file for further analysis inside MATLAB software.

6.2.2. Pulse Train Discharging Mode

  • Current draw: A pulse train of 0.5 A discharging current, with an active duration of 1 min followed by a 279 min rest period, is drawn from the SC bank. The current setpoint is continuously transmitted from MATLAB to the DC electronic load via GPIB. Due to the higher time constant of redistribution voltage in discharge mode and the slower redistribution dynamics in discharge mode, a lower current pulse is used for discharge mode.
  • Rest mode: During the rest period, the relay between the SC bank and the load is de-energized, preventing any discharge through the power supply or electronic load. The relay coil is controlled via a GPIB-connected power supply.
  • Voltage measurement: The DC voltage across the SC bank is measured using a multimeter, with measurement commands sent from the computer to the multimeter.
  • Current measurement: The current drawn by the SC bank is measured by the electronic load via a GPIB query command.
  • Data logging: The measured voltage, current, and corresponding time stamps for each sample are recorded and stored in a .txt file for further analysis.

6.2.3. Sawtooth Charging and Discharging Mode

  • This mode is intended to verify the identified parameters and evaluate the performance of the observers.
  • Current injection: A repetitive sawtooth current with an amplitude of 20 mA is injected into the SC bank. The current waveform is applied at multiple frequencies, 1/10, 1/20, 1/15, and 1/5 Hz, with the objective of increasing the SC bank voltage from 8 V to 10 V. Voltage, current, and corresponding time stamps are recorded at a sampling interval of 1 s. In other separate tests, the current amplitude is increased to 200 mA and 10 A.
  • Current draw: A repetitive sawtooth current with an amplitude of 20 mA is drawn from the SC bank. The current waveform is applied at multiple frequencies, 1/10, 1/20, 1/15, and 1/5 Hz, with the objective of decreasing the SC bank voltage from 10 V to 8 V. Voltage, current, and corresponding time stamps are recorded at a sampling interval of 1 s. In other separate tests, the current amplitude is increased to 200 mA and 10 A.
  • Rest mode: The voltage across the SC bank is monitored and recorded continuously over a rest period.

6.3. Test Results

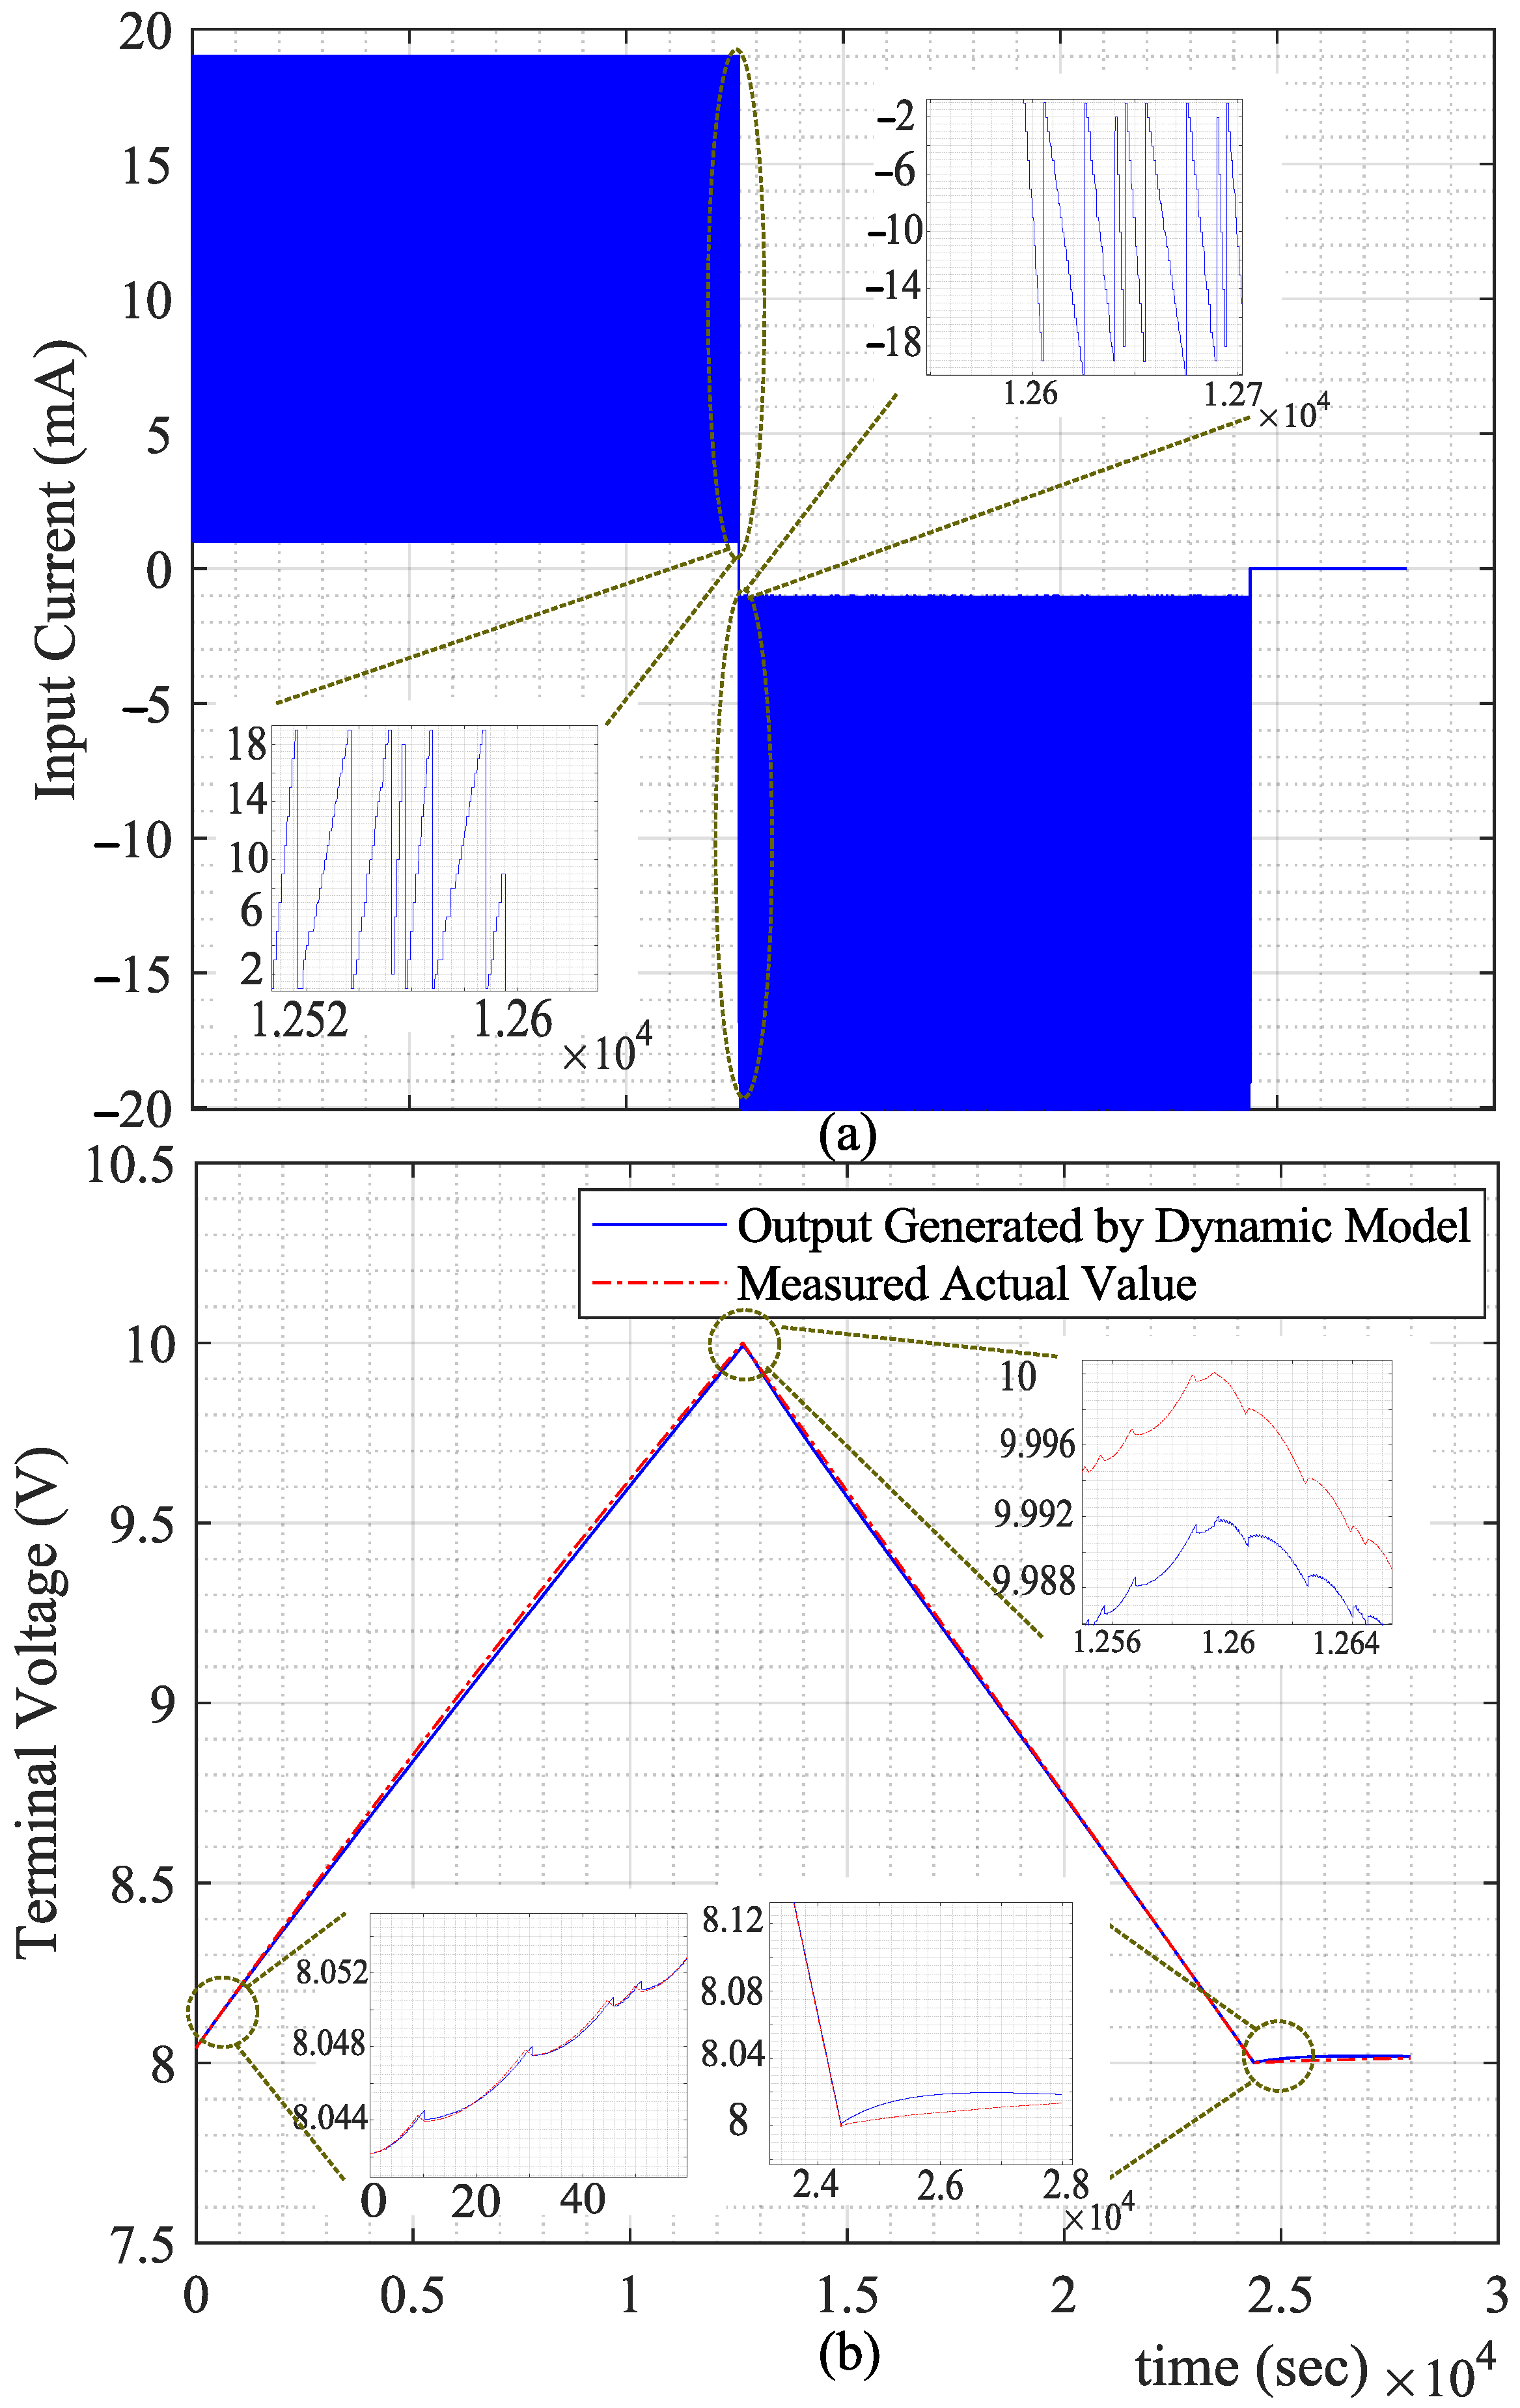
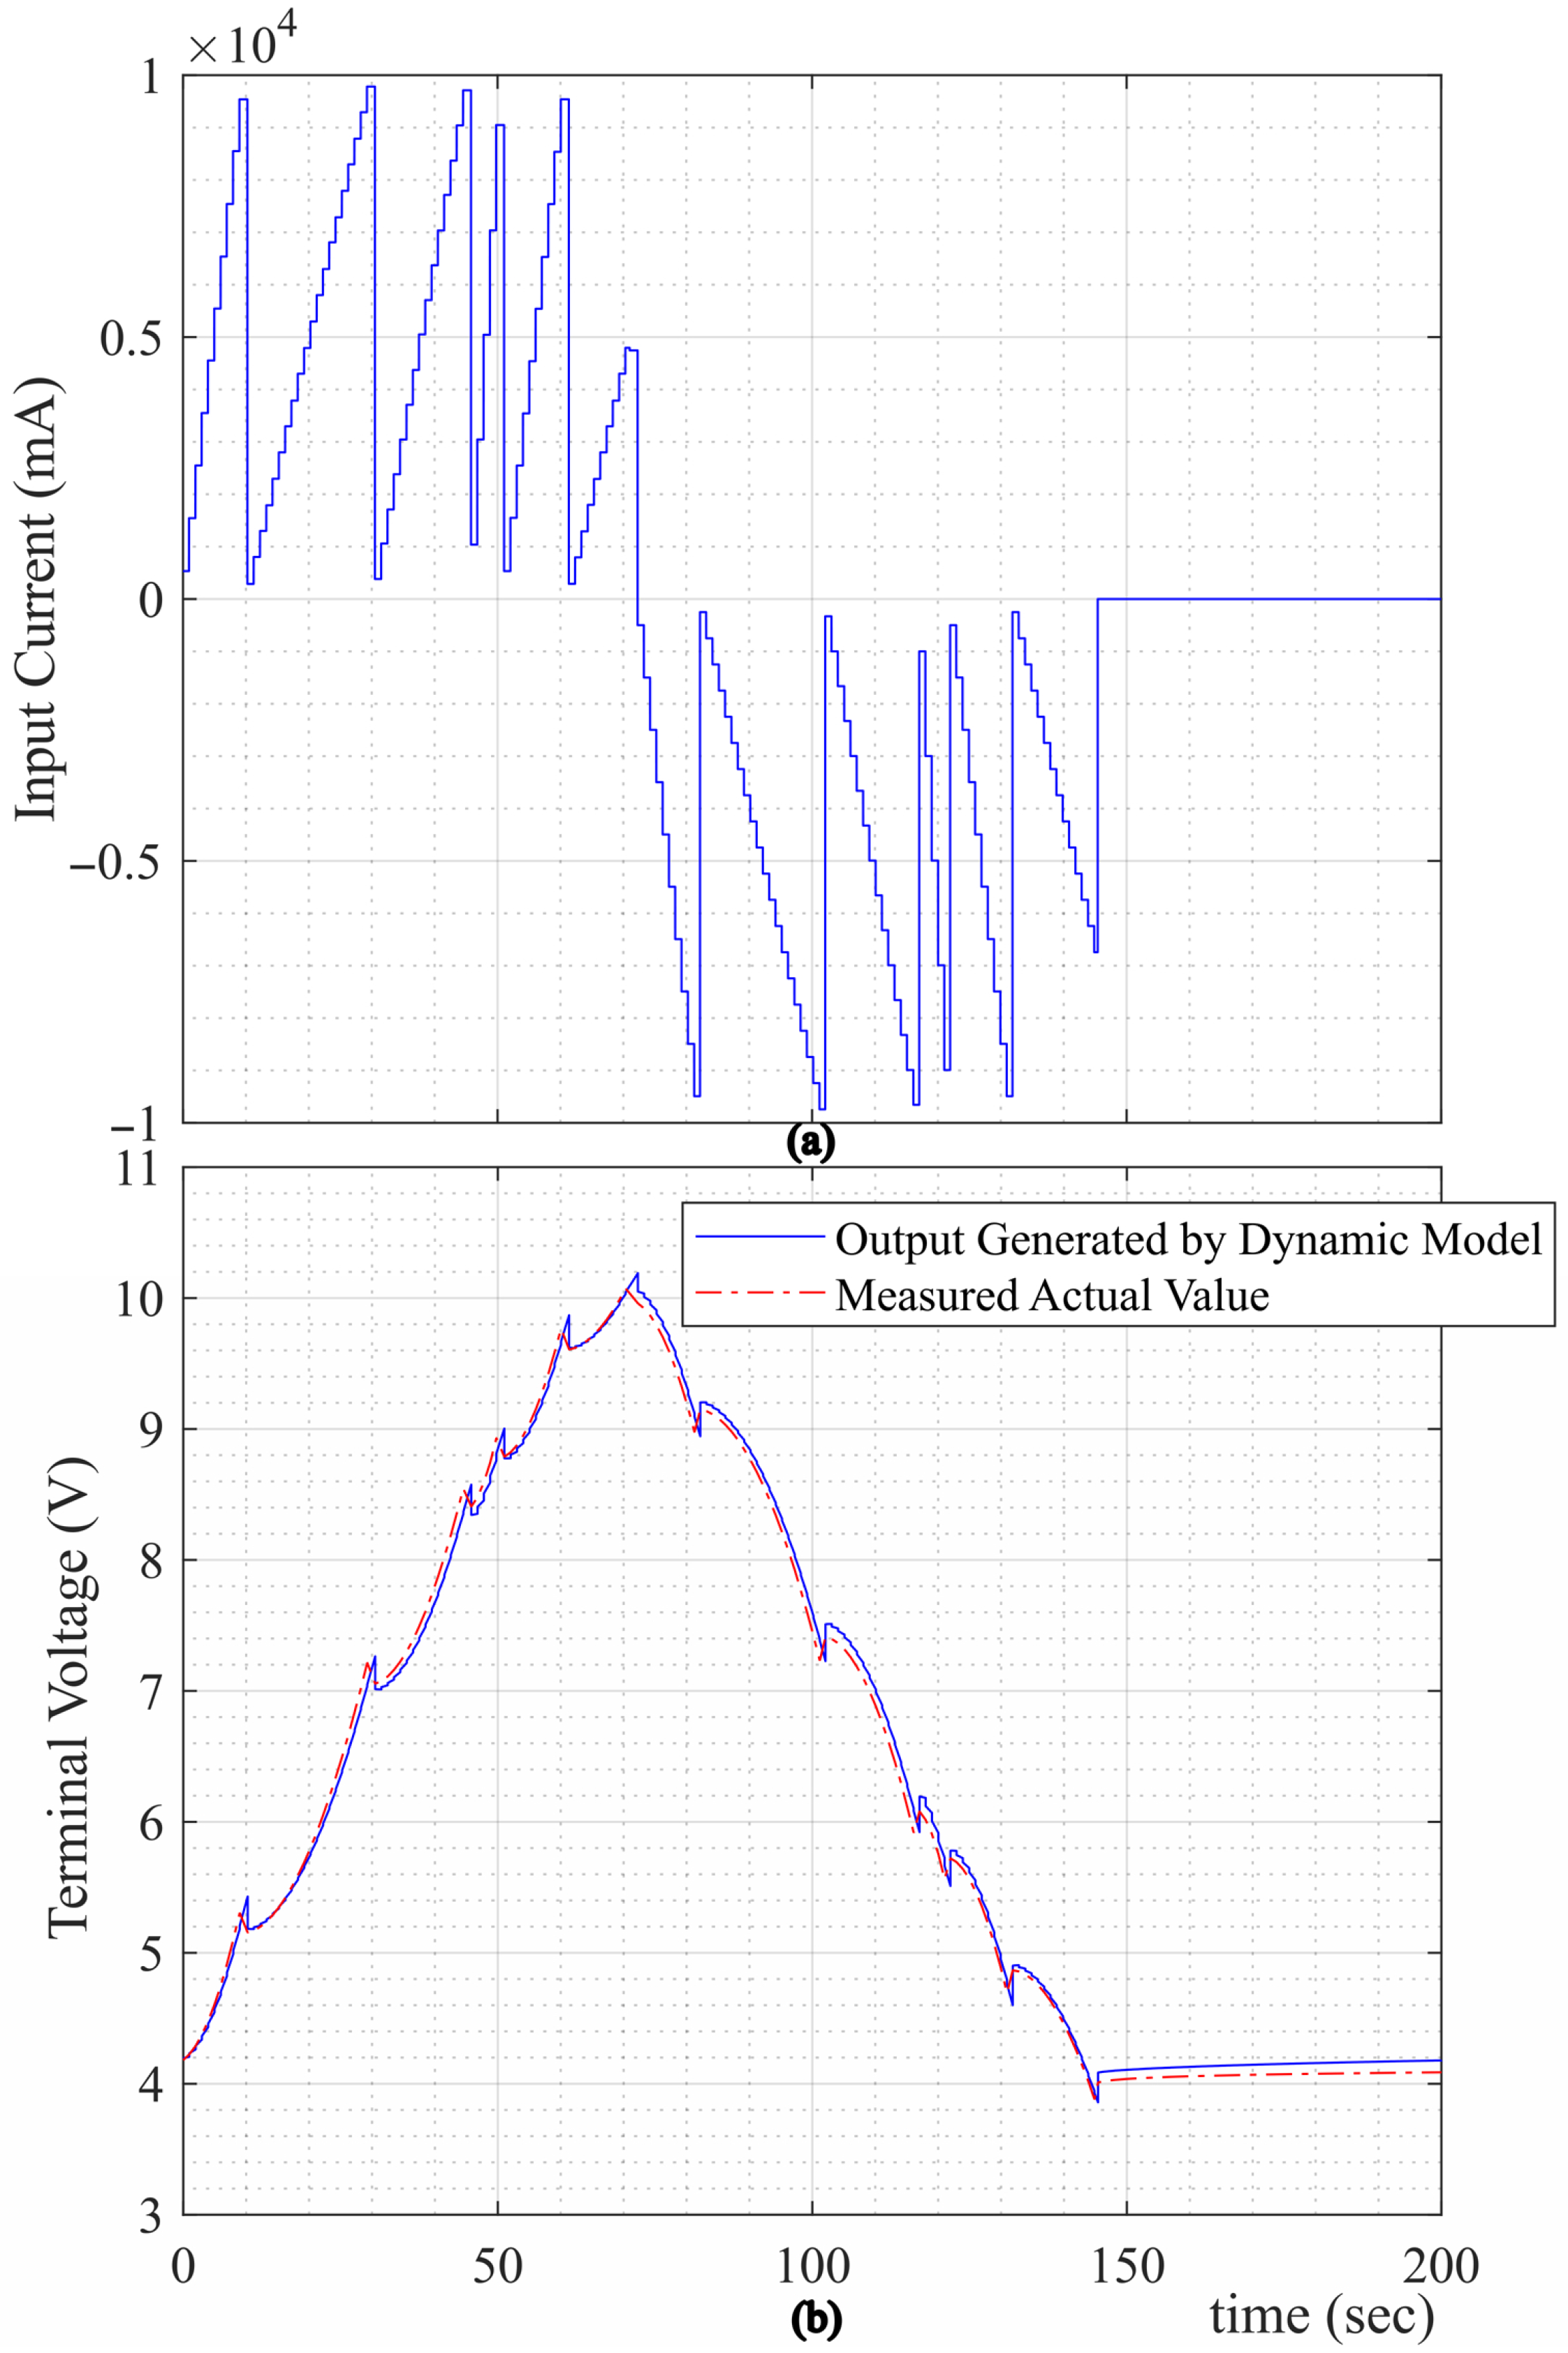
Before evaluating the proposed observer, the identified model should be verified. Figure 7a depicts a scenario of applied current to the SC bank during charging, discharging, and rest modes. Figure 7b illustrates the corresponding measured voltage of the SC bank as well as the output of the identified model. The focused comparison of actual measured voltage and the identified model output in Figure 7b provides insight into the accuracy of our identified model.
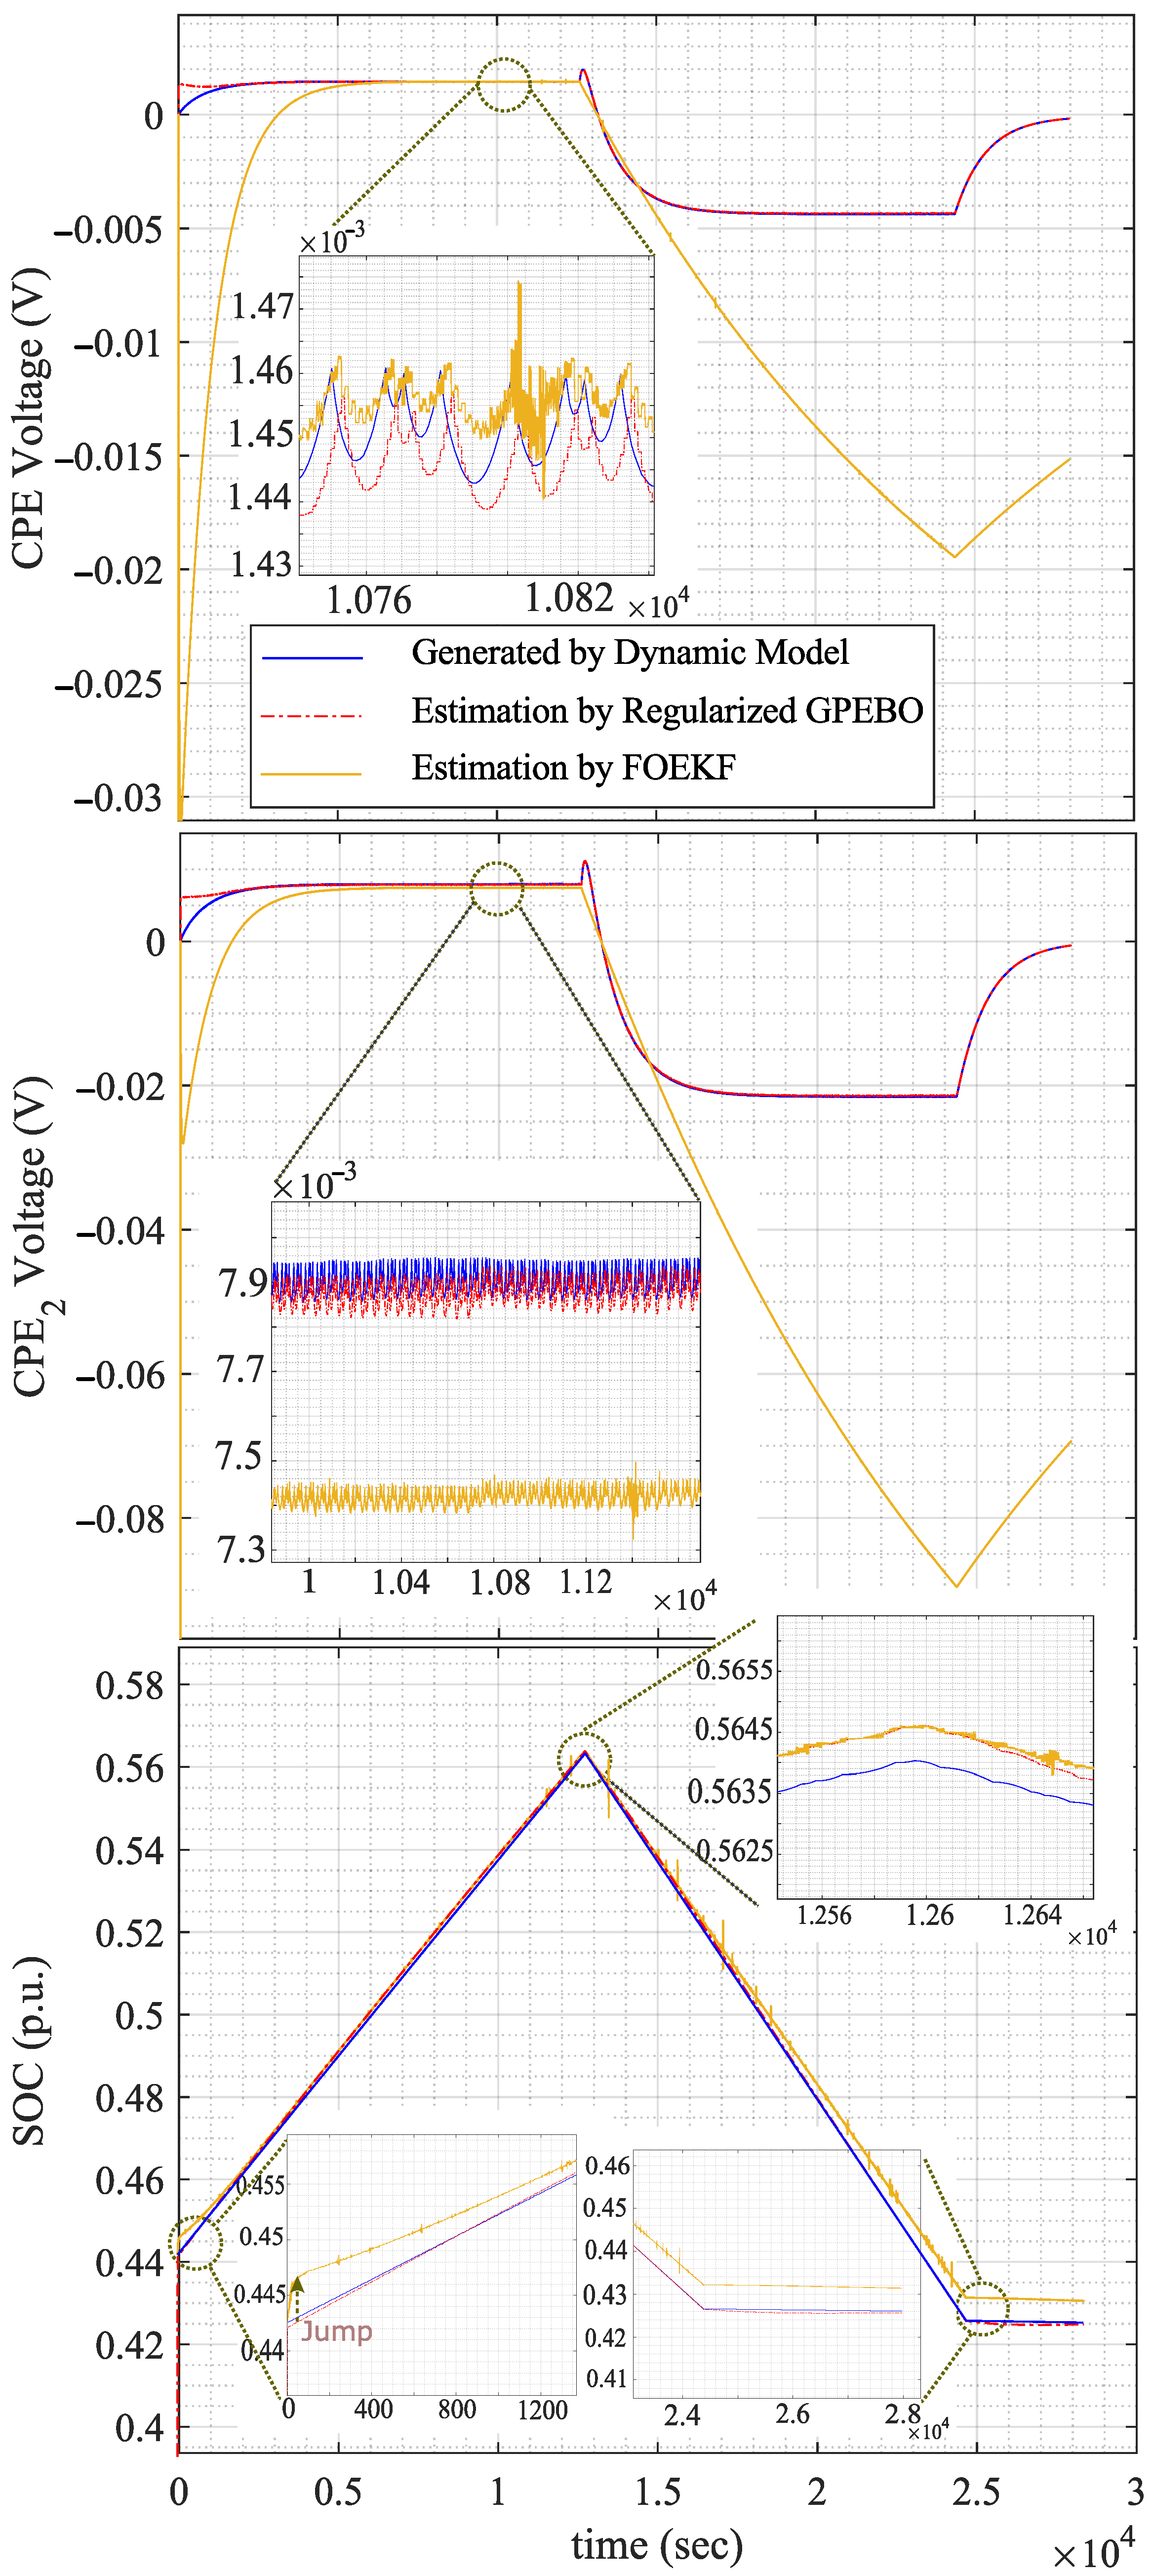
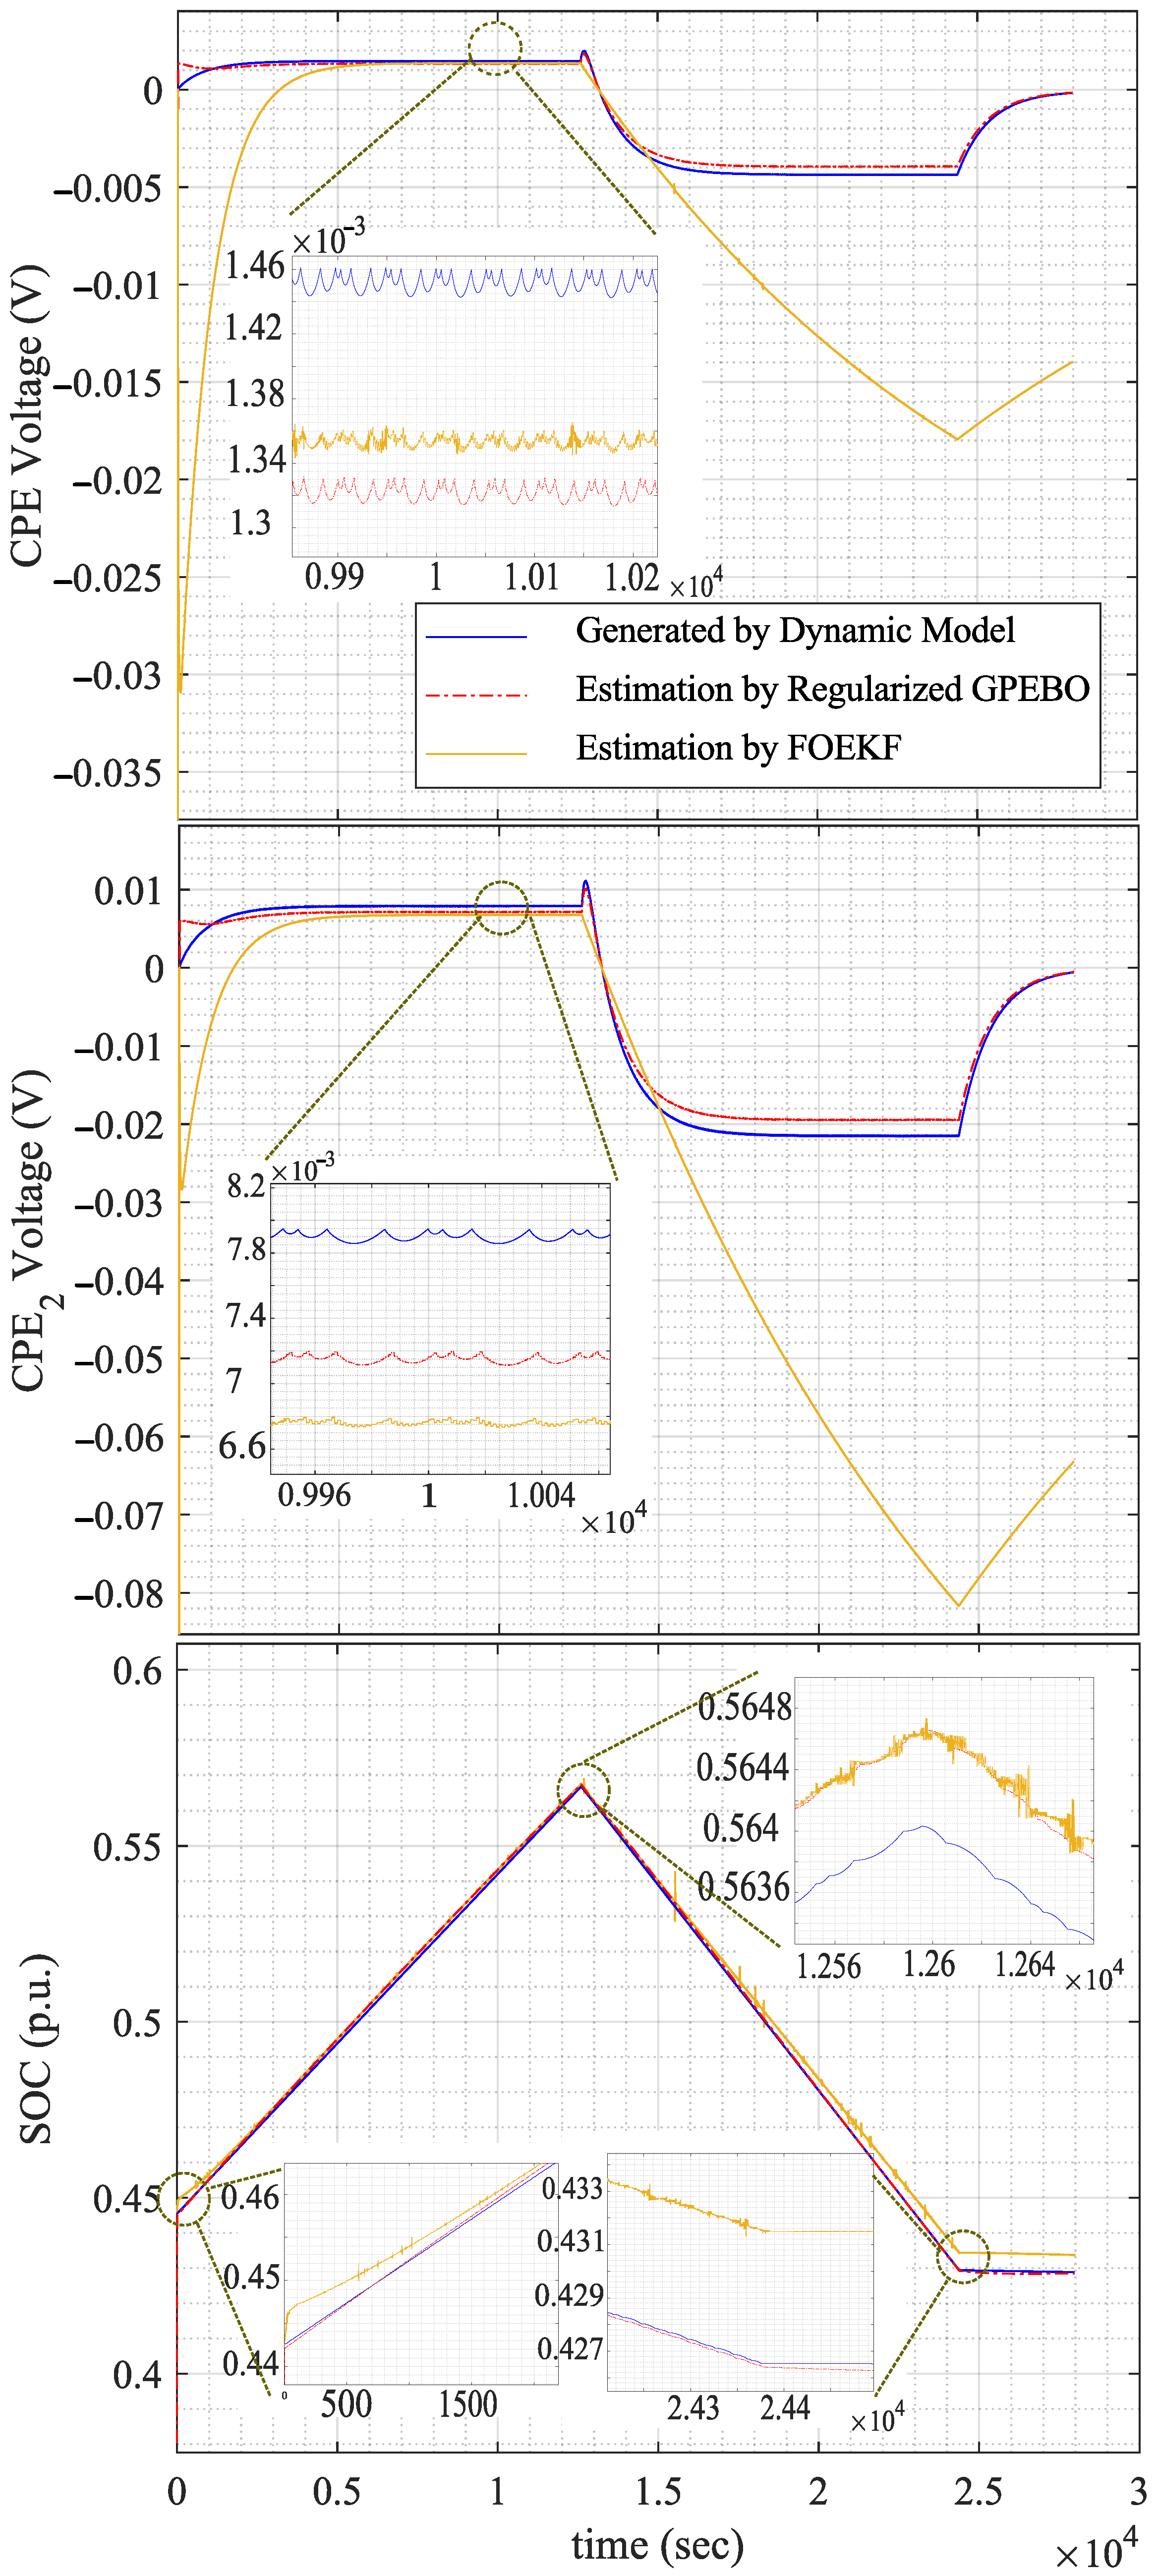
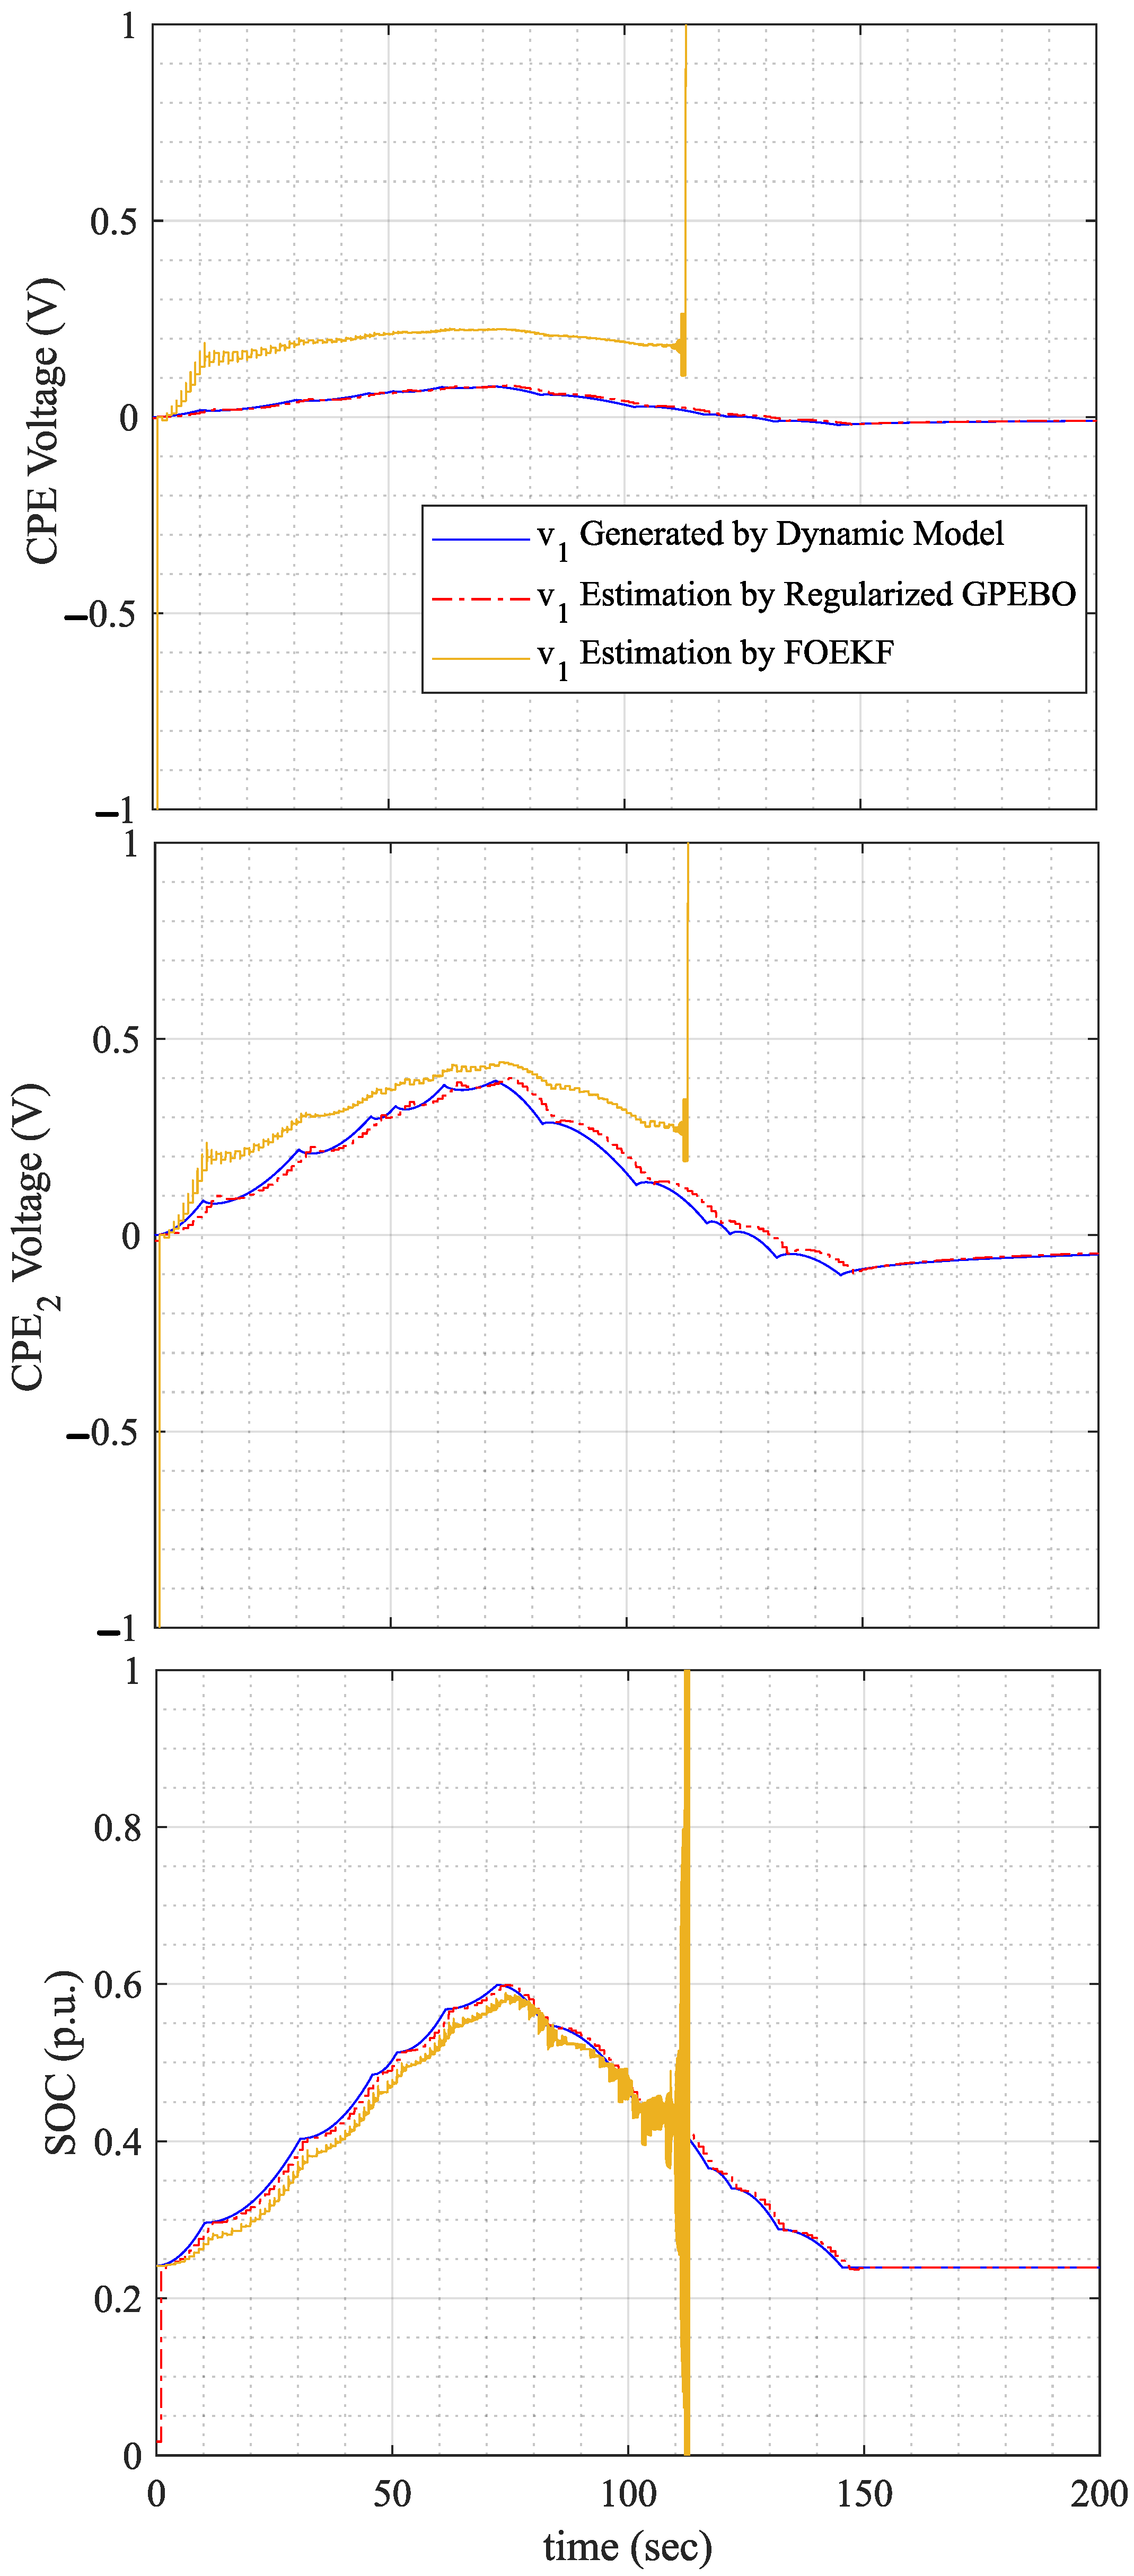
In the following, the estimation results of the regularized GPEBO are compared with those obtained from the FOEKF. The FOEKF for a single-cell SC is detailed in [25]. However, the FOEKF used in this article is specifically tailored to the system dynamics of the SC bank, as given in (13). All the state estimations in this section are based on the actual applied current and the actual measured voltage collected from the experimental setup. As the state variables are not physically measurable, to have an insight into and criteria for how precise these estimators are, the state variables generated by the identified dynamic model are also depicted. To this end, the same current in Figure 7a is applied to the model and the model state variables are monitored. This comparison is more helpful for the analysis when there are noted deviations in initial values or uncertainty in the parameters of the observers.
Figure 8 illustrates the state estimations obtained using the regularized GPEBO and the FOEKF in normal condition, i.e., neither initial condition errors nor parameter uncertainties are regarded. One method used for estimator evaluation in the normal condition is to check the estimates with the expected physical behavior of the SC bank. During any limited amplitude charging or discharging current, it is expected that the SOC changes continuously without any discontinuities. However, the SOC estimated by the FOEKF exhibits a discontinuity at the start of the estimation process. This discontinuity indicates a potential shortcoming in the FOEKF approach. In addition, since the SC had been in the rest for a long time before the test, there should be no redistribution charge in the ECM, i.e.,  v 1 ( 0 ) = 0 and v 2 ( 0 ) = 0 . This is while the FOEKF has estimated the states x 1 and x 2 with some initial values.
For both observers, the cells are assumed to be fully balanced. In reality, the Battery Management System (BMS) keeps the cells balanced; however, due to aging or potential physical damage, there is a possibility that cell voltages may become significantly unbalanced. In such scenarios, we assume that the SoH monitoring system will intervene and rescale the estimated SoC based on the SoC of the weakest (lowest-voltage) cell. This aspect is beyond the scope of this paper and can be explored in future research.
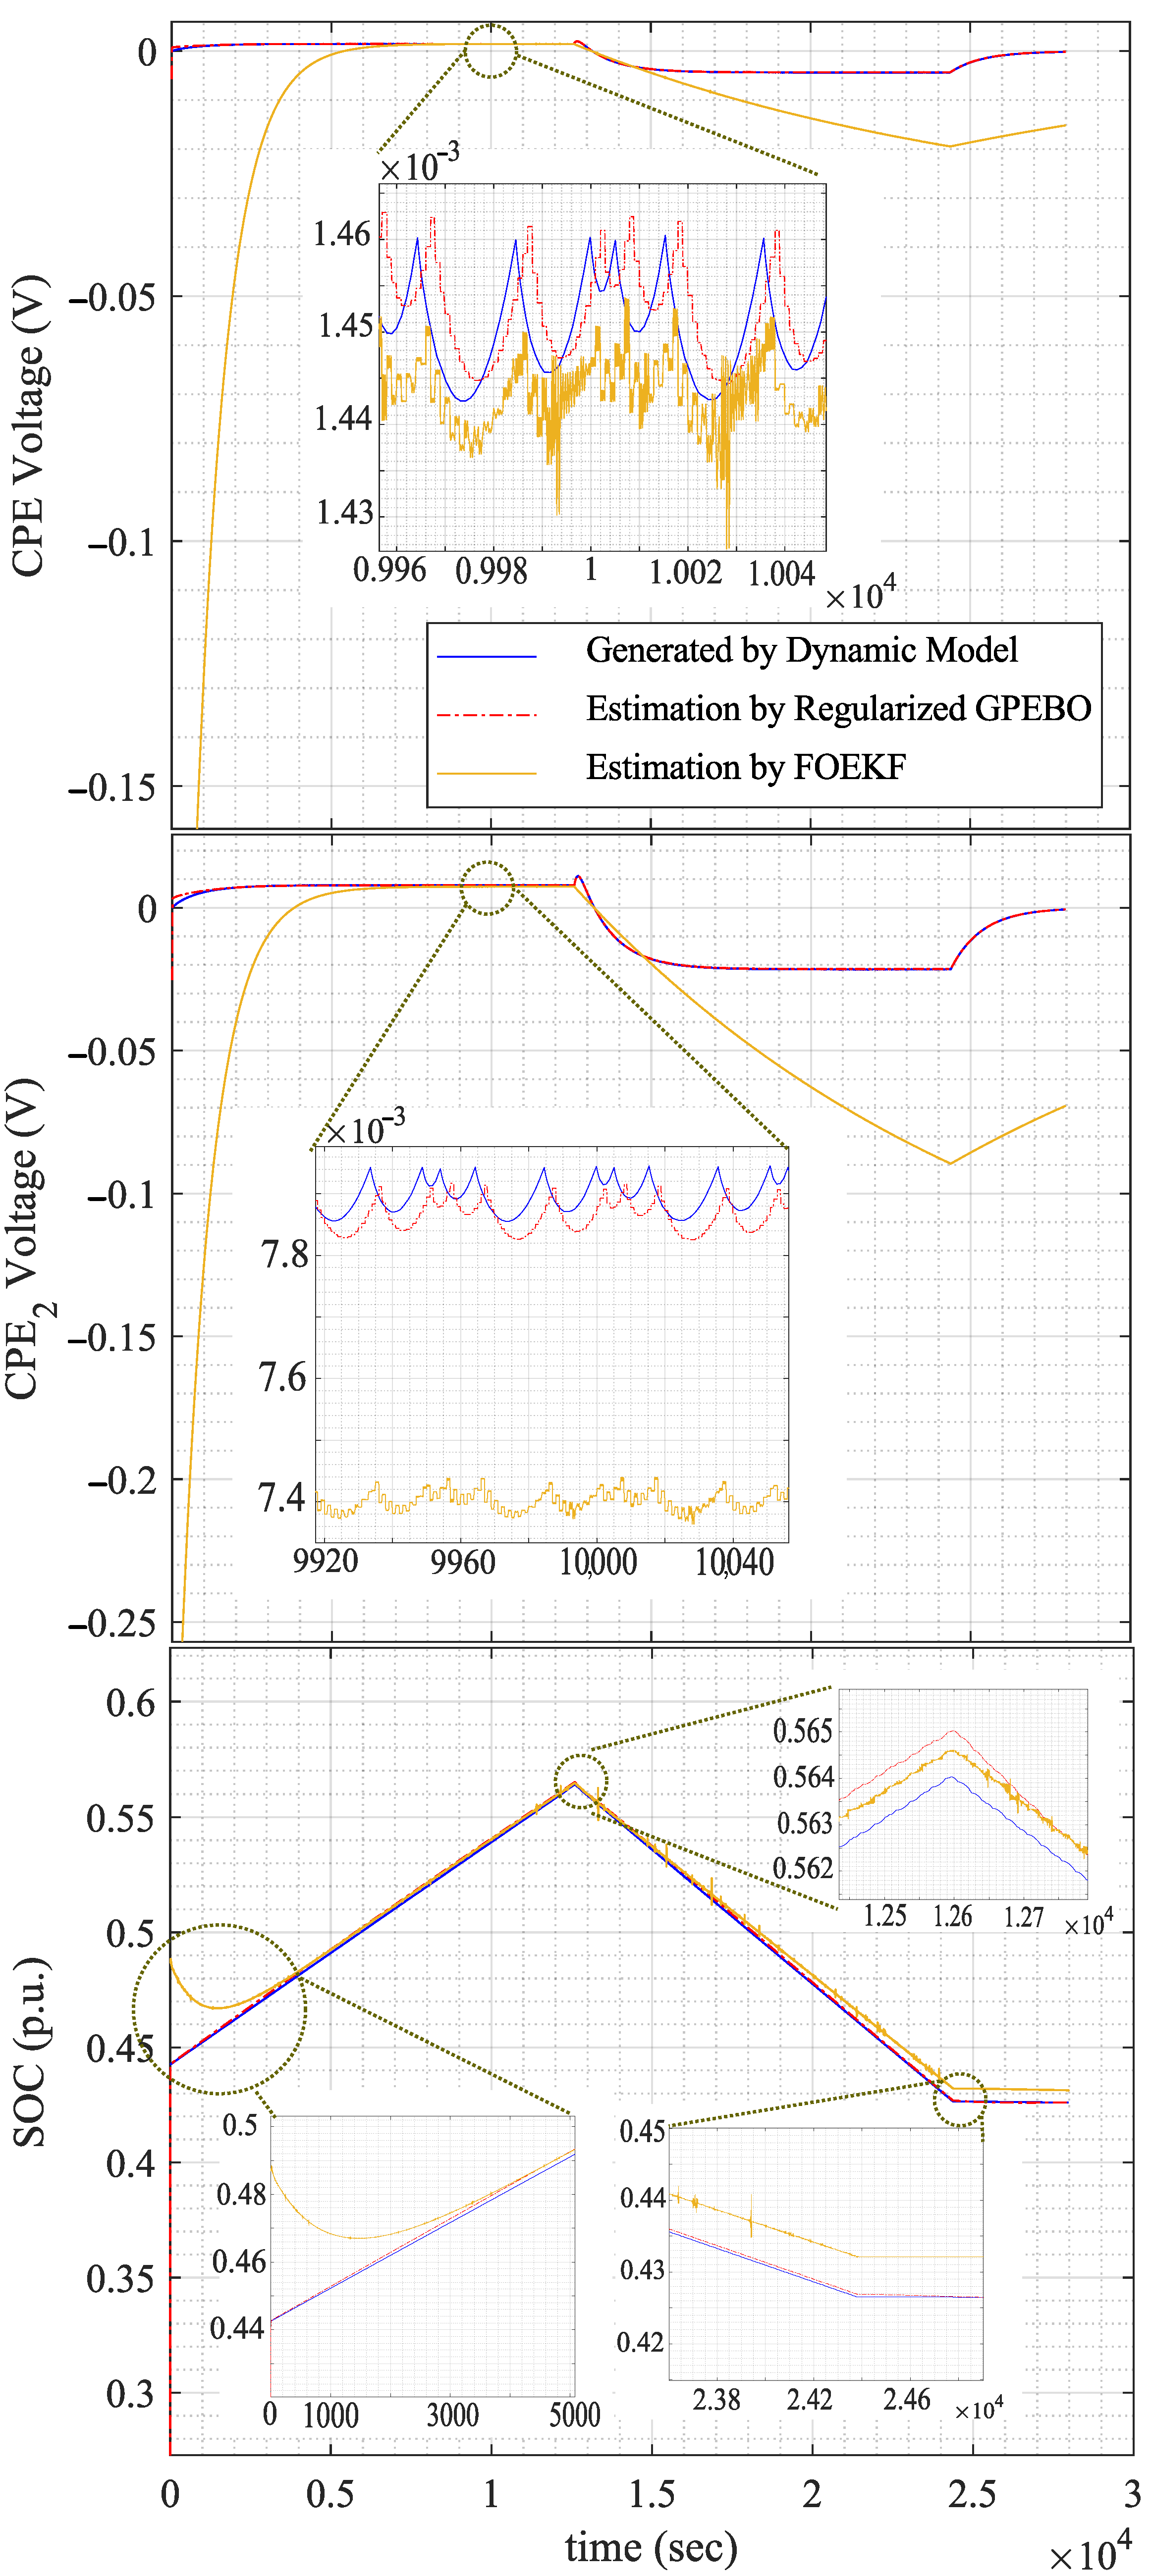
Figure 9 illustrates the estimations obtained using the regularized GPEBO and FOEKF when the SOC initial value is perturbed by a 10 % error. The state variables are used as a benchmark to evaluate the accuracy. The results highlight the robustness of the regularized GPEBO in handling errors in the initial SOC value. While the FOEKF responds slowly to achieve accurate state estimation, the regularized GPEBO demonstrates a fast recovery and produces accurate estimations. This highlights the advantage of the regularized GPEBO in scenarios with uncertain initial conditions.
Figure 10 illustrates the estimates generated by the regularized GPEBO and FOEKF in the presence of an uncertainty of 10 % in the observer parameters. Similar to Figure 9, the state variables of the model are used as the measure for the evaluation. The regularized GPEBO demonstrates a 10 % estimation error for x 1 and x 2 while achieving promising accuracy in the estimation of SOC. In contrast, the FOEKF exhibits estimation errors for x 1 and x 2 that are comparable to those of the proposed observer; however, its SOC estimation error is several times greater than that of the regularized GPEBO. This highlights the resilience of the proposed observer to parameter inaccuracies, maintaining its ability to closely track the actual state variables despite the 10 % error in its parameters.
Figure 11 and Figure 12 illustrate the estimates generated by the regularized GPEBO and FOEKF with the input amplitude of 200 mA and 10 A, which are 10 and 500 times greater than the previous tests. Figure 13 shows the respective input–output for the applied current with 10 A amplitude. The regularized GPEBO demonstrates its ability to closely track the actual state variables. In contrast, the FOEKF struggles significantly, producing estimates that deviate considerably from the true state values. This highlights the robustness of the regularized GPEBO against different operating conditions, making it a more reliable choice in practical applications where operating conditions are not defined. Also, it can be seen that the performance of the FOEKF for all three state dynamics is affected. As it is defined in control theory, observability is a property of the entire system model rather than individual states.
It is worth noting that the inclusion of R 2 in the three-state model is what weakens the system observability. If the leakage resistance R 2 is completely disregarded in the model, the three-state system can be reduced to two independent two-state models, which are minimal and fully observable. However, retaining the three-state model while disregarding R 2 results in an unobservable system. When R 2 is included, the three-state model becomes weakly observable. Since the three-state model provides a significantly more accurate representation of actual data compared to the two-state model, the gain in accuracy justifies the challenge of handling a weakly observable system. Additionally, this model enables more precise long-term variable estimation by accounting for the self-discharge of the bank through R 2 .
The quantitative analysis of the performance of FOEKF and regularized GPEBO is presented in Table 3. The selected evaluation metrics include the initial SOC estimation error, the convergence time required for SOC to reach its true value within a 0.1% tolerance, and the Mean Squared Error (MSE) of SOC estimation.
In conclusion, in all the studied scenarios, the estimation by the regularized GPEBO is more accurate and robust than that of the FOEKF. In addition, the spikes observed in the Kalman filter estimation are an inherent drawback of such filters, which has led to instability in the last case.

7. Conclusions

This article presented an approach to fractional-order modeling of SC banks using the ECM framework. The Thevenin equivalent circuit of a single SC cell is first derived. Based on this, the Thevenin equivalent of a series–parallel combination of cells is determined. Finally, the ECM of the SC bank is extracted from its Thevenin equivalent. An empirical observability analysis highlighted that the dynamic model is weakly observable, which introduces serious challenges for state estimation. This weak observability primarily arises from the significant differences in the orders of magnitude among the parameters. To tackle this issue, an implicit regularization law was developed and applied to the Generalized Parameter Estimation-Based Observer to handle weak observability problems. The study demonstrates that conventional observers, like the fractional-order extended Kalman filter, struggle to provide accurate state estimates due to the system weak observability. However, the proposed observer significantly outperforms the FOEKF, successfully addressing the system observability issues and ensuring robust state estimation by adding regularization law to the observer. The results indicate that the proposed observer can accurately estimate the state variables, even under weak observability conditions, as well as in the presence of errors in initial conditions and uncertainties in observer parameters, making it a promising solution for SC bank estimation challenges.
In complex scenarios involving extreme climate variations, aging, and changes in SoH, the model parameters may drift from their original values used in the observer. This is where an online parameter estimation algorithm becomes essential, enabling the observer coefficients to adapt to new conditions. However, this aspect is beyond the scope of this paper and could be considered as a future extension of the proposed approach. Additionally, since the proposed method assumes that the cells remain well-balanced, significant imbalance would require intervention from an SoH monitoring system to rescale the total bank capacity, which could be explored as a future research direction.

Author Contributions

Conceptualization, methodology, validation, formal analysis, investigation, writing—original draft preparation, A.R.; writing—review and editing, software, data curation, S.A.H.; writing—review and editing, supervision, project administration, funding acquisition, M.P. All authors have read and agreed to the published version of the manuscript.

Funding

This research received no external funding.

Data Availability Statement

The raw data supporting the conclusions of this article will be made available by the authors upon request.

Acknowledgments

We would like to acknowledge the support from ePower Center at Queen’s University.

Conflicts of Interest

The authors declare no conflicts of interest. The funders had no role in the design of the study; in the collection, analyses, or interpretation of data; in the writing of the manuscript; or in the decision to publish the results.

Abbreviations

    The following abbreviations are used in this manuscript:
CPEConstant Phase Element
LSELeast Squares Error
SOCState of Charge
SCSupercapacitor
ESREquivalent Circuit Model
OCVOpen-Circuit Voltage
EESSElectrochemical Energy Storage System
SoHState of Health

Appendix A. Offline Identification of System

Identifying the system parameters is essential, as they are required by the estimators and observers. The process begins with deriving the equation for the OCV-SOC relationship.

Appendix A.1. OCV-SOC Relation

The following steps are the method suggested by the authors to calculate the relation of E 0 = h b ( S O C ) :
  • The SC should be completely discharged by short-circuiting the terminals for a long time based on the SC bank size for example several days.
  • The pulse train is applied to the SC and continues until the terminal voltage v T reaches the nominal voltage V n .
  • The values of v T ( t ) are recorded during the rest mode of each period. The start time of the rest mode of the jth period is regarded as t j . To estimate the exact value of E 0 ( j ) , v T ( t ) for the jth rest mode period must be decomposed into two exponential components. One component, with a larger time constant, is attributed to the R 2 leakage current, while the other, with a shorter time constant, is due to charge redistribution. To accurately calculate E 0 , the contribution from charge redistribution must be removed from the measured voltage v T ( t j ) , i.e.,  E 0 ( j ) = v T ( t j ) V r , in which V r denotes the contribution of charge redistribution. The decomposition of two decaying DCs can be applied to each rest period. Figure A1 demonstrates this decomposition for one of the periods, which can correspond to
    v T ( t t j ) V r e ( t t j ) τ s + E 0 e ( t t j ) τ l .
  • The S O C of the j t h period is calculated by dividing the amount of q ( t j ) by C n V n , in which
    q ( t j ) = 0 t j ( i ( t ) v T ( t ) R 2 ) d t .
  • Using the values of E 0 ( j ) - S O C ( j ) for each period, the curve is interpolated and fitted to a polynomial.
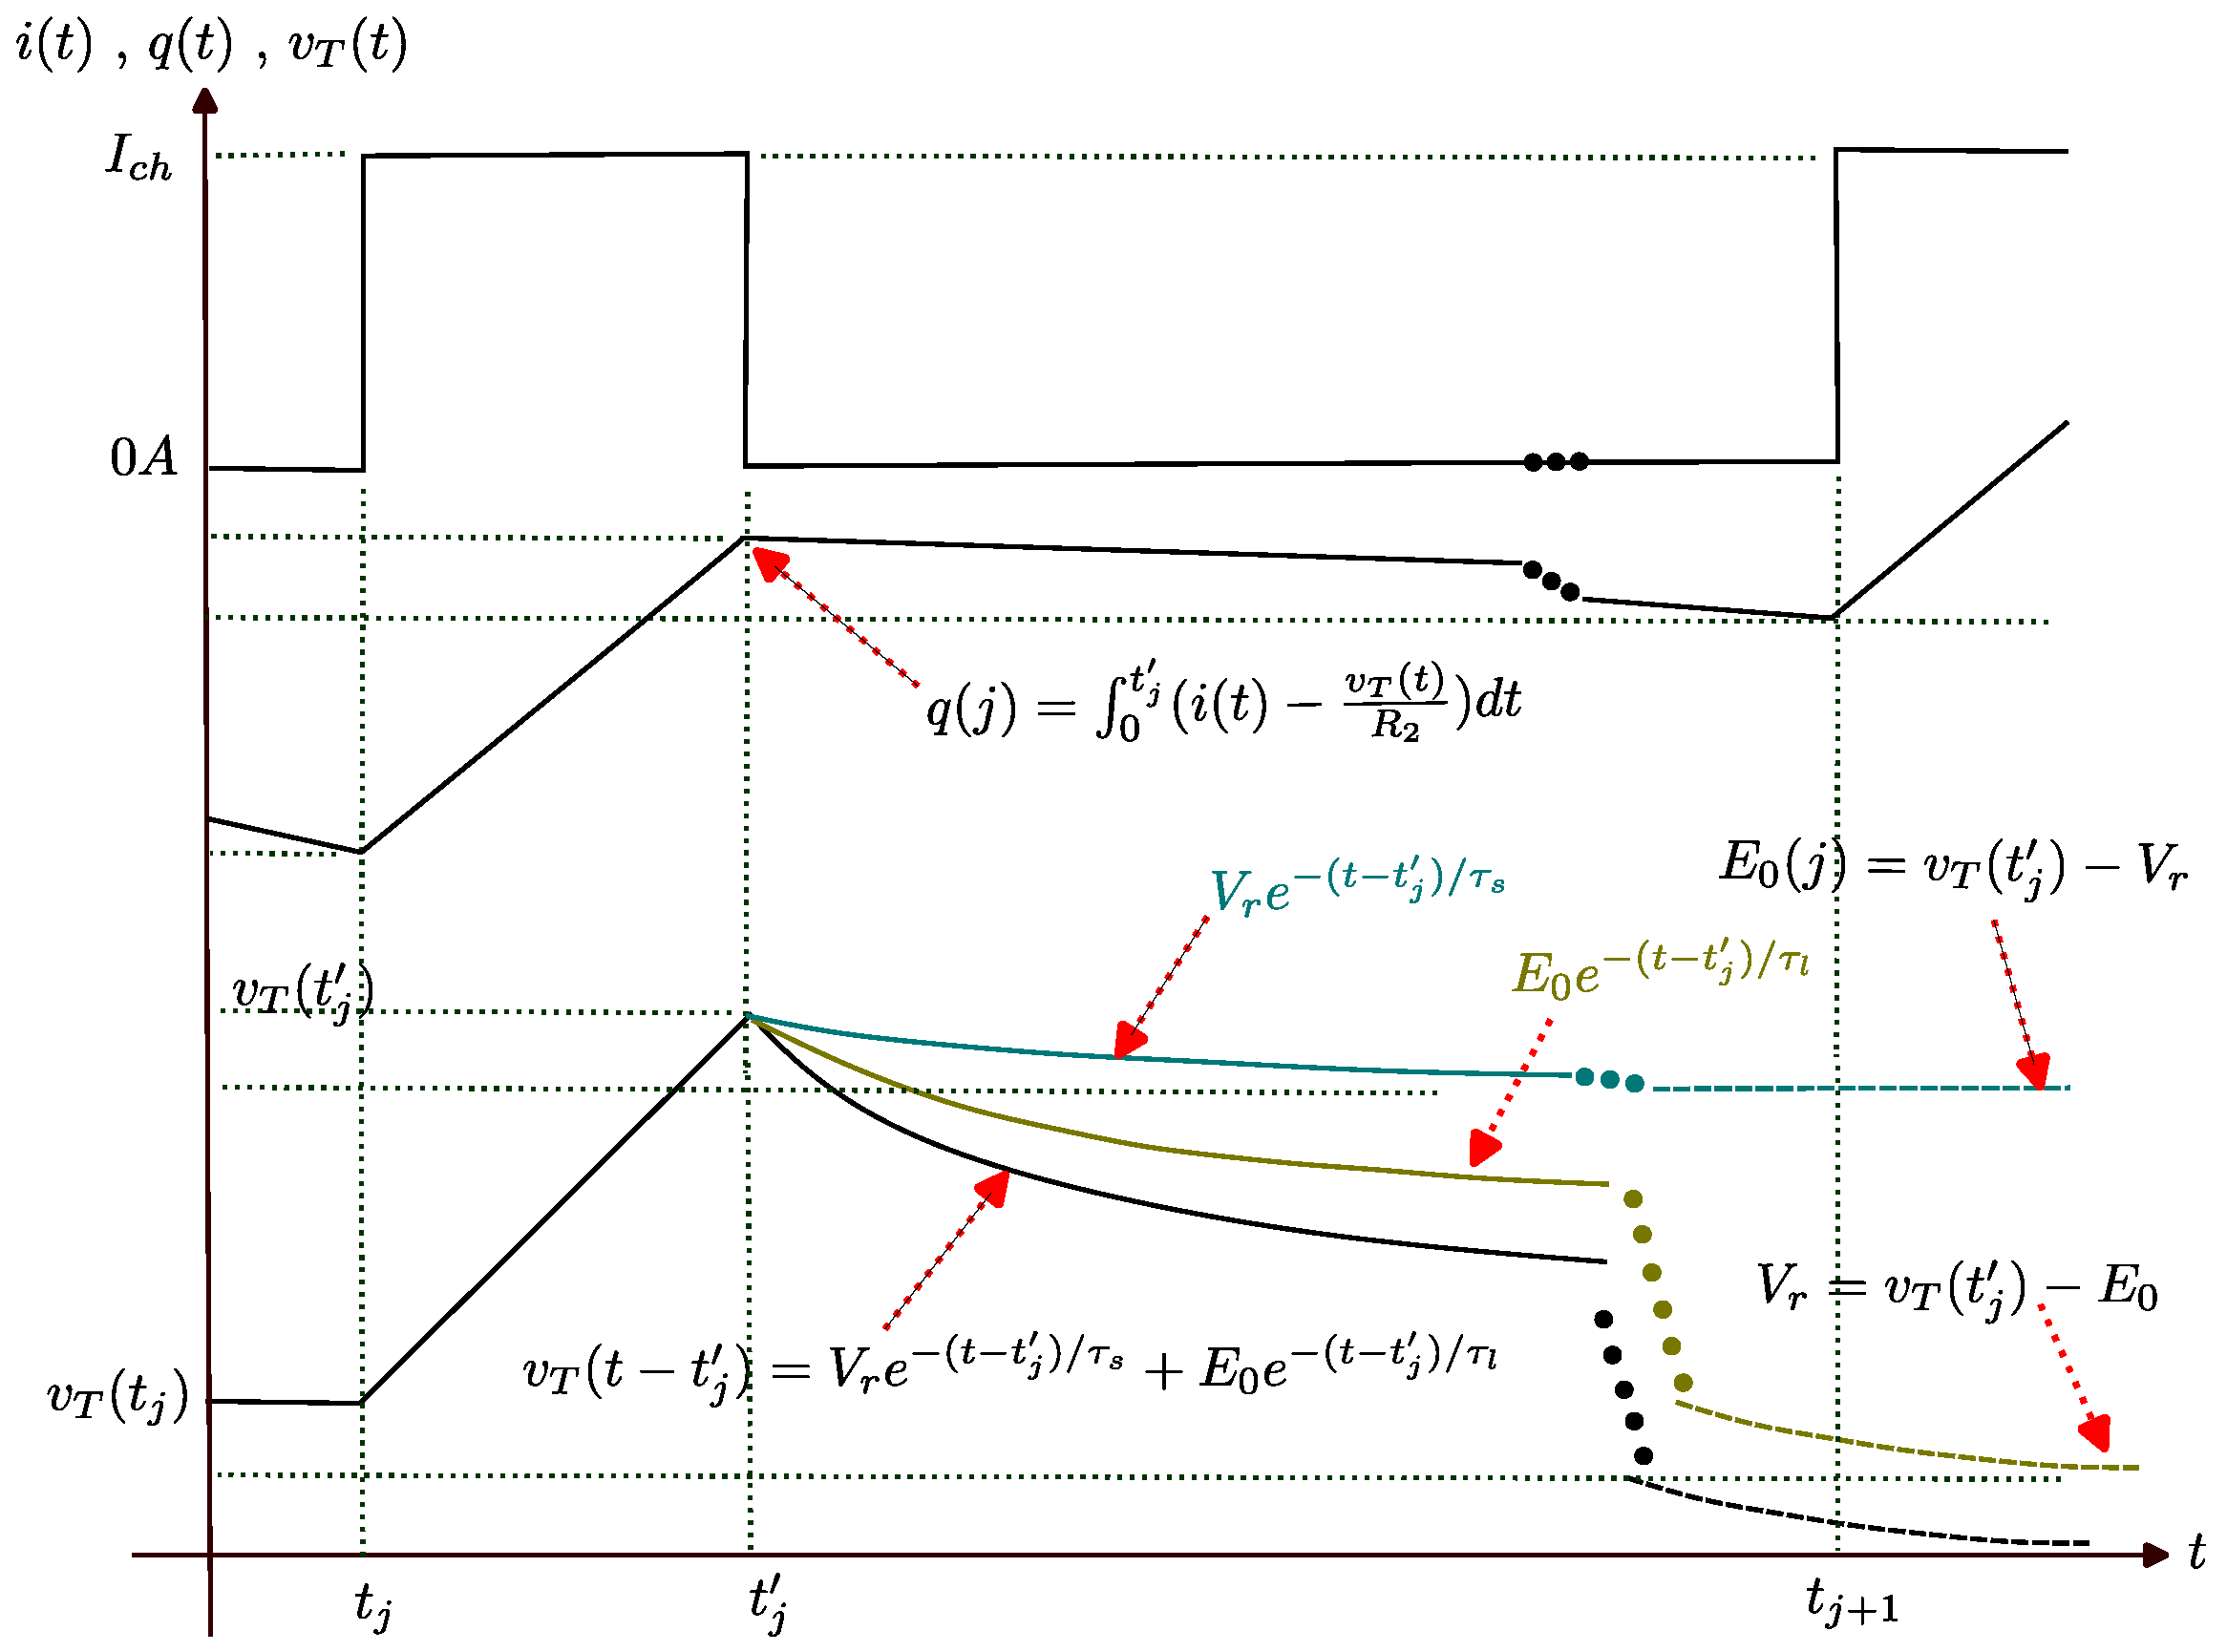
Figure A1. The calculation of E 0 = h b ( S O C ) .
Electronics 14 03231 g0a1
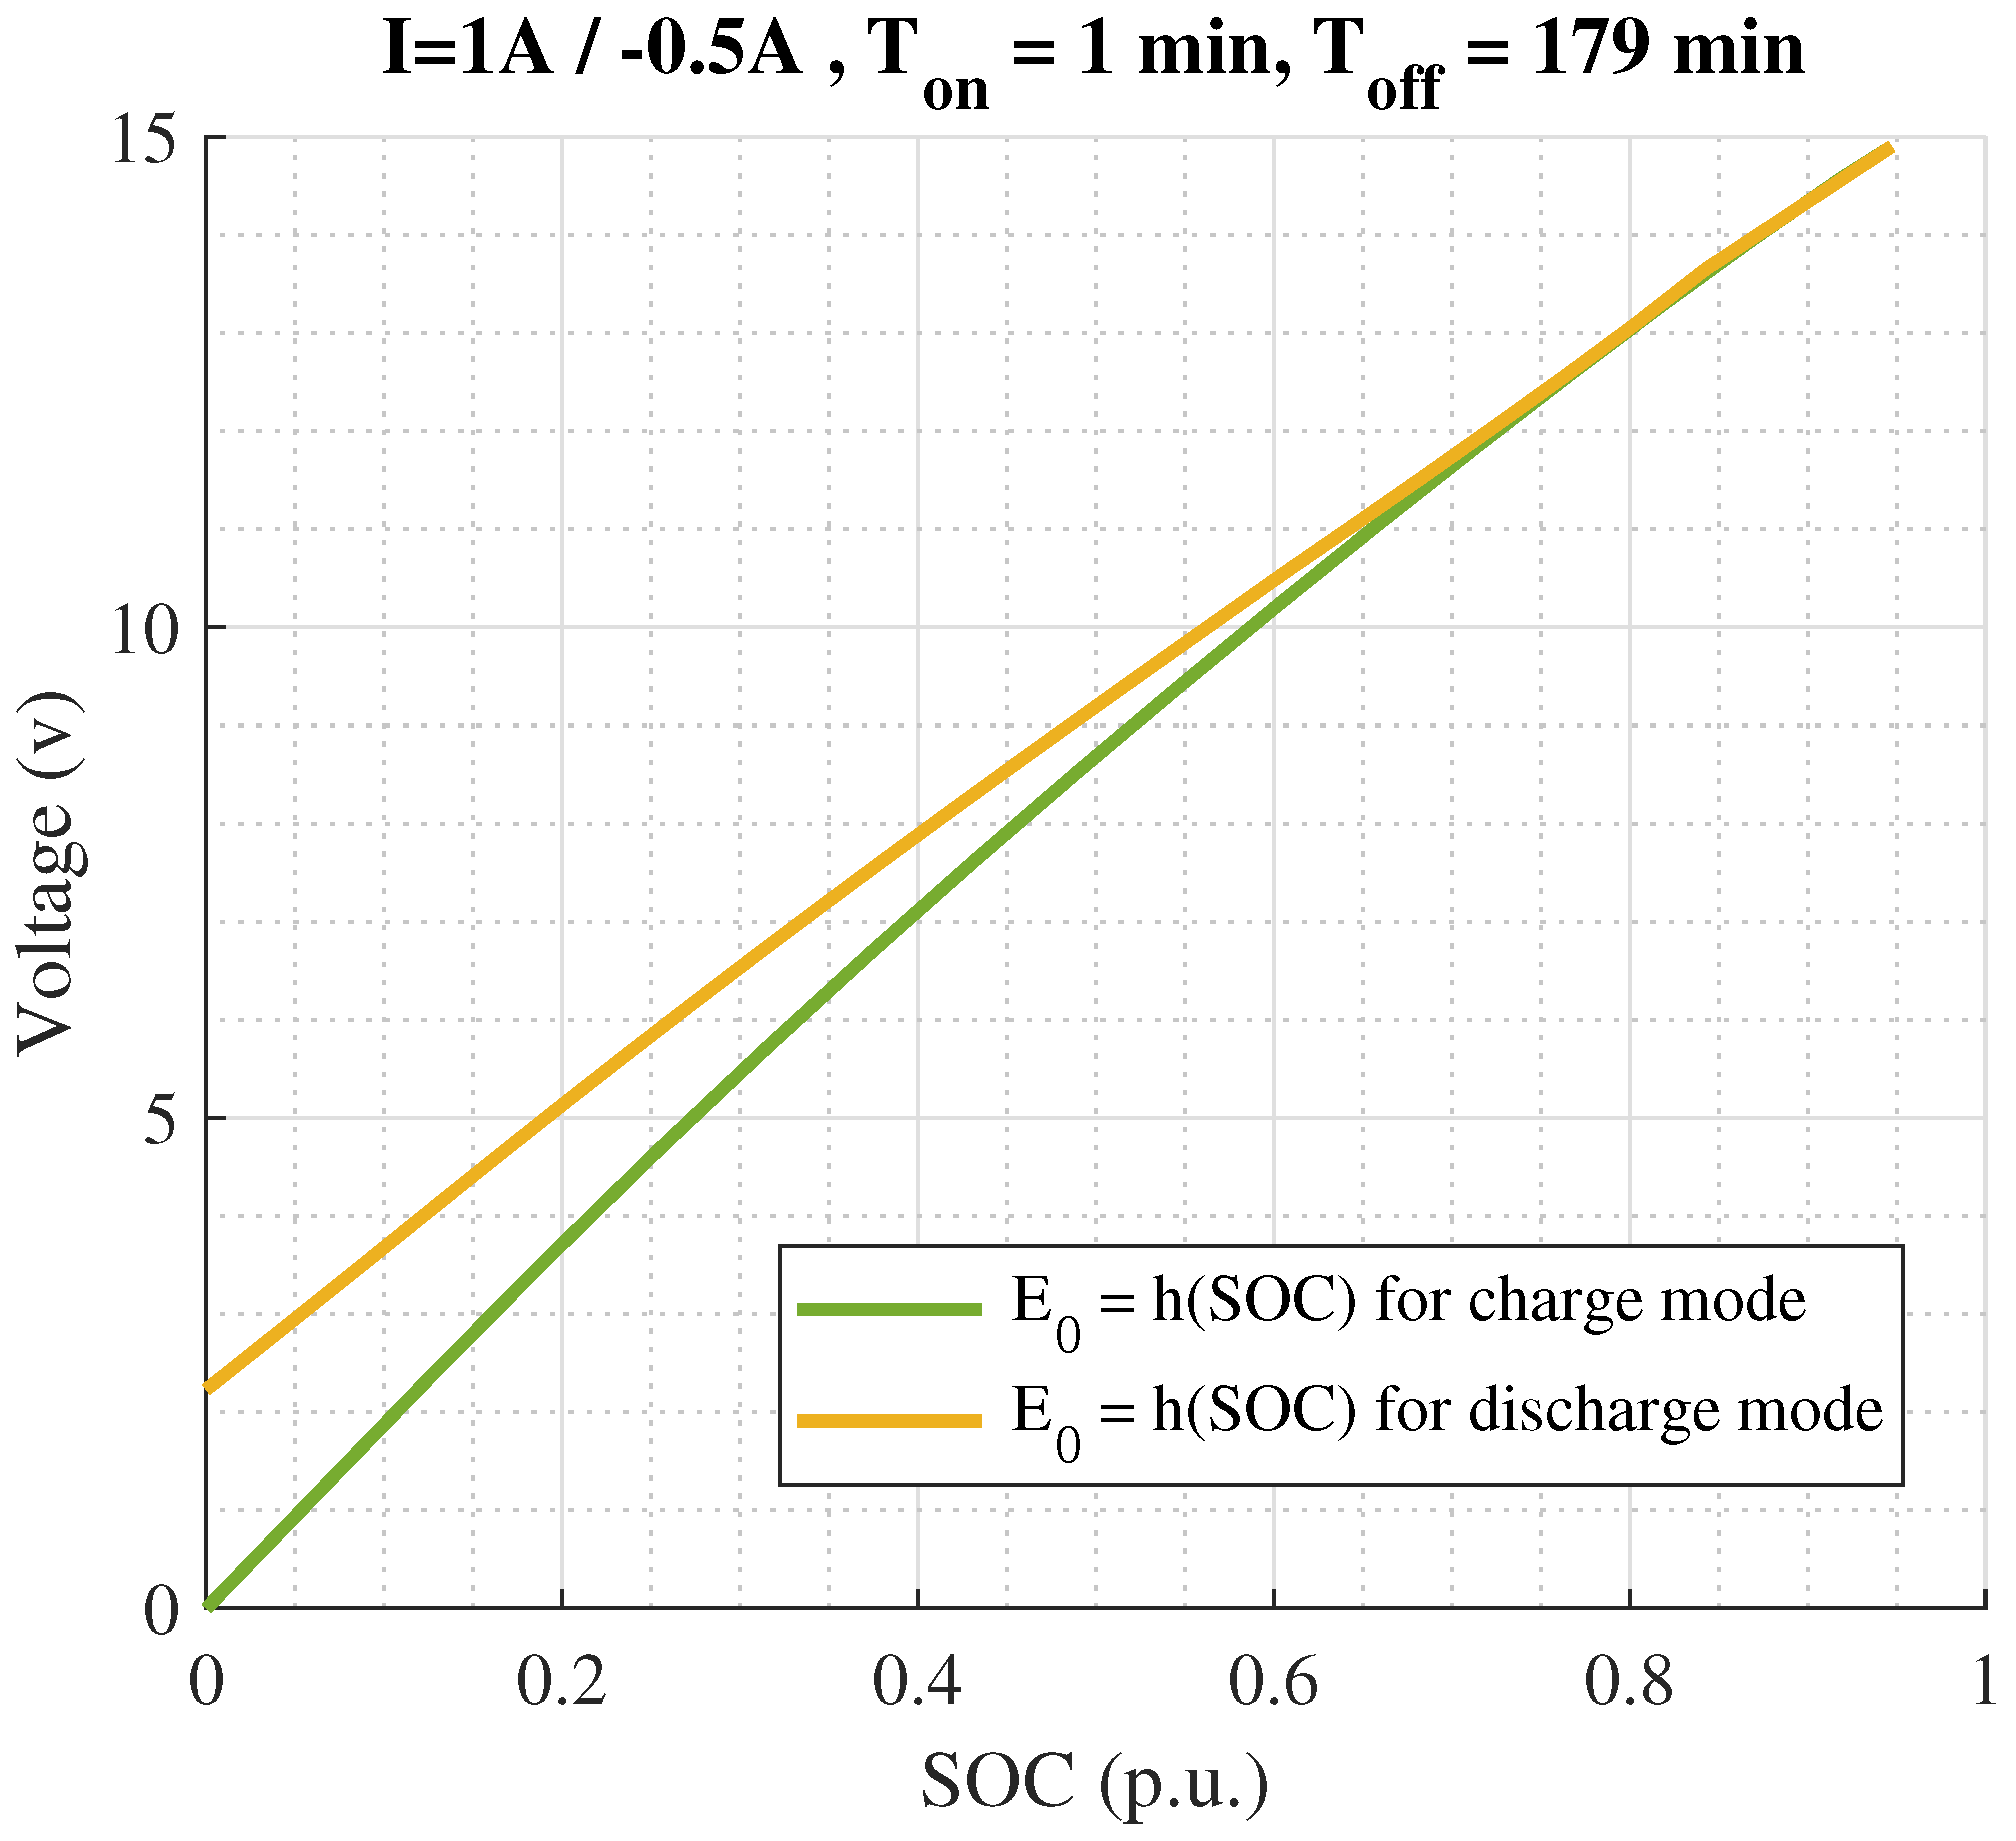
It is important to note that this relationship may differ between the charging and discharging modes; Figure A2 depicts this issue for our case study, which can fit the following polynomials:
h b ( S O C ) = a 5 a 4 a 3 a 2 a 1 a 0 × S O C 5 S O C 4 S O C 3 S O C 2 S O C 1 T .
Figure A2. h b ( S O C ) for charging and discharging modes calculated by applying a pulse train of 1 min ON and 179 min OFF.
Electronics 14 03231 g0a2
The identified constants a i for the test step in both charging and discharging modes are presented in Table A1. Here, a 0 serves as a calibration constant, determined by aligning the value of E 0 with h b ( SOC ) at the onset of the discharging phase. To reduce the accumulated hysteresis error and eliminate the offset resulting from recurring charge and discharge cycles, it is necessary to determine the initial SOC on the green curve of Figure A2—based on the OCV voltage—at the beginning of a new charging period following a rest. This approach effectively compensates for the offset error introduced by hysteresis accumulation.
Table A1. The constants of h ( S O C ) .
Parameter a 5 a 4 a 3 a 2 a 1 a 0
Charge0−0.6751.798−5.2319.9−0.0282
Discharge−9.6733.95−42.121.0910.2−0.012 + a 0

Appendix A.2. Parameter Identification

With the O C V S O C relationship established, the system identification process can be performed. As was discussed in Section 1, the identification can be performed offline or online. In this section, we try to derive an offline identification method. To perform offline system identification, various global optimization methods can be used; in this study, the MATLAB nonlinear gray-box identification tool is employed. However, since the system is of fractional-order, it must first be converted into an integer-order system using the GLD. By applying the GLD to a system with the form of (3), the continuous fractional-model will be transformed to a discretized one. The dynamic model is then rewritten as follows:
Δ γ x k + 1 = f ( x k , u k ) + ω k , x k + 1 = T s γ Δ γ x k + 1 j = 1 k + 1 ( 1 ) j Y j x k + 1 j , y k = g ( x k , u k ) + ν k ,
in which ω k and ν k are the process noise and measurement noise, respectively, and the rest of the terms are defined as follows:
Y j = α j 0 0 0 α j 0 0 0 1 j , Δ γ x k + 1 = Δ α x 1 , k + 1 Δ α x 2 , k + 1 Δ 1 x 3 , k + 1 , T s γ = T s α 0 0 0 T s α 0 0 0 T s .
As can be seen in the discrete model, to calculate a fractional-order dynamic, an infinite history of the previous values of states is necessary. However, since by increasing j, Y j approaches the zero matrix, the summation is truncated by the latest 100 samples. T S is also regarded to be 1 s.
The combination operator for fractional values can be generalized using the Gamma function Γ , which extends the factorial to real numbers. Thus, the generalized combination formula becomes
α j = Γ ( α + 1 ) Γ ( j + 1 ) Γ ( α j + 1 ) ,
which would be equal to α ! / ( j ! ( α j ) ! ) if α were an integer. The following formula illustrates how the fractional-order dynamic is transformed into a discrete state-space form, where the influence of the fractional-order γ is reflected in A ¯ through Y i :
x ¯ k + 1 = A ¯ x ¯ k + B ¯ u + A 2 ¯ h b ( x k ( 3 ) ) , y k = C ¯ x ¯ k + D u + h b ( x k ( 3 ) ) ,
where
x ¯ k + 1 = x k 98 x k 97 x k + 1 , x ¯ k = x k 99 x k 98 x k ,
A ¯ = 0 I 0 0 0 0 I 0 0 0 0 I A ¯ 100 , 1 A ¯ 100 , 2 A ¯ 100 , 99 A ¯ 100 , 100 , A ¯ 100 , 1 = ( 1 ) 100 Y 100 , A ¯ 100 , 2 = ( 1 ) 99 Y 99 , A ¯ 100 , 99 = ( 1 ) 2 Y 2 , A ¯ 100 , 100 = T s γ A 1 ( 1 ) 1 Y 1 , B ¯ = 0 0 T s γ B , A 2 ¯ = 0 0 T s γ A 2 , C ¯ = 0 0 0 C .
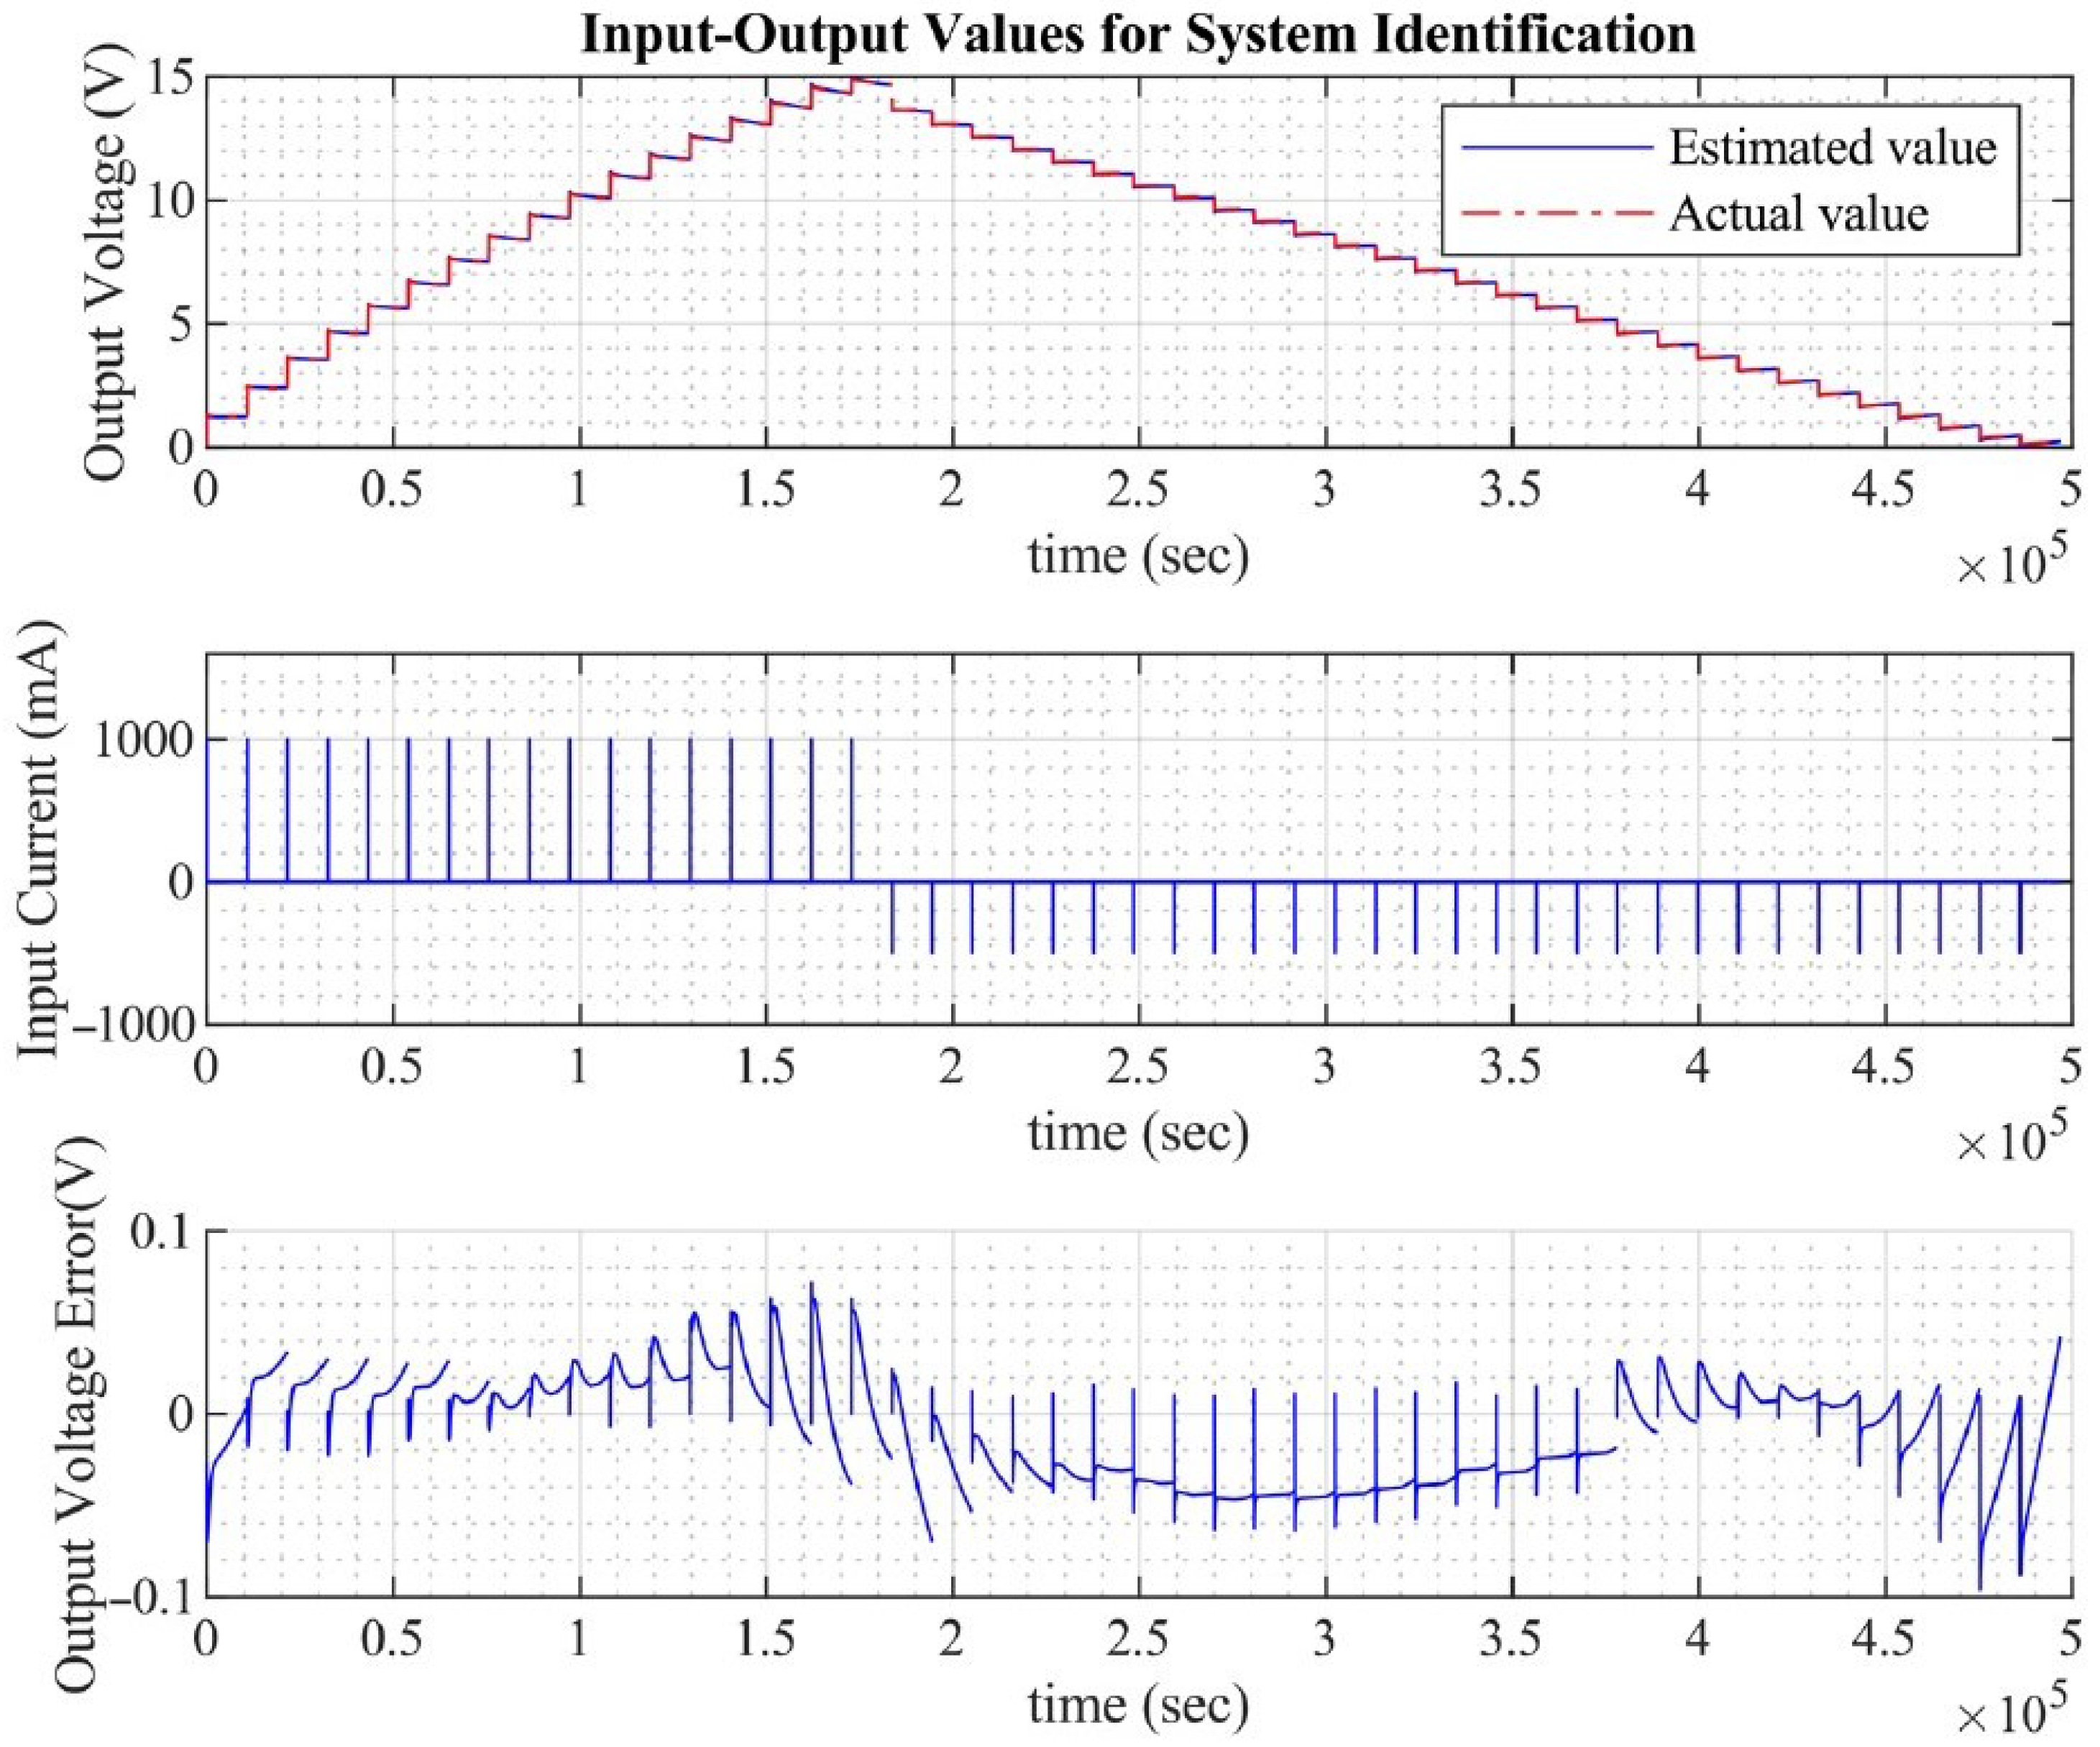
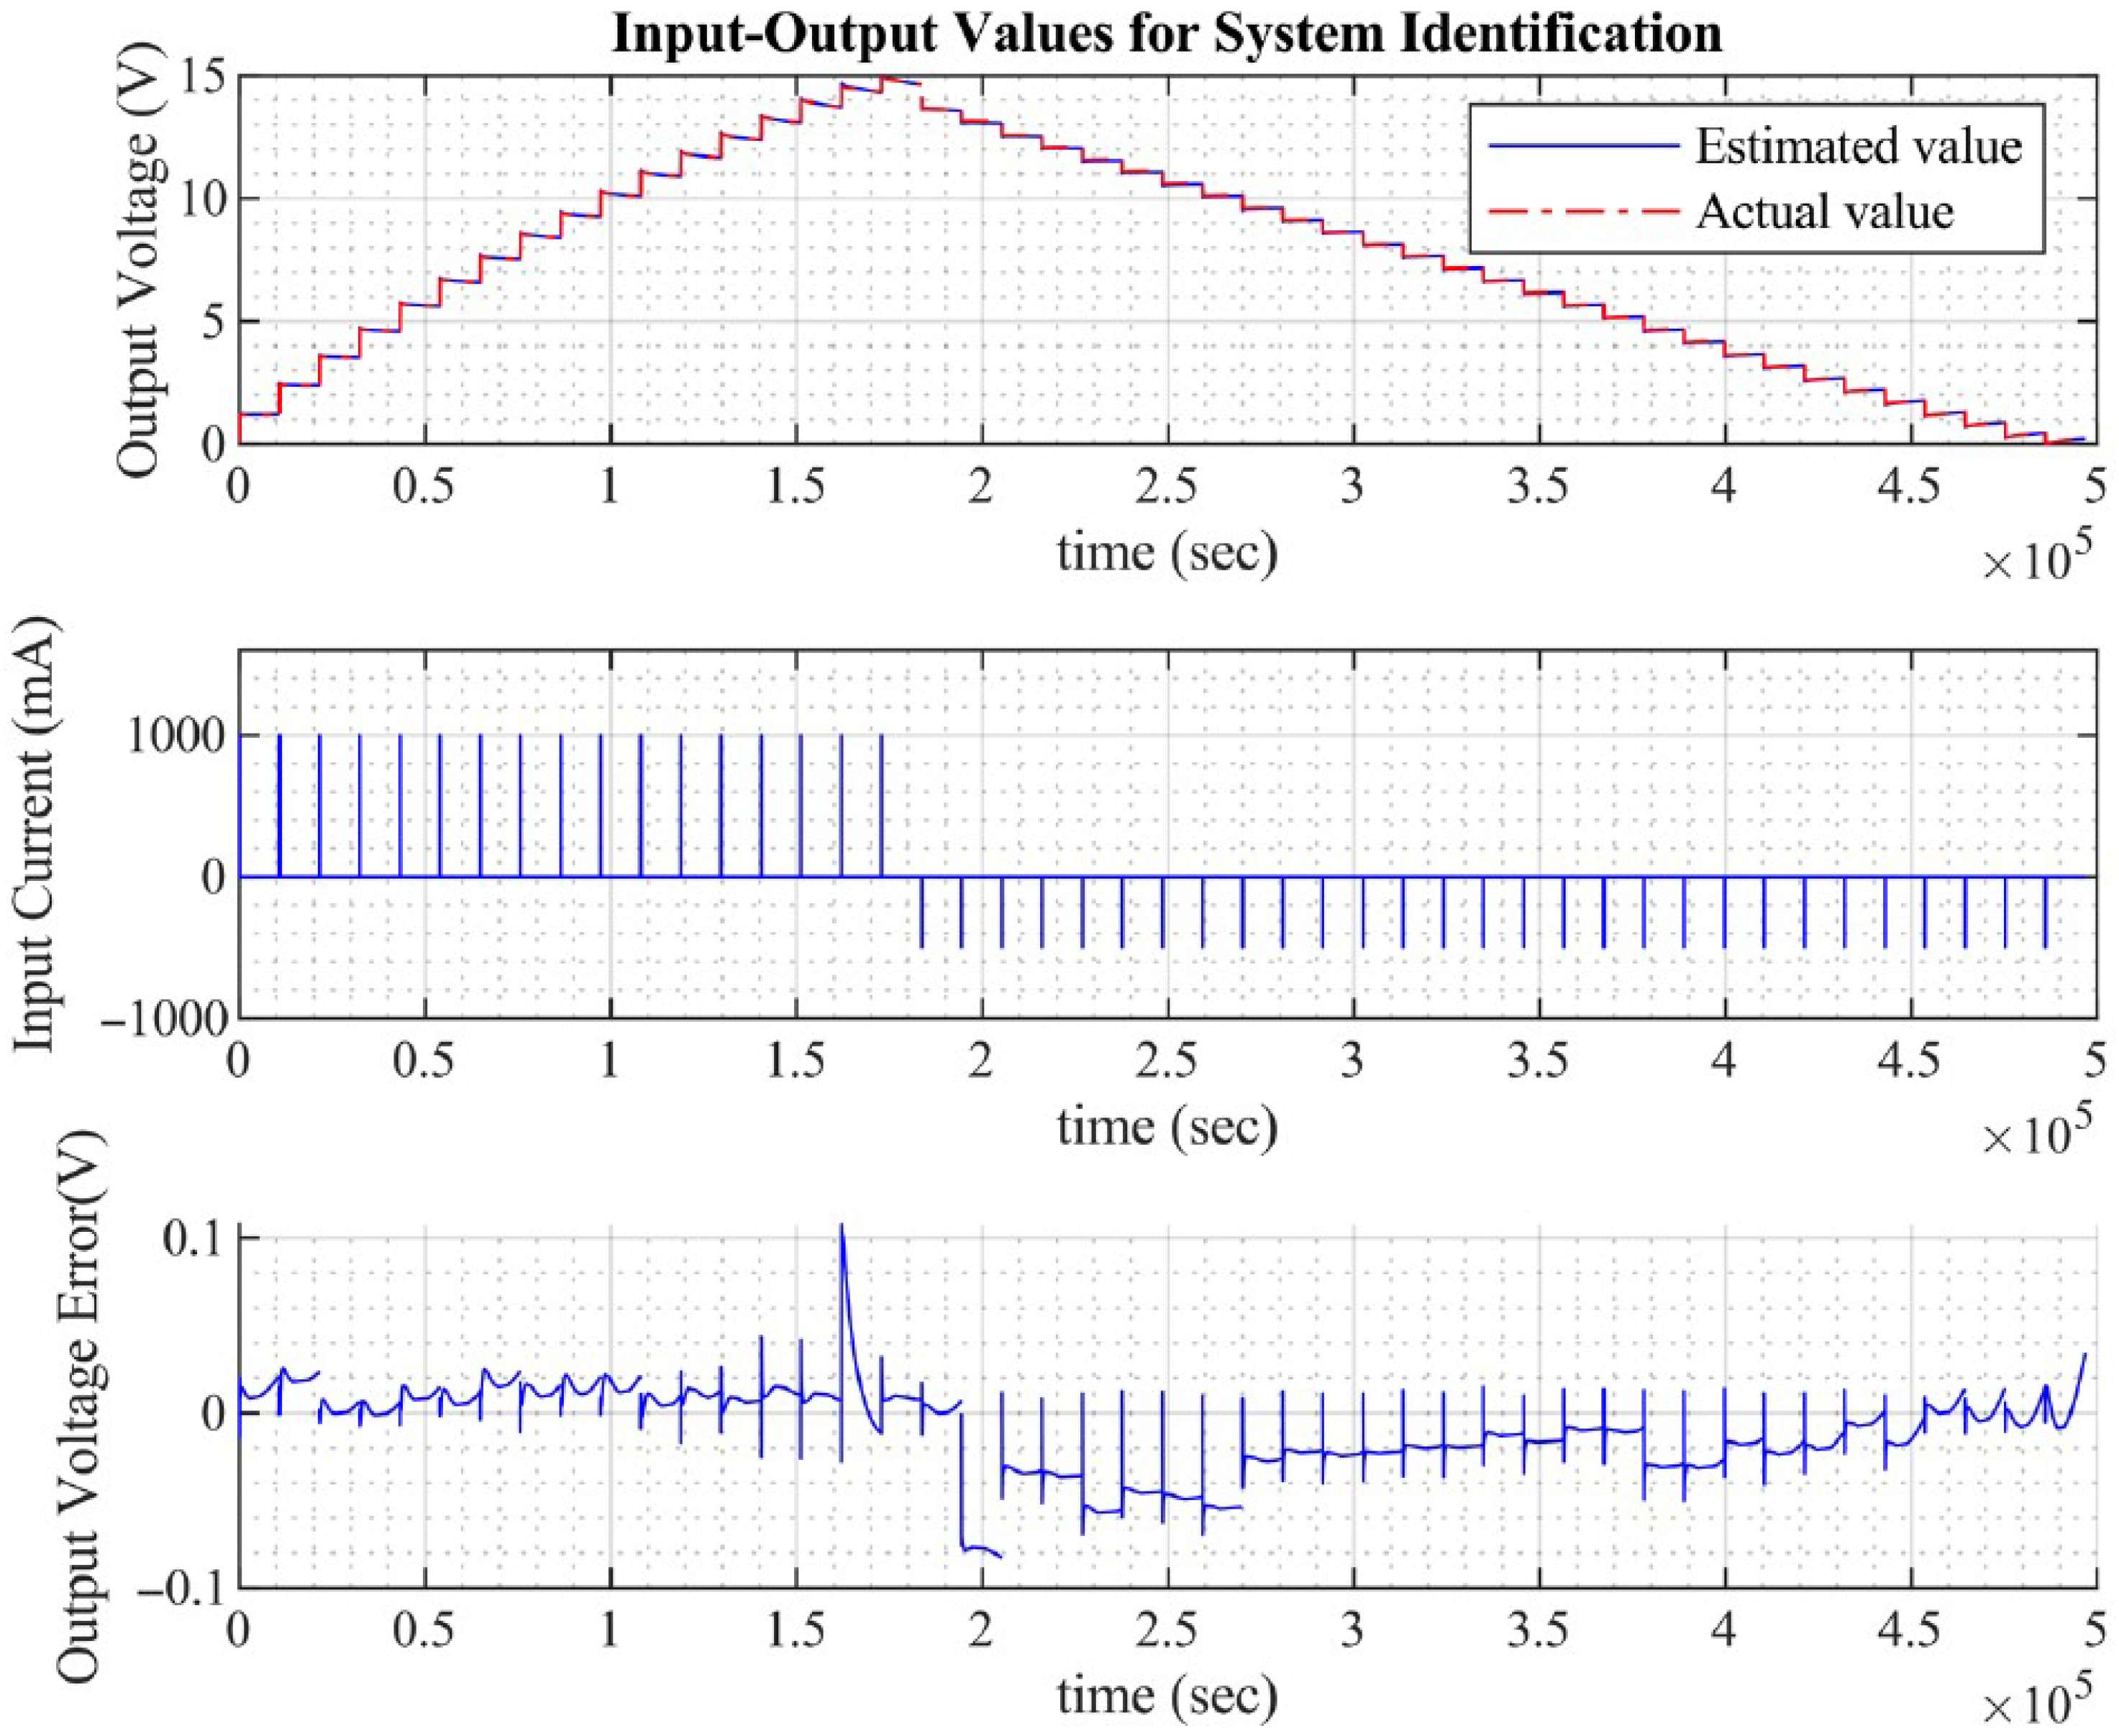
As mentioned, the identification training data consists of the pulse train as the system input, with the measured voltage as the system output. The verification data involves a semi-sawtooth current as the system input, with the measured voltage as the output. Figure A3 shows the model output, measured output, input, and model error of the system. Additionally, Figure 7 displays the values for the verification case. It can be observed that the output of the derived dynamic model for the SC bank closely matches the actual measured voltage values for both the training and verification cases. As demonstrated by the error analysis of the identified model, the selected model structure proves to be promising. The system parameters are derived using MATLAB software, which employs a nonlinear gray-box identification tool. The following steps are required for this process:
  • Create the experimental data structure using the following function:
    z = iddata(vo, io, Ts, ’Name’, ’SC’);
  • Define a separate function file to model system dynamics:
    function [dx, y] = model(t, x, u, R1, C1, R2, Cah, R0, alpha, varargin)
  • Construct the nonlinear gray-box model:
    nlgr = idnlgrey(FileName, Order, Parameters, InitialStates, Ts, ’Name’, ’SC_dyn’);
  • Perform parameter identification using the toolbox:
    nlgr = nlgreyest(z, nlgr, opt);
  • Extract the identified parameters from the estimated model:
    nlgr.Parameters(i).Value
The results are shown in Table A2. However, it can be seen in Figure A3 that for these parameters, the accuracy deteriorates at the extreme values of SOC.
Table A2. The parameters of equivalent circuit model.
ParameterChargeDischargeDischargeUnit
0–100%100–40%40–0%
R 1 705.31470.91636.8Mohm
R 2 11.50260.122122.77kohm
R 0 26.554946.93mohm
C 1 2446.92166.31261F
C A h 268.47247.37268.47mAh
α 0.86090.98630.9856-
Figure A3. Model output and measured voltage, input current, and model error with fixed parameters.
Electronics 14 03231 g0a3
As stated in other references [16,45,46,47,48,49], some parameters of SC, especially C a h and R 2 , are SOC-dependent; hence, the variation in the error value with SOC is due to the dependence of certain parameters on SOC. As a verification of this claim, Figure A4 shows a smaller error when adaptive parameters are considered to depend on SOC and the charging or discharging mode. In this case, the model parameters are identified based on a single charge–discharge cycle and are therefore updated for each cycle. These offline-identified parameters can also serve as adaptive parameters, selected based on different SOC ranges. The result of parameter identification is shown in Table A2.
Figure A4. Model output and measured voltage, input current, and model error with adaptive parameters.
Electronics 14 03231 g0a4

References

  1. Zhao, Y.; Yang, C.; Yu, Y. A review on covalent organic frameworks for rechargeable zinc-ion batteries. Chin. Chem. Lett. 2024, 35, 108865–108879. [Google Scholar] [CrossRef]
  2. Berrueta, A.; Ursúa, A.; Martín, I.S.; Eftekhari, A.; Sanchis, P. Supercapacitors: Electrical Characteristics, Modeling, Applications, and Future Trends. IEEE Access 2019, 7, 50869–50896. [Google Scholar] [CrossRef]
  3. Automobili Lamborghini S.p.A. Lamborghini Sián FKP 37. 2025. Available online: https://www.lamborghini.com/en-en/models/limited-series/sian-fkp-37 (accessed on 1 August 2025).
  4. Bhat, M.Y.; Hashmi, S.A.; Khan, M.; Choi, D.; Qurashi, A. Frontiers and recent developments on supercapacitor’s materials, design, and applications: Transport and power system applications. J. Energy Storage 2023, 58, 106104. [Google Scholar] [CrossRef]
  5. Bertrand, N.; Sabatier, J.; Briat, O.; Vinassa, J.M. Embedded Fractional Nonlinear Supercapacitor Model and Its Parametric Estimation Method. IEEE Trans. Ind. Electron. 2010, 57, 3991–4000. [Google Scholar] [CrossRef]
  6. Lewandowski, M.; Orzyłowski, M. Fractional-order models: The case study of the supercapacitor capacitance measurement. Bull. Pol. Acad. Sci. Tech. Sci. 2017, 65, 449–457. [Google Scholar] [CrossRef]
  7. Buller, S.; Karden, E.; Kok, D.; De Doncker, R.W. Modeling the dynamic behavior of supercapacitors using impedance spectroscopy. IEEE Trans. Ind. Appl. 2002, 38, 1622–1626. [Google Scholar] [CrossRef]
  8. Buller, S.; Thele, M.; De Doncker, R.; Karden, E. Impedance-based simulation models of supercapacitors and Li-ion batteries for power electronic applications. IEEE Trans. Ind. Appl. 2005, 41, 742–747. [Google Scholar] [CrossRef]
  9. Prasad, R.; Kothari, K.; Mehta, U. Flexible Fractional Supercapacitor Model Analyzed in Time Domain. IEEE Access 2019, 7, 122626–122633. [Google Scholar] [CrossRef]
  10. De Carne, G.; Morandi, A.; Karrari, S. Supercapacitor Modeling for Real-Time Simulation Applications. IEEE J. Emerg. Sel. Top. Ind. Electron. 2022, 3, 509–518. [Google Scholar] [CrossRef]
  11. Zou, C.; Zhang, L.; Hu, X.; Wang, Z.; Wik, T.; Pecht, M. A review of fractional-order techniques applied to lithium-ion batteries, lead-acid batteries, and supercapacitors. J. Power Sources 2018, 390, 286–296. [Google Scholar] [CrossRef]
  12. Slaifstein, D.; Ibanez, F.M.; Siwek, K. Supercapacitor Modeling: A System Identification Approach. IEEE Trans. Energy Convers. 2023, 38, 192–202. [Google Scholar] [CrossRef]
  13. Krpan, M.; Kuzle, I.; Radovanović, A.; Milanović, J.V. Modelling of Supercapacitor Banks for Power System Dynamics Studies. IEEE Trans. Power Syst. 2021, 36, 3987–3996. [Google Scholar] [CrossRef]
  14. Xu, D.; Zhang, L.; Wang, B.; Ma, G. Modeling of Supercapacitor Behavior with an Improved Two-Branch Equivalent Circuit. IEEE Access 2019, 7, 26379–26390. [Google Scholar] [CrossRef]
  15. Saha, P.; Dey, S.; Khanra, M. Modeling and State-of-Charge Estimation of Supercapacitor Considering Leakage Effect. IEEE Trans. Ind. Electron. 2020, 67, 350–357. [Google Scholar] [CrossRef]
  16. Quintáns, C.; Iglesias, R.; Lago, A.; Acevedo, J.M.; Martínez-Peñalver, C. Methodology to Obtain the Voltage-Dependent Parameters of a Fourth-Order Supercapacitor Model with the Transient Response to Current Pulses. IEEE Trans. Power Electron. 2017, 32, 3868–3878. [Google Scholar] [CrossRef]
  17. Wang, J.; Zhang, L.; Mao, J.; Zhou, J.; Xu, D. Fractional Order Equivalent Circuit Model and SOC Estimation of Supercapacitors for Use in HESS. IEEE Access 2019, 7, 52565–52572. [Google Scholar] [CrossRef]
  18. Chai, R.; Zhang, Y. A Practical Supercapacitor Model for Power Management in Wireless Sensor Nodes. IEEE Trans. Power Electron. 2015, 30, 6720–6730. [Google Scholar] [CrossRef]
  19. Krishnan, G.; Das, S.; Agarwal, V. An Online Identification Algorithm to Determine the Parameters of the Fractional-Order Model of a Supercapacitor. IEEE Trans. Ind. Appl. 2020, 56, 763–770. [Google Scholar] [CrossRef]
  20. Song, Z.; Hou, J.; Hofmann, H.F.; Lin, X.; Sun, J. Parameter Identification and Maximum Power Estimation of Battery/Supercapacitor Hybrid Energy Storage System Based on Cramer–Rao Bound Analysis. IEEE Trans. Power Electron. 2019, 34, 4831–4843. [Google Scholar] [CrossRef]
  21. El Mejdoubi, A.; Chaoui, H.; Gualous, H.; Sabor, J. Online Parameter Identification for Supercapacitor State-of-Health Diagnosis for Vehicular Applications. IEEE Trans. Power Electron. 2017, 32, 9355–9363. [Google Scholar] [CrossRef]
  22. Naseri, F.; Farjah, E.; Ghanbari, T.; Kazemi, Z.; Schaltz, E.; Schanen, J.L. Online Parameter Estimation for Supercapacitor State-of-Energy and State-of-Health Determination in Vehicular Applications. IEEE Trans. Ind. Electron. 2020, 67, 7963–7972. [Google Scholar] [CrossRef]
  23. Chaoui, H.; El Mejdoubi, A.; Oukaour, A.; Gualous, H. Online System Identification for Lifetime Diagnostic of Supercapacitors with Guaranteed Stability. IEEE Trans. Control Syst. Technol. 2016, 24, 2094–2102. [Google Scholar] [CrossRef]
  24. Tian, J.; Xiong, R.; Shen, W.; Wang, J.; Yang, R. Online simultaneous identification of parameters and order of a fractional order battery model. J. Clean. Prod. 2020, 247, 119147. [Google Scholar] [CrossRef]
  25. Maity, S.; Saha, M.; Saha, P.; Khanra, M. Fractional calculus-based modeling and state-of-charge estimation of supercapacitor. J. Energy Storage 2024, 81, 110317. [Google Scholar] [CrossRef]
  26. Miniguano, H.; Barrado, A.; Lázaro, A. Li-Ion Battery and Supercapacitor Modeling for Electric Vehicles Based on Pulse—Pseudo Random Binary Sequence. IEEE Trans. Veh. Technol. 2021, 70, 11378–11389. [Google Scholar] [CrossRef]
  27. Li, H.; Peng, J.; He, J.; Huang, Z.; Wang, J. Observer-Driven Charging of Supercapacitors. IEEE Trans. Ind. Informatics 2020, 16, 3439–3450. [Google Scholar] [CrossRef]
  28. Ceraolo, M.; Lutzemberger, G.; Poli, D. State-of-Charge Evaluation of Supercapacitors. J. Energy Storage 2017, 11, 211–218. [Google Scholar] [CrossRef]
  29. Chiang, C.J.; Yang, J.L.; Cheng, W.C. EKF-based estimation of SOC and temperature in ultracapacitors. In Proceedings of the 2013 10th IEEE International Conference on Control and Automation (ICCA), Hangzhou, China, 12–14 June 2013; pp. 274–279. [Google Scholar] [CrossRef]
  30. Nadeau, A.; Hassanalieragh, M.; Sharma, G.; Soyata, T. Energy awareness for supercapacitors using Kalman filter state-of-charge tracking. J. Power Sources 2015, 296, 383–391. [Google Scholar] [CrossRef]
  31. Shen, X.; Shen, T.; Zha, X.; Hikiri, K. State-of-charge estimation of super-capacitor using dual extended Kalman filter. In Proceedings of the 33rd Chinese Control Conference, Nanjing, China, 28–30 July 2014; pp. 227–232. [Google Scholar] [CrossRef]
  32. Pavković, D.; Komljenović, A.; Hrgetić, M.; Petrić, J.; Smetko, V. Design of EKF-based SoC estimator for an ultracapacitor module. In Proceedings of the IEEE EUROCON 2015—International Conference on Computer as a Tool (EUROCON), Salamanca, Spain, 8–11 September 2015; pp. 1–6. [Google Scholar] [CrossRef]
  33. Zhang, L.; Su, S.; Hu, X.; Dorrell, D.G. Robust state-of-charge estimation of ultracapacitors for electric vehicles. In Proceedings of the 2015 IEEE 13th International Conference on Industrial Informatics (INDIN), Cambridge, UK, 22–24 July 2015; pp. 1296–1301. [Google Scholar] [CrossRef]
  34. Li, H.; He, W.; Fang, X.; Li, S. State-of-Charge Estimation of Supercapacitors: A Switched Systems Approach. IEEE Trans. Transp. Electrif. 2024, 10, 5987–5996. [Google Scholar] [CrossRef]
  35. Dey, S.; Mohon, S.; Ayalew, B.; Arunachalam, H.; Onori, S. A Novel Model-Based Estimation Scheme for Battery-Double-Layer Capacitor Hybrid Energy Storage Systems. IEEE Trans. Control Syst. Technol. 2019, 27, 689–702. [Google Scholar] [CrossRef]
  36. Fan, S.; Duan, J.; Sun, L.; Zhang, K.; Han, Y. State of charge estimate for super-capacitor based on sliding mode observer. In Proceedings of the 2017 IEEE Transportation Electrification Conference and Expo, Asia-Pacific (ITEC Asia-Pacific), Harbin, China, 7–10 August 2017; pp. 1–5. [Google Scholar] [CrossRef]
  37. Weigert, T.; Tian, Q.; Lian, K. State-of-charge prediction of batteries and battery–supercapacitor hybrids using artificial neural networks. J. Power Sources 2011, 196, 4061–4066. [Google Scholar] [CrossRef]
  38. Tri, V.V.; Huong, D.C.; Diep, P.N.N. State estimation problem for fractional-order neural networks using event-triggered state observers. Proc. Inst. Mech. Eng. Part I 2023, 237, 1078–1086. [Google Scholar] [CrossRef]
  39. Huong, D.C.; Huynh, V.T.; Thao, N.G.M.; Dang, T.P.; Trinh, H. State Estimation for a New Battery and Motor Circuit Model of an Electric Vehicle Using Event-Triggered Functional Interval Observers. IEEE Trans. Circuits Syst. I: Regul. Pap. 2024, 71, 421–430. [Google Scholar] [CrossRef]
  40. Rasoolzadeh, A.; Hashemi, S.A.; Pahlevani, M. Online Identification of Differential Order in Supercapacitor Fractional-Order Models: Advancing Practical Implementation. Energies 2025, 18, 1876. [Google Scholar] [CrossRef]
  41. Krener, A.J.; Ide, K. Measures of unobservability. In Proceedings of the 48h IEEE Conference on Decision and Control (CDC) held jointly with 2009 28th Chinese Control Conference, Shanghai, China, 15–18 December 2009; pp. 6401–6406. [Google Scholar] [CrossRef]
  42. Ortega, R.; Bobtsov, A.; Nikolaev, N.; Schiffer, J.; Dochain, D. Generalized parameter estimation-based observers: Application to power systems and chemical–biological reactors. Automatica 2021, 129, 109635. [Google Scholar] [CrossRef]
  43. Cecilia, A.; Costa-Castelló, R. On state-estimation in weakly-observable scenarios and implicitly regularized observers. In Proceedings of the 2021 60th IEEE Conference on Decision and Control (CDC), Austin, TX, USA, 14–17 December 2021; pp. 3996–4001. [Google Scholar] [CrossRef]
  44. Castiglia, V.; Campagna, N.; Di Tommaso, A.O.; Miceli, R.; Pellitteri, F.; Puccio, C.; Viola, F. Modelling, Simulation and Characterization of a Supercapacitor in Automotive Applications. In Proceedings of the 2020 Fifteenth International Conference on Ecological Vehicles and Renewable Energies (EVER), Monte-Carlo, Monaco, 10–12 September 2020; pp. 1–6. [Google Scholar] [CrossRef]
  45. Rizoug, N.; Bartholomeus, P.; Le Moigne, P. Modeling and Characterizing Supercapacitors Using an Online Method. IEEE Trans. Ind. Electron. 2010, 57, 3980–3990. [Google Scholar] [CrossRef]
  46. Morandi, A.; Lampasi, A.; Cocchi, A.; Gherdovich, F.; Melaccio, U.; Ribani, P.L.; Rossi, C.; Soavi, F. Characterization and Model Parameters of Large Commercial Supercapacitor Cells. IEEE Access 2021, 9, 20376–20390. [Google Scholar] [CrossRef]
  47. Parvini, Y.; Siegel, J.B.; Stefanopoulou, A.G.; Vahidi, A. Supercapacitor Electrical and Thermal Modeling, Identification, and Validation for a Wide Range of Temperature and Power Applications. IEEE Trans. Ind. Electron. 2016, 63, 1574–1585. [Google Scholar] [CrossRef]
  48. Zucca, M.; Hassanzadeh, M.; Conti, O.; Pogliano, U. Accurate Parameters Identification of a Supercapacitor Three-Branch Model. IEEE Access 2023, 11, 122387–122398. [Google Scholar] [CrossRef]
  49. Yang, H. Dependence of Supercapacitor Peukert Constant on Voltage, Aging, and Temperature. IEEE Trans. Power Electron. 2019, 34, 9978–9992. [Google Scholar] [CrossRef]
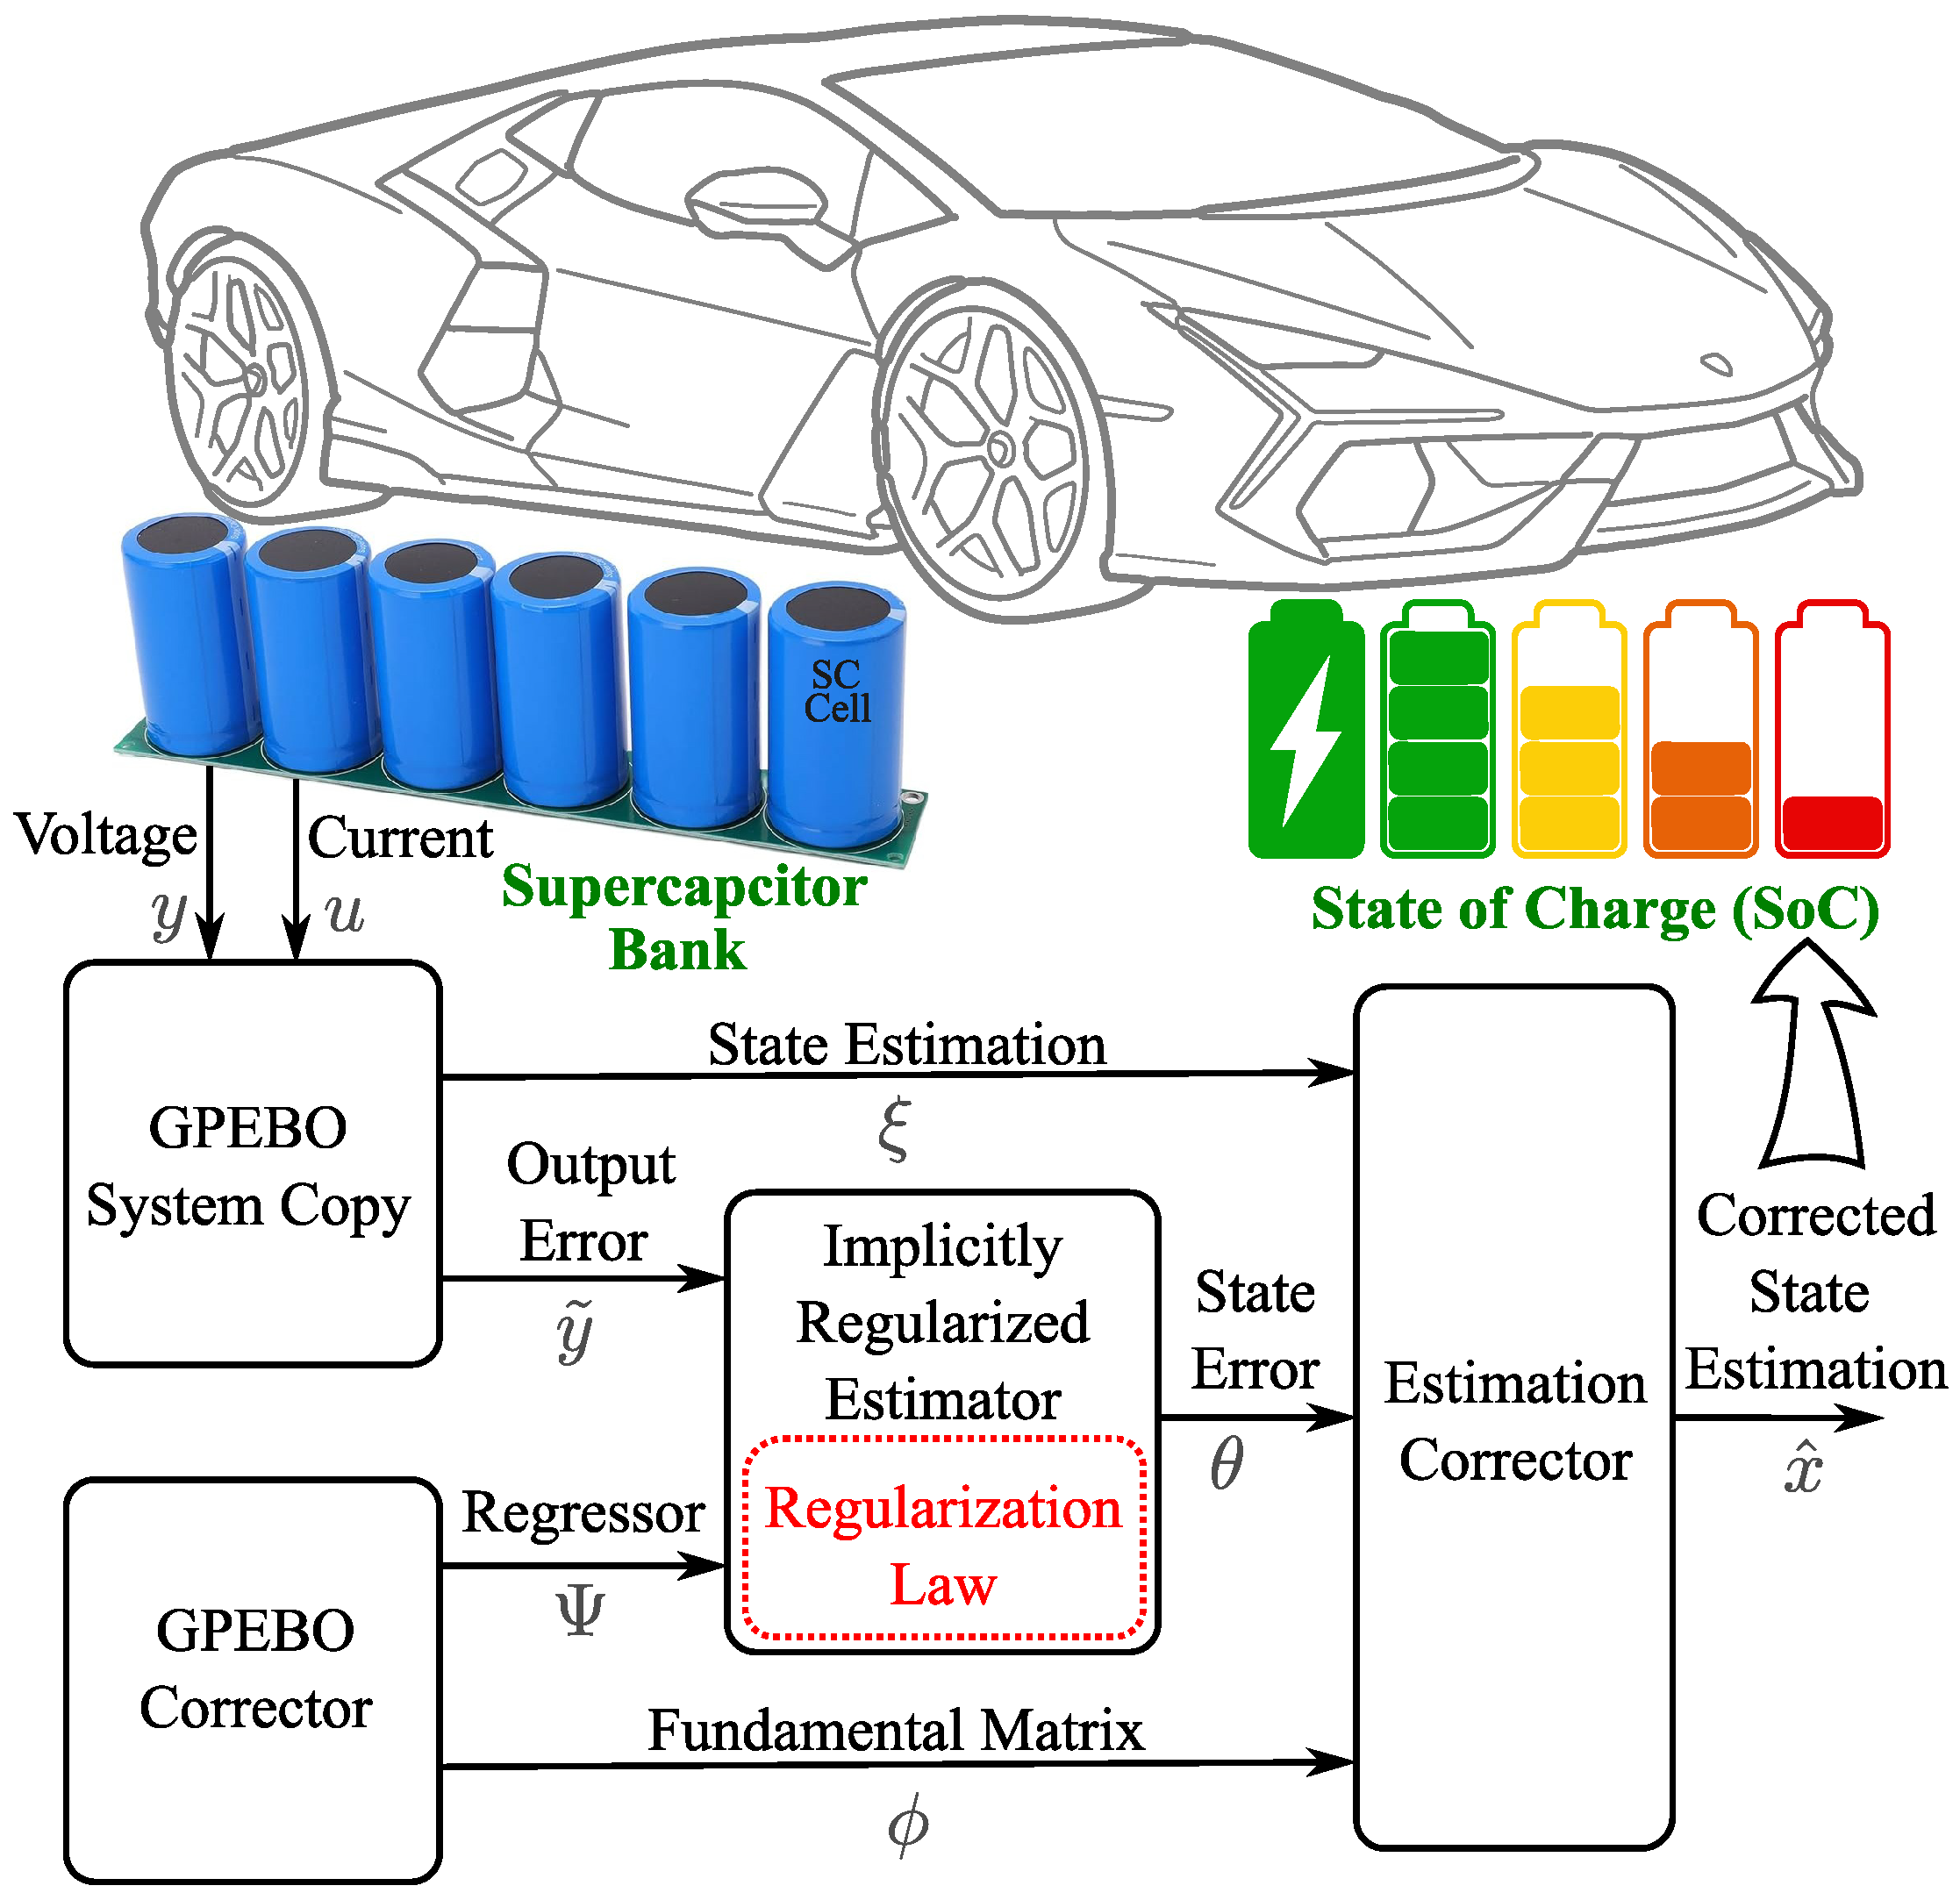
Figure 1. Block diagram of the proposed implicitly regularized fractional-order generalized parameter-based observer for supercapacitor bank.
Electronics 14 03231 g001
Figure 2. Fractional-order equivalent circuit model of a single-cell SC.
Electronics 14 03231 g002
Figure 3. Proposed equivalent circuit model for an SC Bank.
Electronics 14 03231 g003
Figure 4. Condition number of observability matrix with R 2 .
Electronics 14 03231 g004
Figure 5. Application of the superposition law in the SC bank ECM to derive a regularization law.
Electronics 14 03231 g005
Figure 6. Experimental test setup showing the connections and communications.
Electronics 14 03231 g006
Figure 7. (a) The imposed current on SC bank. (b) The measured voltage of SC bank.
Electronics 14 03231 g007
Figure 8. States of system generalized by model, regularized GPEBO and FOEKF.
Electronics 14 03231 g008
Figure 9. States of system in case of 10 % error in initial value of SOC.
Electronics 14 03231 g009
Figure 10. States of system in case of 10 % uncertainty in the parameters of model.
Electronics 14 03231 g010
Figure 11. States of system generalized by model, regularized GPEBO and FOEKF, for the input with amplitude of 200 mA.
Electronics 14 03231 g011
Figure 12. States of system generalized by model, regularized GPEBO and FOEKF, for the input with amplitude of 10 A.
Electronics 14 03231 g012
Figure 13. (a) The higher values of imposed current on SC bank. (b) The measured voltage of SC bank.
Electronics 14 03231 g013
Table 1. Quantitative analysis of output error with different GLD truncation.
TruncationMax Absolute ErrorMax Square ErrorMean Squared Error
1012 × 10 3 14 × 10 5 8 × 10 5
507.7 × 10 3 6 × 10 5 3 × 10 5
1003.7 × 10 3 14 × 10 6 4 × 10 6
Table 2. Test setup instruments.
InstrumentBrandModelCommunication
Power supplyXantrex, San Diego, CA, USAXT60-1 & XHR20-50GPIB
Electronic loadChroma, Wu-Ku, Taipei, Taiwan6314-63102GPIB
MultimeterKeithley, Cleveland, OH, USA2700GPIB
Table 3. Quantitative analysis of FOEKF vs. regularized GPEBO.
ObserverSOC InitialSOCSOC
Error τ (s)MSE
10% initial error of SOCFOEKF0.04535004.4 × 10 5
GPEBO0.000126.45 × 10 6
10% uncertainty in parametersFOEKF0.00315006.01 × 10 6
GPEBO0.000536.07 × 10 6
200 mA amplitude currentFOEKF0.0027unstableunstable
GPEBO0.000626.45 × 10 5
Disclaimer/Publisher’s Note: The statements, opinions and data contained in all publications are solely those of the individual author(s) and contributor(s) and not of MDPI and/or the editor(s). MDPI and/or the editor(s) disclaim responsibility for any injury to people or property resulting from any ideas, methods, instructions or products referred to in the content.