Article

A Study on a Directional Gradient-Based Defect Detection Method for Plate Heat Exchanger Sheets

Institute of Visual Inspection Technology, Instrument Science and Technology Discipline School of Information Science and Engineering, Shenyang University of Technology, Shenyang 110870, China
*
Author to whom correspondence should be addressed.
Electronics 2025, 14(16), 3206; https://doi.org/10.3390/electronics14163206
Submission received: 14 July 2025 / Revised: 8 August 2025 / Accepted: 10 August 2025 / Published: 12 August 2025

Abstract

Micro-crack defects on the surfaces of plate heat exchanger sheets often exhibit a linear grayscale pattern when clustered. In defect detection, traditional methods are more suitable than deep learning models in controlled production environments with limited computing resources to meet stringent national standards, which require low miss rates. However, deep learning models commonly suffer feature loss when detecting individual, small-scale defects, leading to higher leak detection rates. Moreover, in grayscale image line detection using traditional methods, the varying direction, width, and asymmetric grayscale profiles of defects can result in filled grayscale valleys due to width-adaptive smoothing coefficients, complicating accurate defect extraction. To address these issues, this study establishes a theoretical foundation for parameter selection in variable-width defect detection. We propose a directional gradient-based algorithm that mathematically constrains the Gaussian template width to cover variable-width defects with a fixed σ, reframing the detection defect from ridge edges to centrally symmetric double-ridge edges in gradient images. Experimental results show that, when tested in the defective boards library and under simulated factory CPU conditions, this algorithm achieves a miss detection rate of 14.55%, a false detection rate of 21.85%, and an 600 × 600 pixel image detection time of 0.1402 s. Compared to traditional line detection and deep learning object detection methods, this algorithm proves advantageous for detecting micro-crack defects on plate heat exchanger sheets in industrial production, particularly in data-scarce and resource-limited scenarios.

1. Introduction

A detachable plate heat exchanger (PHE) transfers heat through the stacking of metal sheets with corrugated patterns. Micro-crack defects, small linear imperfections caused by stamping during the production pressing process, form on these sheets. Localized stress can cause micro-crack defects to expand into sheet-like formations and aggregate into clusters. These clusters exhibit an overall linear grayscale pattern, referred to as micro-crack defects. When the sheet is put into operation, these defects may crack under the pressure of injected water, creating potential operational risks.
In the context of China’s production environment, Appendix A of the national standard (The National Standards of the People’s Republic of China/Recommended Standard GB/T 232-1988), “Test Methods for Metal Bend Testing”, specifies that small cracks on the outer bending surface of a metal specimen, with a length of no more than 2 mm or a width of no more than 0.2 mm, are classified as micro-crack defects [1]. It should be noted that although GB/T 232-2024 supersedes the 1988 version, the quantitative definition of micro-crack defects is explicitly documented only in GB/T 232-1988. Accordingly, this study adopts the 1988 edition as the normative reference Additionally, the national standard (National Bureau of Energy Industry Standard/Recommended Standard, NB/T47004.1-2017), authored by the National Technical Committee on Boilers and Pressure Vessels Standardization, mandates that no micro-crack defects are permitted on formed sheets in order to reduce missed inspections [2].
Currently, defect detection for PHE sheets remains at the prototype testing stage, with no online detection methods available. In 2021, Yuan et al. [3] employed the Canny algorithm for edge detection on PHE sheets, successfully identifying defect regions. In 2022, Chen [4] implemented line defect detection by using the absolute amplitude of multi-scale convex line segments.
Effective micro-crack defects detection is critical for quality inspection per industrial and national standards. Current methods comprise non-machine vision and machine vision approaches, with the latter subdivided into traditional image processing and neural network-based object detection.
Non-machine vision methods like ultrasound [5], eddy current [6], and magnetic memory detection [7] struggle with height variations on non-flat PHE surfaces due to working distance sensitivity. Machine vision overcomes this limitation.
Traditional machine vision methods include Gaussian line detection for optical fibers [8], OTSU-Canny lane detection [9], Gaussian–Hough track detection [10], and gray centroid–Gaussian convolution for tire bubbles [11]. However, these approaches assume fixed directionality or symmetric grayscale profiles, limiting their effectiveness for variable-width, asymmetric micro-crack defects. Image smoothing also risks filling crack valleys, hindering accurate edge extraction.
Defect detection based on local binary patterns (LBPs) [12,13,14,15] is limited for micro-crack defects due to their low grayscale values hindering local feature extraction. Directional, Fourier, Haar wavelet, and Gabor filters [16,17,18,19] also struggle; symmetric templates (except Haar) poorly handle asymmetric profiles as convolution strength diminishes with defect width, while Haar’s multi-scale decomposition increases latency. Gaussian mixture and Markov field models [20,21] fail when defect–background contrast is lower than internal background variations. Zhang et al. [22] applied the non-directional Canny operator but reported false positives from background variations and provided no width-adaptive parameter selection.
Deep learning plays a significant role in industrial inspection. Neural network-based object detectors fall into three categories:
(1)
One-stage algorithms: Liu et al. combined a Single Shot Multi Box Detector (SSD) with Residual Network-50 (ResNet-50) for steel defect detection [23], leveraging residual learning but facing complex parameter optimization. Some researchers adopt variants of the You Only Look Once (YOLO) series for object detection [24,25,26,27,28], despite the loss of shallow features caused by downsampling operations.
(2)
Two-stage algorithms: Hao et al. used a Faster Region-Based Convolutional Neural Network (Faster R-CNN) with ResNet-50 [29], enabling multi-scale fusion but risking overfitting with limited data. Zhang et al. employed Mask R-CNN with EfficientNet [30], effective for large objects but missing small defects due to low-resolution features.
(3)
End-to-end Transformers: Xing et al. adapted a Vision Transformer (ViT) with ShuffleNet-V2 [31], compensating for missing convolutional priors but losing fine details via self-attention. Zhu et al. combined deformable convolution with a Detection Transformer (DETR) [32], improving key region focus but requiring large datasets unsuitable for industrial constraints.
Traditional defect detection methods maintain advantages over deep learning for PHE sheet inspection under industrial constraints. First, national standards prioritize minimal missed detections (allowing for some false positives), whereas deep learning typically balances miss/false detection rates, potentially increasing misses. Second, traditional algorithms are interpretable, require no training data, and rely on physical models, ensuring reliability in data-scarce scenarios. Finally, they demand fewer computational resources, enabling efficient deployment in embedded systems.
Traditional grayscale-based algorithms offer advantages for PHE sheet defect detection but assume symmetrical defect profiles. Accuracy decreases with variable widths and asymmetry. Non-directional operators also increase false detections for directional defects.
However, significant challenges remain in detecting micro-crack defects on PHE sheet surfaces with existing methods; grayscale-based approaches struggle with asymmetric grayscale profiles, while deep learning models suffer feature degradation for small-scale defects, yielding high miss rates under industrial computational constraints. To address these issues, this study establishes a theoretical foundation for parameter selection in variable width defect detection. We propose a directional gradient-based algorithm that mathematically constrains the Gaussian template width to cover variable width defects with a fixed σ, explicitly reframing the detection defect from ridge edges in grayscale images to centrally symmetric double ridge edges in gradient images. By employing a directional Sobel operator to generate gradient images and utilizing Gaussian line detection to extract dual ridge edges, the method mitigates asymmetry impacts while enhancing accuracy for small scale micro-crack defects under data and computational constraints.
The remainder of this paper is organized as follows: the first section provides the definition of micro-crack defects in PHE sheets; the second section elaborates on the motivation and methodology; the third section presents the testing of this method and comparative experiments with other algorithms, focusing on false detection rates, missed detection rates, and testing times under conditions of limited computational resources and scarce data; and the fourth section summarizes the contributions of this work.

2. Micro-Crack Defect Features

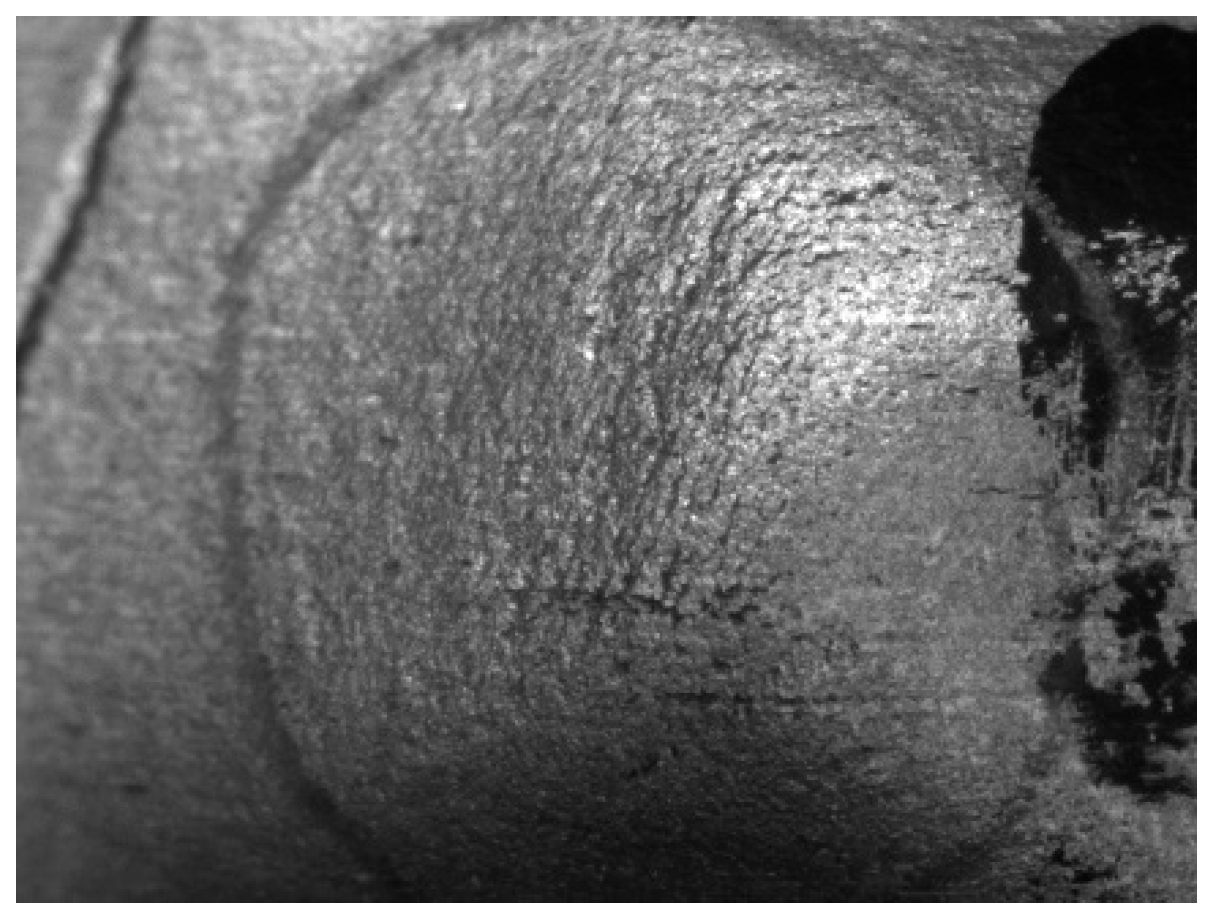
Micro-crack defects are common defects in the stamping process of thin plates, with a conceptual diagram of micro-crack defects shown in Figure 1. The red double arrow line represents the defect width. Figure 2 provides a high-magnification image illustrating the micro-crack defects present in PHE. The width of a defect is defined as follows: W denotes the defect width, and x{i} represents the discrete grayscale distribution across a grayscale profile. The process starts from the maximum intensity point in x{i}. The first non-monotonically decreasing points on either side of this maximum are then identified. The distance between these two endpoints is defined as the defect width W. Based on measurements of current database images, the defect features are described as follows: (1) The defects exhibit a defined width, ranging between 7 and 21 pixels; (2) they are located at the boundary between the upper surface of the plate protrusions and the inclined surface; (3) the defects appear as linear features, approximately parallel to the plate protrusions; and (4) the grayscale profile is asymmetrical, with a smooth grayscale on the inclined surface side and an initial dip followed by a sharp increase on the plate protrusion side.
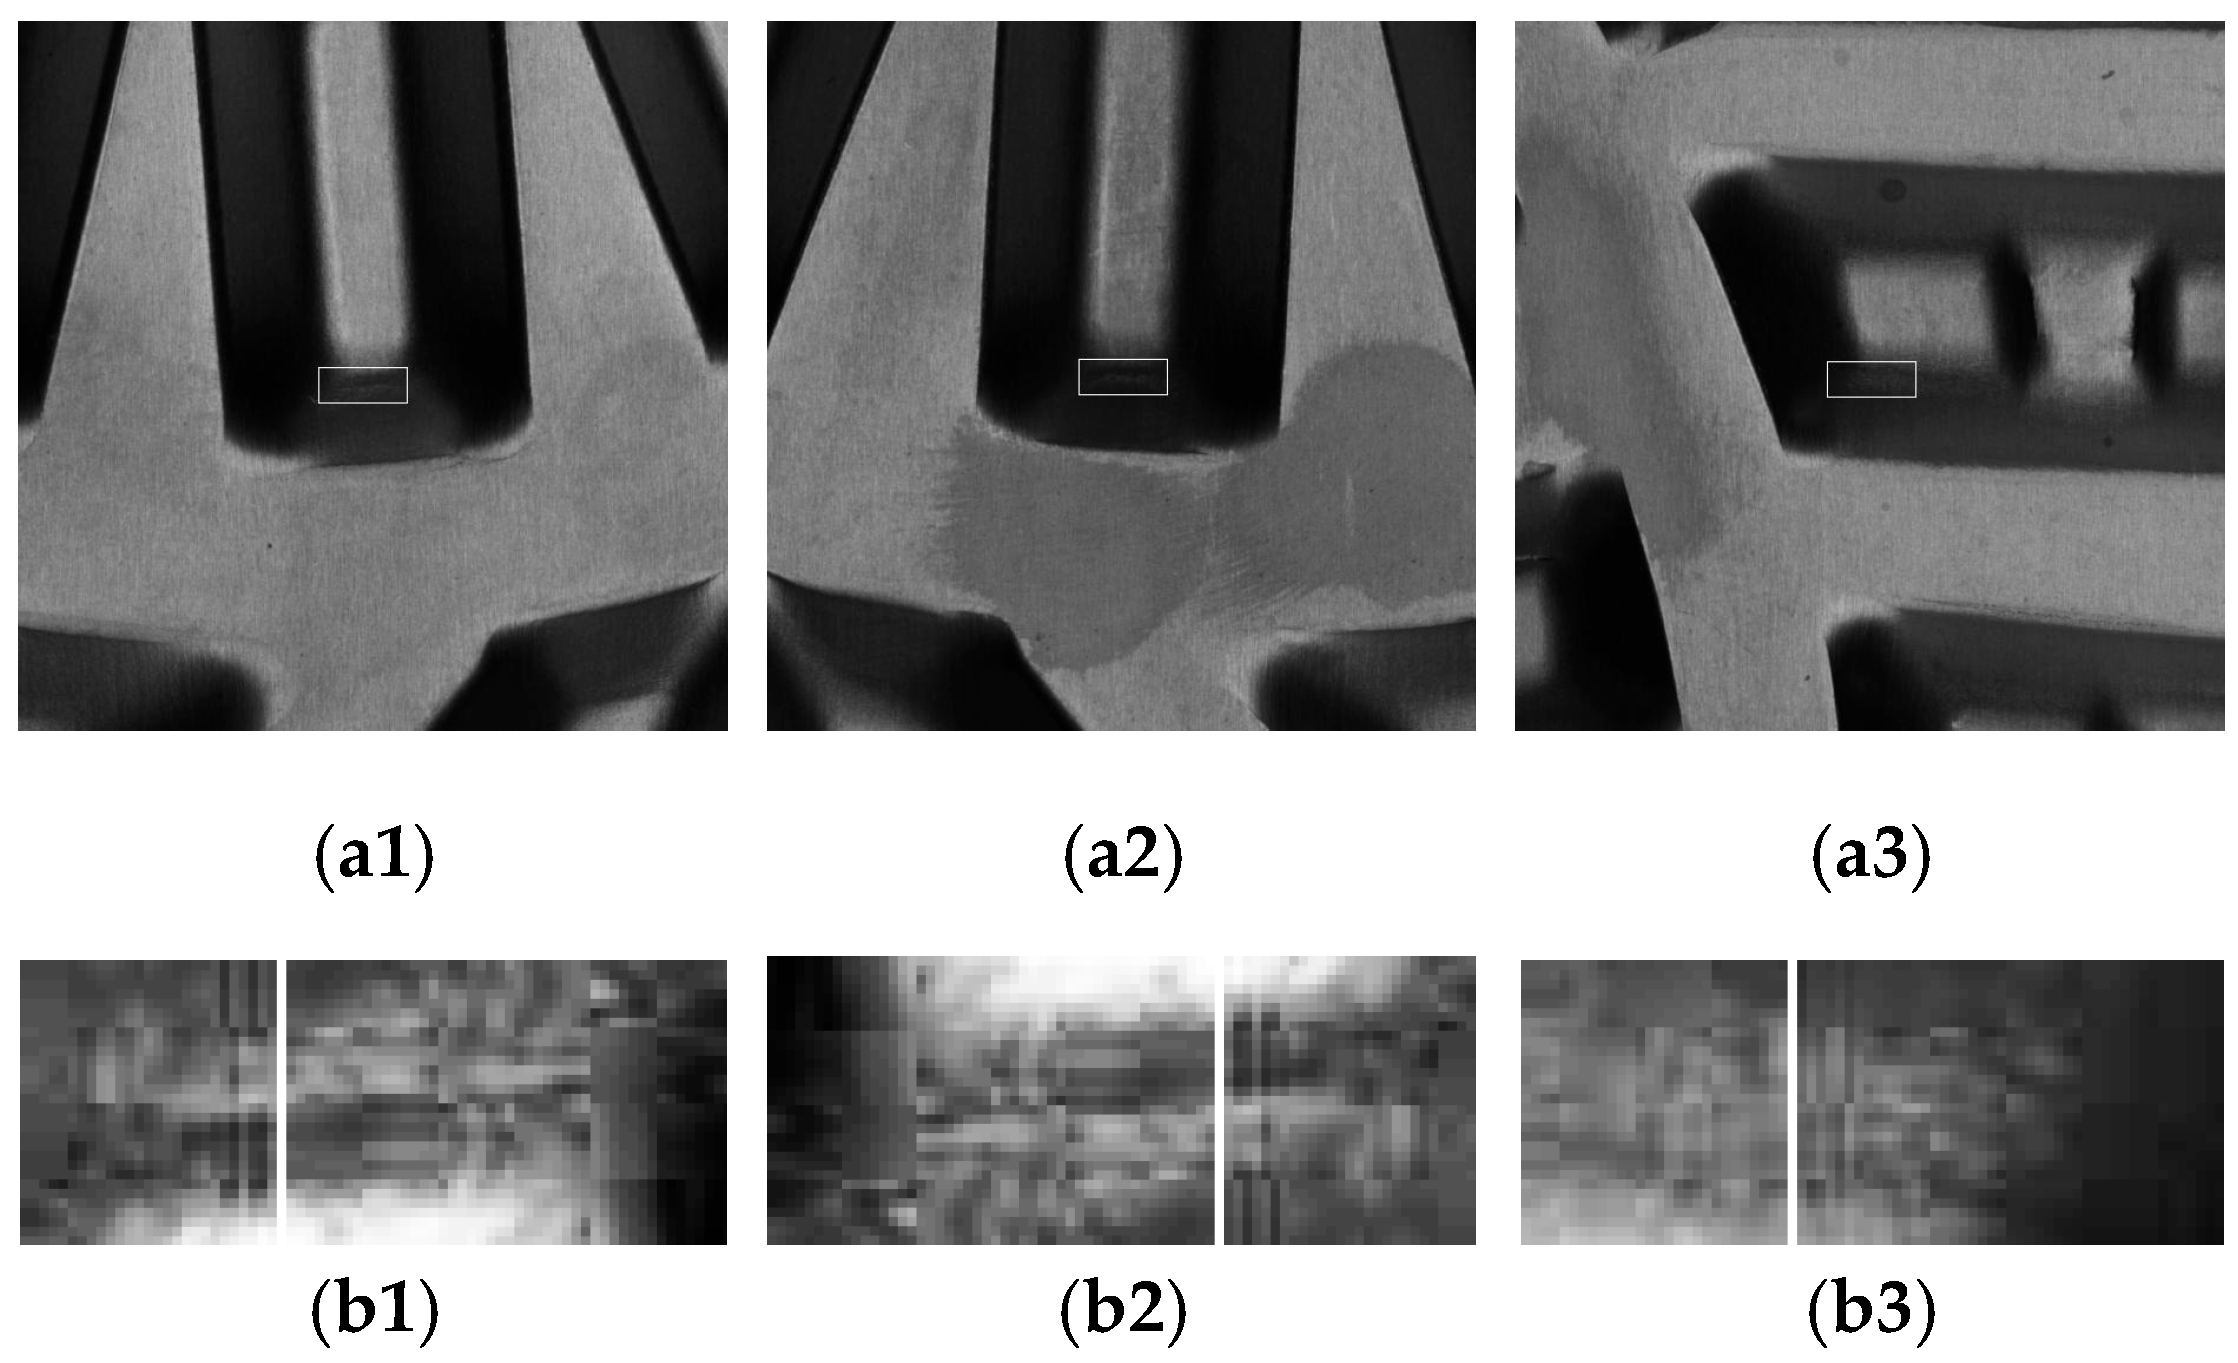
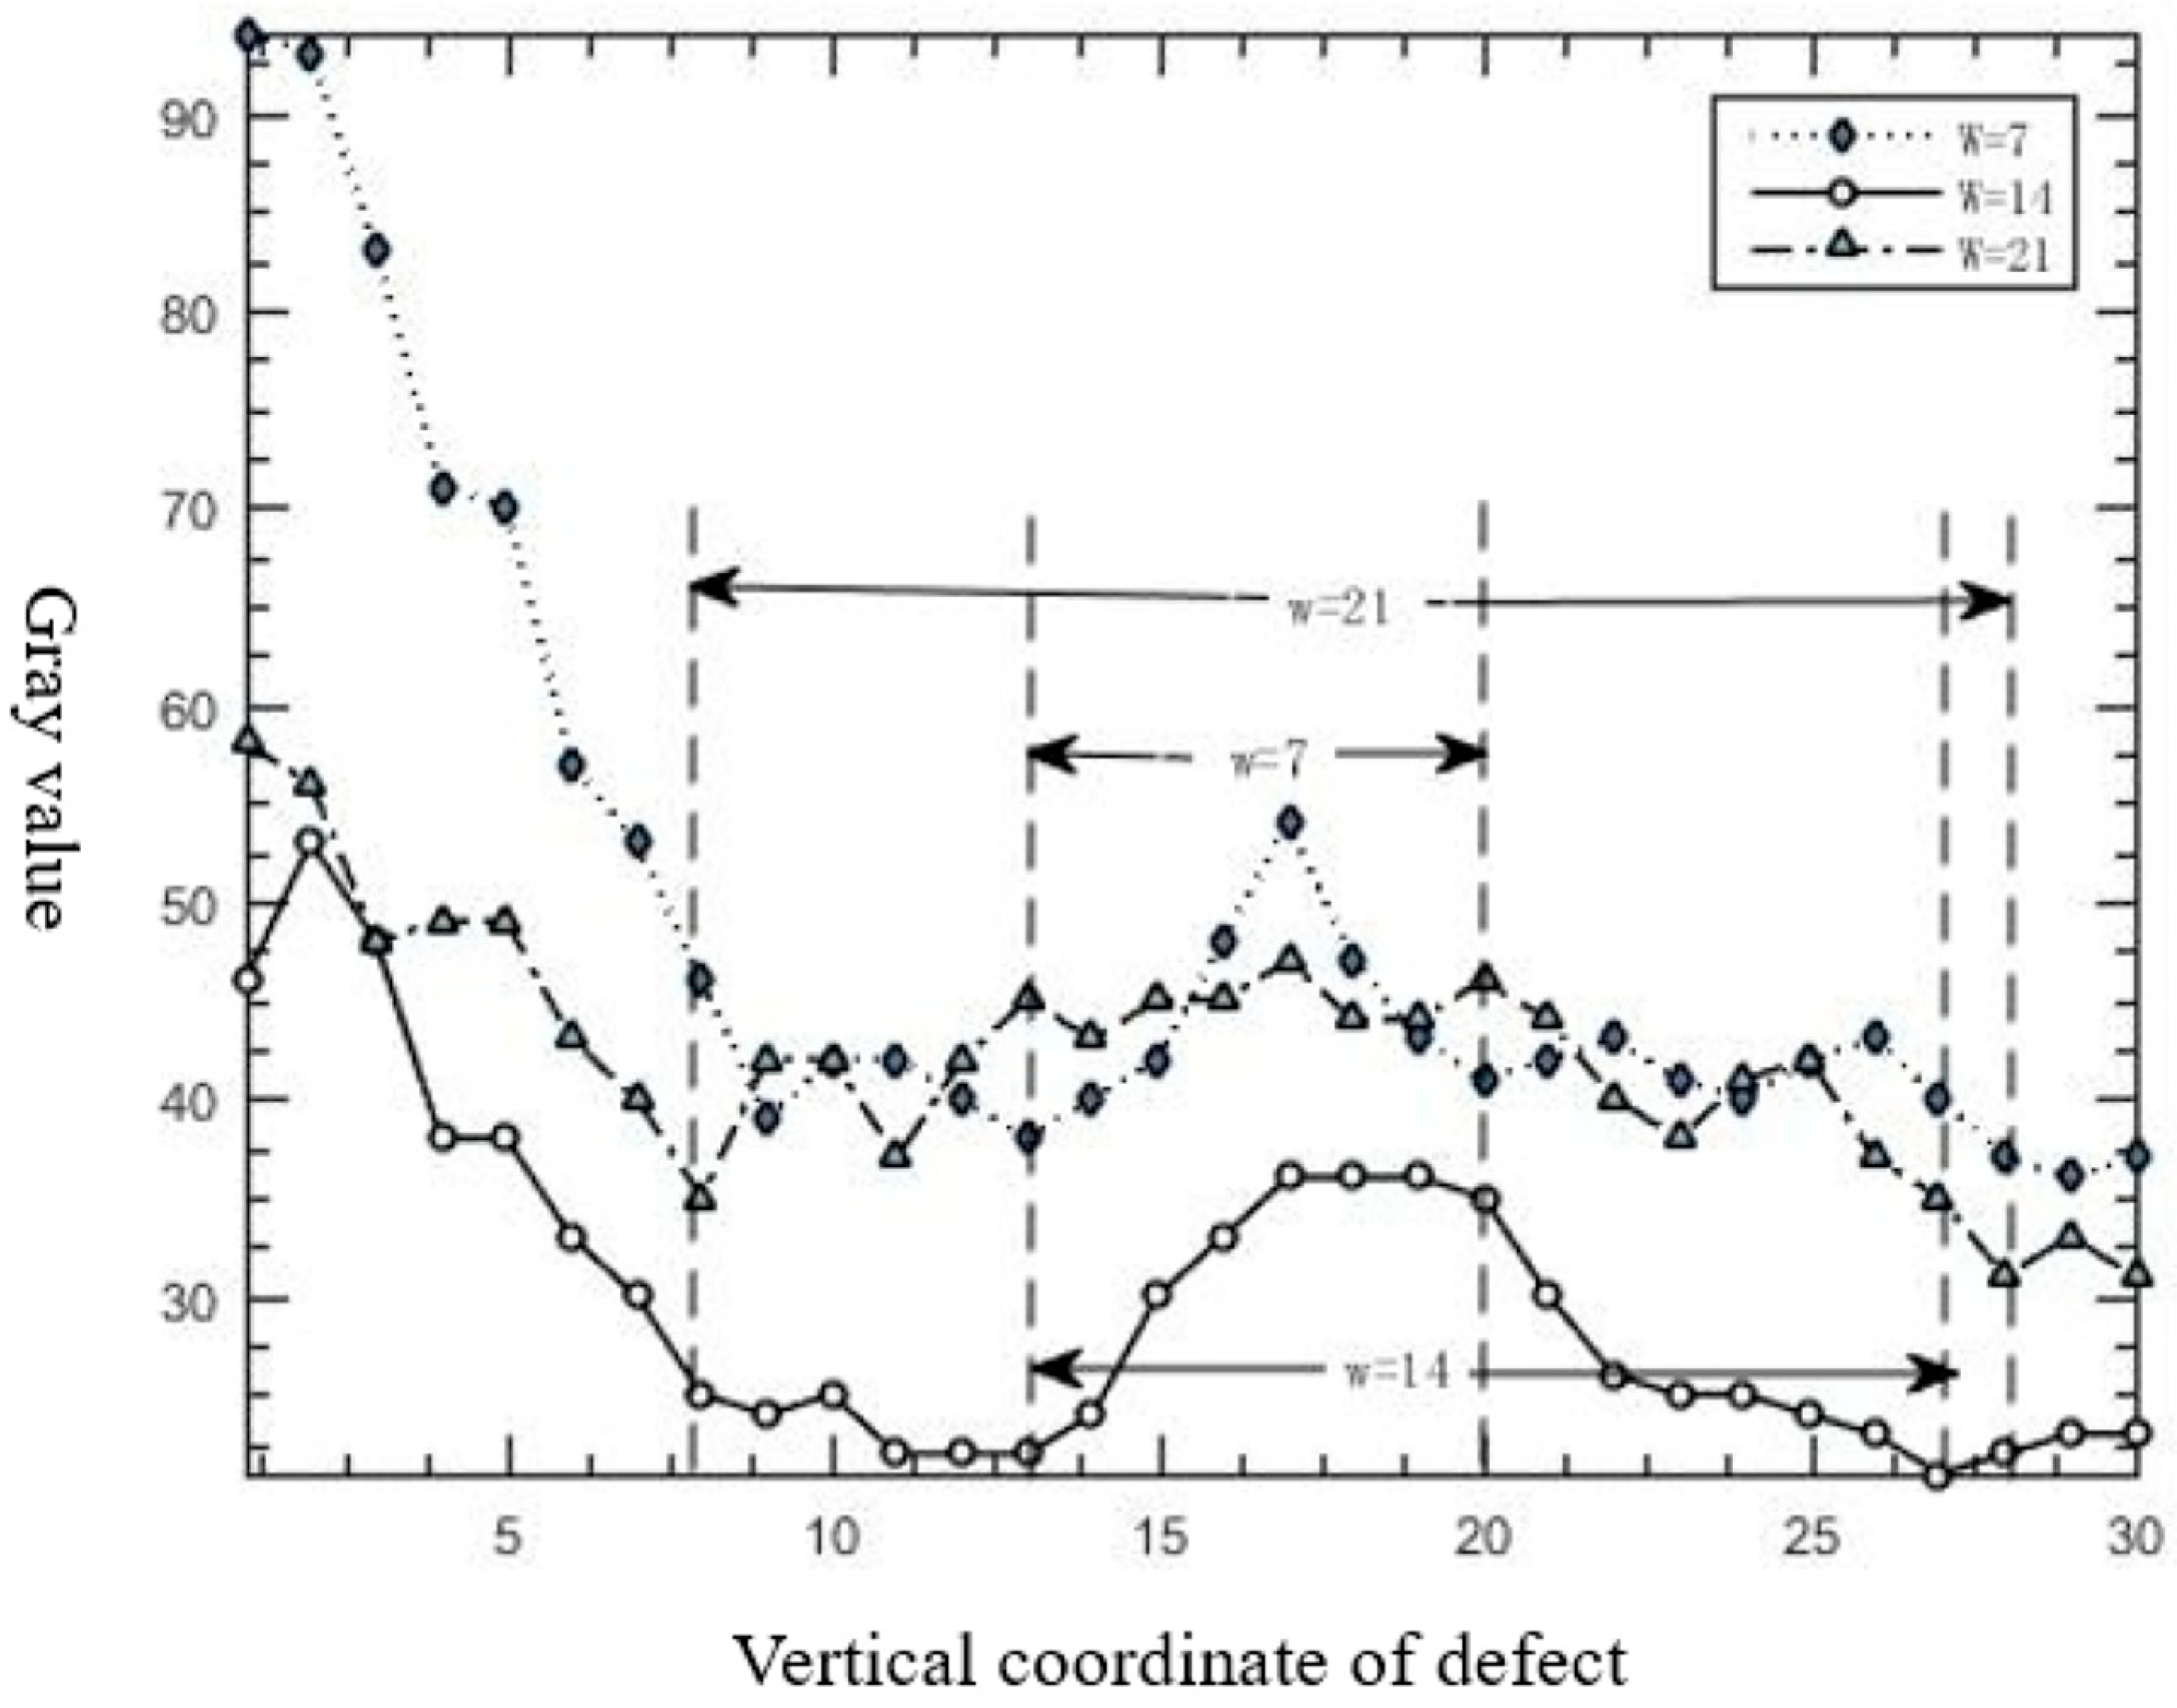
To illustrate the variations in defect width and the asymmetric features of the gray level distribution, Figure 3(a1–a3) display the plate protrusion regions with defects measuring 7, 14, and 21 pixels in width, respectively, with the specific defect locations marked by rectangular boxes. To further visualize these defect features, Figure 3(b1–b3) show the defect regions from Figure 3(a1–a3), enlarged in size and enhanced in contrast. Figure 4 provides gray-level profile information across the horizontal cross-sections of each defect region shown in Figure 3(b1–b3) (indicated by the horizontal line in the images). By marking each defect’s endpoints with double-dashed lines in the profile charts, the regions of defects with varying widths are further defined. The gray level profile reveals a gradual change on one side of the defect, while the other side exhibits an initial decrease followed by a sharp increase, highlighting the distinctive asymmetry in the gray-level distribution of the defect and its surrounding area.
The above analysis clarifies that micro-crack defects on the PHE sheets exhibit variable widths and an asymmetric gray level profile. Combining this information with prior knowledge of the defect’s position and orientation, this study implements an asymmetric defect detection algorithm based on directional gradient and Gaussian line detection.

3. Micro-Crack Defect Detection Algorithm Based on Directional Gradient and Gaussian Line Detection

3.1. Extraction of Micro-Crack Defects’ Candidate Regions

Micro-crack defects are formed at the boundary between the plate protrusions and the inclined surface as a result of stamping and bending operations. These defects occur at areas under maximum stress, allowing the detection area to be narrowed from the entire image to specific candidate regions. To ensure sufficient width for convolution operations, the inclined surface of the plate protrusions is defined as the candidate region for micro-crack defects. A schematic diagram of the plate protrusions is shown in Figure 5.
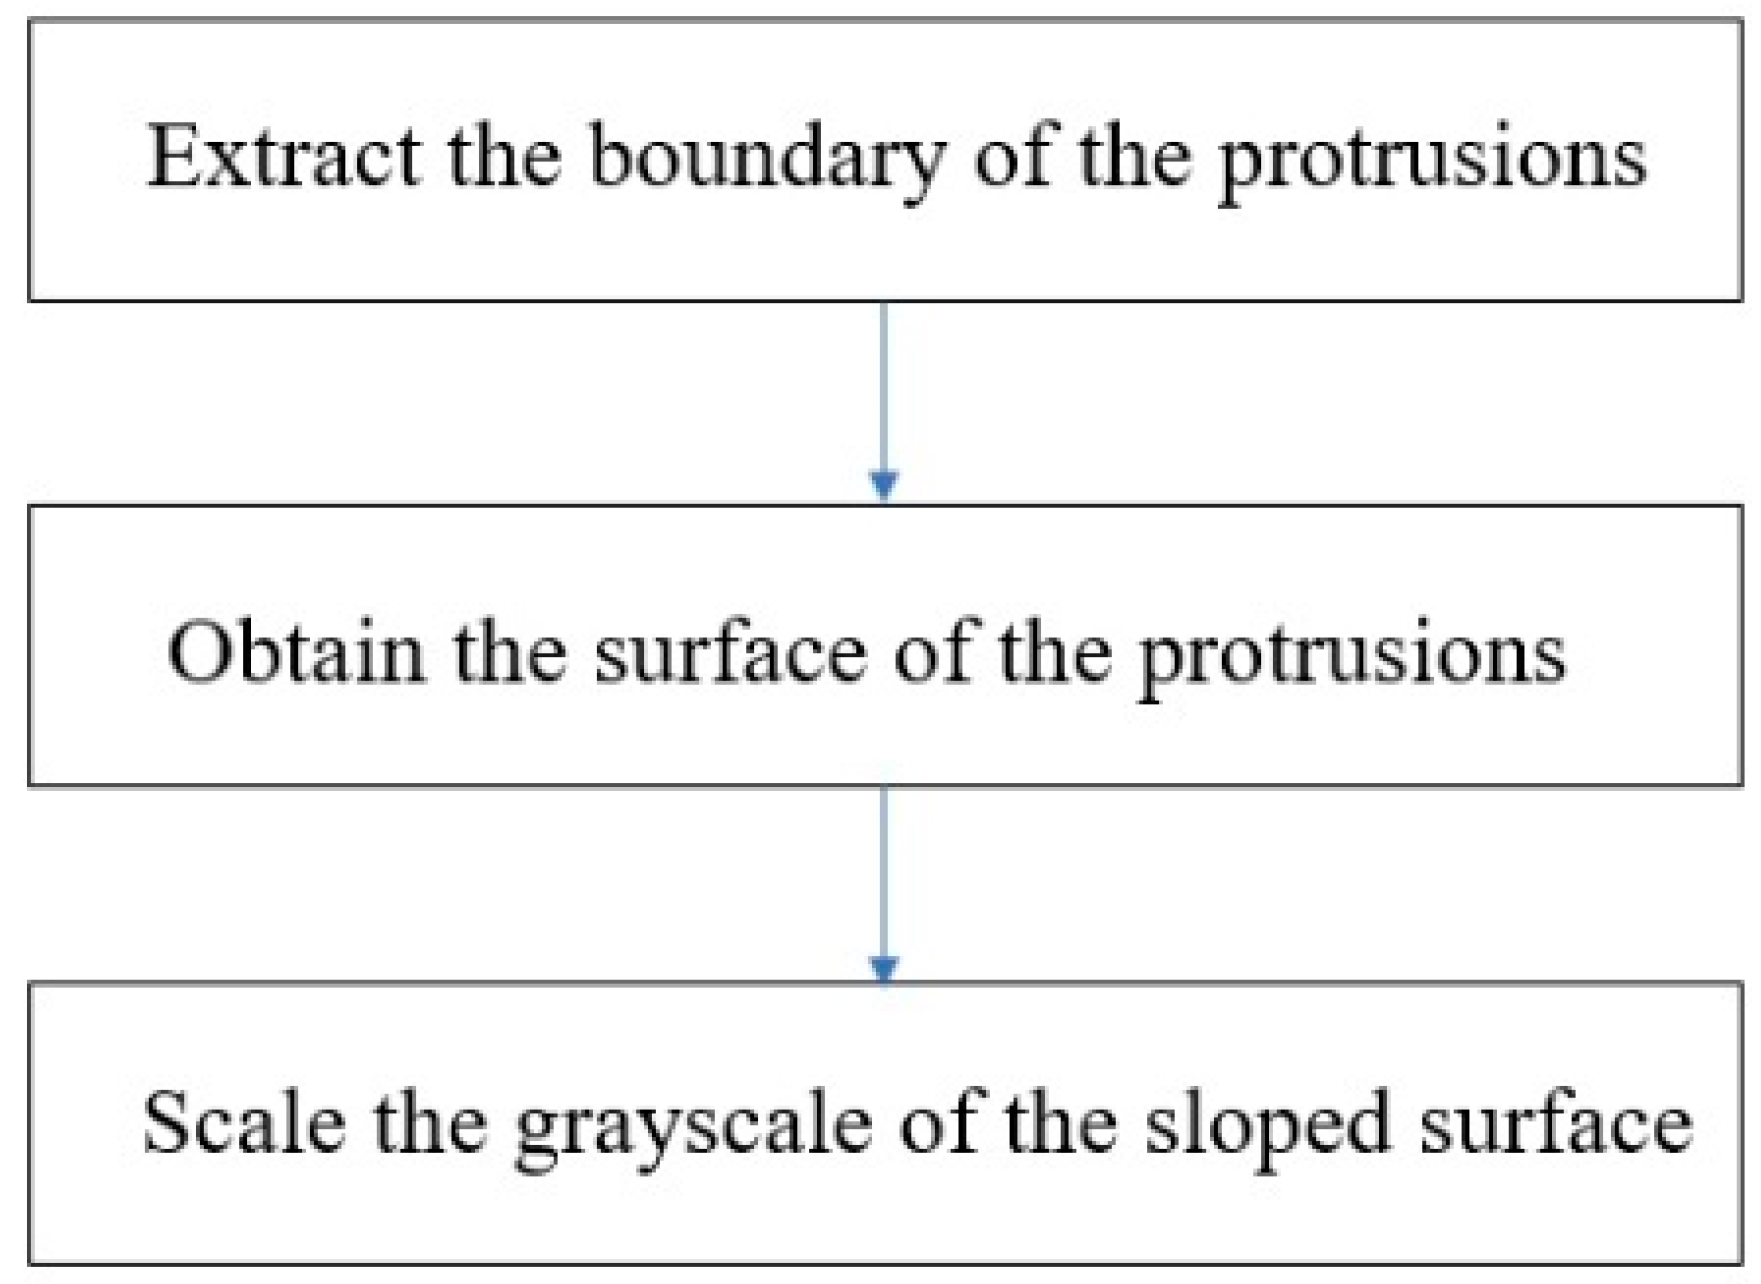
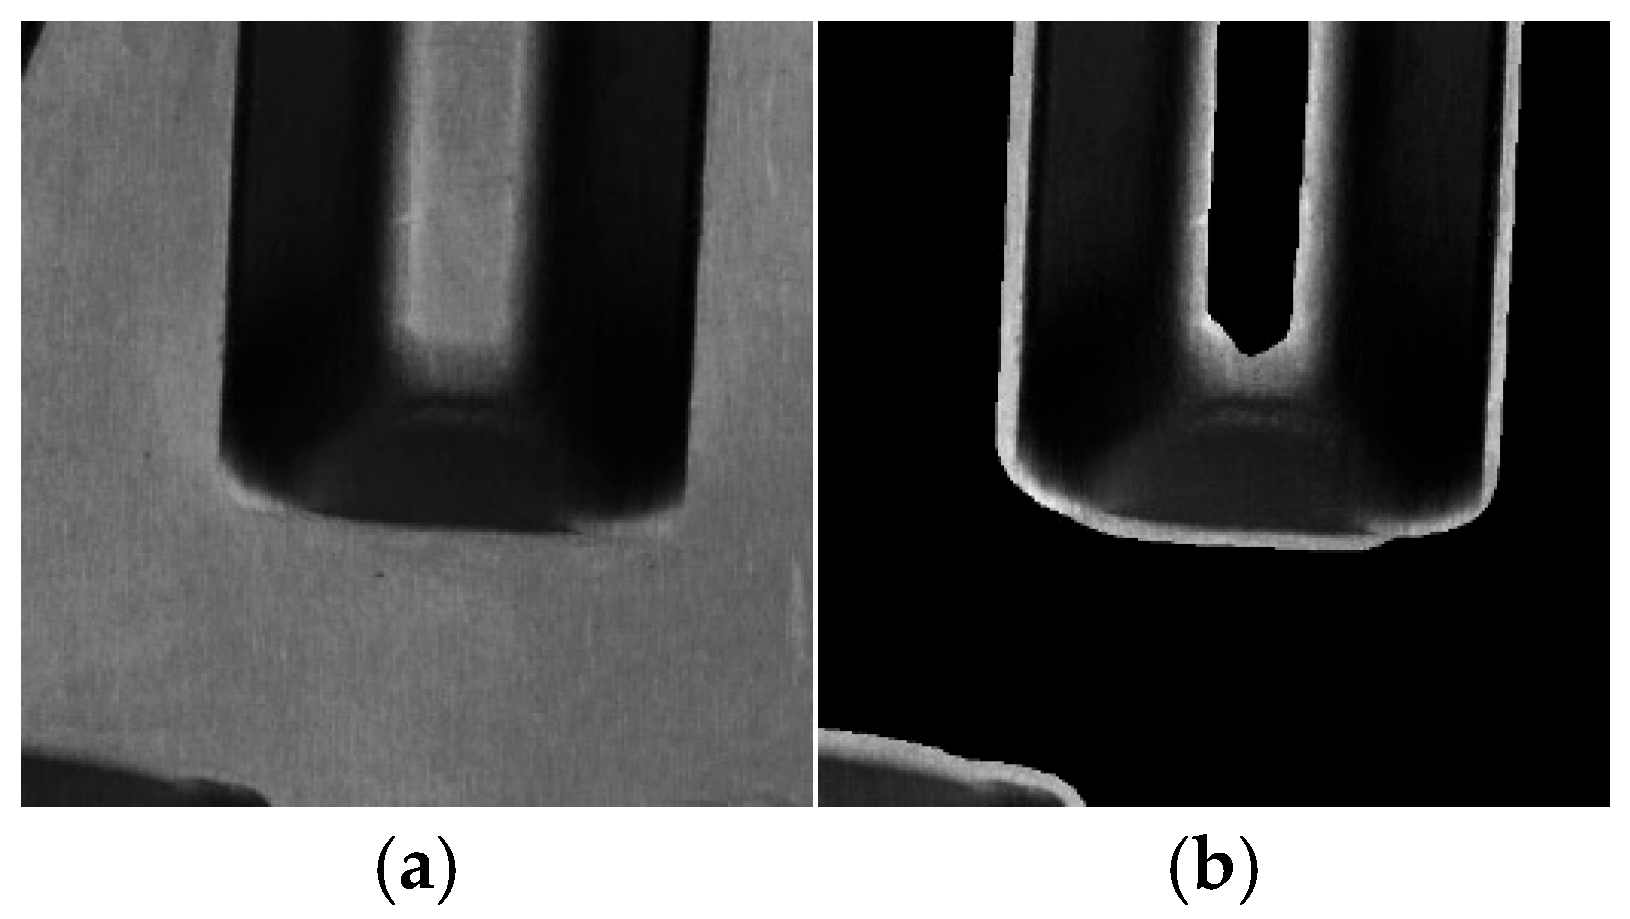
The candidate region extraction process is illustrated in Figure 6. The original image of the defect area is shown in Figure 7a, while the extracted candidate region is displayed in Figure 7b.

3.2. Sharpening Micro-Crack Defects Using Directional Gradient Operators

3.2.1. Converting Grayscale Images to Gradient Images

Sharpening enhances the edges and transitional areas in a grayscale image by increasing the contrast between adjacent pixels. This enhancement can improve the performance of gradient operators when converting a grayscale image into a gradient image. As shown in Figure 4, the grayscale profiles across the horizontal cross-sections of the defect reveal that the main body of the defect exhibits a grayscale extremum. One side shows a gradual change, while the other side shows a drop followed by a sharp increase.
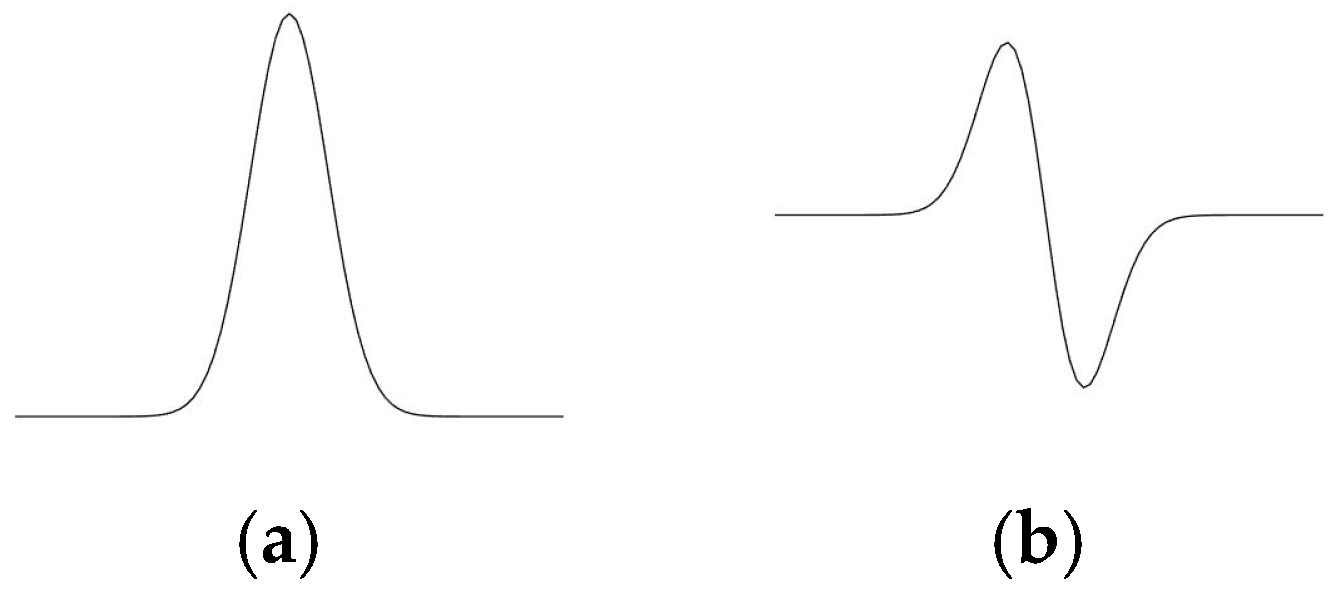
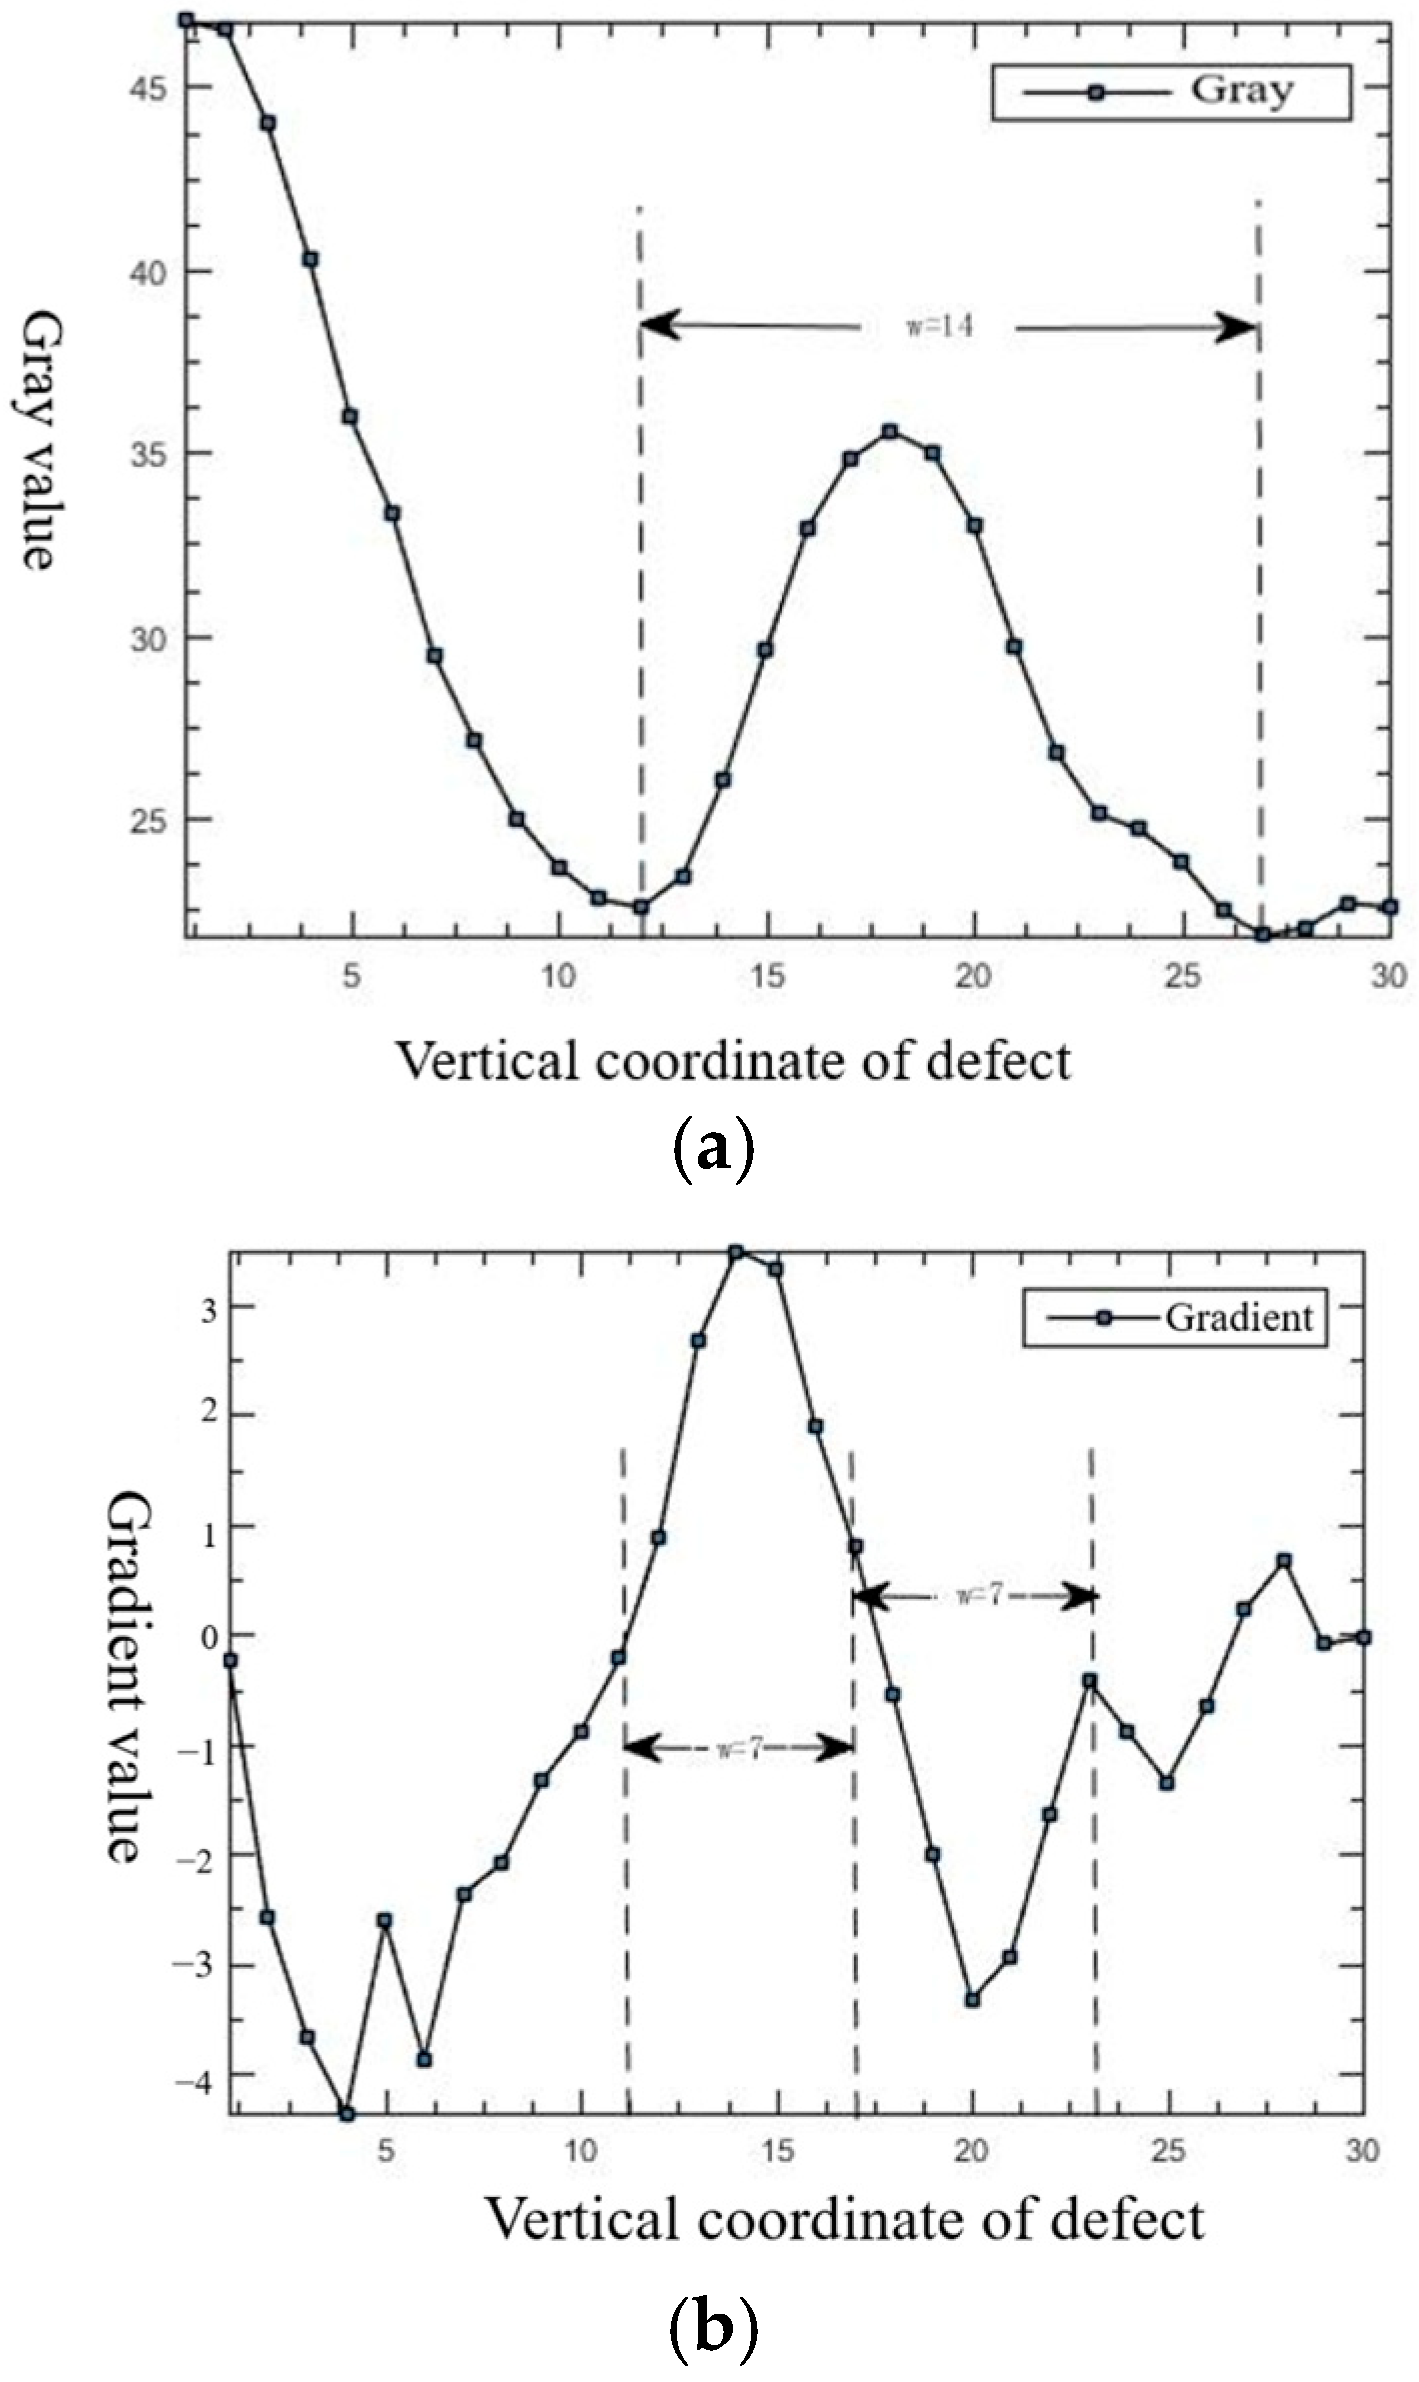
Both the maximum and minimum grayscale values are characterized by abrupt grayscale transitions, which are referred to as ridge edges. The ideal grayscale profiles across the horizontal cross-sections of a linear defect are shown in Figure 8a, where the ridge edges are assumed to be symmetric on both sides with a width of a. The first derivative of these profiles consists of a pair of minor ridge edges, symmetric around the origin, with a width approximately half that of the original, as illustrated in Figure 8b. Therefore, when describing the shape of a linear defect, the grayscale image of the defect can be fitted using ridge edges, or the gradient image can be fitted using the first derivative of the ridge edges. Figure 9a,b present the grayscale profile and corresponding gradient profile along the horizontal cross-sectional line of the defect shown in Figure 3(b2). A comparison between Figure 8 and Figure 9 reveals that the horizontal cross-sectional grayscale profile of the defect closely approximates a ridge edge, while the corresponding gradient profile resembles the first derivative of the ridge edge. This suggests that both single grayscale ridge edge detection and center-symmetric double ridge edge detection in the gradient image are effective for defect detection.

3.2.2. Determination of Template Orientation

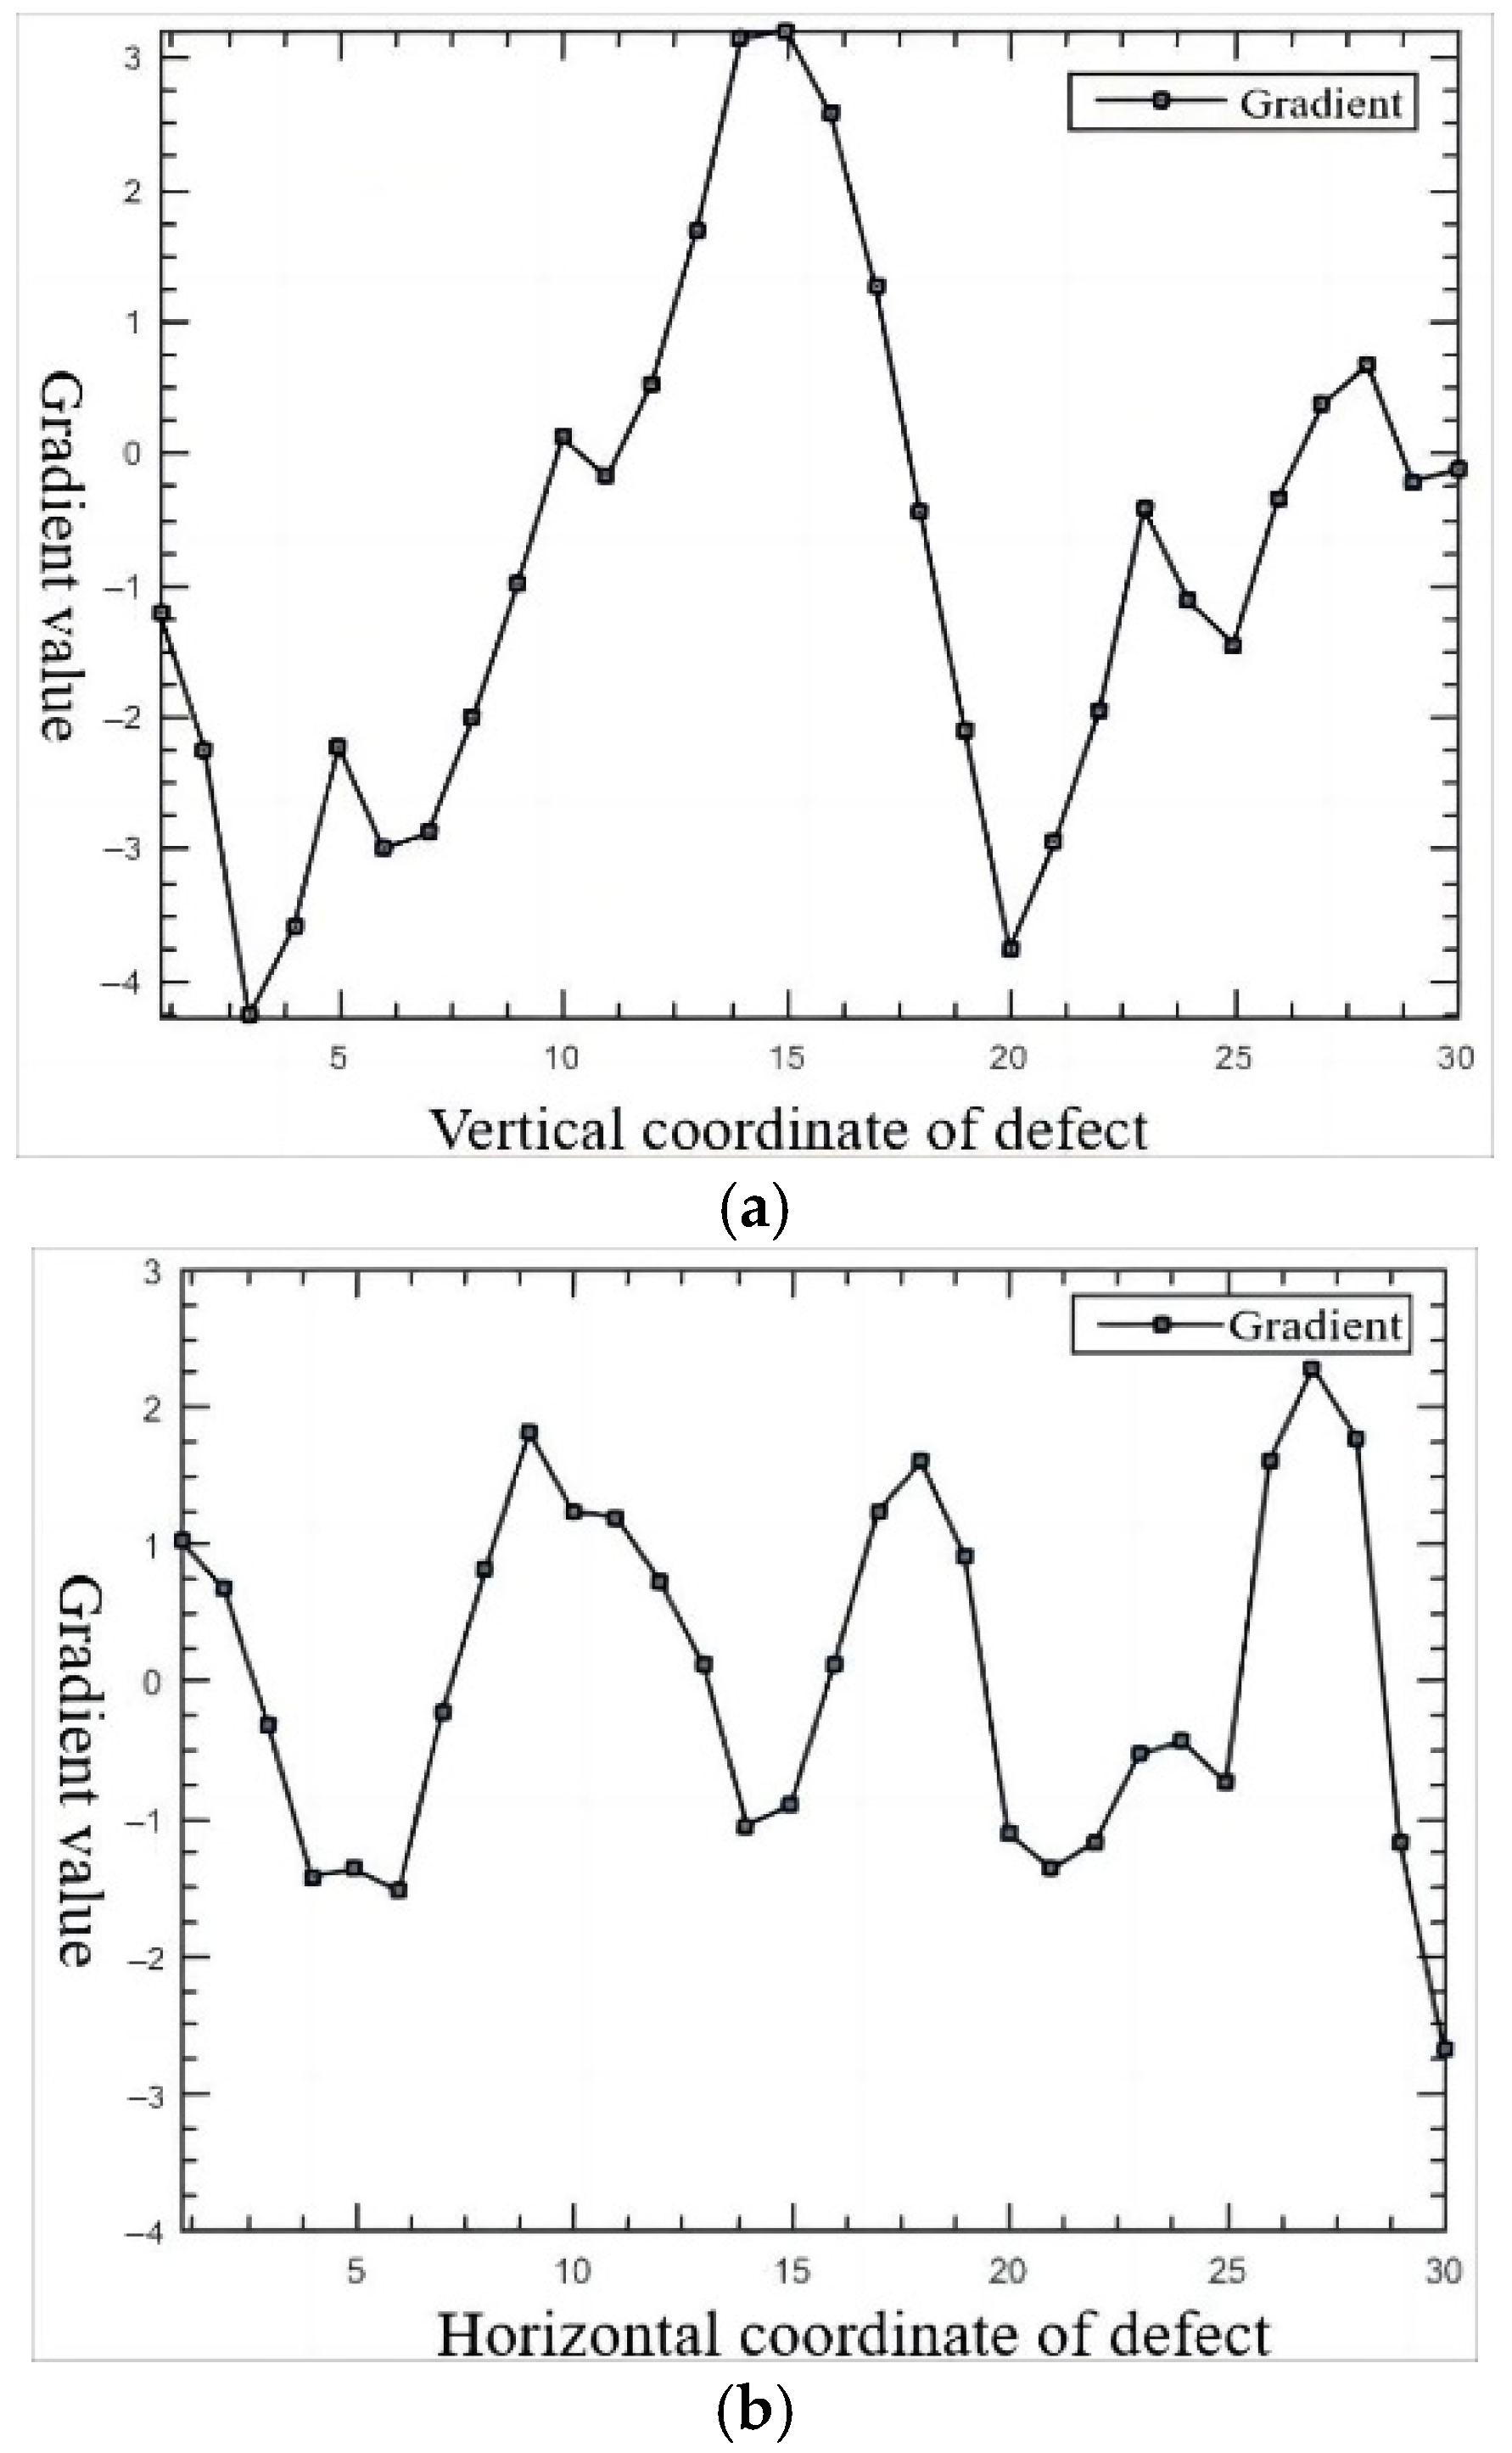
This discussion focuses on the orientation of the gradient template in sharpening defect edges. As shown in the dataset, the defects predominantly appear as horizontal line segments. Theoretically, horizontal defects can be sharpened more effectively using a vertical gradient template. Figure 10a displays an example of a horizontal defect characterized by a low grayscale value, while Figure 10b shows the defect with enhanced contrast. The gradient profiles of this defect, sharpened using the vertical and horizontal gradient templates, are shown in Figure 11a,b, respectively, along the cross-sectional line indicated in the images. The results show a maximum gradient difference of 7 for the vertical gradient template and 4.5 for the horizontal one. This confirms that the vertical template enhances the contrast of horizontal defects more effectively.

3.2.3. Determination of Template Size

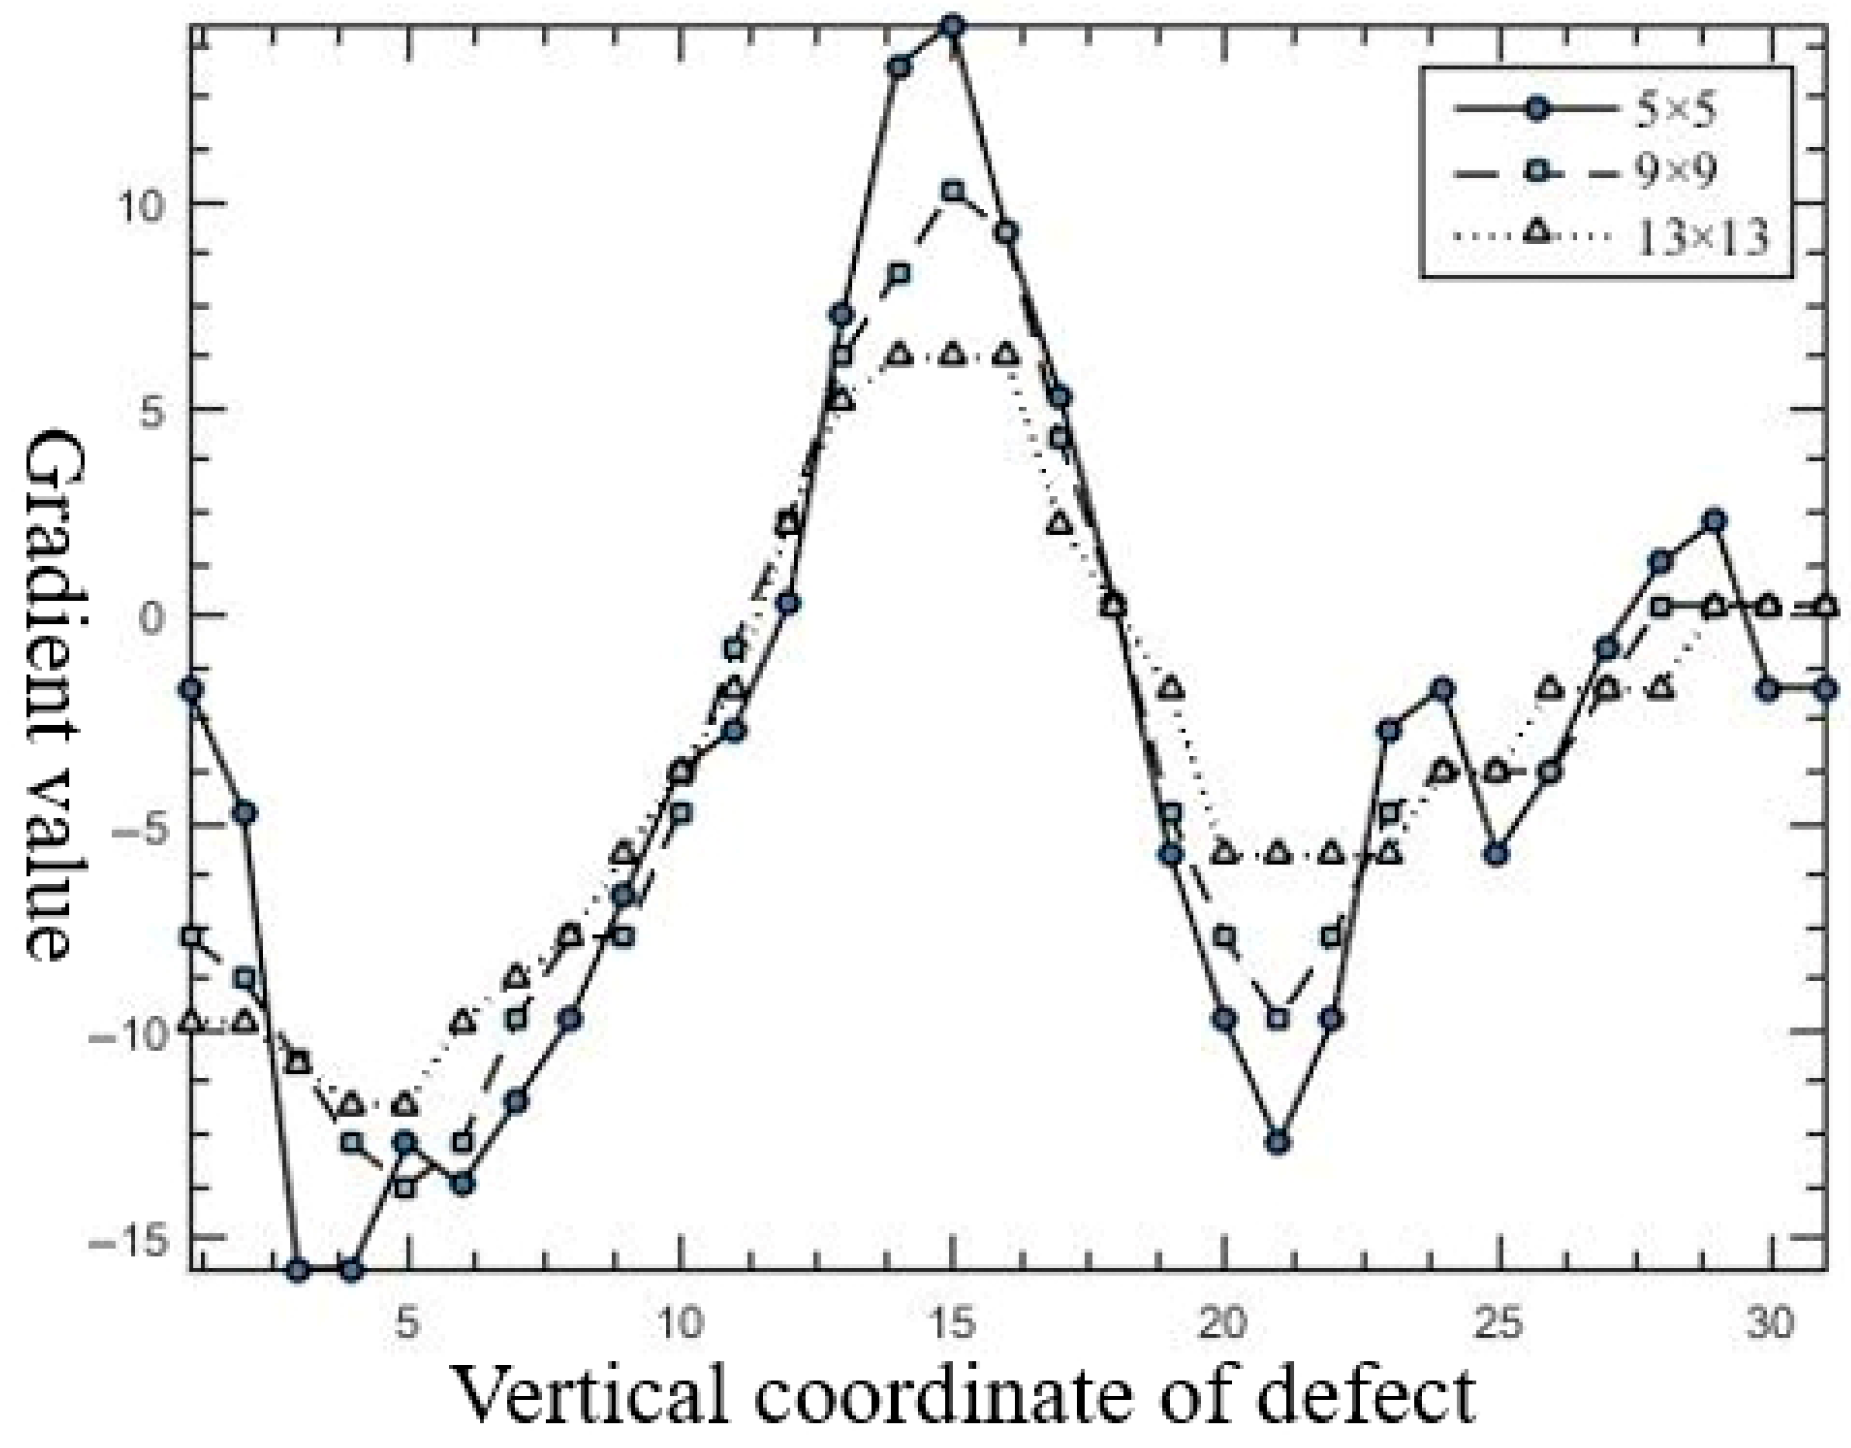
After determining the orientation, the template size is considered. Increasing the template size affects the gradient sharpening results due to the influence of edge data. As the template size increases, the weight of abrupt transition information decreases, and the gradient difference reduces. Figure 12 shows the gradient profiles obtained by convolving the defect in Figure 3(a2) with gradient templates of sizes 5 × 5, 9 × 9, and 13 × 13. The longitudinal gradient differences are 28, 22, and 12, respectively, confirming the validity of the above theory. Therefore, a template size of 5 × 5 is selected.
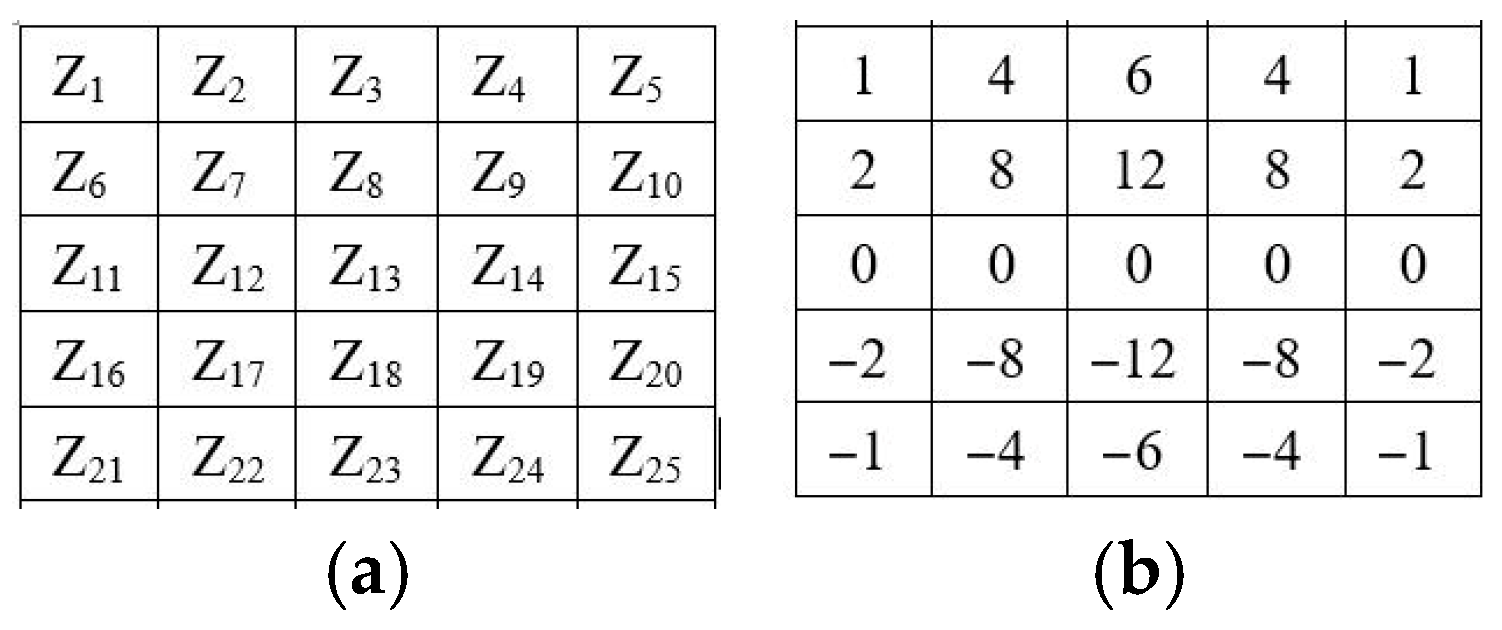
Finally, the weights of the corresponding template elements are determined. A 5 × 5 region of the image matrix is defined, where z represents the grayscale value, as shown in Figure 13a. To ensure the center point has a higher weight than the edges, the Sobel template is chosen over the Prewitt template. Using Pascal’s triangle, the Sobel template is expanded to a 5 × 5 size, resulting in the final gradient template shown in Figure 13b. The template is then applied across the image to filter it, producing the longitudinal gradient coefficient map.
The gradient conversion methodology initiates by recognizing that micro-crack defects exhibit asymmetric ridge-edge profiles in grayscale space. This enables defect detection through the identification of centrally symmetric double-ridge structures in gradient space. To optimize this transformation, we systematically selected a vertical 5 × 5 Sobel operator. Firstly, orientation was determined perpendicular to predominant defect directions, yielding higher gradient contrast. Secondly, kernel size was optimized to 5 × 5 to maximize feature preservation. Finally, Pascal-derived weights prioritized central pixels to enhance sensitivity to thin linear features while suppressing edge noise. This directional gradient approach thus converts grayscale images into enhanced representations where asymmetric defects manifest as detectable symmetric dual ridges.

3.3. Extraction of Micro-Crack Defects Using a Gaussian Line Detection Algorithm

When defect detection is shifted from the original image to the gradient image, the first derivative image of an ideal linear defect consists of two centrally symmetric ridge edges, as shown in Figure 9b. Line detection techniques are applied to separately identify the positive and negative ridge edges of the defect. Given the high precision required for defect localization, a Gaussian line detection algorithm under sub-pixel accuracy is used for bidirectional gradient detection.

3.3.1. Definition of the Gaussian Line Detection Operator

Let the image function be f ( x , y ) and the two-dimensional Gaussian function be g ( x , y ) . Its first-order partial derivatives and second-order partial derivatives are expressed in Equations (1)–(5), where σ represents the standard deviation of the Gaussian function. The Hessian matrix H ( x , y ) is formed by convolving the second-order derivative matrix of the Gaussian function with the gradient function, as shown in Equation (6).
g x = x σ 2 × 2 π σ 2 × e x 2 + y 2 2 σ 2
g y = y σ 2 × 2 π σ 2 × e x 2 + y 2 2 σ 2
g x x = ( x 2 σ 4 1 σ 2 ) × 1 2 π σ 2 × e x 2 + y 2 2 σ 2
g y y = ( y 2 σ 4 1 σ 2 ) × 1 2 π σ 2 × e x 2 + y 2 2 σ 2
g x y = x y σ 4 × 1 2 π σ 2 × e x 2 + y 2 2 σ 2
H ( x , y ) = g x x g x y g x y g y y f ( x , y )
First, the image is convolved with the second-order derivative of the Gaussian template to smooth noise and sharpen the defect. The maximum absolute eigenvalue of the matrix represents the maximum curvature intensity at a point, while the corresponding eigenvector indicates the normal direction of the edge centerline.
Second, to ensure sub-pixel accuracy, the grayscale distribution function in the neighborhood along the normal direction is expanded using a Taylor series. The value of any sub-pixel point in the neighborhood is described by Equation (7), where ( x 0 , y 0 ) is the base point, and the unit vector calculated from the Hessian matrix is ( n x , n y ) .
f ( ( t n x + x 0 ) , ( t n y + y 0 ) ) = f ( x 0 , y 0 ) + t n x g x ( x 0 , y 0 ) + t n y g y ( x 0 , y 0 ) + 1 2 t 2 n x 2 g x x ( x 0 , y 0 ) + t 2 n x n y g x y ( x 0 , y 0 ) + 1 2 t 2 n y 2 g y y ( x 0 , y 0 )
Taking the partial derivative of the above Equation with respect to the coefficient t and setting it to zero, as shown in Equation (8), yields the sub-pixel coordinates of the extrema. The expression for the coefficient t is given in Equation (9).
t f ( ( t n x + x 0 ) , ( t n y + y 0 ) ) = 0
t = n x g x + n y g y n x 2 g x x + n x n y + n y 2 g y y
Finally, we determine if the point with the zero first derivative is inside the neighborhood of the central pixel. This is illustrated in Equation (10). A hysteresis threshold is applied to filter the second-order derivatives of all extrema, extracting the line edge center points that meet the requirements. If the eight-neighborhood of the identified sub-pixel center point contains another point, the two points are connected to form a line. This process is repeated iteratively until the centerline of the defect is obtained.
( t n x , t n y ) [ 1 2 , 1 2 ] × [ 1 2 , 1 2 ]

3.3.2. Selection of Gaussian Standard Deviation

The standard deviation σ of the Gaussian function controls the shape of the Gaussian function. Based on the property of inner products, the closer the shape of the template function matches the defect function, the more pronounced the inner product result becomes. When the defect and template widths do not match, the following scenarios are considered. Let the defect width be W o and the corresponding template range be W m .
When W o W m , the grayscale variation region of the defect can be fully detected after the convolution and binarization operations. Moreover, the closer W o is to W m , the more complete the defect region appears.
When W o > W m , the central line of the defect to be detected is replaced by two peaks and a central valley.
Figure 14 shows the detection results of lines with widths of 7 to 35 pixels using a template width of 21 pixels. As the theoretical linear defect width gradually increases from 7 to 21, which equals the width of the Gaussian template, the detection performance improves. However, when the width continues to increase from 21 to 35, false detections occur on both sides of the extremum point, while the extremum point itself is missed. The results align with the discussion, leading to the following conclusion: the template width can be larger than but not smaller than the defect width. When the defect width lies within a certain range, setting the template width equal to the maximum defect width suffices.
This work bridges a critical gap in industrial defect detection by providing the first theoretical constraint for Gaussian parameter selection in variable-width linear defects. Based on the convolution similarity principle, the Gaussian template to defect similarity governs response intensity, as follows:
  • Template width ≥ defect width: preserved central peak, effective detection.
  • Template width < defect width: split dual peaks, missed detection.
To enable single-σ coverage of variable-width defects, let the half-width of the defect be W . To ensure the Gaussian template width matches the defect function width [33], the condition in Equation (11) must be satisfied.
σ W 3
Since the actual defects are the center-symmetric double-ridge edges in the gradient image, the combined widths of the two ridge edges theoretically correspond to the defect width, which ranges from 7 to 21 pixels. Thus, each ridge edge in the gradient image is approximately 3.5 to 10.5 pixels wide, with a half-width of 1.75 to 5.25 pixels. Therefore, the final maximum width information is 5.25 pixels. Substituting this value into Equation (11) yields σ , which is 3.03.
Our directional gradient approach transforms defect detection from grayscale space to gradient space, where micro-crack defects manifest as centrally symmetric double-ridge edges Figure 9b. To precisely localize these features, we implement a Gaussian line detection operator comprising three core computational phases: First, Hessian matrix construction via second-order Gaussian derivatives in Equations (1)–(6) identifies ridge normal vectors through eigenvalue analysis. Second, sub-pixel localization is achieved through Taylor series expansion along the normal direction in Equations (7)–(9), solving for extrema coordinates. Third, hysteresis thresholding and eight-neighborhood connectivity in Equation (10) generate continuous centerlines. Crucially, Gaussian width selection follows a convolution similarity principle: template width must exceed defect width to preserve central peaks, as indicated in Figure 14. We set σ via Equation (11) to cover the maximum half-width, ensuring single-parameter efficacy across variable defect dimensions.

3.4. Steps of the Micro-Crack Defects Detection Algorithm

The micro-crack defects detection algorithm consists of four main steps: first, extracting the candidate regions for micro-crack defects; second, converting the grayscale image into a gradient image using directional gradient operators; third, applying the Gaussian line detection algorithm twice to extract positive and negative edges; and finally, removing falsely detected lines. Each operation is described as follows.

3.4.1. Extract Candidate Regions

Select the inclined surface region of the plate protrusions in the PHE sheets image as the region of interest.

3.4.2. Obtain Gradient Image

Define the width and height of the candidate image matrix I ( x , y ) as w i and h i , respectively. Convolve the rectangular region I ( w i 4 , h i 4 ) of the original image I ( 4 , 4 ) with a 5 × 5 vertical Sobel template to obtain the gradient image, as shown in Equation (12).
f ( x , y ) = I 1 ( x , y ) G ( x , y )
In the Equation, I 1 ( x , y ) represents the remaining image matrix after removing a 4-pixel-wide boundary region, and G ( x , y ) is the convolution template, specifically the 5 × 5 vertical Sobel template shown in Figure 11b. f ( x , y ) is the gradient image obtained after the convolution of the image with the directional gradient operator.

3.4.3. Gaussian Line Detection

The second-order derivative operator in Gaussian line detection is convolved with the gradient image f ( x , y ) to construct the Hessian matrix, as shown in Equation (6). A Taylor series expansion is performed in the neighborhood of the center point to determine the sub-pixel center points, as described in Equations (7)–(9). Finally, a hysteresis thresholding method is applied to filter the sub-pixel points and connect them to obtain the sub-pixel line set L l i g h t .
Since both positive and negative ridge edges in the gradient image need to be detected, Equations (1)–(5) all take negative values, and the above process is repeated to obtain the sub-pixel line set L d a r k . To improve the efficiency of removing false detections in subsequent steps, L l i g h t and L d a r k are converted from sub-pixel to pixel resolution.

3.4.4. Recognition

According to the above detection method, in addition to detecting the gradient double edges of micro-crack defects, some edges that meet line characteristics are falsely detected. Therefore, it is necessary to remove these false detections. In the grayscale image, let the edge under examination be L i . The following operations are performed on each candidate edge in turn:
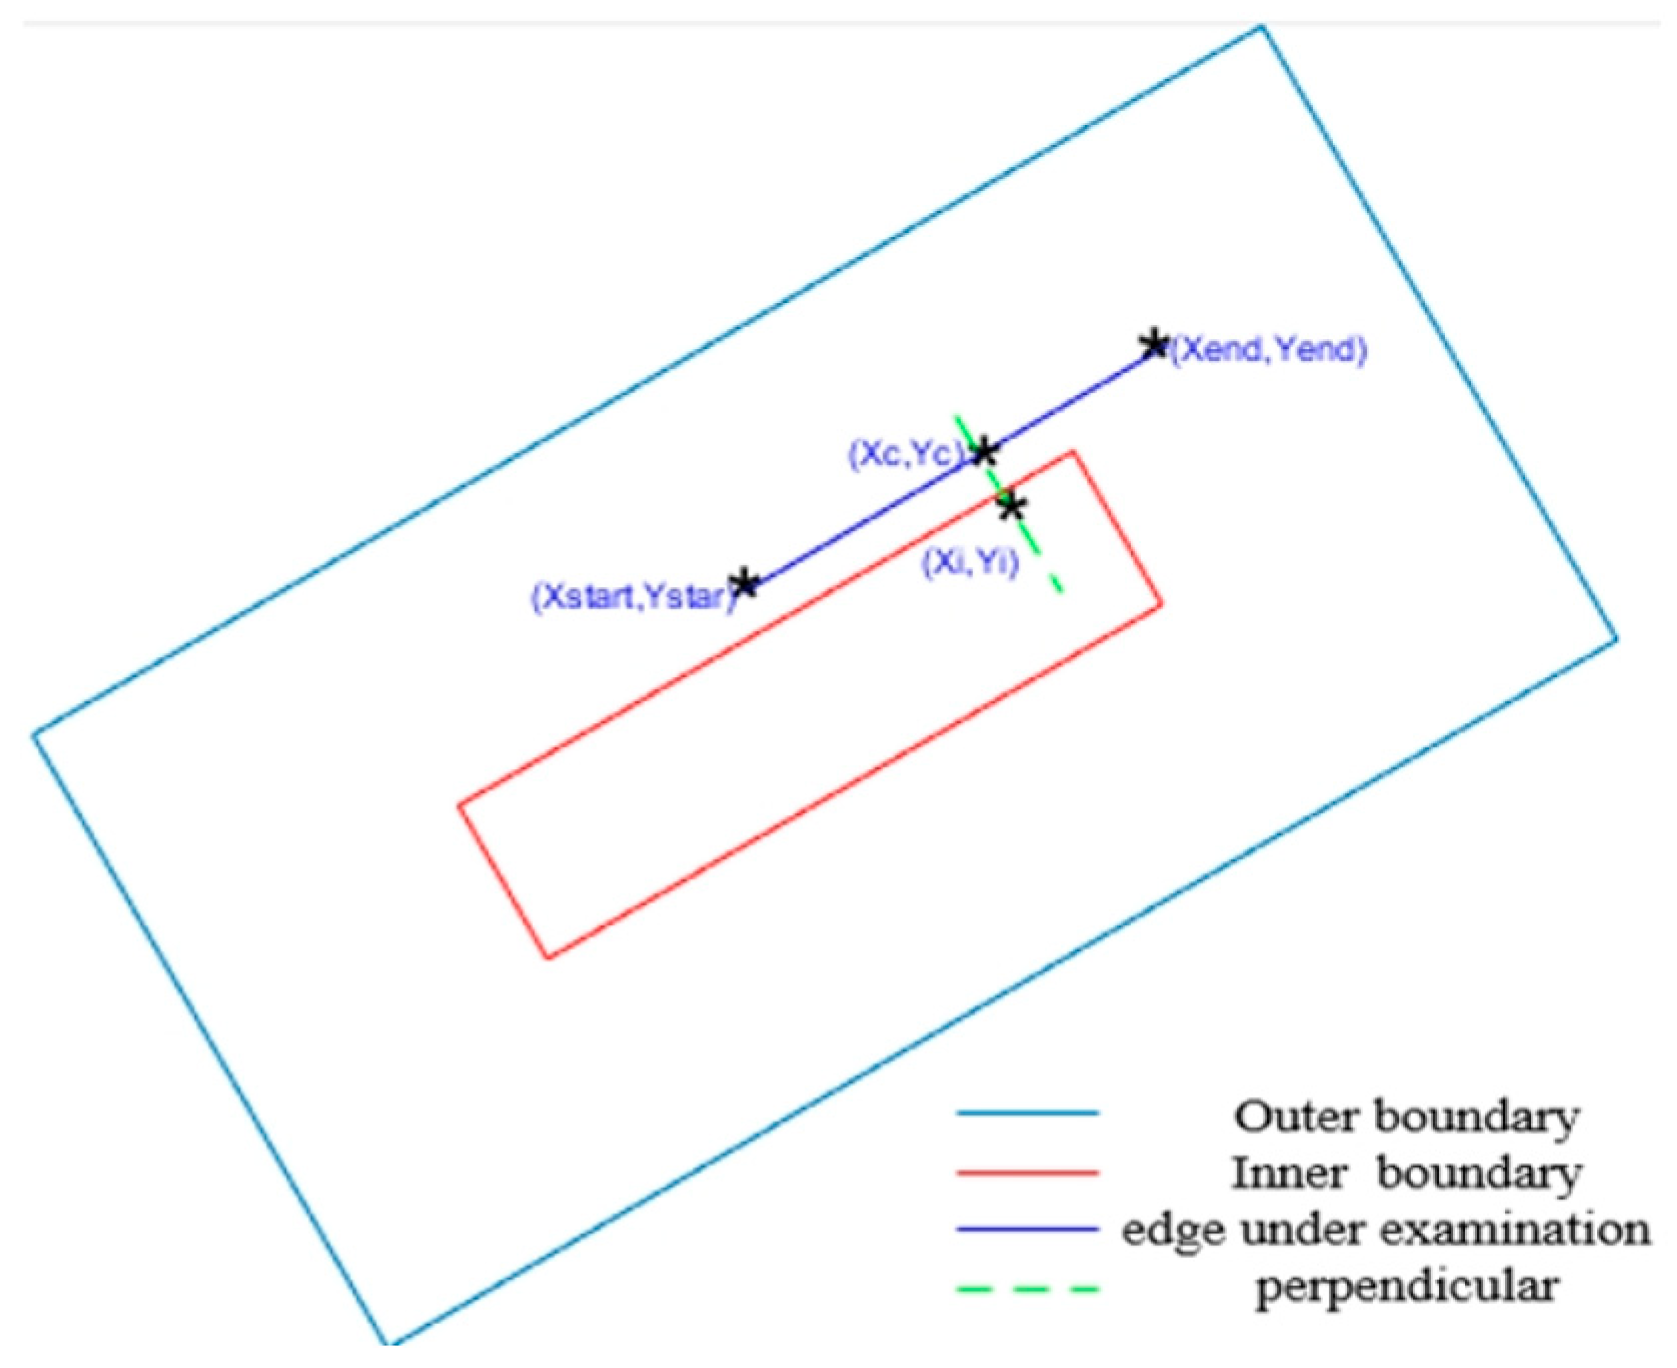
First, the edge is identified based on its length and position. The parameters are explained in Figure 15.
In Figure 15, the larger and smaller rectangles represent the outer and inner boundaries of the protrusion, respectively. The solid line enclosed between them is L i . The dashed line, drawn perpendicular to L i , serves as an auxiliary line to determine the relationship between the edge and the inner boundary. Here, x s t a r t and x e n d are the horizontal coordinates of the two endpoints of L i , while y s t a r t and y e n d are their vertical coordinates. ( x c , y c ) denotes the centroid coordinate, and ( x i , y i ) is the coordinate of the intersection point where a perpendicular line from the centroid meets the inner boundary. Let dir indicate whether L i is a positive or negative ridge edge. l represents the length of L i , and d is the vertical distance between L i and the inner boundary. Their definitions are given by Equations (13) and (14).
l = ( x e n d x s t a r t ) 2 + ( y e n d y s t a r t ) 2
d = ( x c x i ) 2 + ( y c y i ) 2
Subsequently, qualified single-edge lines are filtered by examining the proximity of positive and negative gradient lines. Let o r i represent the edge direction. A rectangular structuring element R is constructed with width R w , height R h , and orientation R o r i . By performing one dilation on L i , the resulting structure is L d i l , as described in Equations (15)–(17).
o r i = arctan y e n d y s t a r t x e n d x s t a r t
R = R w = 1 R h = 10 R o r i = o r i + π / 2
L d i l = L i R
When L i L l i g h t , if L d i l L d a r k , it is considered that a negative edge exists within the neighborhood of the positive edge L i , and thus L i is retained. If L d i l L d a r k = , it is considered that no negative edge is present in the neighborhood of the positive edge L i , and L i is removed. The opposite case holds true as well. Finally, the results are combined into L r e s u l t to complete the detection process.
After the above four steps, the micro-crack defects detection is completed. The process and results are shown in Figure 16. Figure 16(a1–a3) show the original image containing defects, the image after candidate region processing, and the image after directional gradient sharpening, respectively. Figure 16(b1–b3) are enlarged views of the defect regions in the corresponding three images above. Figure 16(a4–a6) display the sub-pixel maps of positive edges, negative edges, and the final result, respectively. Figure 16(b4–b6) are the enlarged views of the defect regions in these three images.

4. Experimental Results and Analysis

4.1. Construction of the Image Library

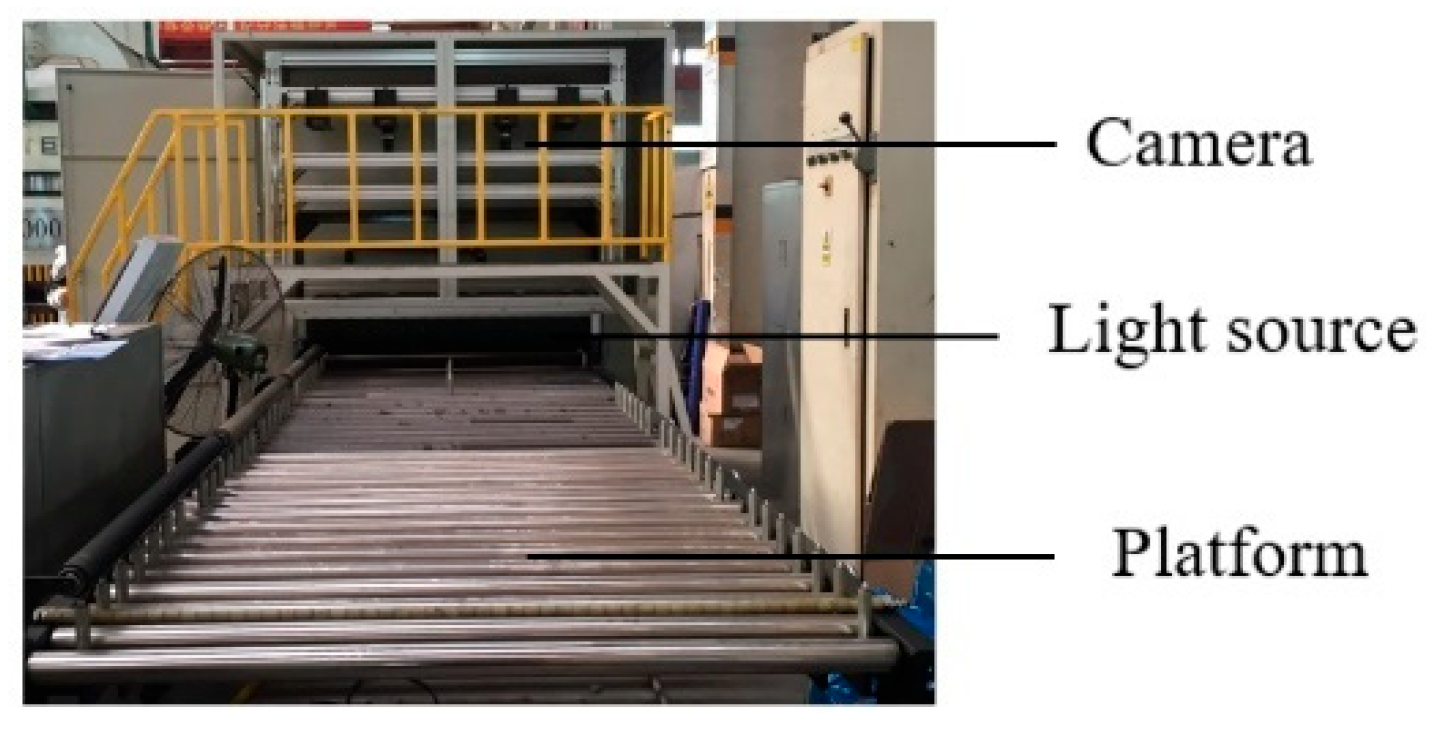
To validate the effectiveness of the proposed algorithm, a micro-crack defects image library, SUT-B1, was established using P10B PHE sheets. Each sheet measures 1000 × 407 mm2, and the width of the micro-crack defects ranges from 0.29 to 0.88 mm. Images were acquired in a real production environment, as shown in Figure 17. The imaging system is mounted on an automated production line, with a camera working distance of 1185.11 mm. The camera and lens are fixed above the detection mobile platform on a gantry, while the light source is placed 35 mm above the mobile platform. The sheet is advanced by rollers, and when the photoelectric switch is triggered, the light source initiates camera exposure. The camera used is a 16 k-resolution DALSA line-scan camera (LA-CM-16K05A-00-R, Teledyne DALSA, Waterloo, ON, Canada), equipped with a Xenon-Sapphire 4.5-95-0.07 lens (Schneider-Kreuznach, Bad Kreuznach, Germany) and illuminated by a KW-DL1500F-HW tunnel light source (Keyence, Osaka, Japan).
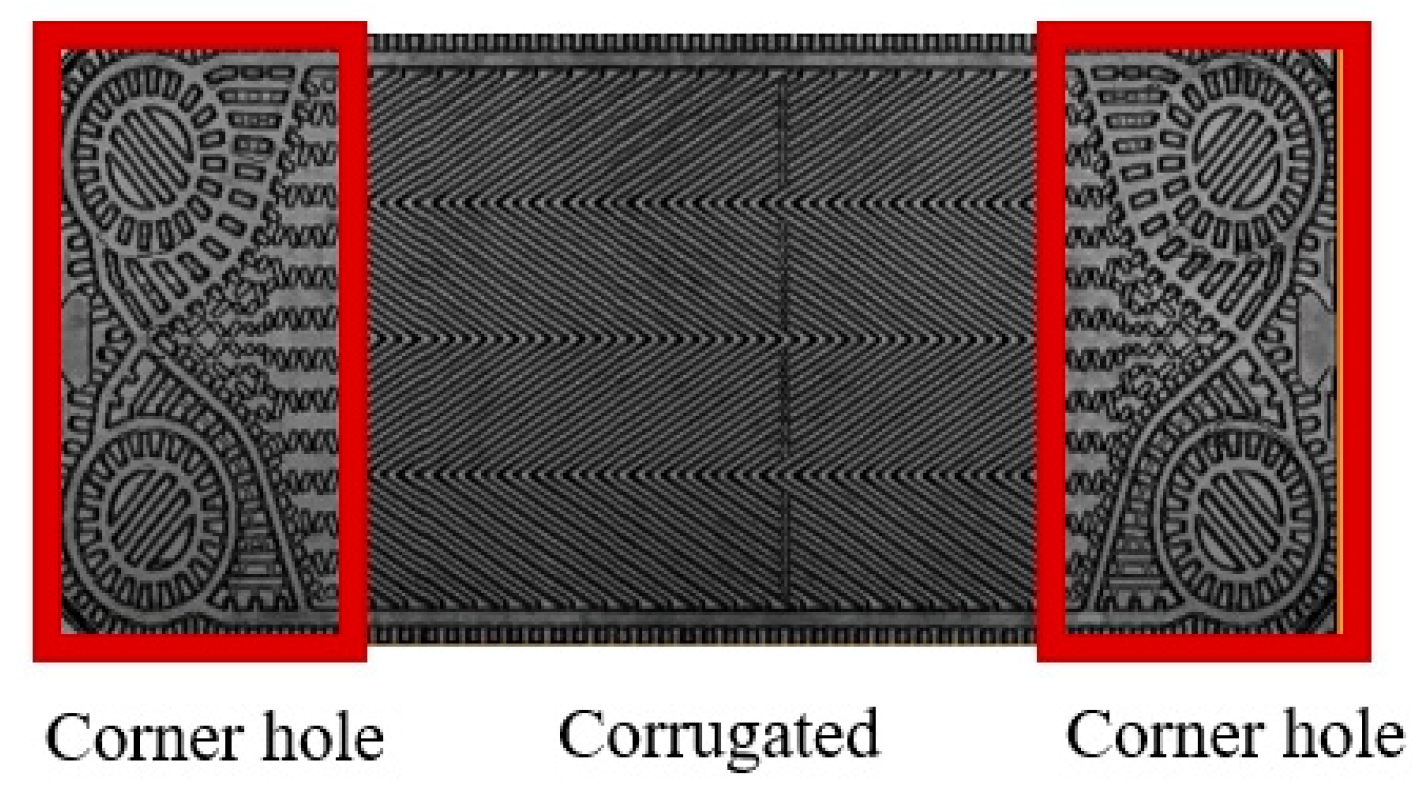
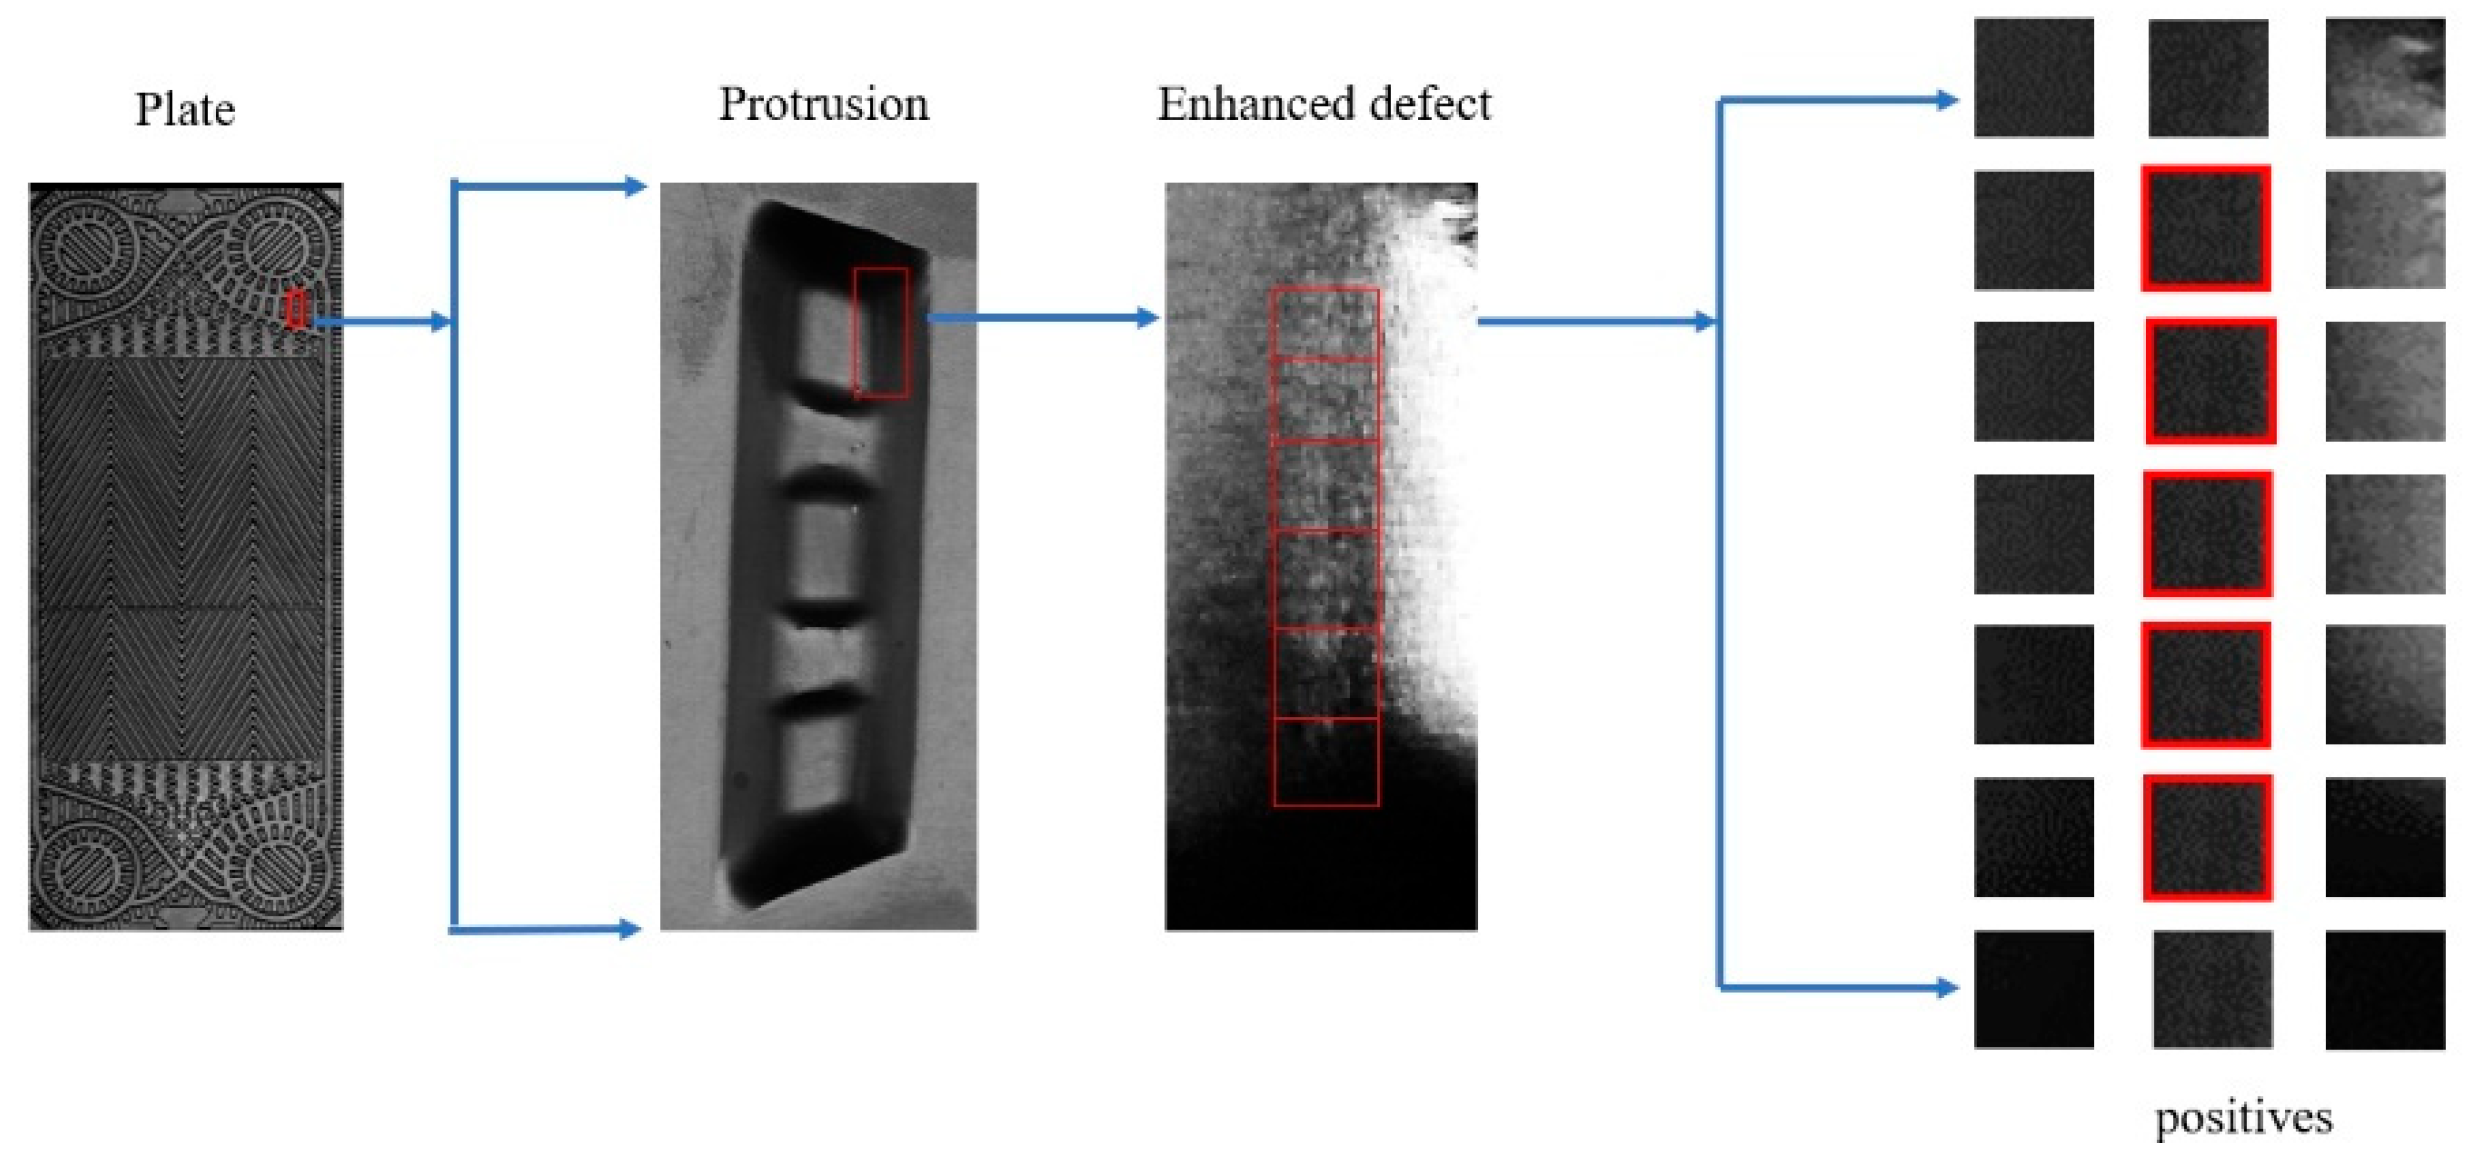
As shown in Figure 18, image collection is performed. Based on prior knowledge, defects appear on the protrusions near the corner hole areas. By locating the corner hole areas, a 33.22 × 33.22 mm2 (600 × 600 pixel) square image is extracted. In total, 49 defect sites were sampled to form the SUT-B1 test image library, including 268 images containing defective protrusions and 400 images of normal protrusions. For the deep learning comparative experiments, the SUT-B1 training dataset was constructed by labeling 4428 sample patches, each 24 × 24 pixels, encompassing all the aforementioned defects. These labeled patches serve as the training set. Figure 19 shows the defect regions and sample images. The “Enhanced Defect” is included solely to improve the visibility of the defect for observation purposes and is not utilized during training.

4.2. Definition of Evaluation Metrics and Testing Environment

Micro-crack defects in the test image library are manually annotated, with both edges of each defect marked as the reference standard for evaluation. The testing rule for this algorithm is as follows: the two edges of the defect are filled with pixels having a grayscale value of 255. According to the evaluation criteria, if the algorithm’s edge markings for a defect coincide with the manually annotated region, it is considered a successful detection. Otherwise, it is deemed a failure. Algorithm markings without corresponding manual annotations are regarded as false detections, while manual annotations without corresponding algorithm markings are considered missed detections.
Due to differences in the detection task, the problem is simplified into a binary classification of defect detection. Metrics such as recall, derived from confusion matrices, are generally used to evaluate a detector’s ability to precisely locate and classify each defect in multi-defect, multi-frame scenarios. However, under the simplified rule that “detecting any predicted bounding box counts as success,” these metrics cannot adequately capture this scenario. Therefore, from an industrial inspection perspective, the miss detection rate (Equation (18)) and the false detection rate (Equation (19)) are used as evaluation metrics.
M D R = N F R N L A × 100 %
F D R = N F A N F A + N L A × 100 %
In the above Equations,
  • MDR (missed detection rate) represents the ratio of defects misclassified as background.
  • FDR (false detection rate) represents the ratio of background areas misclassified as defects.
  • NFR (number of false rejections) is the count of legitimate members wrongly rejected.
  • NLA (number of all legal member attempts) is the total count of all legitimate member attempts.
  • NFA (number of false accepts) is the count of illegitimate members wrongly accepted.
The algorithm’s testing experiments were performed on the Halcon 19.05 software platform, using a computer equipped with an Intel i7-8750H processor (6 cores), 8 GB of RAM (Intel Corporation, Santa Clara, CA, USA), and a clock speed of 2.20 GHz, running the Windows 7 64-bit Professional Edition Service Pack 1 operating system. To simulate the factory production environment, both the deep learning test experiments and the algorithm test experiments were implemented on an Intel i7-8570 CPU.

4.3. Analysis of the Algorithm’s Detection Performance

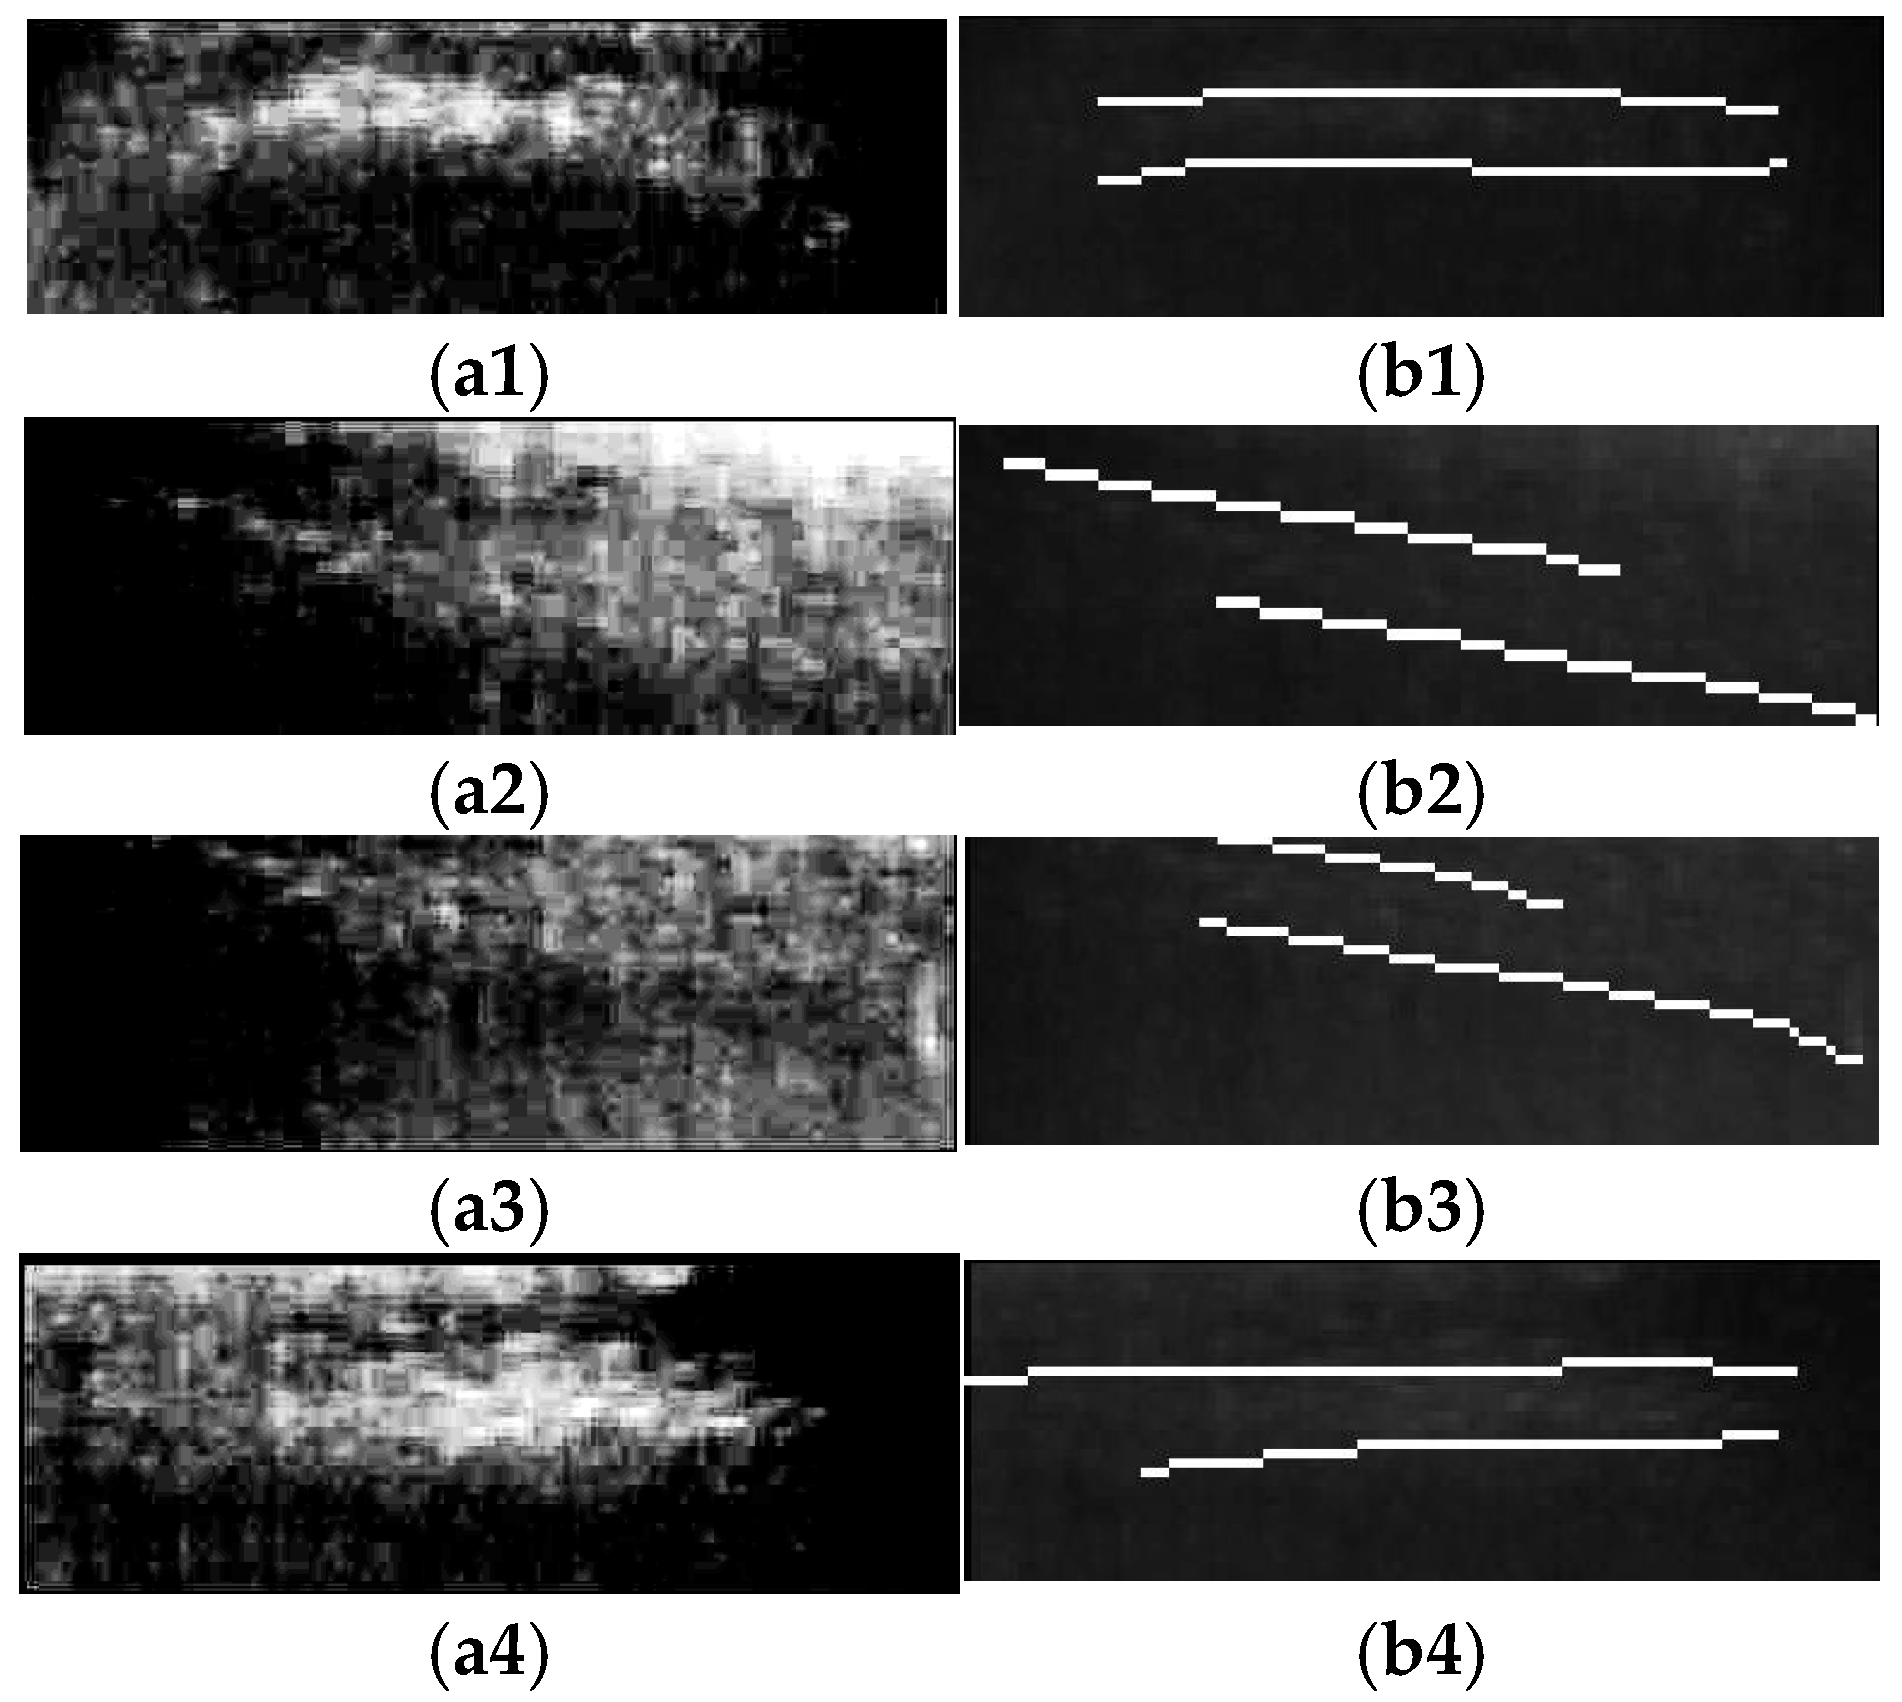
Using the above method, the SUT-B1 test image library was evaluated. The results are shown in Table 1, and partial results are illustrated in Figure 20. To clearly present the shape of the defects, Figure 20(a1–a4) are high-contrast defect images obtained after the sharpening operation. Figure 20(b1–b4) show the detection results overlaid on the original images.
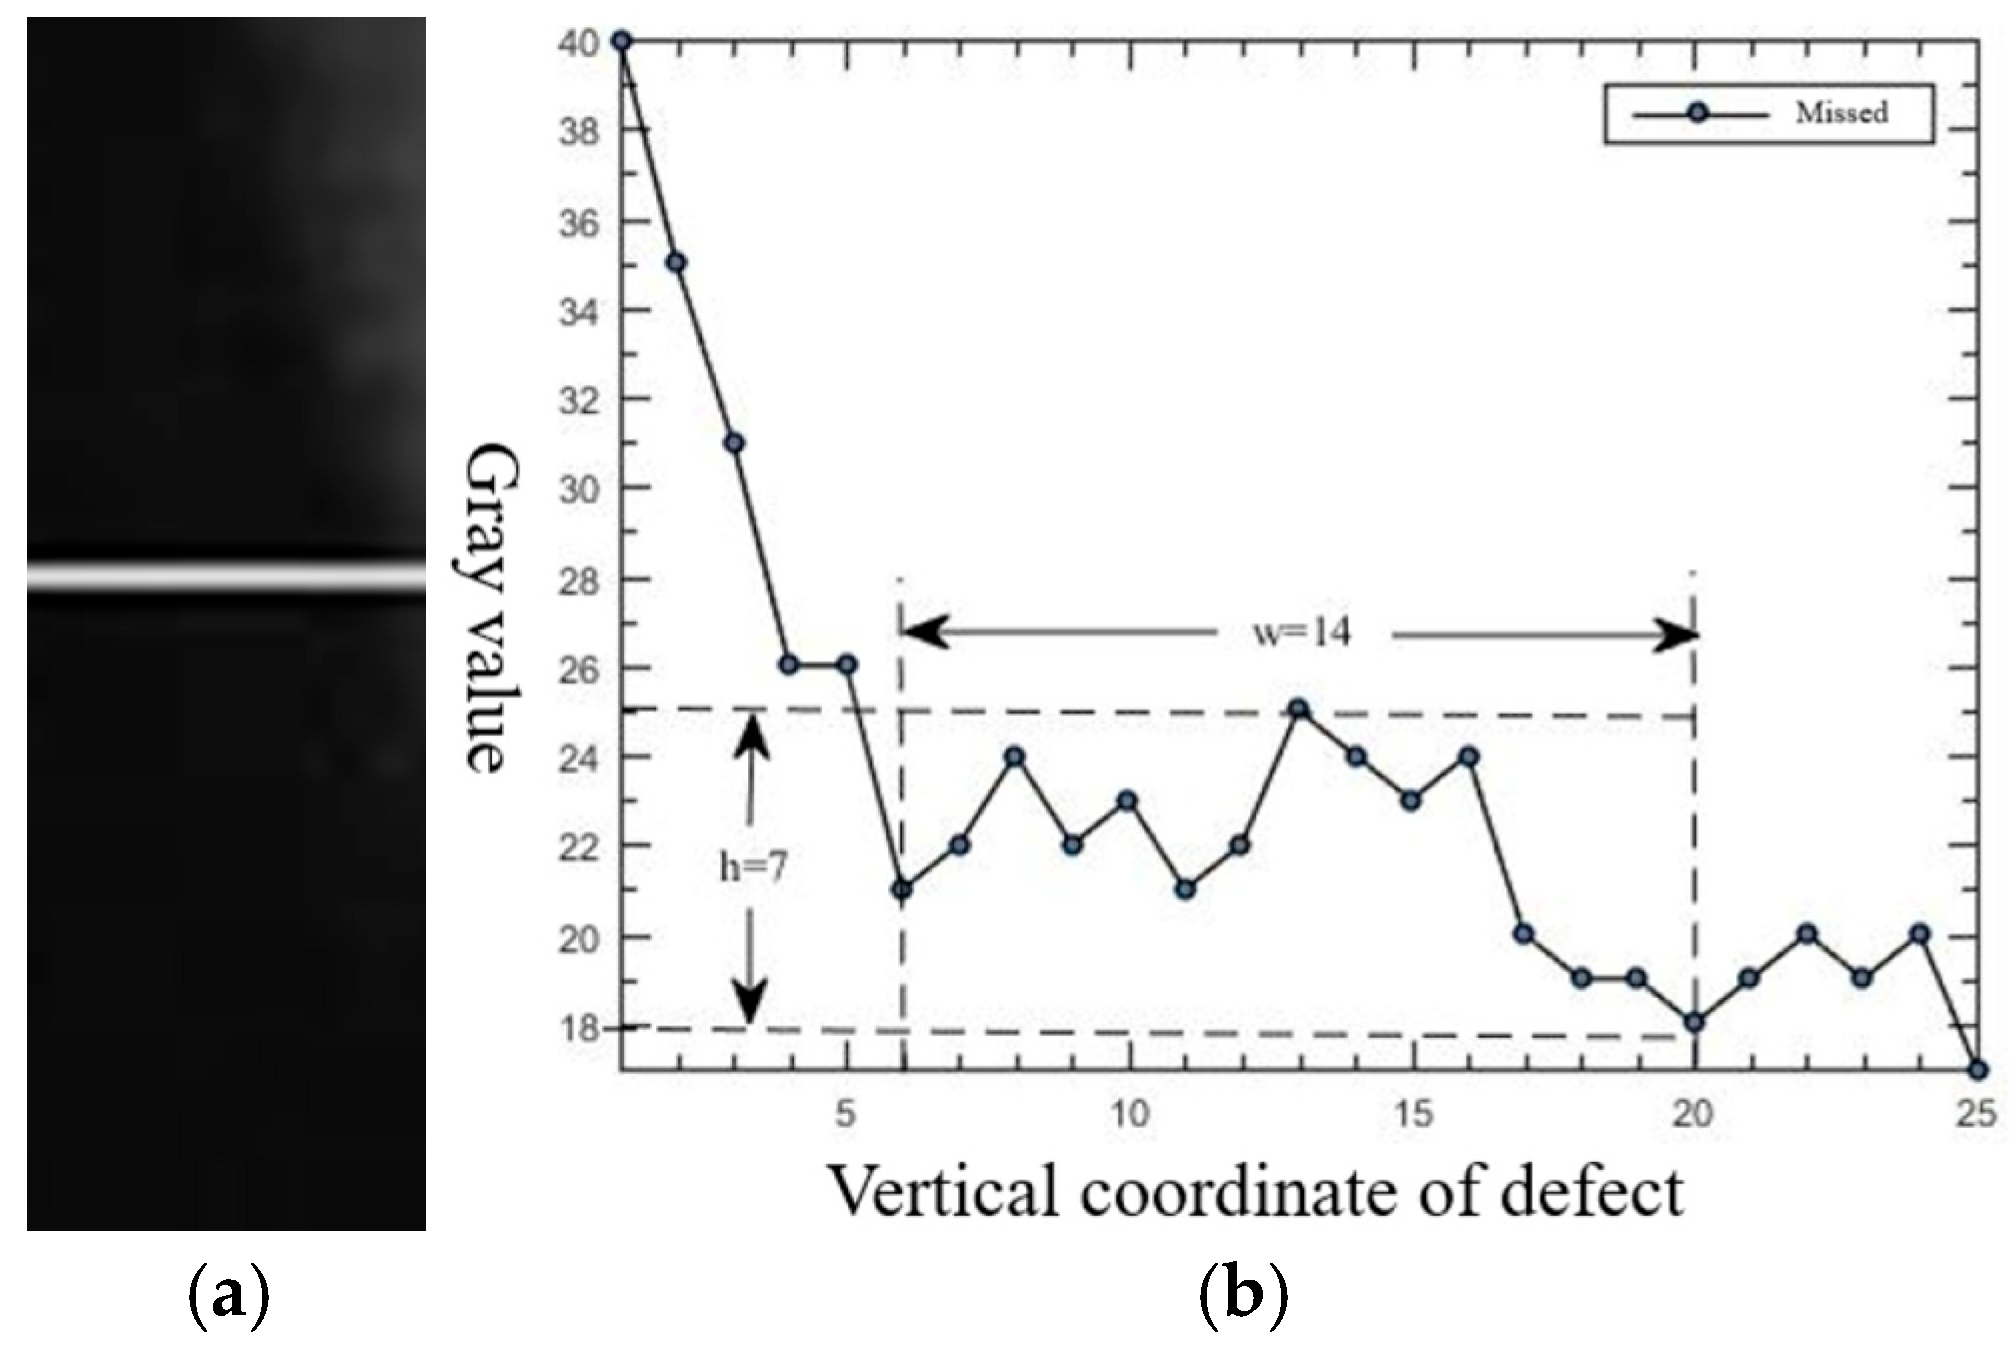
One primary cause of missed detections is that some defect images have large widths but very low grayscale contrast, making it impossible to perform effective Gaussian line detection. Figure 21a shows the image of a missed defect after a 90° rotation, and Figure 21b presents the grayscale profile along the indicated horizontal line. Although the defect is 14 pixels wide, its height is only 7 pixels. After Gaussian convolution, the ridge features are lost in the gradient image, resulting in a missed detection.
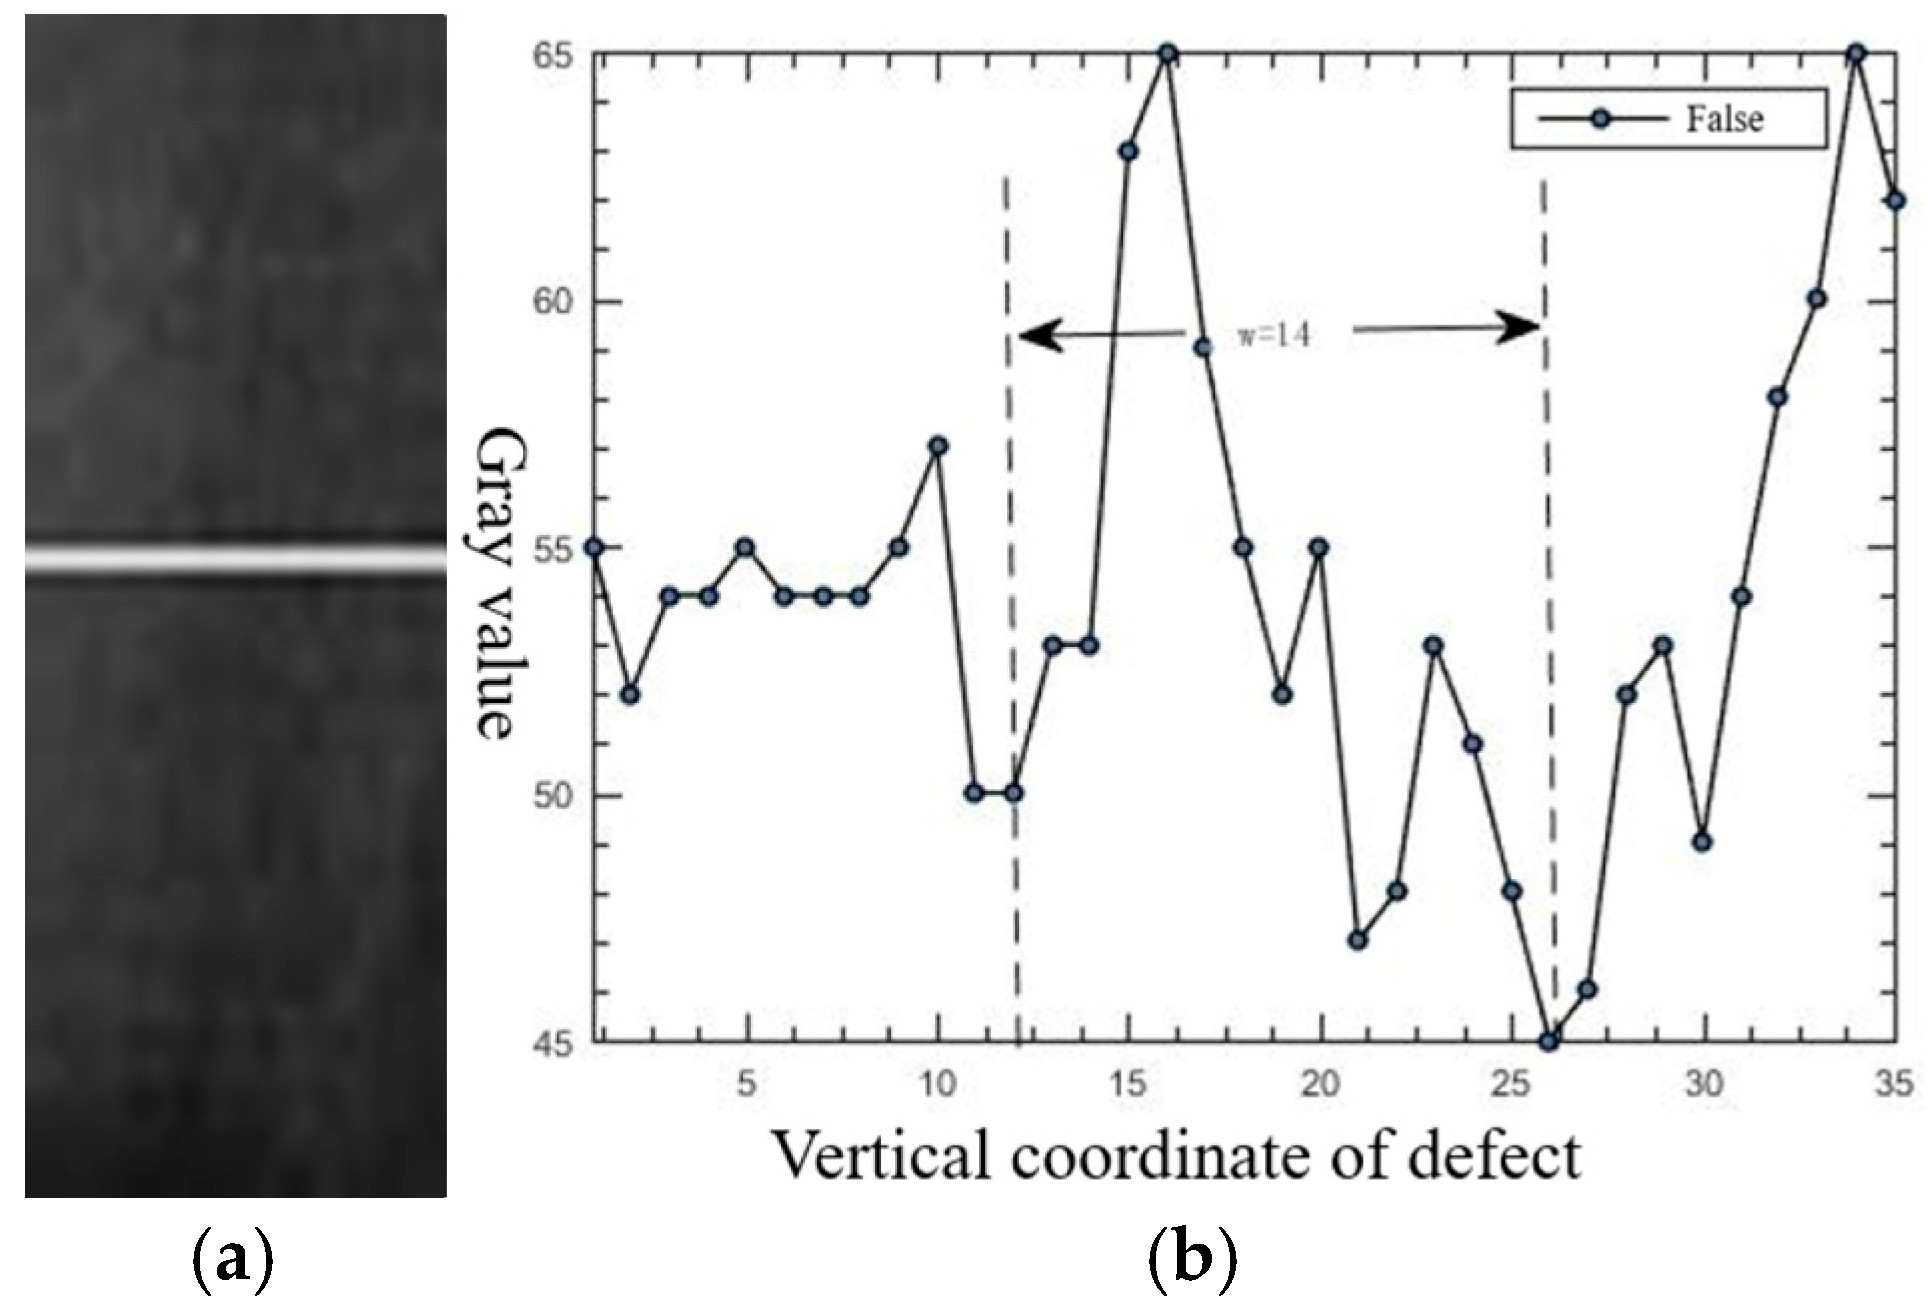
Figure 22a shows the image of a false defect after a 90° rotation, and Figure 22b provides the grayscale profile along the horizontal line. Here, the defect width is 14 pixels, and the height is 20 pixels, which meets the requirements for ridge edges. Consequently, certain non-defect areas on the inclined surface, due to uneven plate textures, exhibit grayscale differences similar to those of actual defects, leading to false detections.

4.4. Discussion

4.4.1. Comparison with Deep Learning Baseline Models

To substantiate claims regarding performance under constrained industrial conditions, all comparative experiments were conducted on an Intel i7-8570 CPU without GPU acceleration, explicitly simulating factory computational limitations. Furthermore, the SUT-B1 dataset—containing only 4428 sample patches, each 24 × 24 pixels (Section 4.1)—represents a data-scarce scenario relative to deep learning standards. This experimental design directly validates our method’s operational efficacy in resource-limited, low-data environments.
In Section 2, this study introduced improvements to the traditional algorithm. To evaluate performance under data scarcity and CPU-only factory conditions, we conducted comparative experiments with deep learning baseline models, focusing on MDR, FDR, and per-image test time for 600 × 600-pixel images. Five models were benchmarked: ResNet-50, DenseNet-121, EfficientNet-B0, ShuffleNetV2, and our proposed method (Table 2).
ResNet-50 exhibited high MDR (46.64%) with low FDR (12.42%), attributed to its large receptive field introducing excessive background noise that compromises fine-grained feature learning. DenseNet-121 showed moderate MDR (20.52%) but higher FDR (24.72%) due to feature redundancy from deep architecture and pooling operations. EfficientNet-B0 achieved reduced MDR (18.28%) but suffered incomplete shallow feature retention from early-layer depth, while ShuffleNetV2’s aggressive downsampling for speed optimization resulted in MDR (22.10%) and FDR (26.17%) by sacrificing resolution critical for micro-crack defect detection.
The higher FDR of our method (21.85%) compared to ResNet-50 (12.42%) stems from a fundamental trade-off in feature utilization. Where ResNet’s expansive receptive field discards critical shallow features, entirely losing the capacity to even recognize subtle defect signatures, our approach actively learns these features, some of which inherently resemble background noise. This deliberate retention enables detection of the most challenging micro-crack defects but inevitably introduces noise. Crucially, industrial safety standards prioritize minimizing MDR over FDR, as undetected defects directly threaten production safety, while false alarms merely require secondary verification.

4.4.2. Comparison with Grayscale-Based Gaussian Line Detection

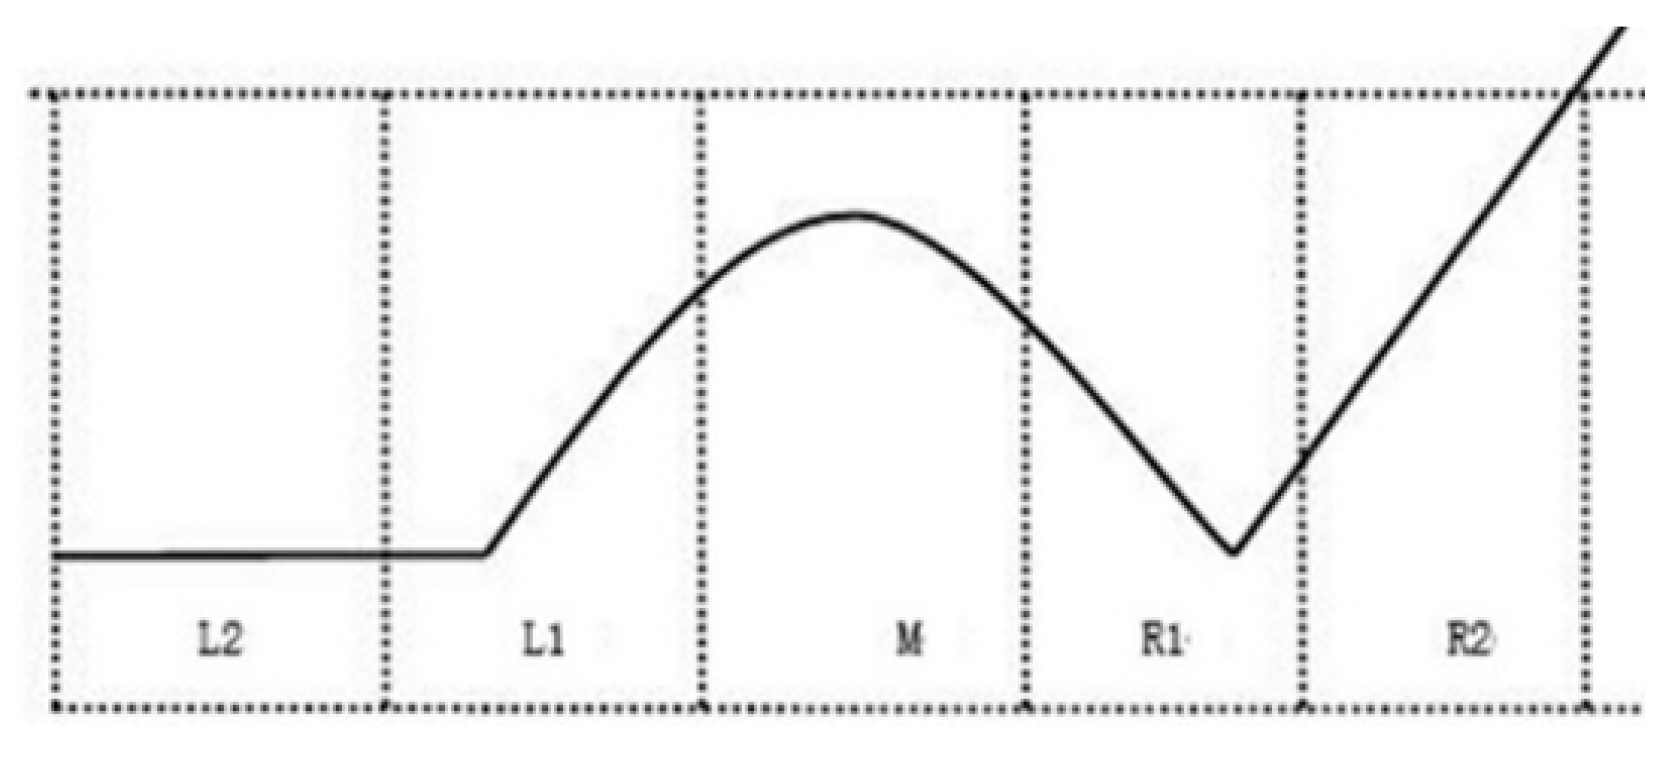
To highlight the advantage of applying the Gaussian line detection algorithm under directional gradients rather than directly on grayscale images in the presence of asymmetric structures, experiments were conducted using a grayscale-based Gaussian line detection approach. A theoretical defect schematic is constructed, as shown in Figure 23. The potentially involved region is unequally divided into five parts: L 2 , L 1 , M , R 1 , and R 2 . Among these, the R 1 region is influenced by its neighboring R 2 region when convolved with the template. Since the grayscale in the R 2 region monotonically increases, a larger template heightens the impact of R 2 on R 1 . In extreme cases, this can smooth out the minimal value point in R 1 .
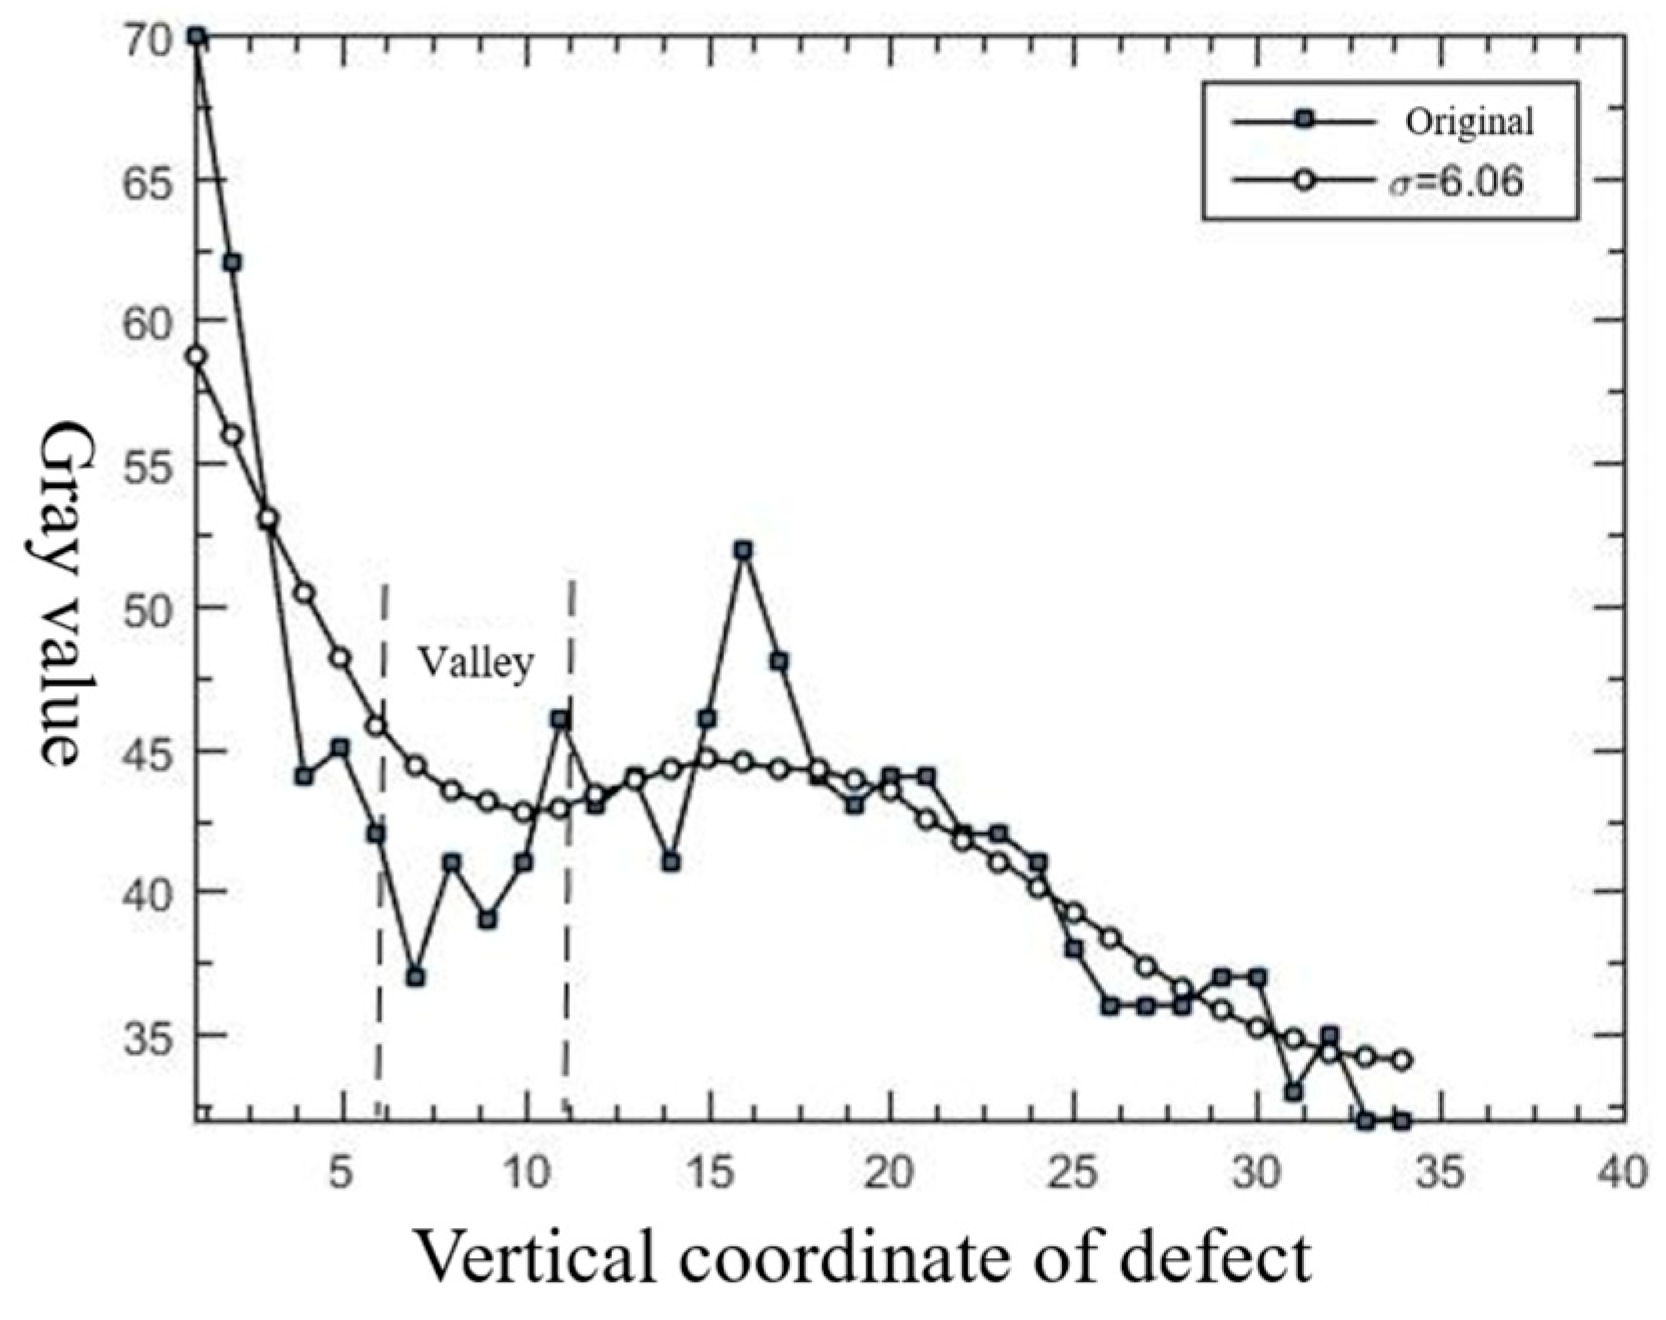
From Section 3.3.2, when applying Gaussian line detection, the template width should be chosen as the maximum defect width. For the micro-crack defect image library SUT-B1, where the defect width ranges from 7 to 21 pixels, substituting into Equation (11) yields σ = 6.06. Keeping the other steps unchanged, the results are shown in Figure 24. This figure presents the defect in Figure 3(a3) and its appearance after Gaussian smoothing with the above parameters. Because the defect region is not symmetrical like an ideal Gaussian function, one side of the grayscale first declines and then sharply increases; when σ is large, this grayscale valley becomes smoothed out, transforming the ridge structure into a step-like structure and resulting in missed detections.
In contrast, the direction gradient-based Gaussian line detection reduces the effective detection width by changing the detection defect, thereby diminishing the influence of Gaussian parameters on the defect and improving the overall detection performance compared to the grayscale-based Gaussian line detection method.

4.4.3. Comparison with the Non-Directional Canny Operator

In [22], the Canny operator was used to test 25 defects, achieving zero misses and low false detections. However, that study only detected defects with widths ranging from 14 to 21 pixels. In contrast, the SUT-B1 library used in this work involves 268 detected defects with widths between 7 and 21 pixels. Thus, the detection of 7–14 pixel-wide defects in this study represents an improvement over [22]. To detect smaller defects, it is necessary to broaden the selection criteria. Consequently, when applying Canny-based edge detection to the SUT-B1 library, the following issues arise: with a single fixed parameter setting, the Canny operator can only detect large-scale defects, while small-scale defects remain undetected. As concluded in Section 3.3.2, the template width can be larger than, but not smaller than, the defect width; if the defect width lies within a certain range, choosing the template width equal to the maximum defect width suffices. In contrast, the Canny detection is applied directly to the grayscale image, linking the detection process to the defect’s actual width. The Gaussian smoothing parameter σ is proportional to the defect width. After Gaussian convolution, small-scale defects become overly smoothed, losing their ridge edge characteristics and thus cannot be further filtered.
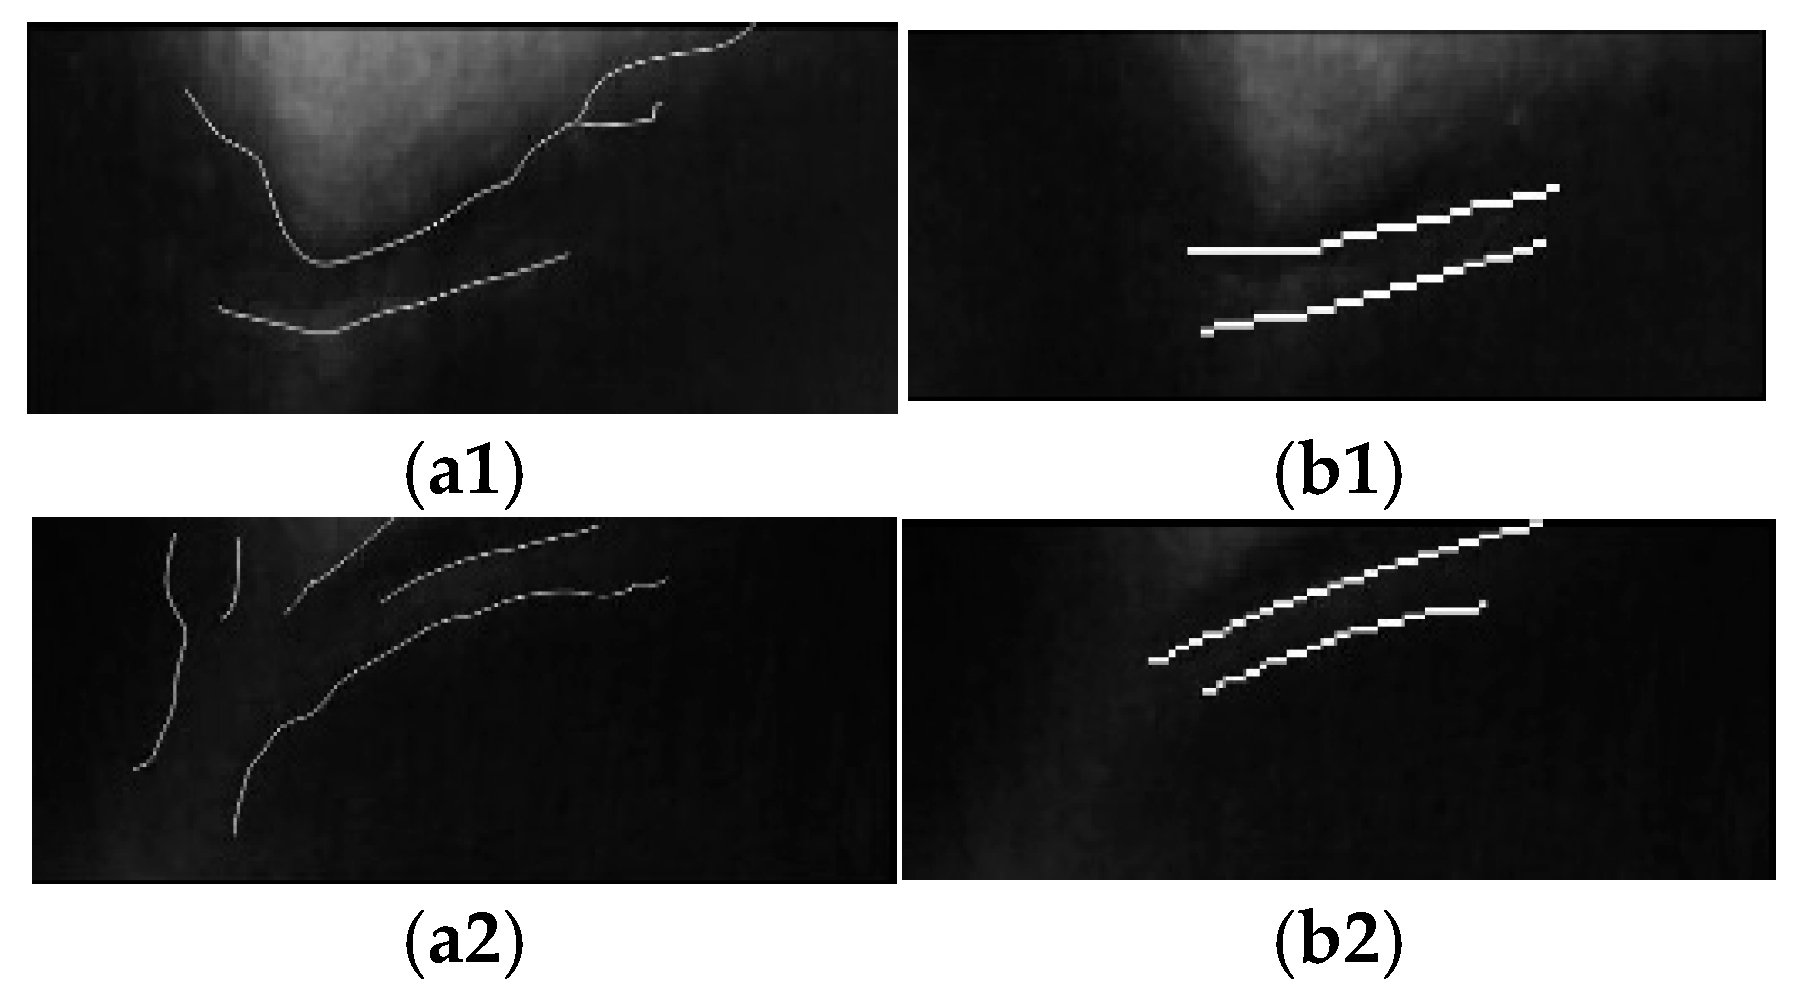
The improvement needed as concerns the Canny operator is to detect smaller defects without missing larger ones. To avoid the excessive smoothing of small-sized defects caused by a large Gaussian standard deviation in the grayscale image, this work employs the gradient image rather than the grayscale image for Gaussian line detection. As shown in Figure 9, it suffices to detect the double-ridge edges on the gradient image to confirm a defect. These double-ridge edges are narrower than the actual defect width, effectively preserving the defect’s characteristics. Consequently, the Gaussian standard deviation associated with detecting the double-ridge edges in the gradient image is smaller than that used by the Canny operator on the grayscale image. For instance, when a defect measures 14 pixels wide in the grayscale image, its corresponding double-ridge edges in the gradient image are only 7 pixels wide. The Gaussian smoothing parameter necessary for a width of 7 pixels is inevitably smaller than that for 14 pixels. Thus, by transitioning from grayscale-image detection to double-edge detection on the gradient image, this algorithm mitigates the smoothing effect of a large Gaussian standard deviation σ , ensuring no missed large-scale defects while enabling the conditional detection of small-scale defects. This approach effectively improves upon the Canny operator.
Figure 25 shows the results for defects of the same size using the method from [22] and the proposed algorithm. Figure 25(a1,a2) show the detection results using the Canny operator, while Figure 25(b1,b2) present the detection results of the proposed method.

4.4.4. Ablation Study on Directional Gradient Templates

An ablation study comparing four 5 × 5 gradient operators (vertical Sobel, horizontal Sobel, vertical Prewitt, non-directional Laplacian) on the SUT-B1 dataset revealed significant performance differences in micro-crack defect detection. The results are shown in Table 3. The proposed vertical Sobel operator achieved superior accuracy (14.55% MDR, 21.85% FDR), while the horizontal Sobel variant exhibited substantially higher miss rates (34.70% MDR) due to orthogonal misalignment with transverse crack features. Although sharing vertical orientation, the Prewitt operator demonstrated reduced sensitivity (22.01% MDR, 23.86% FDR), suggesting its uniform kernel provides inferior noise suppression in textured regions compared to the Sobel’s center-weighted coefficients. The isotropic Laplacian yielded the poorest performance (47.76% MDR, 33.82% FDR), generating spurious responses in gradual transition zones that fragmented defect signatures. These results confirm that effective micro-crack defects detection requires both directional alignment with defect geometry and optimized weighting characteristics, conditions uniquely satisfied by the vertical Sobel operator.

4.4.5. Limitations of the Proposed Method

While the proposed method demonstrates strong performance for horizontal micro-crack defects under industrial constraints, two key limitations warrant discussion. First, the algorithm’s dependence on directional gradient operators inherently prioritizes defects aligned with the Sobel template’s orientation. Vertical gradients maximized sensitivity for horizontal defects, but cracks deviating significantly from this orientation may exhibit reduced contrast in gradient space, increasing miss rates. Second, the Gaussian line detection stage remains sensitive to high-frequency noise in gradient images. Textured background regions with grayscale transitions resembling asymmetric ridges can trigger false positives, contributing to the observed 21.85% FDR. Future work will address these limitations through a multi-orientation template and noise-robust gradient computation techniques.

4.4.6. Real-Time Deployment Potential

The proposed algorithm demonstrates significant potential for real-time implementation in industrial production lines and deployment on resource-constrained embedded systems. Its CPU-only operation eliminates the need for expensive, power-intensive GPUs, crucial for cost-sensitive environments. Table 2 demonstrates the fast processing speed (0.1402 s per 600 × 600 image, ~7.1 FPS on a factory-grade CPU). Furthermore, the algorithm’s reliance on deterministic image processing steps with fixed kernels and avoidance of large model parameters results in a very low memory footprint, ideal for embedded systems with limited RAM. Consequently, this combination of CPU-only execution, sub-second processing time, and minimal memory requirements makes the directional gradient-based approach a computationally efficient and practical solution for integrating micro-crack defect detection directly onto production equipment or embedded vision systems.

5. Conclusions

This study proposes and refines a defect detection algorithm based on directional gradients for PHE sheets. Comparative experiments with traditional grayscale-based detection algorithms and deep learning baseline models verify the industrial advantages of the proposed method.
The proposed directional gradient-based traditional defect detection algorithm prioritizes a low MDR, satisfying safety requirements in industrial scenarios with an MDR of only 14.55%. In contrast, deep learning models such as ResNet-50 and DenseNet-121, while reducing false detections, tolerate higher MDRs (46.64% and 20.52%, respectively), indicating that they may lose critical features when dealing with small-scale defects.
Moreover, under conditions of data scarcity and limited computational resources, the proposed algorithm requires only 0.1402 s of test time per image, significantly outperforming both deep learning models and other directional gradient-based operator models.
Finally, grayscale-based methods often experience accuracy degradation with variable asymmetric defect widths. The core theoretical contribution is a mathematically constrained Gaussian width selection method for variable width defects, which enables single parameter coverage previously unattainable in industrial settings. We replaced empirical tuning with deterministic design.
In summary, the proposed and refined directional gradient-based defect detection algorithm, applied to the task of detecting defects in plate heat exchanger sheets, prioritizes a low leak detection rate. It also achieves faster test speeds under conditions of data scarcity and limited computational resources, effectively handling small-scale and directional defects.

Author Contributions

Methodology, W.Y.; Writing—original draft, Z.D. All authors have read and agreed to the published version of the manuscript.

Funding

This research received no external funding.

Data Availability Statement

Conflicts of Interest

The authors declare no conflict of interest.

References

  1. GB/T232-1988; Metallic Materials—Bend Test. Standards Press of China: Beijing, China, 1988.
  2. NB/T47004.1-2017; Chian Standardization Committee on Boilers and Pressure Vessels. Plate Heat Exchangers—Part 1: Plate-and-Frame Heat Exchangers. Xinhua Publishing House: Beijing, China, 2017.
  3. Yuan, W.; Zhao, P. An Adaptive Edge Detection Method for Plate of Heat Exchanger Based on Canny. Comput. Technol. Dev. 2021, 31, 81–85+94. [Google Scholar]
  4. Chen, S. Research on Defect Detection Methods for Plate Heat Exchanger Plates. Master’s Thesis, Shenyang University of Technology, Shenyang, China, 2022. [Google Scholar]
  5. Wang, H.; Wang, T.; Yu, C. CFRP ultrasonic detection defect identification method based on recursive quantitative analysis. J. ZheJiang Univ. (Eng. Sci.) 2024, 58, 1604–1617. [Google Scholar]
  6. Jin, J.; Zhang, Q.; Han, B.; Yang, S.; Ren, Y. Research on eddy current testing and defect evaluation methods for complex cracks. Chin. J. Sci. Instrum. 2024, 45, 280–288. [Google Scholar]
  7. Liu, L.; Bao, S. Experimental Research on the Effect of Cracks on Metal Magnetic Memory Signals. Eng. Mech. 2024, 41, 247–256. [Google Scholar]
  8. Zhang, H.; Liu, S.; Zhu, P. Extraction method for irregular plane path of sensing fiber with Gaussian line method. China Meas. Test 2022, 48, 15–21. [Google Scholar]
  9. Javeed, M.A.; Ghaffar, M.A.; Ashraf, M.A.; Zubair, N.; Metwally, A.S.M.; Tag-Eldin, E.M.; Bocchetta, P.; Javed, M.S.; Jiang, X. Lane Line Detection and Object Scene Segmentation Using Otsu Thresholding and the Fast Hough Transform for Intelligent Vehicles in Complex Road Conditions. Electronics 2023, 12, 1079. [Google Scholar] [CrossRef]
  10. Tverdomed, V.; Dmytro, Z.; Kokriatska, N.; Lukoševičius, V. The Detection of Railheads: An Innovative Direct Image Processing Method. Sustainability 2024, 16, 5109. [Google Scholar] [CrossRef]
  11. Yang, H.; Jiang, Y.; Deng, F.; Mu, Y.; Zhong, Y.; Jiao, D. Detection of bubble defects on tire surface based on line laser and machine vision. Processes 2022, 10, 255. [Google Scholar] [CrossRef]
  12. Fan, H.; Cosman, P.C.; Hou, Y.; Li, B. High-speed railway fastener detection based on a line local binary pattern. IEEE Signal Process. Lett. 2018, 25, 788–792. [Google Scholar] [CrossRef]
  13. Liu, Y.; Xu, K.; Xu, J. An improved MB-LBP defect recognition approach for the surface of steel plates. Appl. Sci. 2019, 9, 4222. [Google Scholar] [CrossRef]
  14. Luo, Q.; Fang, X.; Sun, Y.; Liu, L.; Ai, J.; Yang, C.; Simpson, O. Surface defect classification for hot-rolled steel strips by selectively dominant local binary patterns. IEEE Access 2019, 7, 23488–23499. [Google Scholar] [CrossRef]
  15. Luo, Q.; Sun, Y.; Li, P.; Simpson, O.; Tian, L.; He, Y. Generalized completed local binary patterns for time-efficient steel surface defect classification. IEEE Trans. Instrum. Meas. 2019, 68, 667–679. [Google Scholar] [CrossRef]
  16. Huang, D.; Liao, S.; Sunny, A.I.; Yu, S. A novel automatic surface scratch defect detection for fluid-conveying tube of Coriolis mass flow-meter based on 2D-direction filter. Measurement 2018, 126, 332–341. [Google Scholar] [CrossRef]
  17. Yu, L.; Zhang, T.D.; Lu, R.S. Surface defect inspection of TFT-LCD panels based on 1D Fourier method. In Proceedings of the Seventh International Symposium on Precision Mechanical Measurements, Xia’men, China, 8–12 August 2015; pp. 9903–9908. [Google Scholar]
  18. Zhang, J.; Cui, Y.; He, G.; Luo, C.; Miao, G. A new image processing enabled approach for detection of scratch defects for wire-type objects. In Proceedings of the International Conference on Information Science & Control Engineering, Beijing, China, 8–10 July 2016; IEEE: Piscataway, NJ, USA, 2016. [Google Scholar]
  19. Yun, J.P.; Choi, S.; Kim, J.W.; Kim, S.W. Automatic detection of cracks in raw steel block using Gabor filter optimized by univariate dynamic encoding algorithm for searches (uDEAS). NDT E Int. 2009, 42, 389–397. [Google Scholar] [CrossRef]
  20. Sun, J.; Li, C.; Wu, X.J.; Palade, V.; Fang, W. An effective method of weld defect detection and classification based on machine vision. IEEE Trans. Ind. Inform. 2019, 15, 6322–6333. [Google Scholar] [CrossRef]
  21. Zhang, H.; Jin, X.; Wu, Q.M.J.; Wang, Y.; He, Z.; Yang, Y. Automatic visual detection system of railway surface defects with curvature filter and improved gaussian mixture model. IEEE Trans. Instrum. Meas. 2018, 67, 1593–1608. [Google Scholar] [CrossRef]
  22. Zhang, X.P.; Wei, L.F.; Yuan, W.Q.; Ding, Z.B. Microcrack detection method for plate heat exchanger based on machine vision. J. Mech. Electr. Eng. 2020, 37, 856–860. [Google Scholar]
  23. Liu, X.; Gao, J. Surface defect detection method of hot rolling strip based on improved SSD model. In Database Systems for Advanced Applications. DASFAA 2021 International Workshops: BDQM, GDMA, MLDLDSA, MobiSocial, and MUST, Taipei, Taiwan, 11–14 April 2021, Proceedings 26; Springer International Publishing: Cham, Switzerland, 2021; pp. 209–222. [Google Scholar]
  24. Zhang, J.; Kang, X.; Ni, H.; Ren, F. Surface defect detection of steel strips based on classification priority YOLOv3-dense network. Ironmak. Steelmak. 2021, 48, 547–558. [Google Scholar] [CrossRef]
  25. Liu, B.; Jiang, W. LA-YOLO: Bidirectional Adaptive Feature Fusion Approach for Small Object Detection of Insulator Self-explosion Defects. IEEE Trans. Power Deliv. 2024, 39, 3387–3397. [Google Scholar] [CrossRef]
  26. Zhang, Y.; Zhang, H.; Huang, Q.; Han, Y.; Zhao, M. DsP-YOLO: An anchor-free network with DsPAN for small object detection of multiscale defects. Expert Syst. Appl. 2024, 241, 122669. [Google Scholar] [CrossRef]
  27. Wang, W.; Meng, Y.; Li, S.; Zhang, C. HV-YOLOv8 by HDPconv: Better lightweight detectors for small object detection. Image Vis. Comput. 2024, 147, 105052. [Google Scholar] [CrossRef]
  28. Liu, Q.; Lv, J.; Zhang, C. MAE-YOLOv8-based small object detection of green crisp plum in real complex orchard environments. Comput. Electron. Agric. 2024, 226, 109458. [Google Scholar] [CrossRef]
  29. Hao, R.; Lu, B.; Cheng, Y.; Li, X.; Huang, B. A steel surface defect inspection approach towards smart industrial monitoring. J. Intell. Manuf. 2021, 32, 1833–1843. [Google Scholar] [CrossRef]
  30. Zhang, C.; Yu, B.; Wang, W. Steel surface defect detection based on improved mask rcnn. In Proceedings of the 2022 IEEE 8th International Conference on Computer and Communications (ICCC), Chengdu, China, 9–12 December 2022; IEEE: Piscataway, NJ, USA, 2022; pp. 2176–2181. [Google Scholar]
  31. Xing, L.; Li, T.; Fan, H.; Zhu, H. Defect Detection and Classification of Strip Steel Based on Improved VIT Model. In Proceedings of the International Conference on Intelligent Information Processing, Qingdao, China, 27–30 May 2022; Springer International Publishing: Cham, Switzerland, 2022; pp. 327–335. [Google Scholar]
  32. Zhu, X.; Su, W.; Lu, L.; Li, B.; Wang, X.; Dai, J. Deformable detr: Deformable transformers for end-to-end object detection. arXiv 2020, arXiv:2010.04159. [Google Scholar]
  33. Steger, C. An Unbiased Detector of Curvilinear Structures. IEEE Trans. Pattern Anal. Mach. Intell. 1998, 20, 113–125. [Google Scholar] [CrossRef]
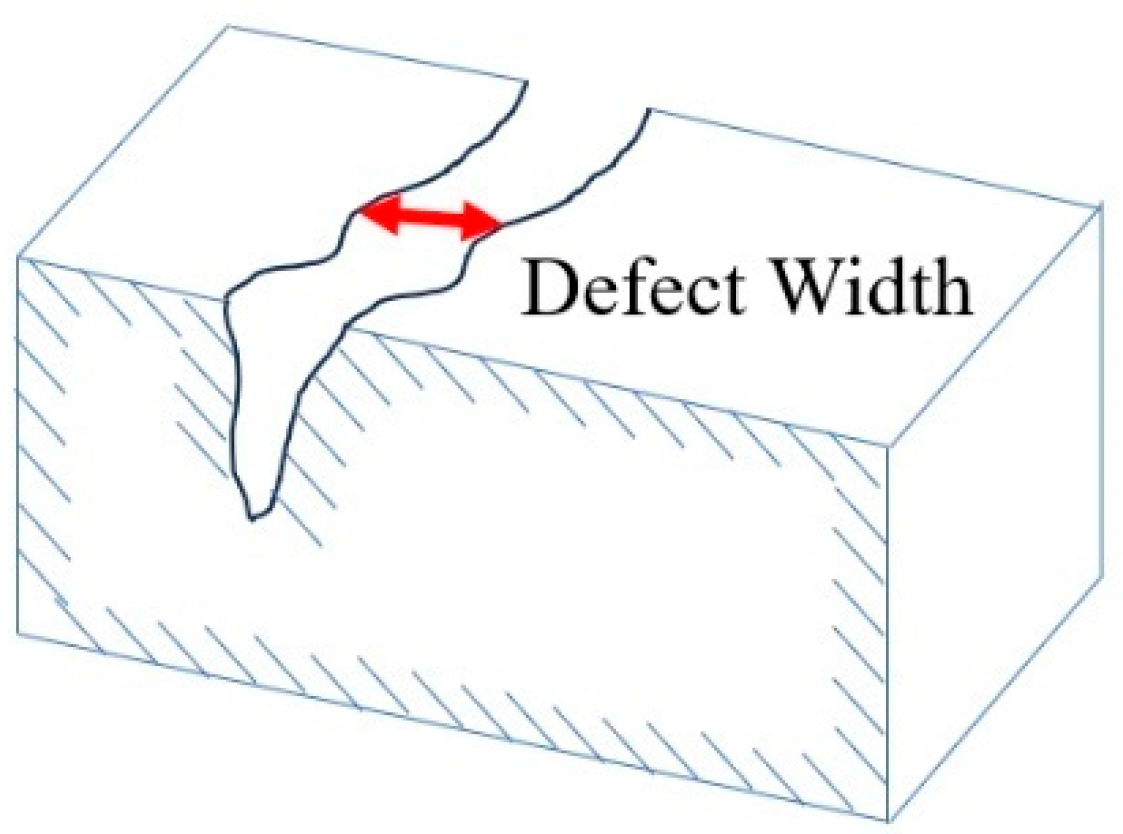
Figure 1. Conceptual diagram of micro-crack defect.
Electronics 14 03206 g001
Figure 2. Defect under a high-magnification lens.
Electronics 14 03206 g002
Figure 3. Defect visualization in plate protrusion regions. (a1a3) Original plate protrusion regions with defects of varying widths. (b1b3) Enlarged and contrast-enhanced defect regions.
Electronics 14 03206 g003
Figure 4. Gray-level profiles across horizontal cross-sections of defect regions in Figure 3(b1–b3).
Electronics 14 03206 g004
Figure 5. Schematic diagram of the plate protrusions.
Electronics 14 03206 g005
Figure 6. The process of region extraction.
Electronics 14 03206 g006
Figure 7. Candidate region extraction. (a) Original image. (b) Candidate region.
Electronics 14 03206 g007
Figure 8. Ideal ridge edge and its first derivative. (a) Ridge edge. (b) First derivative of the ridge edge.
Electronics 14 03206 g008
Figure 9. Grayscale and gradient profiles along the horizontal cross-sectional line of the defect in Figure 3(b2). (a) Grayscale profile of Figure 3(b2). (b) Gradient profile of Figure 3(b2).
Electronics 14 03206 g009
Figure 10. Defect. (a) Example of the defect. (b) The same defect with enhanced contrast.
Electronics 14 03206 g010
Figure 11. Gradient profiles of the defect. (a) Vertical gradient profile of the defect. (b) Horizontal gradient profile of the defect.
Electronics 14 03206 g011
Figure 12. Gradient profile of different scale convolutions.
Electronics 14 03206 g012
Figure 13. Sobel operators. (a) 5 × 5 image area. (b) Vertical Sobel operators applied to the image.
Electronics 14 03206 g013
Figure 14. Relationship between defect width Wo and predefined template width Wm = 21. (a) Wo = 7; (b) Wo = 14; (c) Wo = 21; (d) Wo = 28; (e) and Wo = 35.
Electronics 14 03206 g014
Figure 15. The outer and inner boundaries of the protrusion region.
Electronics 14 03206 g015
Figure 16. Detection result of the image. (a1) Original image. (a2) Candidate region. (a3) Gradient image. (b1) Zoomed-in view of (a1). (b2) Zoomed-in view of (a2). (b3) Zoomed-in view of (a3). (a4) Positive edge. (a5) Negative edge. (a6) Result image. (b4) Zoomed-in view of (a4). (b5) Zoomed-in view of (a5). (b6) Zoomed-in view of (a6).
Electronics 14 03206 g016
Figure 17. Image acquisition device.
Electronics 14 03206 g017
Figure 18. Image collection.
Electronics 14 03206 g018
Figure 19. Defect areas and positive lab sample.
Electronics 14 03206 g019
Figure 20. Evaluation results of the SUT-B1 test image library. (a1a4) High-contrast defect images obtained after the sharpening operation. (b1b4) Detection results overlaid on the corresponding original images.
Electronics 14 03206 g020
Figure 21. Detection of missed defect. (a) Missed defect. (b) Grayscale profile along the indicated horizontal line in (a).
Electronics 14 03206 g021
Figure 22. Detection of false defect. (a) False defect. (b) Grayscale profile along the indicated horizontal line in (a).
Electronics 14 03206 g022
Figure 23. Defect schematic.
Electronics 14 03206 g023
Figure 24. The result of Gaussian smooth contrast.
Electronics 14 03206 g024
Figure 25. Defect results. (a1,a2) Detection results using the Canny operator. (b1,b2) Detection results using the proposed method.
Electronics 14 03206 g025
Table 1. The result of the proposed method.
DefectNormalMissFalseDRFDR
268400397514.55%21.85%
Table 2. Detection results of different algorithms.
MethodMDRFDRTime/s
Ours14.55%21.85%0.1402
Res Net 5046.64%12.42%0.9562
DenseNet-12120.52%24.72%1.6875
EfficientNet-B018.28%34.31%0.8221
ShuffleNetV222.01%26.17%0.1984
Table 3. Gradient operator performance comparison.
OperatorMDRFDRTime/s
Vertical Sobel14.55%21.85%0.1402
Horizontal Sobel34.70%26.58%0.1411
Vertical Prewitt22.01%23.86%0.1723
Laplacian47.76%33.82%0.1685
Disclaimer/Publisher’s Note: The statements, opinions and data contained in all publications are solely those of the individual author(s) and contributor(s) and not of MDPI and/or the editor(s). MDPI and/or the editor(s) disclaim responsibility for any injury to people or property resulting from any ideas, methods, instructions or products referred to in the content.