Article

Towards Energy Efficiency of HPC Data Centers: A Data-Driven Analytical Visualization Dashboard Prototype Approach

1
Department of Engineering, Université de Lorraine, 54506 Vandœuvre-lès-Nancy, France
2
Departamento de Ciencias de la Computación, Universidad de Alcalá, 28801 Madrid, Spain
3
Department of Energy Technologies and Renewable Sources, ENEA Portici Research Center, ICT Division-HPC Laboratory, 80055 Portici, Italy
4
Department of Energy Technologies and Renewable Sources, ENEA Casaccia Research Center, ICT Division-HPC Laboratory, 00123 Rome, Italy
*
Author to whom correspondence should be addressed.
Electronics 2025, 14(16), 3170; https://doi.org/10.3390/electronics14163170
Submission received: 1 July 2025 / Revised: 29 July 2025 / Accepted: 4 August 2025 / Published: 8 August 2025

Abstract

High-performance computing (HPC) data centers are experiencing rising energy consumption, despite the urgent need for increased efficiency. In this study, we develop an approach inspired by digital twins to enhance energy and thermal management in an HPC facility. We create a comprehensive framework that incorporates a digital twin for the CRESCO7 supercomputer cluster at ENEA in Italy, integrating data-driven time series forecasting with an interactive analytical dashboard for resource prediction. We begin by reviewing relevant literature on digital twins and modern time series modeling techniques. After ingesting and cleansing sensor and job scheduling datasets, we perform exploratory and inferential analyses to understand key correlations. We then conduct descriptive statistical analyses and identify important features, which are used to train machine learning models for accurate short- and medium-term forecasts of power and temperature. These models feed into a simulated environment that provides real-time prediction metrics and a holistic “health score” for each node, all visualized in a dashboard built with Streamlit. The results demonstrate that a digital twin-based approach can help data center operators efficiently plan resources and maintenance, ultimately reducing the carbon footprint and improving energy efficiency. The proposed framework uniquely combines concepts inspired by digital twins with time series machine learning and interactive visualization for enhanced HPC energy planning. Key contributions include the novel integration of predictive models into a live virtual replica of the HPC cluster, employing a gradient-boosted tree-based LightGBM model. Our findings underscore the potential of data-driven digital twins to facilitate sustainable and intelligent management of HPC data centers.

1. Introduction

1.1. Background

A data center, also known as a data processing center, is a facility that houses computer systems and associated components, such as networking, storage, power, and cooling infrastructure, to support a wide range of digital services [1]. These installations are critical to modern society, especially as the demand for cloud computing, big data, artificial intelligence, and the Internet of Things [2] continues to rise. Modern data centers have grown significantly in scale and power consumption, making them considerable contributors to global energy use and CO2 emissions. The evolution of data centers is driven by the need for increased capacity, improved efficiency, and enhanced resilience [3]. High-performance computing (HPC) refers to the use of supercomputers or large computing clusters to perform extremely demanding computations in fields like science, engineering, and analytics. An HPC cluster typically consists of multiple processing cores working in parallel, requiring dedicated cooling and power supply systems. While these systems enable advanced simulations and data processing, they also consume enormous amounts of energy. For instance, a typical HPC data center can draw between 20 and 30 megawatts of power—comparable to the energy consumption of a small city—with annual electricity costs reaching tens of millions of dollars [4]. By 2030, HPC and other large data centers worldwide are projected to account for about 3% of global electricity usage [4]. Therefore, improving energy efficiency in this sector is crucial not only for controlling operational costs but also for meeting sustainability goals. Enhancing data center efficiency yields significant environmental benefits by reducing greenhouse gas emissions and increasing reliability through the reduction of waste heat, which can stress hardware [5]. Gaining deeper insights from existing operational data to anticipate future behavior is essential. A promising approach to this is the concept of a digital twin, which allows for the use of a virtual representation of a physical system that stays synchronized with real-world data. A digital twin is broadly defined as a highly detailed, dynamic software model of a physical asset or process, continuously updated by real-time and historical data. Unlike static simulations, digital twins can evolve in parallel with their physical counterparts, allowing for predictive analytics. By mirroring the state of a data center, a digital twin enables operators to evaluate predictions for long-term changes in energy and thermal requirements, aiding in the proactive identification of optimization opportunities without disrupting live operations. In the data center domain, digital twins have emerged as a viable technology to visualize the effects of various interventions and predict future trends, thereby supporting smarter capacity planning and maintenance scheduling. In this study, we explore the application of digital twins in an HPC data center, aiming to forecast its thermal characteristics and energy requirements over time to facilitate sustainable operations.

1.2. Aim and Objectives

The aim of this research is to develop a prototype analytical dashboard inspired by digital twin technology for the CRESCO7 HPC data center cluster. This dashboard will enable data center managers to predict key parameters related to energy consumption and optimize operations. The specific objectives of the research include the following:
  • Conducting a literature review on previous work related to digital twins for data centers and analyzing the structure and characteristics of the dataset.
  • Examining the available datasets to characterize their features.
  • Understanding the relationships and dependencies among variables within and between the sensor and job datasets.
  • Developing and training predictive models for thermal and energy consumption.
  • Integrating the predictive models into a digital twin-based representation of the HPC data center.
The primary goal of this research is to create an analytical dashboard inspired by digital twin technology for the CRESCO7 HPC data center cluster. This dashboard will allow users to predict essential parameters related to energy consumption and optimize the data center’s operations, thereby aiding in resource planning and enhancing the understanding of each node’s performance over time. The research objectives are organized into four phases:
  • Phase 1: Descriptive analysis of the dataset.
  • Phase 2: Correlation and inferential analysis.
  • Phase 3: Predictive modelling for energy and thermal metrics.
  • Phase 4: Visualization of the digital twin-inspired analytical dashboard.

1.3. CRESCO7 Cluster

The CRESCO7 cluster in Portici is one of the latest powerful supercomputers operated by ENEA for complex tasks and research activities. Its specifications are as follows: it consists of 144 nodes operating in synchronization, each node having 2 × 24-core Intel® Xeon® Platinum 8160 processors (2.10 GHz) and 192 GB RAM. The backend network uses a Mellanox EDR interconnect supporting 100 Gb/s, and each node has two 100 Gb Ethernet interfaces for data connectivity. In total, the cluster comprises 6912 CPU cores and 1 PB of NVMe storage. With these powerful specifications, CRESCO7 delivers consistently high performance for demanding computations. However, this also implies significant power and cooling demands, which motivates the exploration of advanced energy management techniques in this research.

1.4. Rationale

The relentless growth in the use of digital services has created a significant demand for data centers, leading to a corresponding increase in energy consumption. Data centers support essential technologies such as cloud computing, edge computing, artificial intelligence, and the Internet of Things (IoT). With each new innovation, more data is generated, requiring additional data center deployments, which in turn drives up power usage. High-Performance Computing (HPC) facilities exacerbate this issue, as they require an enormous amount of computing power concentrated in a single location. The need for energy efficiency in these environments goes beyond cost savings; it is also linked to global sustainability efforts [6], which emphasize the reduction of carbon emissions. As a result, there is a strong focus on finding solutions to improve energy efficiency in data centers.

1.5. Contribution of Research

This research advances the field by integrating advanced time series machine learning techniques into an analytical dashboard framework specifically designed for managing high-performance computing (HPC) data centers. A key contribution is the development of a unified platform that combines predictive analytics, thermal modeling, and interactive visualization into a single dashboard. Unlike prior studies that often focused on isolated aspects of data center operations, our approach integrates sensor data, job metrics, and predictive models to create an actionable tool for operators. Additionally, we demonstrate the effective application of the gradient boosted decision tree model LightGBM for multi-step forecasting of thermal and power variables in data centers. Our results show that we achieve high accuracy with low computational overhead. With appropriate feature engineering and tuning, tree-based models can effectively capture the behavior of HPC cooling and power dynamics, resulting in mean absolute percentage errors of around 1% or less—making this level of precision suitable for operational planning.

1.6. Paper Structure

The remainder of the paper is organized as follows: Section 2 reviews related work on energy efficiency measures in data centers, focusing primarily on recent advances in cooling technologies, applications of digital twins, and machine learning approaches for data center optimization. Section 3 outlines the methodology of our study, which includes data collection, analysis, feature engineering, model development, and the creation of the analytical dashboard. Section 4 presents the results and discussion of the analysis, detailing the performance of the predictive model, insights gained from the dataset, and information about the analytical visualization dashboard. Section 5 provides conclusions and suggests avenues for future research.

2. Related Work

We examine the existing and prior research on digital twins for data centers, along with their advancements over time.

2.1. Current Data Center Situation

Data centers have experienced significant transformations over the decades, evolving from mainframe computers to widespread cloud server farms. This growth has been accompanied by an ongoing effort to improve energy efficiency, driven by both economic and environmental concerns. Globally, the average Power Usage Effectiveness (PUE), which is the ratio of total facility energy to IT equipment energy, has been gradually improving, indicating better infrastructure efficiency [2,7]. It is estimated that by the end of 2025, approximately 181 zettabytes of data will be created annually worldwide [8], fueling the deployment of new data centers and escalating overall power consumption. Various metrics have been proposed to quantify different aspects of data center efficiency beyond just using PUE. A recent systematic review cataloged over 25 energy efficiency metrics and surveyed more than 250 research works on data center energy [9]. In modern high-performance computing (HPC) data centers, energy efficiency is crucial because they operate at extreme power densities and high utilization levels [10]. Insufficient cooling or power can lead to hardware failures or downtime, which is particularly costly in HPC environments. Improving efficiency also enhances system reliability and longevity. Reducing energy waste minimizes heat generation, resulting in less thermal stress on equipment and potentially decreasing failure rates. Recent studies have underscored the importance of IT reliability alongside efficiency in HPC operations [5], including the integration of artificial intelligence and machine learning to optimize operations [11]. Additionally, scheduling flexible workloads during times of day when renewable energy is abundant or when electricity prices are low can significantly reduce costs and emissions [2]. Research indicates that shifting HPC workloads to off-peak hours—when electricity is often cheaper and greener—can decrease power costs by up to 40% and cut carbon emissions by 10–15% [12]. With the increasing demand for data center capacity, it is essential to invest in new infrastructure and expand existing facilities that support data center operations [13], such as intrusion detection systems and data encryption [14].

2.2. Energy Consumption for Power Management: Challenges and Improvements

Data centers are known for their high energy consumption, which poses a significant concern due to both the increasing financial burden and environmental impact [15]. Over 95% of the total cooling load in a data center primarily comes from the heat generated by IT equipment [16]. The energy intensity produced by data centers is substantially higher than that of conventional office buildings, often exceeding it by a factor of 40. The annual electricity usage in data centers is currently increasing at a rate above 20%, mainly due to the cooling requirements needed to maintain optimal operating conditions for all equipment [15]. Another major challenge is the complexity of data center cooling systems. Effective analysis of these systems requires making constant dynamic decisions, taking into account factors such as weather conditions, system performance, and economizer control levels [16]. The integration of Information and Communication Technology (ICT) capabilities with facilities management has demonstrated significant energy savings but also presents challenges regarding data integration and the implementation of control schemes. Furthermore, there are limitations in established reliability standards for technologies like single-phase liquid immersion cooling (Sp-LIC), indicating a need for further research in this area [17].

2.3. Advanced Cooling Technologies and Energy Implications

Cooling systems account for a significant portion of data center energy use, often comprising 30–40% [18] of total consumption in traditional air-cooled facilities. Improving cooling efficiency is, therefore, one of the best ways to reduce overall Power Usage Effectiveness (PUE). In recent years, several advanced cooling technologies have gained traction see the Table 1:
Liquid-based Cooling: Unlike conventional air cooling, liquid cooling involves bringing a coolant, usually water or a dielectric fluid, into direct contact with heat sources [19]. One common approach is cold plate or direct-to-chip cooling, where water-cooled cold plates are attached to CPUs or GPUs to absorb heat more efficiently than air. Rear-door heat exchangers (RDHx) are another method; they add a water-cooled radiator at the back of server racks to capture hot air exhaust. These techniques can dramatically increase the heat removal capacity per rack. Additionally, liquid cooling tends to improve efficiency since water has much greater thermal conductivity and capacity than air, allowing pumps to transfer heat at a lower energy cost compared to large air handling units.
Immersion Cooling: In immersion cooling, servers are completely submerged in a bath of non-conductive dielectric fluid. Single-phase immersion cooling (Sp-LIC) uses a fluid that does not boil; heat is carried away through circulation and external cooling loops. Dual-phase immersion utilizes a boiling fluid that transports heat away via vapor that condenses and re-circulates. Immersion cooling offers excellent thermal performance and eliminates the need for server fans, potentially reducing or even eliminating the need for chillers, leading to simpler facility designs.
Hybrid Cooling and Airflow Optimization: Many data centers implement a combination of different cooling strategies [20] to balance efficiency and cost. For example, air–water hybrid systems use liquid cooling for the hottest components while relying on air cooling for the rest. Free cooling techniques, such as using outside air when the climate permits, are widely adopted to manage heat. Furthermore, improvements in airflow management, including hot/cold aisle containment and variable speed fans [21], can yield more efficient results by ensuring cooling is delivered where and when needed. Containment strategies physically separate hot exhaust air from cold supply air, preventing mixing and allowing for higher return air temperatures that enhance the efficiency of the cooling plant.
The table below compares several data center cooling technologies in terms of efficiency, cost, and adoption status:
Table 1. Comparison of data center cooling technologies.
Cooling TechnologyTypical Efficiency (PUE or Saving)Relative Cost (CapEx)Adoption (Current Trend)
Traditional Air CoolingPUE ~1.3–1.5 (baseline)Low (baseline)Nearly universal in legacy designs (dominant overall)
Air Cooling + Rear-Door Heat Exch.PUE ~1.2–1.3 (improved by ~10–20%)MediumModerate adoption
Direct Liquid (Cold Plate)PUE ~1.1–1.2 (significant improvement)Medium–HighGrowing adoption in HPC and AI clusters (select deployments)
Single-Phase Immersion Cooling (Sp-LIC)PUE ~1.03–1.05 (near optimal, 10–50% energy saving) [22]High (specialized infrastructure needed)Limited adoption (niche trials by hyperscalers; a few production deployments)
Two-Phase Immersion CoolingPUE ~1.02–1.05 (similar to single-phase)Very High (complex systems, costly fluid)Very limited (experimental deployments only)
Note: PUE = Power Usage Effectiveness, where a lower value is better.

2.4. Digital Twins for HPC Data Center

Digital twin technology, which originated in the manufacturing and aerospace sectors, has increasingly been applied to complex systems such as smart buildings, power grids, and data centers. The novelty of digital twins lies in their ability to create near real-time, synchronized virtual models of physical entities. In a data center, a digital twin [23] integrates various data sources, including telemetry data (such as network traffic and request information), environmental sensors (like temperature and humidity), and facility systems (such as cooling units and power distribution), into a unified simulation that mirrors the actual data center. By providing a real-time representation of the data center’s physical infrastructure, digital twins can optimize resource utilization [24], leading to cost savings and enhanced efficiency. This technology allows for detailed situational awareness and predictive analytics. For example, if the temperature of a certain server starts to trend upward, the digital twin reflects that change and can project future temperatures based on current cooling settings, potentially alerting operators to overheating before it occurs. Several efforts have been made to develop digital twins for data centers. One notable instance involves the automated generation of digital twins for the purpose of virtual commissioning of control systems. This approach focuses on creating a virtual environment to test data center control logic before deployment, highlighting one major benefit of digital twins: the ability to perform risk-free testing. Other applications of digital twins include capacity planning and optimization by simulating how changes in IT load or cooling configurations might affect performance and energy metrics, allowing operators to make informed decisions without altering the live system. In advanced implementations, digital twins can even send adjustments or scheduling recommendations back to the physical data center for execution, creating a real-time feedback loop.
For high-performance computing (HPC) clusters, digital twins can be extremely valuable for resource optimization, providing a platform to virtually evaluate different scenarios and identify strategies that save energy with minimal risk. Prior studies have reported that digital twin-driven management can result in cost savings and efficiency gains through more granular control and forecasting [25]. For instance, it might be possible to predict an upcoming high-demand period and recommend pre-cooling certain areas or provisioning additional servers in advance, rather than reacting after temperatures have already risen. Despite the growing interest, the integration of digital twins with advanced data analytics for HPC environments remains a novel approach. Many existing digital twin implementations in data centers have been limited to either physical infrastructure simulation or basic monitoring clones. Our work addresses this gap by incorporating time series machine learning forecasts directly into the digital twin. This enhancement allows the twin not only to reflect the current state but also to predict future states, such as forecasting that “Node X’s CPU will reach 85 °C in 10 min if current trends continue.” This forward-looking capability is a key differentiator, as it builds upon modern forecasting methods that utilize historical sensor data to anticipate thermal and power behavior. When integrated into a digital twin, these predictions can trigger analyses like, “If the fan speed is increased by 10% now, will that prevent the temperature spike?” and provide an immediate answer through simulation. Past studies indicate the potential of digital twins in enhancing monitoring, enabling preventative maintenance, and improving change management processes. This is achieved through real-time monitoring and predictive management capabilities [26]. However, few studies have combined digital twins with sophisticated time series machine learning models and interactive dashboards as we do in this study. By merging these elements, we offer a more powerful tool that can be utilized not only for offline planning but also for real-time operational decision support.

2.5. Reliability and Adoption of Immersion Cooling

While liquid cooling technologies offer efficiency advantages, their widespread adoption has been slow, partly due to concerns about reliability and the lack of established standards. Traditional data center equipment and reliability standards, like the ASHRAE thermal guidelines, have been developed primarily around air-cooled systems. Immersion cooling, which places electronic components in direct contact with a cooling fluid, raises questions about its long-term effects on materials, the lifespan of components, failure modes, and serviceability. Currently, there is a lack of industry-wide reliability standards for immersion-cooled systems, especially for single-phase liquid immersion cooling (Sp-LIC) setups. Established reliability standards are crucial because they provide operators and manufacturers with confidence that a technology can meet certain performance and safety benchmarks over time. Without these standards, potential users of Sp-LIC may have concerns about unknown failure mechanisms, such as fluid leaks, component degradation, pump failures, and maintenance procedures for submerged hardware, all of which could lead to downtime. Previous studies have highlighted issues like increased equipment failure rates, fluid degradation, and challenging maintenance processes as downsides of immersion cooling that need to be addressed [22]. The industry is now recognizing these challenges and working toward solutions. The Open Compute Project (OCP) has partnered with major tech companies to develop guidelines and testing frameworks specifically for immersion cooling environments [27]. These efforts aim to redefine reliability metrics for submerged conditions and to standardize material compatibility requirements. Major cloud providers have launched pilot projects; in 2021, Microsoft revealed its first immersion-cooled data center region for Azure, reporting positive results in server reliability and efficiency. Telecom and colocation companies are also experimenting with modular immersion cooling setups for edge and high-density applications. Industry analysts project rapid growth for the immersion cooling market in the coming years, with one report forecasting a compound annual growth rate of approximately 22.5% from 2024 to 2031, ultimately reaching over USD 1 billion [28].

2.6. Machine Learning for Energy Savings in Data Centers

Machine learning (ML) has become an essential tool for optimizing data center operations. Numerous studies have applied ML to various challenges such as predictive maintenance, load forecasting, anomaly detection, and dynamic resource allocation. In terms of energy efficiency, ML algorithms learn complex patterns from historical data to make predictions or recommendations that enhance operational efficiency.
One significant application of ML is the predictive maintenance of cooling and power equipment. By monitoring sensor data, ML models can forecast failures or performance degradation in critical components before they occur [25]. For instance, if an air handling unit (AHU) is showing signs of impending failure, an ML model may detect subtle indicators like a decline in efficiency, alerting operators to perform maintenance. This proactive approach helps prevent unexpected breakdowns that could lead to downtime and energy waste. Maintaining equipment proactively ensures it runs at optimal efficiency and prevents energy spikes that often happen when systems struggle before failing. A study conducted by Kumar, Khatri, and Divn [29] employed linear and logistic regression to optimize AHU fan speeds, successfully improving temperature control while reducing energy consumption. This demonstrates how even relatively simple ML models can automate the adjustment of control setpoints to adapt to current conditions without manual intervention, resulting in direct energy savings. Another area where ML proves beneficial is in workload forecasting and dynamic provisioning. Data centers often experience highly variable workloads. ML can analyze historical workload data to predict future resource demands, allowing for smarter scheduling decisions. For example, during periods of low demand, workloads can be consolidated, while resources can be pre-emptively allocated when a spike in demand is anticipated. By accurately forecasting CPU utilization and identifying times of underutilization or overutilization, ML-guided systems can determine when to migrate virtual machines and manage servers effectively, thereby preventing energy waste from idle or underloaded hardware. Panwar et al. [30] provide a systematic review of energy management strategies in cloud data centers, noting that various ML-based approaches have achieved energy savings ranging from approximately 2% to 97% in different scenarios. This wide range indicates that the effectiveness of these approaches varies depending on the technique used. Despite these successes, deploying ML in data centers poses its own challenges. These challenges primarily stem from the complexity of data center infrastructure, variations in workloads, and the requirement for real-time processing, all of which serve as significant obstacles [31]. Ensuring that models remain effective over time necessitates continuous monitoring and sometimes online retraining with fresh data [32].
Interdisciplinary Approaches Using Operations Research and Systems Engineering:
To fully realize the benefits of ML in data center operations, insights from operations research (OR) and systems engineering can be utilized. Operations research offers an array of optimization and decision-making techniques that can complement ML predictions. For example, if an ML model forecasts the hourly power demand of a high-performance computing (HPC) cluster for the following day, an OR algorithm such as linear programming can be employed to create an optimal schedule that minimizes energy peaks while adhering to performance constraints. ML can accurately predict the power consumption of individual jobs, and OR methods can schedule these jobs at specific times or on specific nodes to flatten the power load or shift it to off-peak electricity tariff hours. Research has shown that combining accurate power prediction with workload optimization can lead to cost reductions of 10–20% in multi-site HPC scheduling, without significant performance loss, thus underscoring the advantages of integrating predictive analytics with optimization algorithms [12].
From a system engineering perspective, implementing ML-based control in a data center requires careful attention to reliability and integration with existing management systems. A data center is a mission-critical system where any automated decision, such as powering down equipment or modifying cooling setpoints, must be made with caution. Systems engineering principles ensure that ML models and their recommendations are validated and can be overridden or adjusted in the event of anomalies. By combining ML with first-principles models of data center thermodynamics, we can ensure that ML-based decisions respect operational constraints.

3. Methodology

Our methodology consists of four phases. In Phase 1, we conducted data analysis to understand the distribution and quality of the collected data. Phase 2 involved correlation and inferential analysis to identify relationships between variables in the sensor and job datasets. In Phase 3, we developed machine learning models to forecast key metrics based on engineered features. Finally, Phase 4 integrated these models into a prototype analytical visualization dashboard, inspired by the concept of a digital twin, allowing for interactive exploration of predictions and scenarios.

3.1. Phase 1: Descriptive Statistics and Data Analysis

For this study, we gathered two main datasets from the newly established CRESCO7 HPC cluster, using the cluster’s built-in monitoring tools:
Sensor dataset: Time-based measurements from 144 nodes, including metrics such as CPU temperature, inlet and outlet air temperatures, fan speeds, power draw, etc. These readings were recorded at regular intervals over a period of four months (1 September 2024 through 31 December 2024).
Job scheduling dataset: Records of all jobs executed during the same period, detailing, for each job, its start time, end time, nodes utilized, resource usage statistics, etc.
We began by merging and cleaning the datasets. During this process, we identified a gap in the sensor readings from 12 September 2024 at 09:11 until 14 October 2024 at 12:30. No sensor data was recorded during this interval, as the CRESCO7 system was being set up, and jobs were temporarily managed by a different cluster (as shown in Figure 1). Additionally, we noticed a few anomalous readings, such as negative power values and sudden spikes, which we filtered or corrected based on the available log information. After cleaning the data, we performed descriptive statistical analysis on certain variables (as represented in Table 2). This process involved calculating summary statistics and plotting the distributions. Key observations from the sensor data included the following: CPU core temperatures ranged from approximately 47.3 °C to 78.81 °C, with a mean of around 67.17 °C. The thermal load, defined as the difference between outlet and inlet air temperatures, varied between 18.3 °C and 25.3 °C, with a mean of about 22.3 °C. The node power draw was highly right-skewed, with 75% of readings falling below 7.4 Wh per measurement interval, while some spikes reached several hundred Wh, indicating occasional intensive workloads. On average, CPU utilization per node was around 57%, memory utilization was approximately 14.6%, and fan speeds varied significantly—from about 2700 RPM at idle to 18,300 RPM under high load. This detailed analysis helped us identify which variables could serve as effective predictors for modeling. In the job dataset, we discovered that about 2% of jobs had missing end times, which were associated with canceled or failed jobs; we excluded these from our analysis of runtimes. We calculated each job’s duration, with the median runtime being roughly 4 h and 6 min.
Data set cleaning: Across both datasets, we made only minimal removals and transparent modifications. In the approximately 31,423-row jobs table, we backfilled 31 missing “state” entries (0.03%) as “Canceled” and calculated 18 blank memory-efficiency values (0.02%) based on allocated versus utilized memory, without dropping any rows. In the 12,862,800-row sensors table, we removed a one-month maintenance gap (from 12 September 2025 to 14 October 2025) and discarded 347 zero-value rows (0.003%), while keeping 291 genuine failure records. We also eliminated 26 redundant or low-level columns, leaving 33 inputs for modeling. In total, less than 0.5% of the original data was removed or transformed, preserving over 99.5% of the data for robust training and ensuring full transparency regarding every imputation, deletion, and dropped feature.

3.2. Phase 2: Inferential Statistical Analysis

In Phase 2, we explored the relationship between job scheduling data and sensor readings. Our goal was to determine whether there was any correlation between job activity and sensor measurements. To do this, we defined an “is_idle” indicator in the job dataset for each node and timestamp, which indicates whether the node had no job running at that time (true) or was busy (false). Similarly, we created an “is_gap” indicator in the sensor dataset to identify periods longer than two hours during which no sensor readings were recorded. We then aligned both datasets along a common timeline, allowing us to directly compare job activity with sensor metrics. By merging the datasets based on timestamps and node IDs, we obtained a combined time series for each node that included both operational metrics and job status. With this data, we calculated correlation coefficients between various variables. For our analysis, we utilized the connection between the two variables we had created, which allowed us to examine sensor readings along with the relevant nodes involved in the job within a specific minute window. However, the combined correlation heatmap did not reveal strong correlations. We speculated that using a five-minute window may not have aligned with the node scheduling policy, prompting us to conduct a deeper analysis of the sensor dataset. This deeper analysis showed strong correlations that were useful for building the model. Fortunately, we did not find any extremely high correlations between the independent variables. The insights gained from Phase 2 informed our feature engineering in Phase 3. Recognizing that different patterns existed, we decided to incorporate calendar features into the model. Since power and temperature readings depend on whether the cluster is idle or busy, we included lagged features of utilization and power to provide the model with context regarding recent load.

3.3. Phase 3: Machine Learning Model for Cooling Optimization

Feature Engineering: Based on the findings from Phases 1 and 2, we identified key variables for modeling: the average CPU temperature per node (calculated as the mean of the two CPU socket temperatures, referred to as “Avg CPU Temp”), thermal load (the difference between outlet and inlet air temperatures for the cluster at a given time), and data center energy consumption (computed as the total power across all nodes, providing a global energy metric in watt-hours). These will serve as target variables for our predictions. The primary goal is to forecast these thermal and energy metrics over the short to medium term (from hours to days ahead). We focused on the cluster-wide average CPU temperature, total data center power draw, and thermal load as three distinct target time series.
For each target variable, we constructed features that capture recent history and seasonal patterns:
Lag Features: We created lagged versions of each target variable at various intervals: 1 h, 2 h, 6 h, 24 h, and up to 168 h (one week) prior. This provides the model with information about past values and periodic patterns. Including a 24 h lag helps the model learn daily patterns, while lags extending to 168 h capture weekly repetitions.
Rolling Window Statistics: We computed rolling means and standard deviations over windows such as the past 3 h, 24 h, and 7 days. The rolling mean smooths short-term fluctuations and helps the model identify baseline trends, while the rolling standard deviation indicates volatility, allowing us to see if power usage has spiked or remained steady in the previous hours.
Calendar Features: These include the hour of the day (0–23), day of the week (0–6), and a flag distinguishing weekend from weekday. These categorical, time-based features enable the model to account for known cyclical effects, with hours and days encoded as numeric or one-hot vectors as needed.
Derived Metrics: We incorporated combined metrics deemed essential, such as the Average CPU Temperature and Average Thermal Load, which represents the difference between exhaust and ambient temperatures, indicating how much heat the equipment is adding to the air. Additionally, though our primary targets are aggregated, we considered per-node metrics. For example, while total cluster power is the sum of nodes, including average utilization across nodes or the fraction of active nodes as features may provide useful insights.
After assembling these features, we removed any rows with missing values that could not be filled. This included values at the very start of the dataset, undefined lags, and the entire maintenance gap.
Model Selection: We chose to use LightGBM, a gradient-boosted decision tree-based forecasting model, for each target variable. The decision to use LightGBM was based on its speed, ability to manage a mix of feature types (both continuous and categorical) without extensive preprocessing, and strong performance on tabular data. Given our variety of features, which are primarily numeric, LightGBM can process these without requiring normalization or scaling. It also inherently captures non-linear relationships and interactions, which is beneficial since the dynamics in data centers can be quite non-linear. Moreover, LightGBM has relatively low computational requirements for both training and inference, making it ideal for our solution, which we envision running in near real time. In contrast, we considered but ultimately decided against using more complex models like recurrent neural networks (e.g., LSTM) or Prophet for several reasons:
(i)
Deep learning models, such as Long Short-Term Memory (LSTM) networks, require significantly larger training datasets and extensive tuning efforts. They are also prone to overfitting when trained on only four months of data. Additionally, their training and inference times are considerably longer, which could lead to latency issues for real-time applications.
(ii)
Simpler statistical models like ARIMA or Prophet rely on specific structures, such as seasonality or trends, and typically handle only one time series at a time. This limitation makes it challenging to incorporate multiple correlated inputs—such as utilization rates or fan speed influences—without considerable manual feature engineering for each relationship.
(iii)
The other models were resource-intensive and took much longer to train, which would hinder the performance of our analytical dashboard and defeat its intended purpose.
LightGBM effectively utilized all our engineered features and identified the important predictors, demonstrating a quick turnaround and proving to be the most optimal solution. We trained a separate LightGBM regressor for each target: one for average CPU temperature, one for total data center energy, and one for thermal load. We employed an 80/20 chronological train-test split, using the first 80% of the time series (from 14 October to mid-December 2024) for training, and the final 20% (from mid-December to the end of December 2024) as a test set. This approach ensures that we always predict on future data, maintaining the temporal order. Next, we moved on to hyperparameter tuning to maximize performance. We conducted a randomized search over 30 different hyperparameter configurations, varying the learning rate (from 0.01 to 0.1), maximum tree depth (from 5 to 15), number of leaves (31 to 100), and data sampling fractions (both row and column subsampling). For each candidate configuration, we utilized three-fold time series cross-validation on the training set, dividing the training period into three contiguous folds while ensuring that each validation segment follows its respective training segment to mimic temporal generalization. Our goal was to minimize the average RMSE across these validation folds. This tuning process yielded modest but consistent improvements. We then retrained the final LightGBM models on the entire 80% training set using the optimal hyperparameters and evaluated them once again on the 20% test set to report the final performance. To ensure that the models were not overfitting any particular feature, we examined the feature importance scores provided by LightGBM. We observed a healthy distribution of feature importance, with recent lag features (1 h, 3 h) and daily and weekly cyclical features being among the top contributors. No single feature dominated excessively, which gave us confidence that the model was leveraging a broad base of information. It was not simply relying on the value from the same hour the previous day; it was also considering current trends and the day of the week for context. In summary, Phase 3 resulted in three tuned LightGBM models capable of forecasting the cluster’s average CPU temperature, thermal load, and energy consumption with a high degree of accuracy. The model selection is further justified by achieving sub-2% MAPE errors, which is sufficient for our use case. Moreover, the model’s lightweight nature allows it to run in real-time without imposing a significant computational burden on the system. Next, we will describe how these models were incorporated into the digital twin dashboard.

3.4. Phase 4: Analytical Visualization Dashboard Development

In Phase 4, we deployed the trained models into an interactive analytical dashboard designed as a prototype inspired by a digital twin for the CRESCO7 data center. The dashboard was built using Streamlit, a Python 3.13 framework for web-based data applications, which enabled us to create interactive charts and controls easily. The goal was to transform raw model predictions into meaningful visual insights that mirror the actual data center.
Data and Model Integration: Upon initializing the app, it loads and caches the necessary datasets and models. Specifically, we cache the processed global dataset, the full node-wise sensor dataset, and the three trained LightGBM models. Caching is critical to ensure the app responds quickly to user inputs by avoiding the need to re-read large files or retrain models during each interaction. With Streamlit’s caching capabilities, typical user interactions complete within approximately 25 s, which we found to be an acceptable latency for this prototype.
Dashboard View: The dashboard consists of two main views: a Global Data Center view and a Node-Level Insights view.
Global View: This page displays cluster-wide metrics. We included three-line charts showing historical and forecasted values for the following:
  • Average CPU temperature.
  • Total data center energy consumption.
  • Average thermal load.
Initially, these charts show data from the last 168 h (one week of actual data) along with a default forecast horizon (e.g., 24 h) of model predictions extending beyond the last timestamp. Users can adjust a slider to extend the forecast horizon up to 336 h (two weeks). When the forecast horizon changes, the app uses the LightGBM models recursively to predict future values. It takes the last week of actual data as a starting point, and for each hour ahead, it uses the previously predicted values as new “lag” features for the next prediction. This recursive forecasting loop continues until the desired horizon is reached. The charts update to display both historical values and forecasted values, allowing the operator to visually assess where parameters like temperatures or power might be heading if current trends continue.
Interactive Controls: Above the global charts, we added several interactive controls, including sliders for key “what-if” parameters. These consist of a “Fan Speed Offset” slider (±15,000 RPM) and a “Supply Air Temperature” slider (14–30 °C range). Adjusting these sliders simulates various scenarios in the dashboard. For example, it checks how different fan speeds or airflow temperatures would affect the forecasts. Behind the scenes, when the user moves a slider, the app adjusts the input data fed into the model. Each time a control is changed, the forecast is recomputed recursively to reflect those changes. This dynamic interplay between user controls and model output significantly demonstrates the interactivity of the digital twin, which would operate similarly if live data were fed into the system.
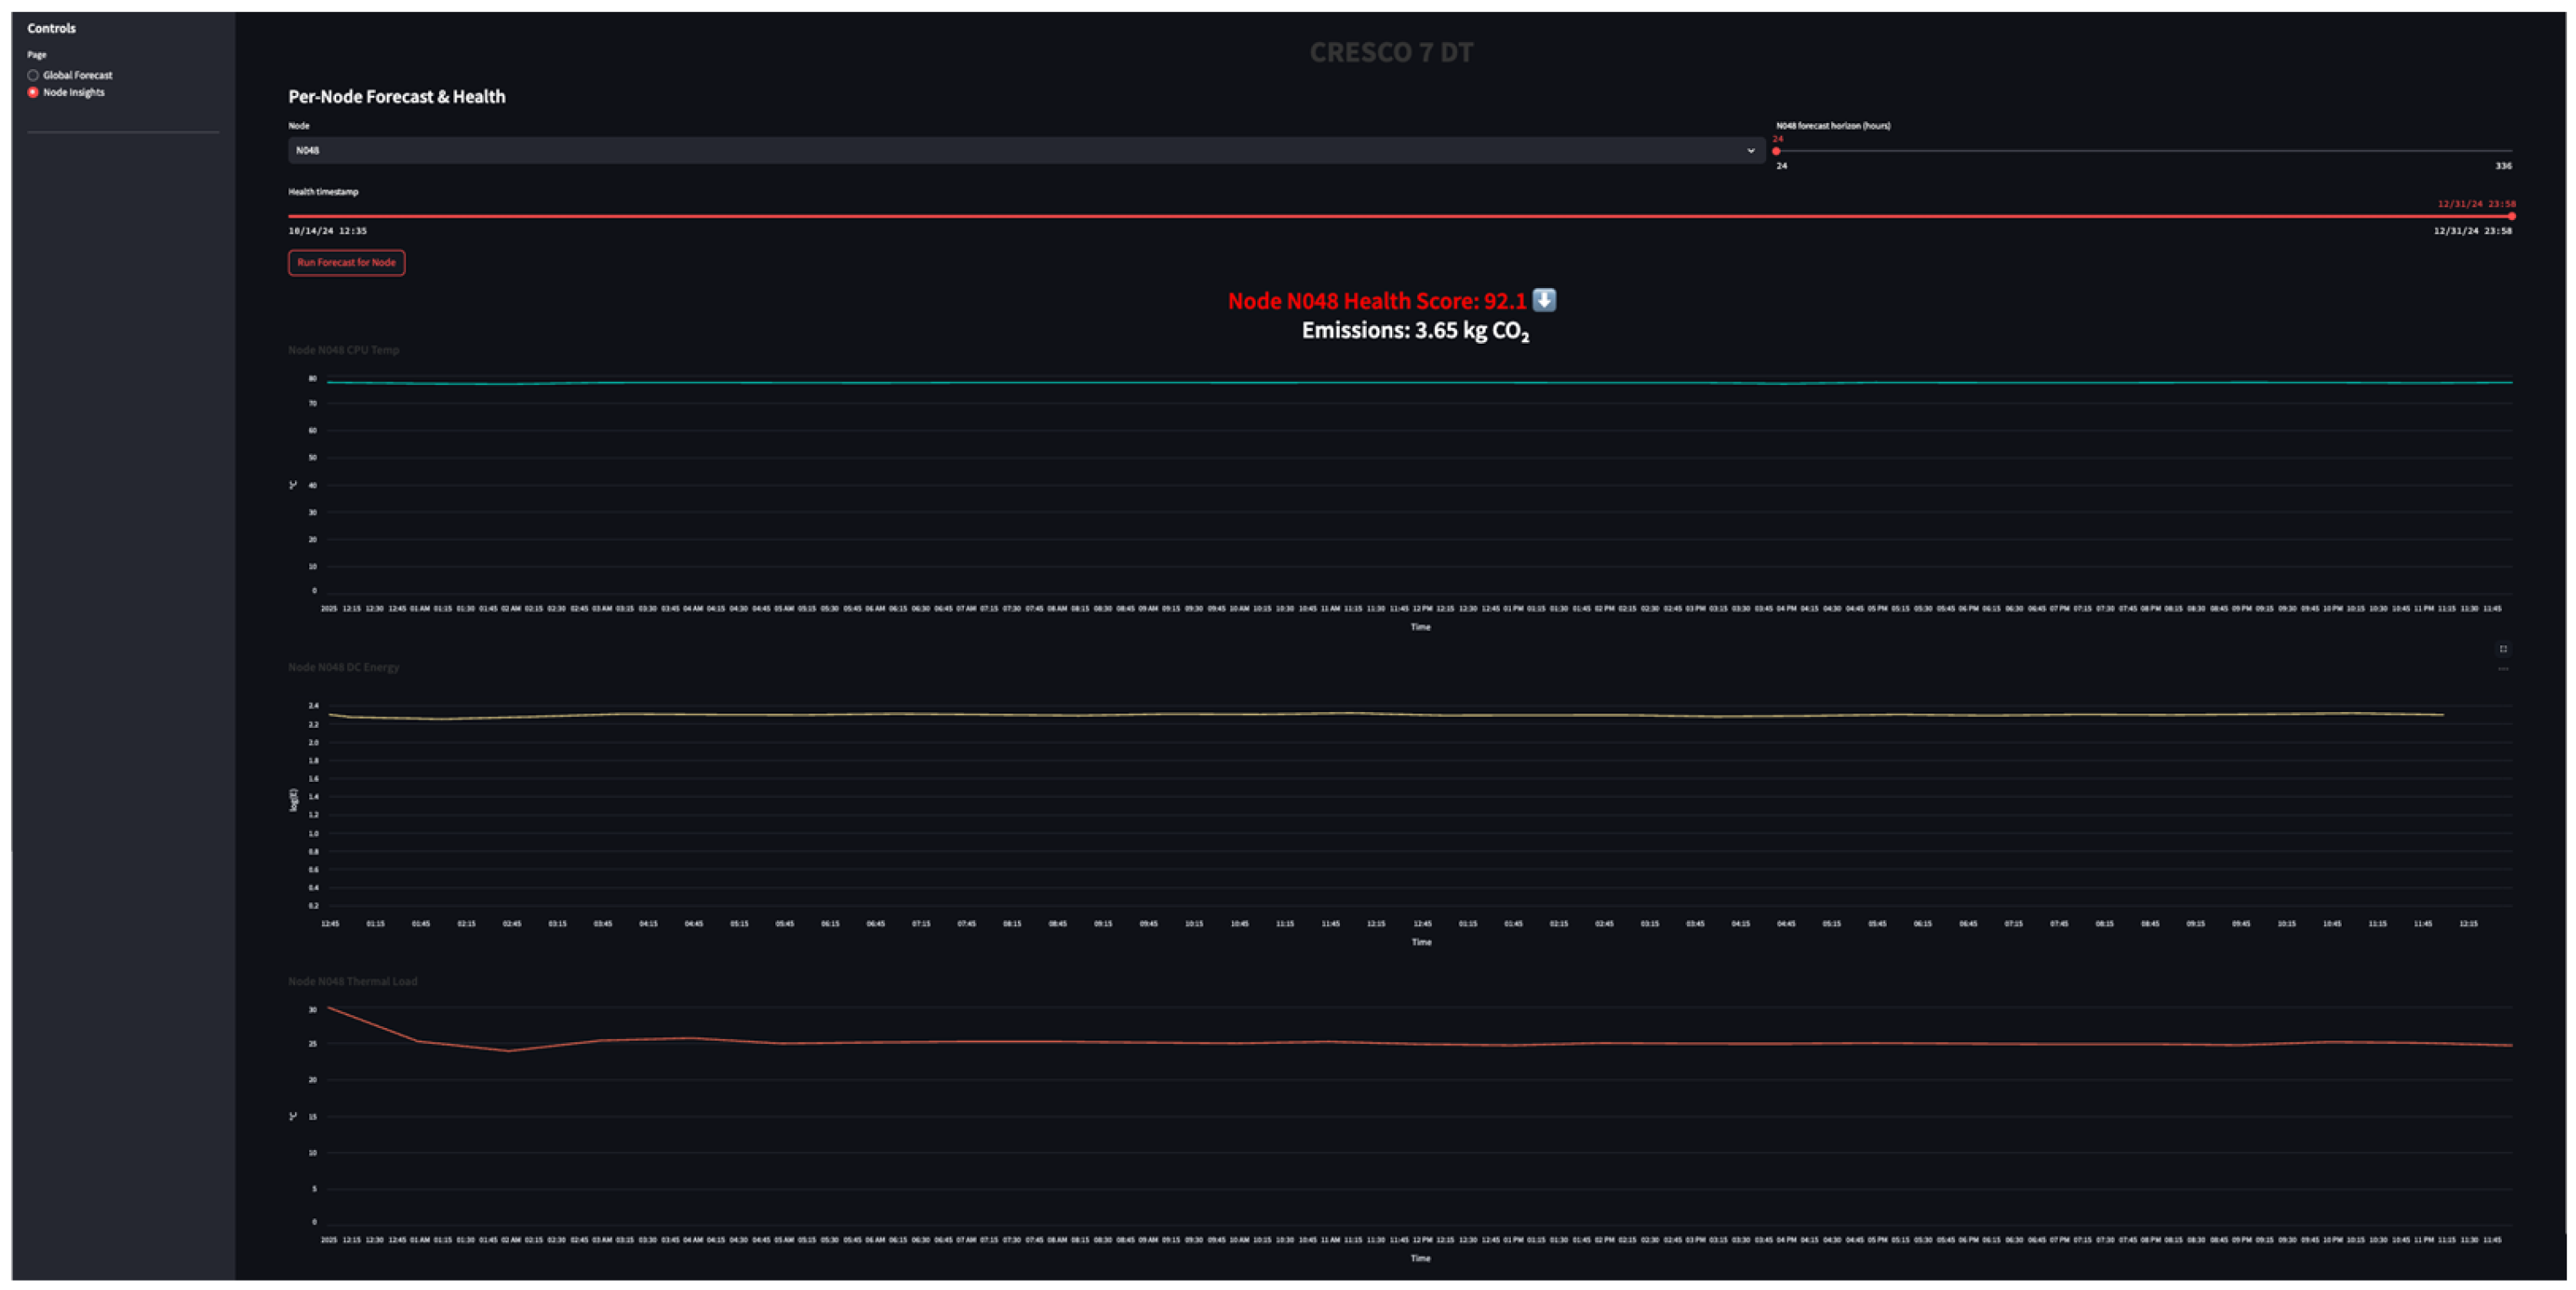
Node Insights View: Recognizing that cluster averages can overlook individual node behavior, we created a second page where users can check any specific node out of the 144 available. Users can select a node from a dropdown menu, and the app filters the large per-node dataset to retrieve historical data for that node, displaying its recent sensor readings. We retrain or fine-tune three LightGBM models specifically for the chosen node on the fly using an 80/20 data split. This is feasible within a short time due to caching and the relatively small data per node. The node-specific models then produce forecasts for that node’s CPU temperature, power consumption, and other metrics. We plot similar charts, but now they pertain only to the selected node. The purpose of this feature is to identify if certain nodes are behaving differently, which could indicate an imbalance or developing issue.
Health Score Indicator: We introduced a composite Health Score on the Node Insights page to condense multiple metrics into a single indicator for node health. We selected five key sub-metrics for each node: CPU utilization, memory utilization, thermal load, total power, and average fan speed. We normalized each of these metrics to a 0–100 scale using min-max normalization based on typical observed ranges. Then, we computed a weighted average with the following assigned weights: 25% for CPU utilization, 30% for thermal load, 20% for power draw, 15% for fan speed, and 10% for memory utilization. Thermal load carries the greatest weight because temperature sensors are present in 60.7% of AI/IoT predictive maintenance deployments, and thermal stress contributes significantly to hardware failure. CPU utilization follows at 25%, given its importance as a default metric across major cloud platforms and as a strong predictor of stress-related faults [33]. Power draw is weighted at 20% since energy costs account for approximately 46% of data center operating expenses, and unexpected power spikes often precede hardware faults [34]. Fan speed is assigned 15% because vibration and tachometer readings are the second most common indicators of potential issues [35]. Memory utilization is weighted at 10% in acknowledgement of large-scale studies showing no clear, monotonic link between memory load and failure rates [36].
Carbon Emissions Indicator: Based on the DC energy consumption (kWh) of each node at the selected timestamp, we calculate the carbon emissions by applying a standard emissions factor—0.453 kg CO2 per kWh, drawn from the U.S. EPA’s eGRID average for data centers [37]. In the dashboard, this instantaneous emissions rate in kg CO2 is displayed next to the composite health score.

3.5. Scalability and Retraining

The dashboard and feature engineering pipeline are fully portable across any HPC center that provides the same sensors and telemetry feeds, including CPU load, memory usage, fan tachometers, power draw, and exhaust temperatures. All aspects of data ingestion, lag/rolling window construction, and the Altair-based Streamlit front end can be redirected to a new cluster without needing any code changes. However, the underlying LightGBM forecasting models and the composite-score normalization parameters are dependent on each cluster’s specific hardware characteristics, such as thermal response curves, fan curves, power profiles, and workload mix. In practice, when deploying to a center where the node designs or cooling infrastructure differ by more than ±5% from CRESCO 7, you should retrain the three global models (Avg_CPU_Temp_Combi, Avg_DC_Energy_log, Avg_Thermal_Load) using data from the first few weeks at the new location. You will also need to recompute the min-max ranges for health-score normalization. This retraining should follow an 80/20 split for fitting and validation, which would take less than ten minutes on modern hardware. This ensures that both the forecasts and health scores accurately reflect the new environment. By combining rigorous machine learning forecasting with an intuitive user interface, the dashboard effectively acts as a digital twin-inspired command center. Users can observe the current state of the data center globally and per node, alongside projected future states. They can interact with controls to test hypotheses—such as adjusting cooling settings or exploring the effects of specific workloads—and immediately see the simulated outcomes in the digital twin. This capability fulfills the requirement of providing an actionable, real-time digital twin for the CRESCO 7 cluster that supports decision-making. Finally, the entire application is designed for performance to support near-real-time usage. Through caching and the use of an efficient model, the interface remains responsive. The lightweight nature of the LightGBM model ensures that even if the digital twin runs continuously, the computational load on the management server remains modest. This is crucial because an overly complex model (e.g., a deep LSTM) running every time a slider is adjusted could introduce latency or necessitate expensive GPU resources, which would compromise the real-time dashboard experience. In our case, the main source of latency arises from the recursive forecasting loop (predicting up to 14 days ahead involves approximately 336 iterations of model predictions for each target) and chart rendering. Potential optimizations (which have not been implemented in this prototype) could include parallelizing predictions or caching past forecast computations for reuse if the horizon is extended gradually. With this methodology explained, we will next present and discuss the results obtained, including model performance metrics, example scenarios evaluated with the digital twin, and comparisons of different strategies for energy efficiency derived from insights gained from our twin.

4. Results and Discussion

4.1. Phase 1: Data Exploration and Analysis

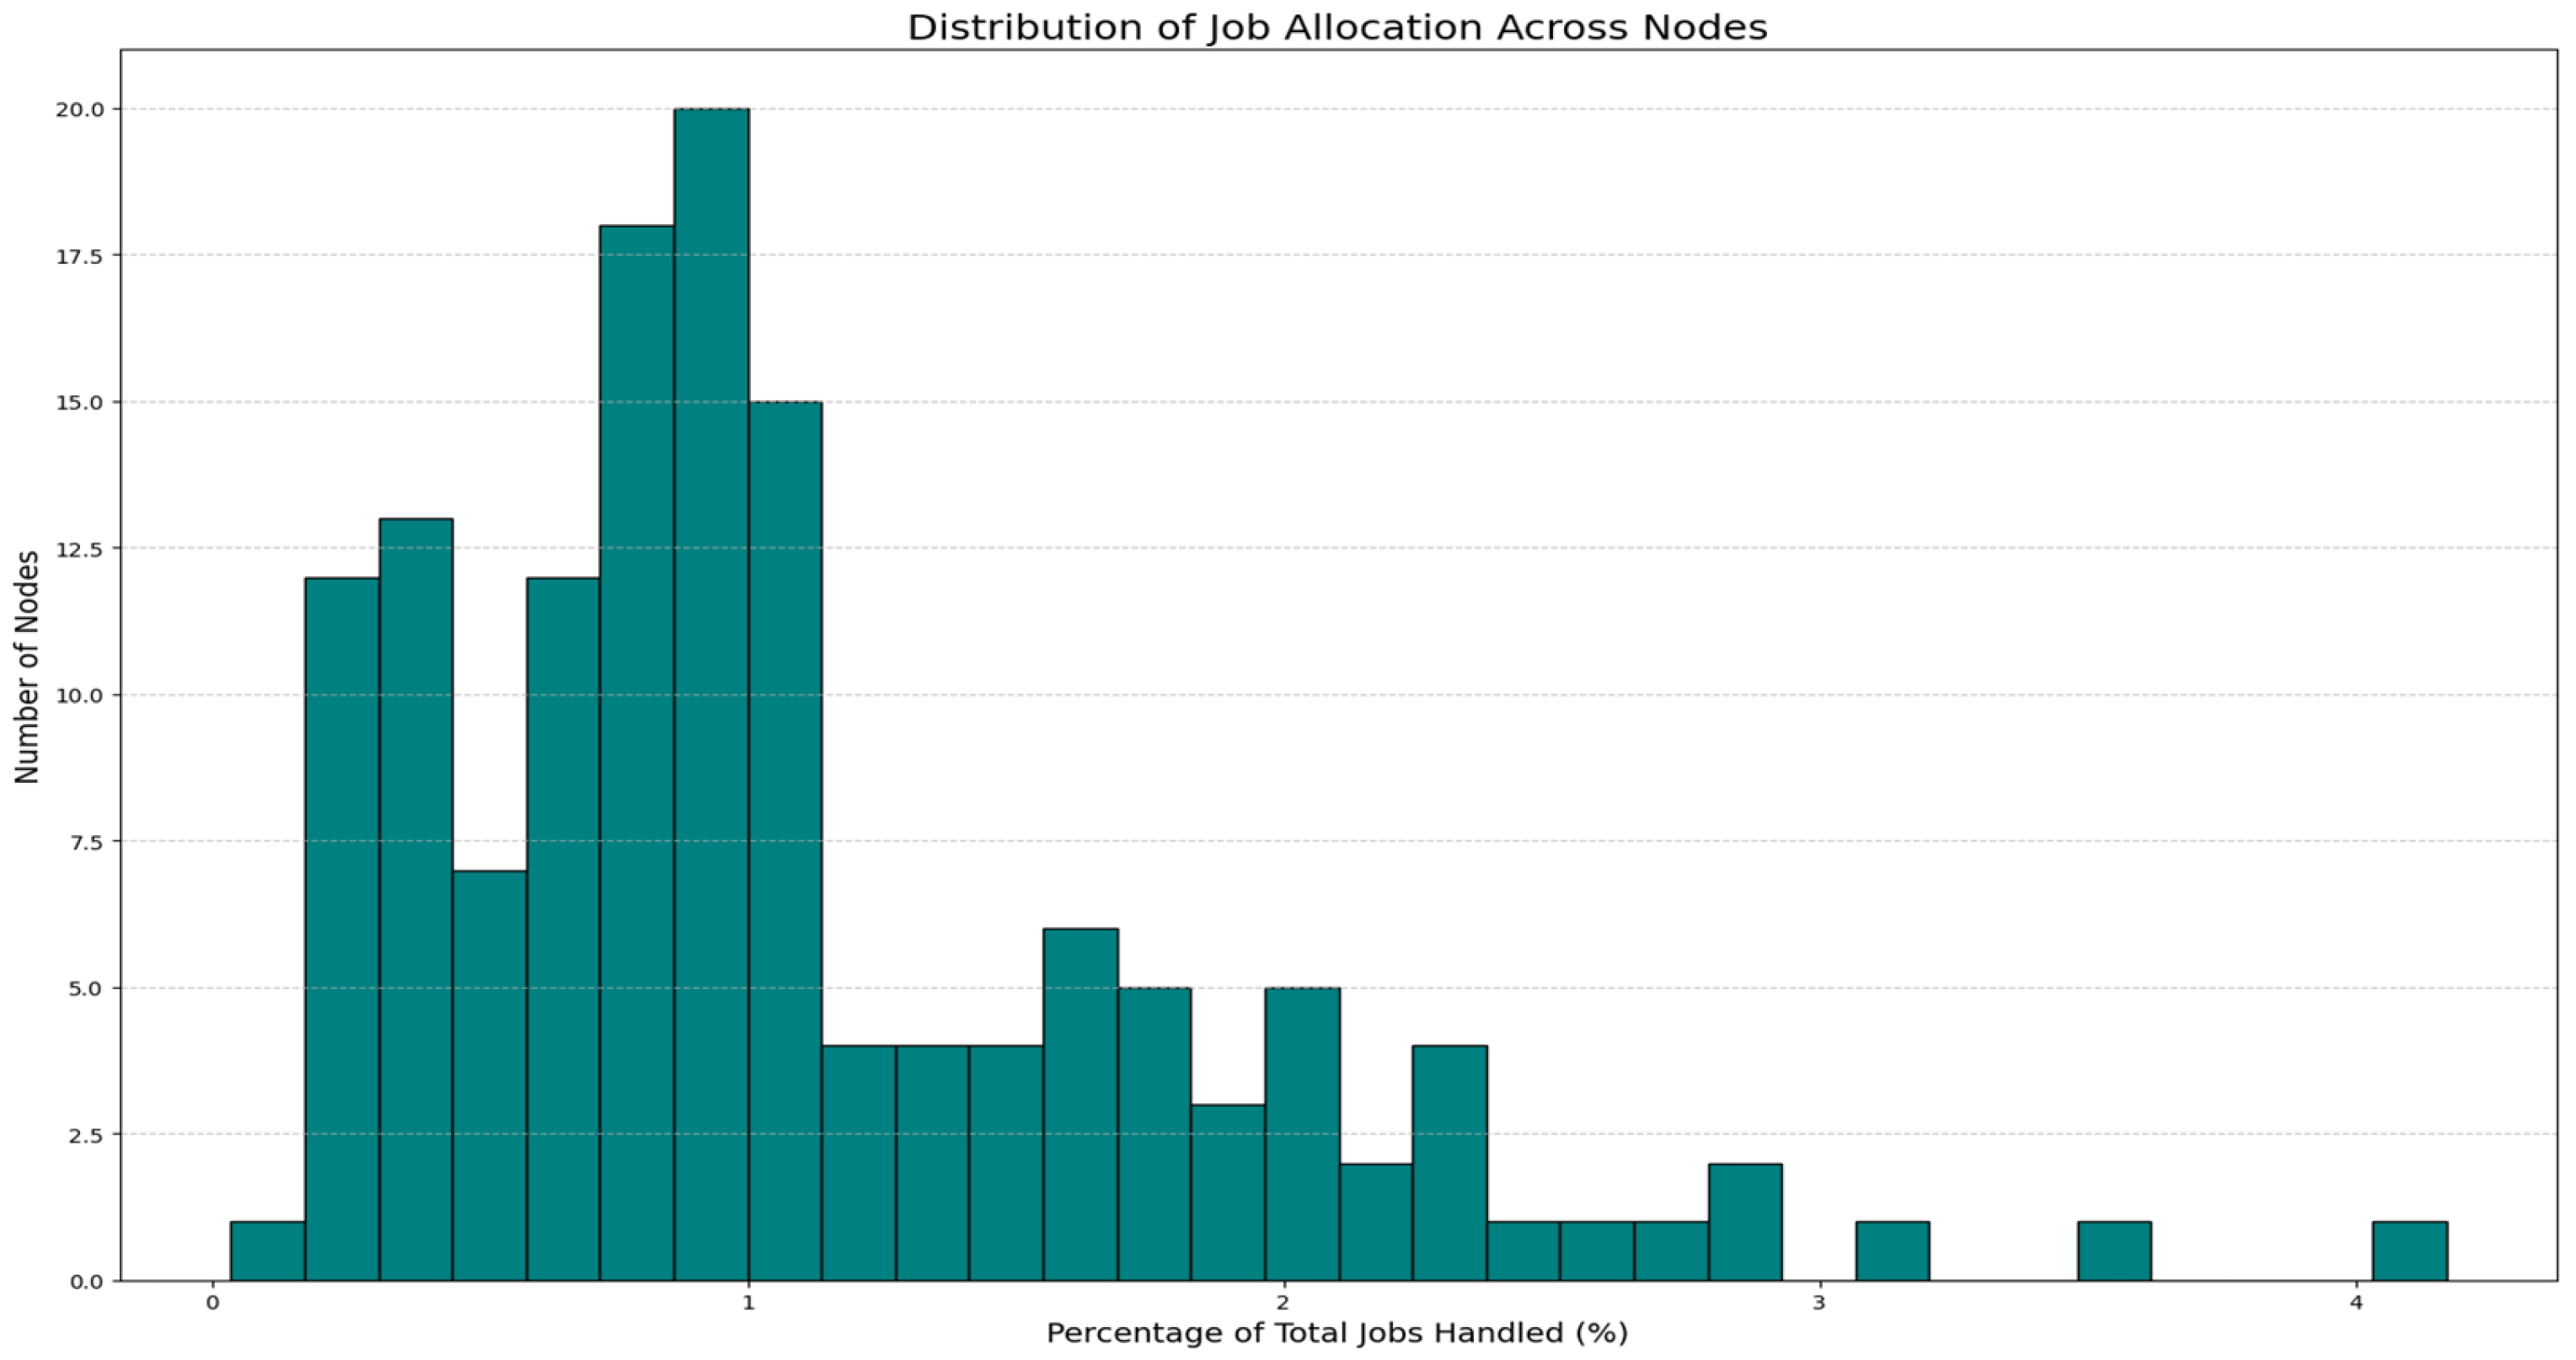
In the first phase, we loaded the entire dataset and conducted a descriptive analysis. This included 12,374,449 rows in the sensor dataset and 40,347 rows in the job’s dataset. We computed statistics for all variables in both datasets. Key observations from the sensor dataset include that CPU temperatures ranged from 50.8 to 80.1 °C, with a mean of 69.5 °C. Thermal loads varied from 18.3 to 25.3 °C, averaging at 22.3 °C. We found that DC energy draws were heavily right-skewed, with 75% of readings below 7.4 Wh, while a small number of readings reached multi-hundred-Wh spikes. Additionally, individual node CPU utilization averaged around 57%, memory utilization was at 14%, and fan speeds varied between 2700 and 18,300 RPM. This detailed view was crucial for our per-node forecasts. In the jobs dataset, we discovered that 2% of jobs were missing end times (either canceled or failed), which we excluded from our analysis. After converting timestamps to date-time format, we calculated job durations (end time minus start time) and found a median runtime of 2 h. The job size distributions revealed that 50% of jobs utilized 1 to 2 nodes, while 10% requested more than 16 nodes, as illustrated in Figure 2.
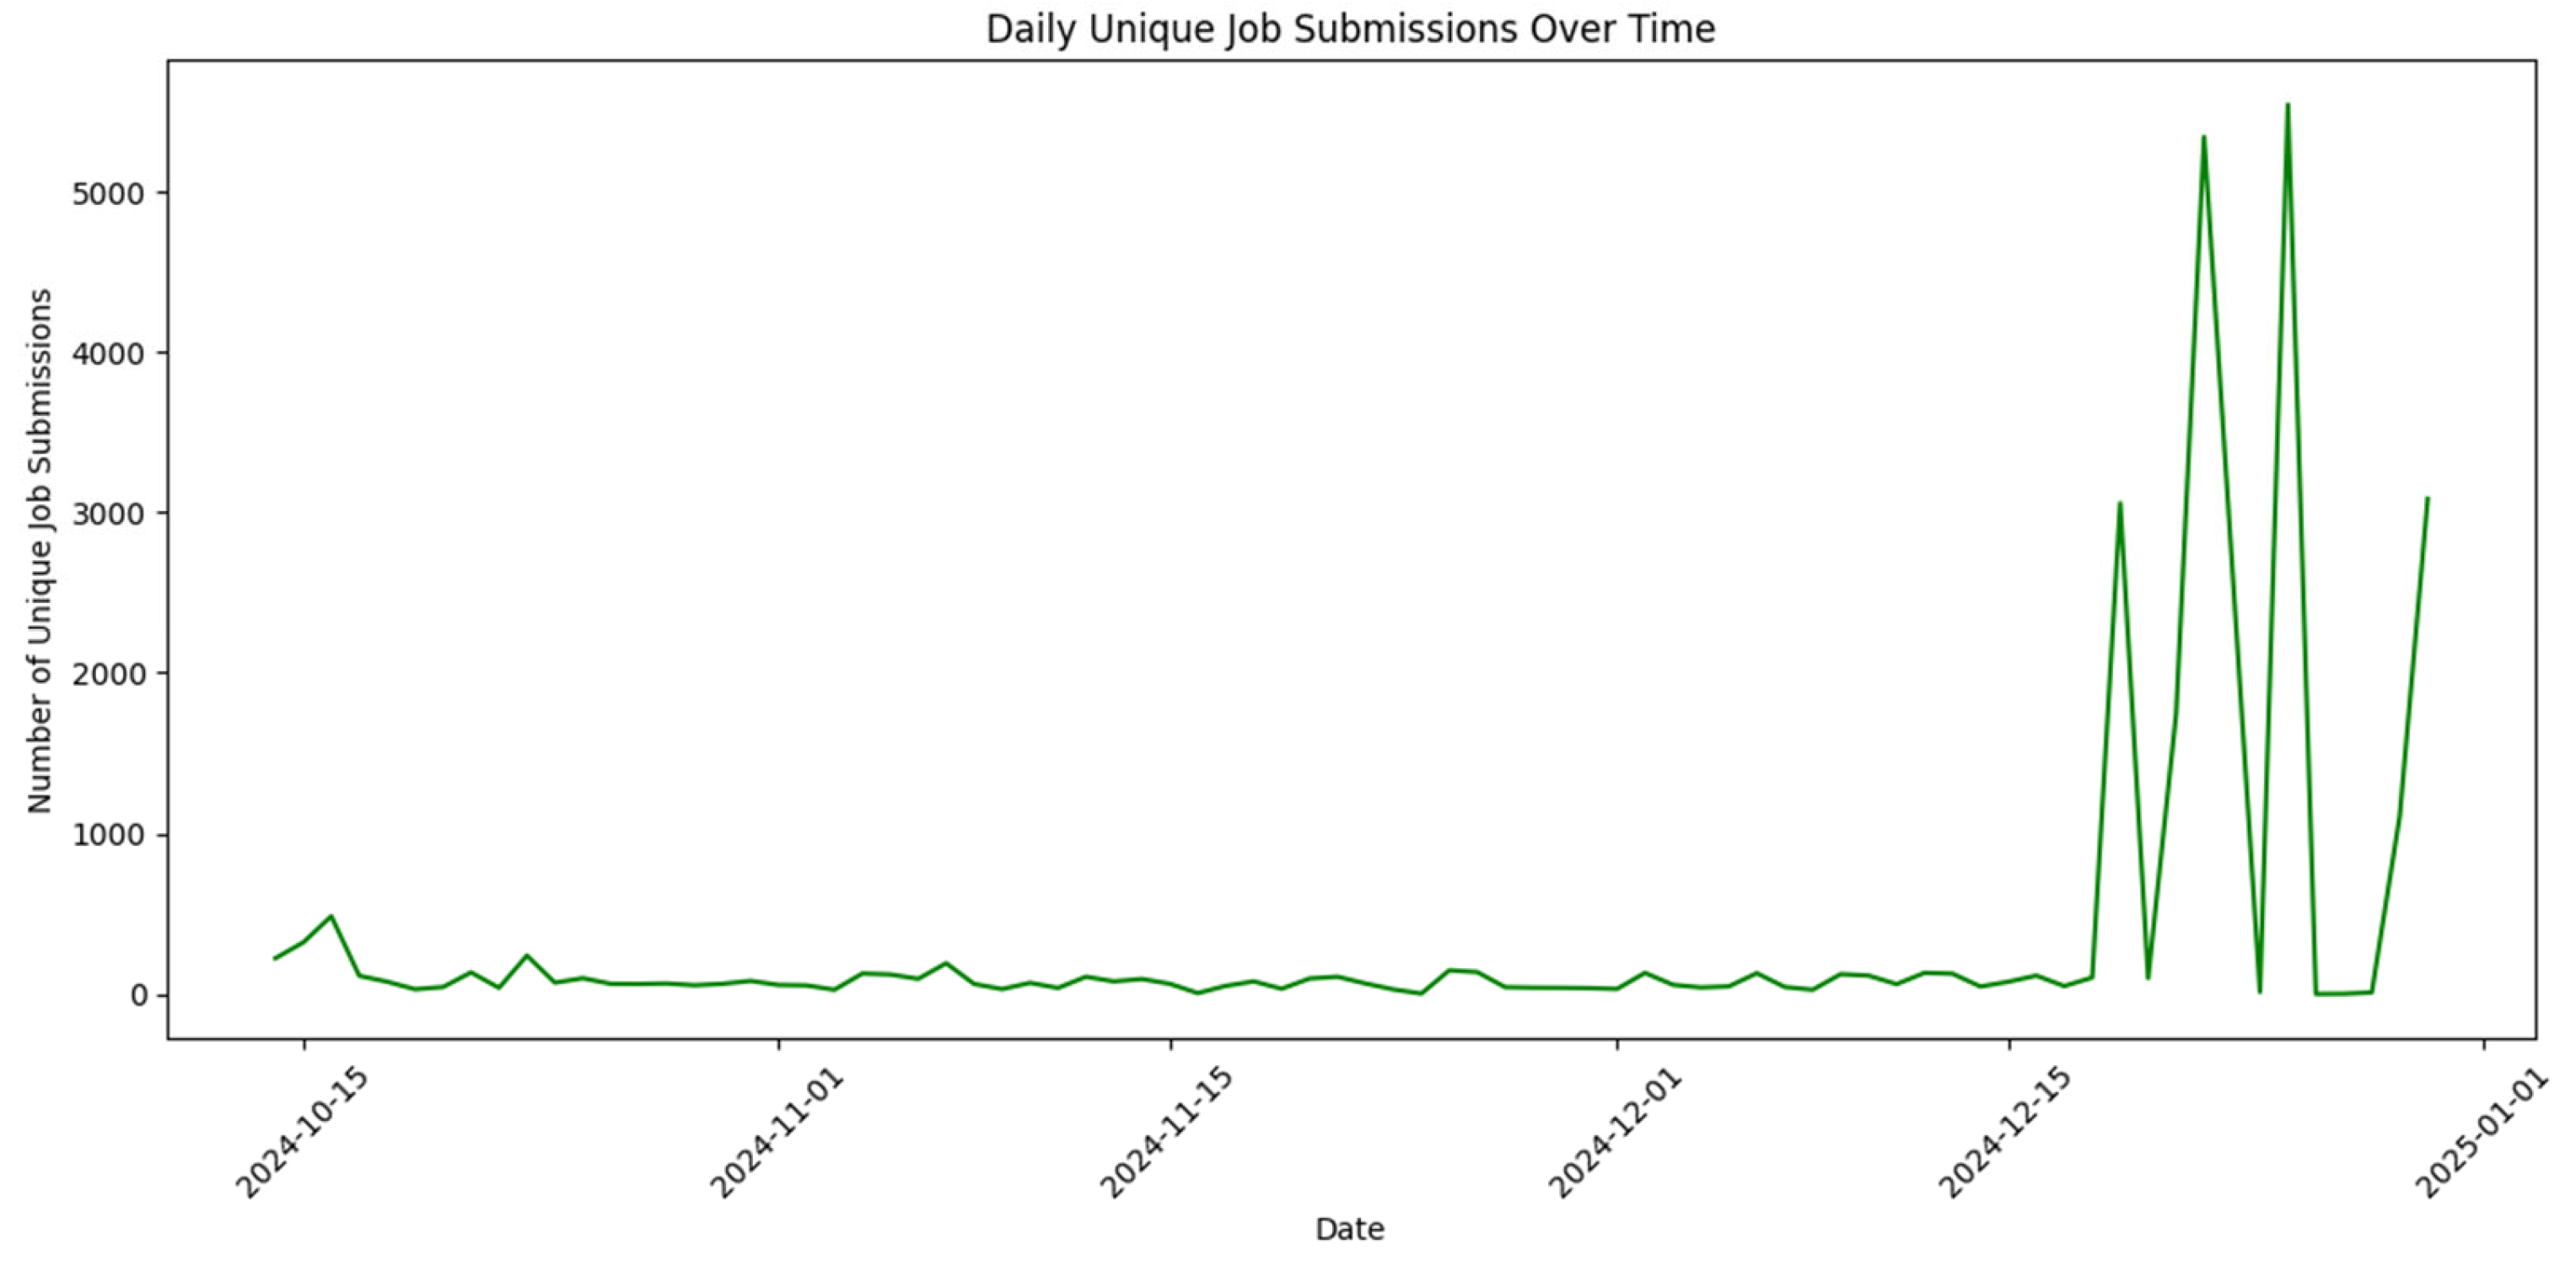
We plotted daily submission counts to analyze the number of jobs per day and to identify weekday peaks. This helped us trace important seasonal patterns that later aligned with sensor load cycles. Additionally, a correlation matrix of job variables revealed a modest positive association (r = 0.45) between the number of nodes requested and the actual wall time. This suggests that larger jobs tend to run longer, although there is substantial variance in the results see Figure 3.
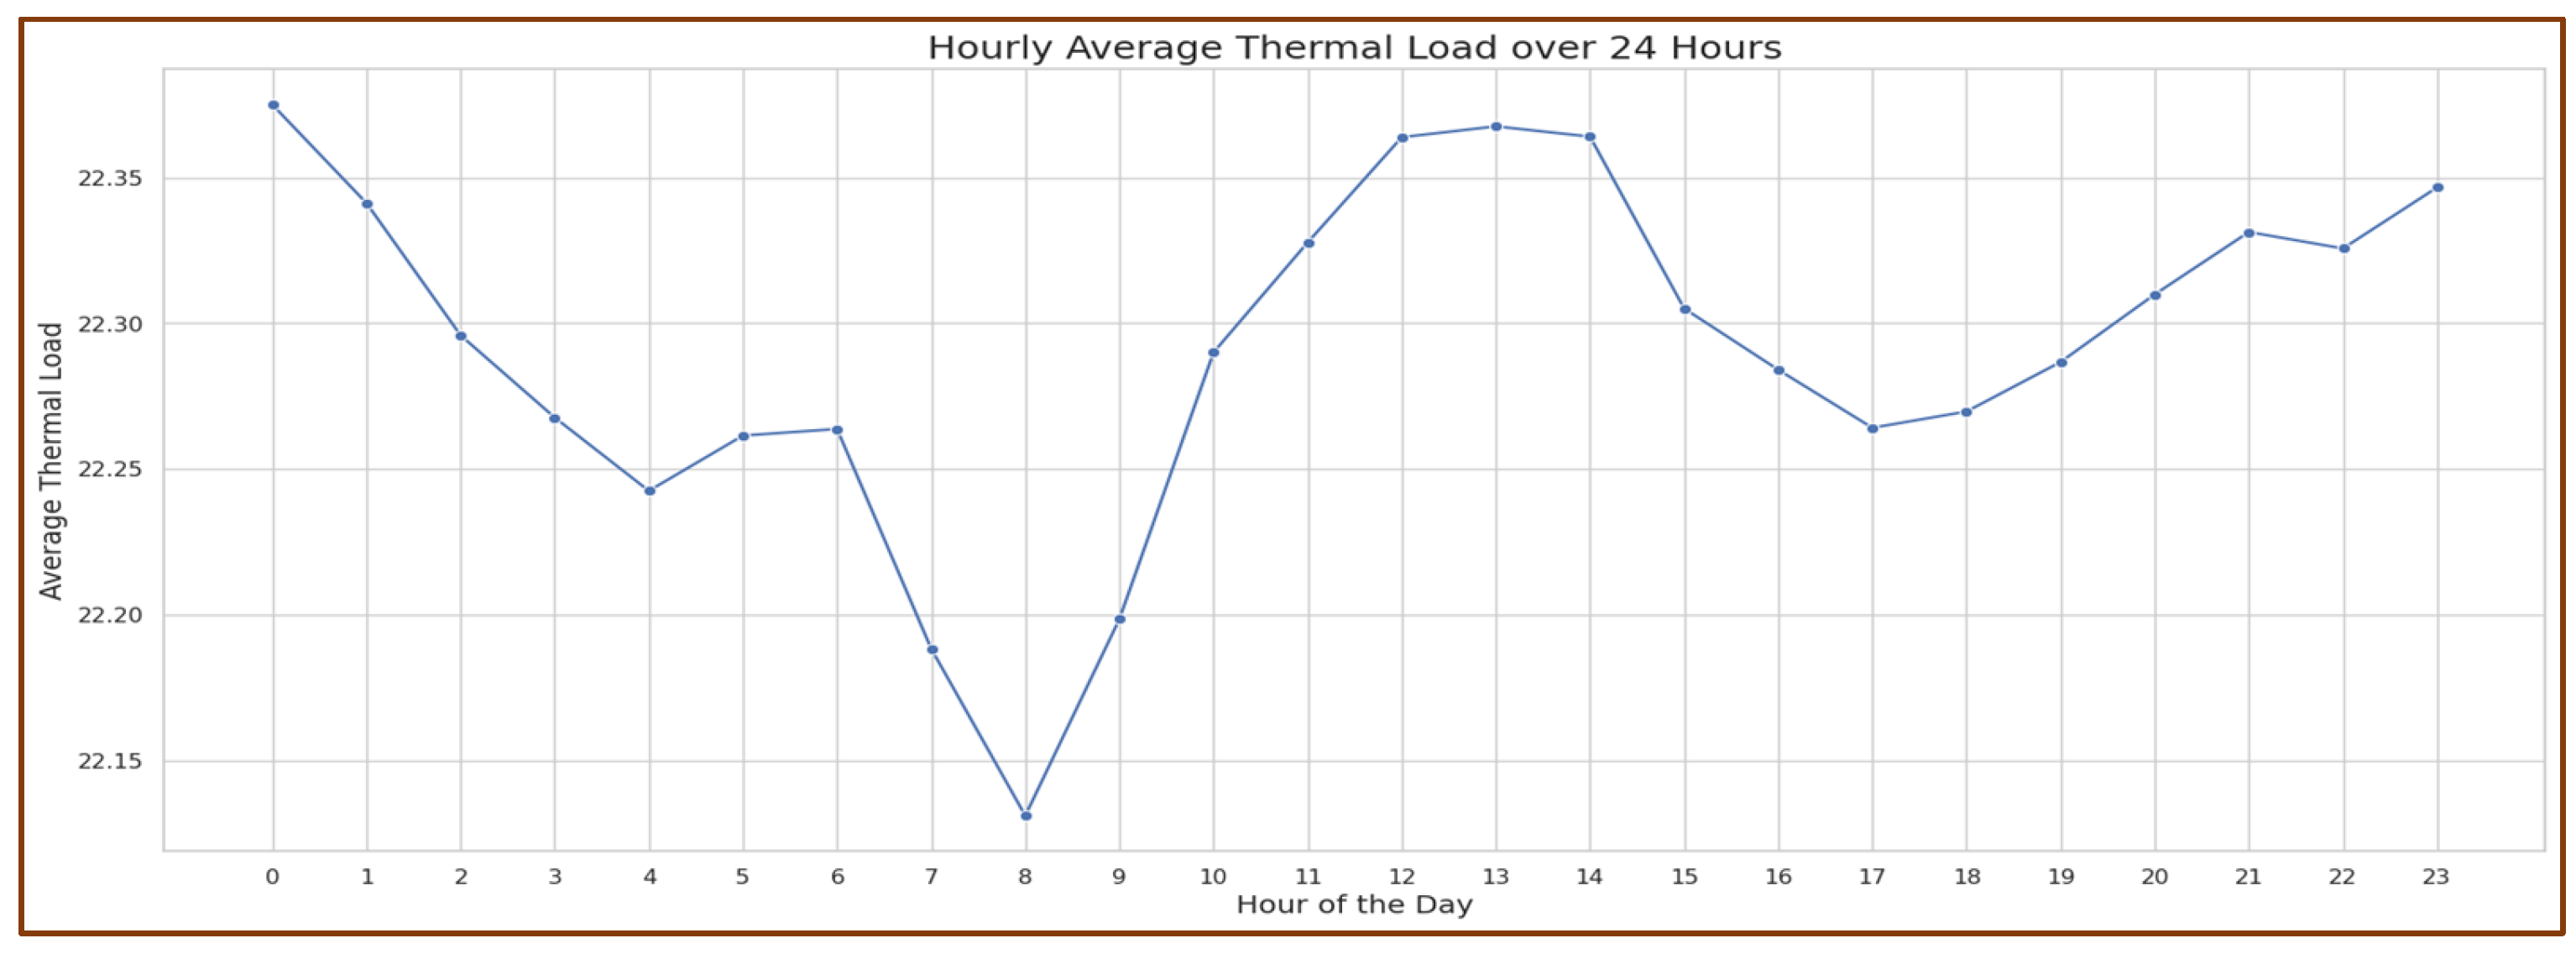
Further analysis of job start times was conducted throughout the day, revealing that certain hours experienced peak usage in terms of job requests compared to others. This trend is illustrated in Figure 4, which shows that thermal utilization is higher during the afternoon hours compared to the morning.
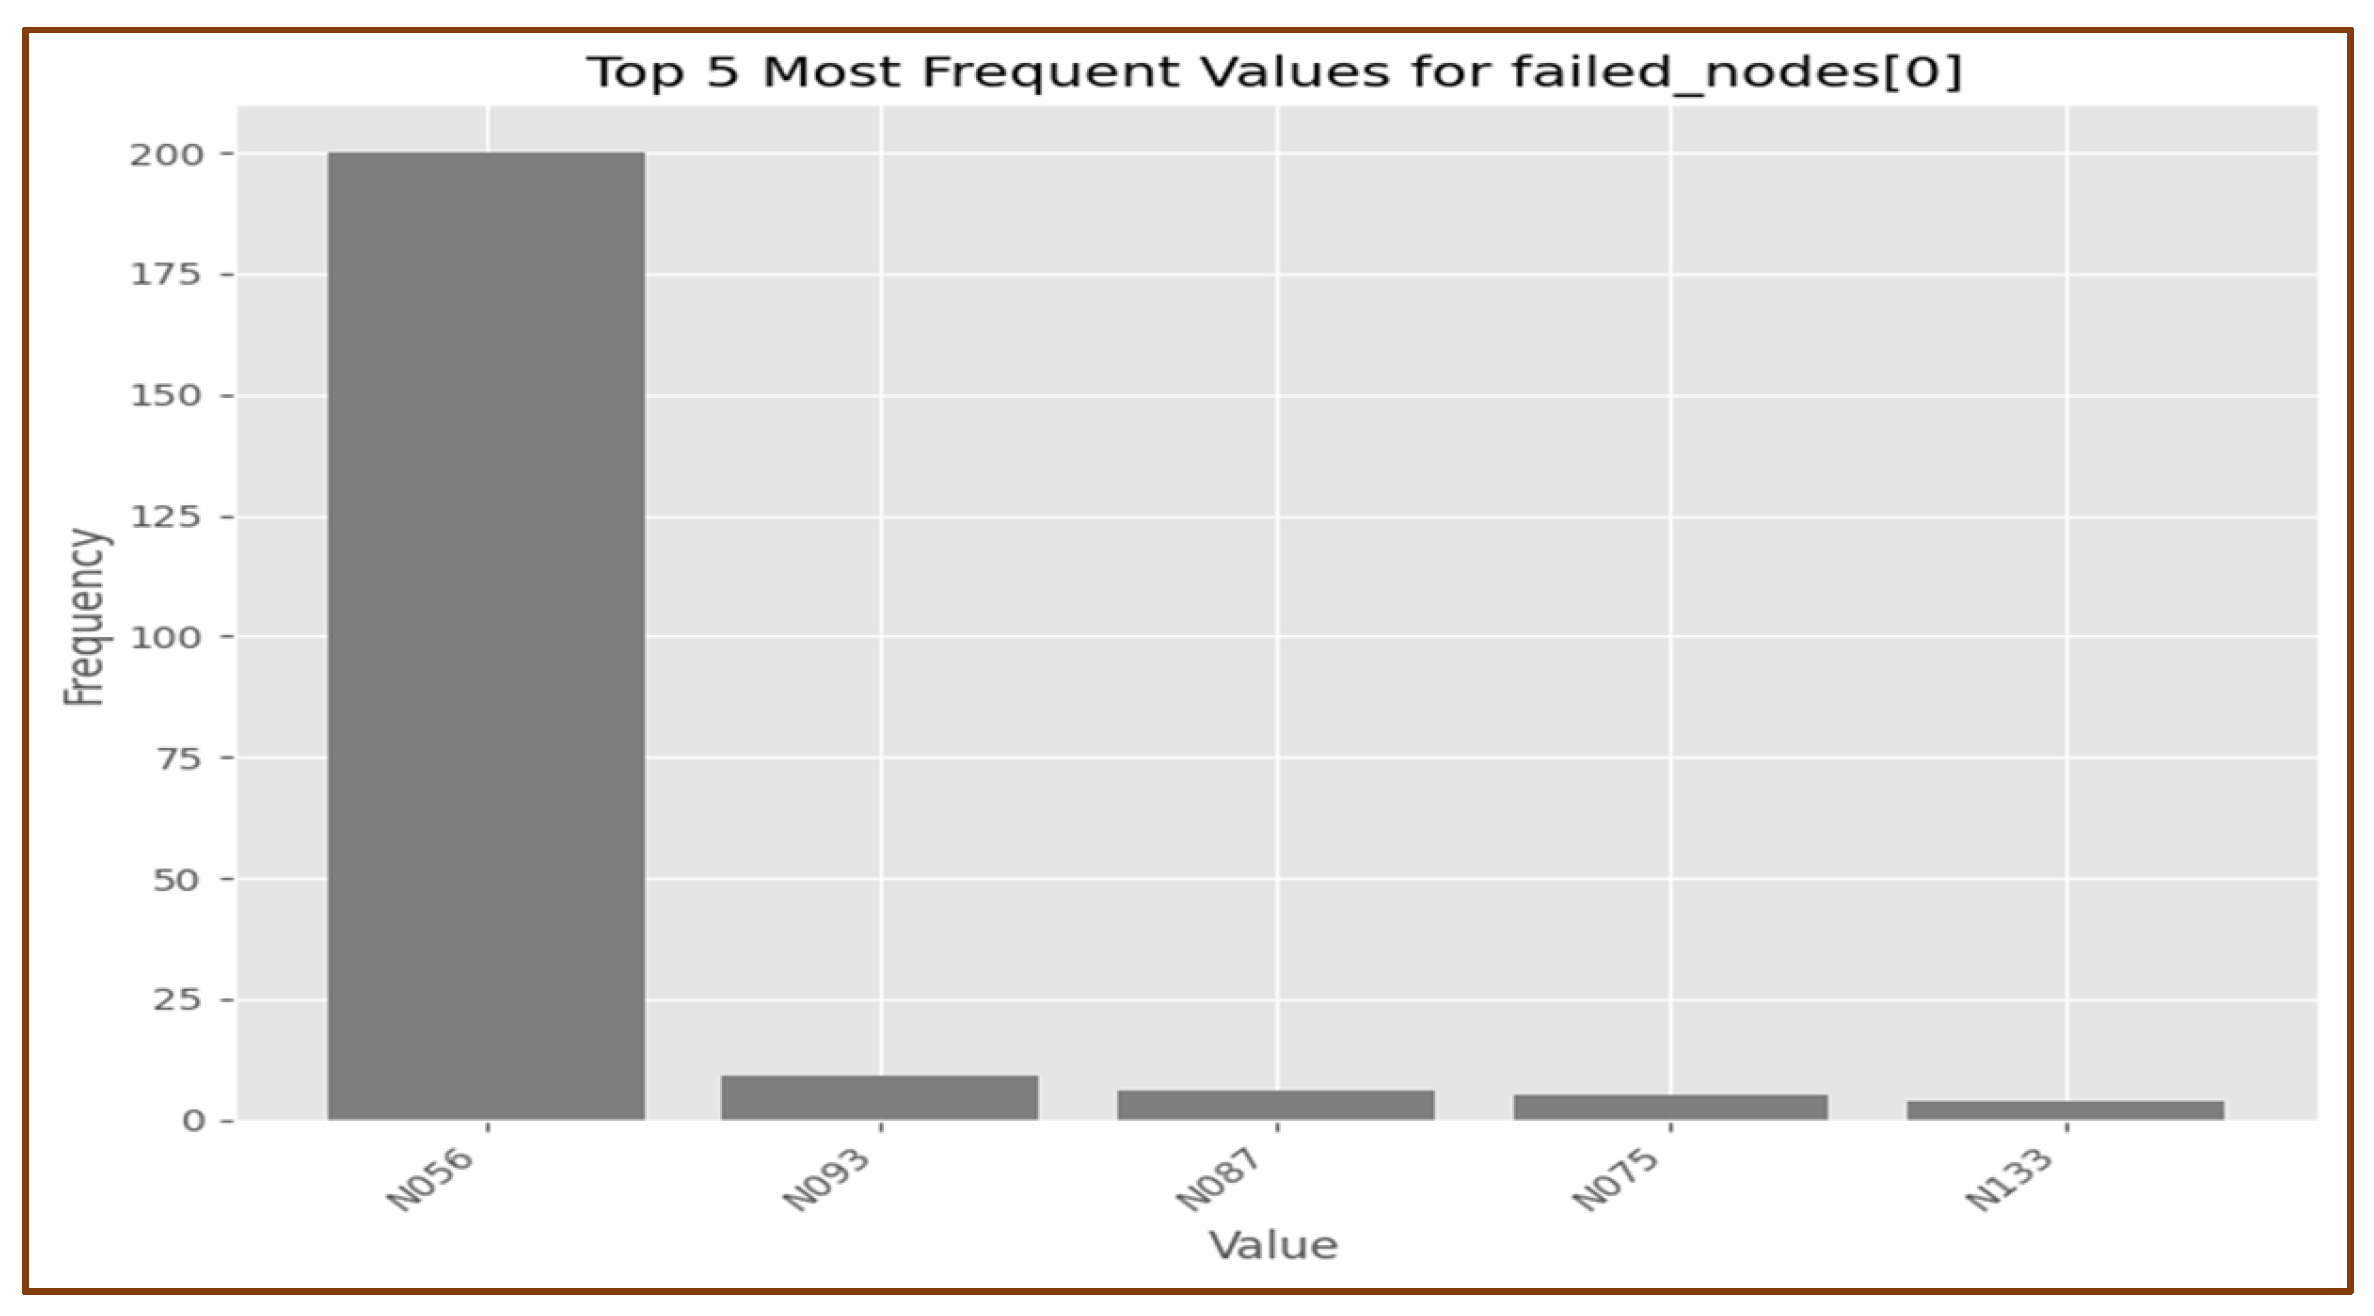
We analyzed the failed nodes, as illustrated in Figure 5. We observed a higher frequency of failure in certain nodes compared to others. This finding was further validated using the available data to evaluate the failure of the specific components. Understanding the impact of these failed nodes was useful for assessing their overall effect on energy requirements. As shown in Figure 5, there was a high frequency of failure of certain nodes as compared to the rest; this was further validated with the rest of the available data to evaluate the failure of the particular component. This was useful for us to understand what effect the failed nodes had in terms of the overall energy requirement.

4.2. Phase 2: Inferential Statistics

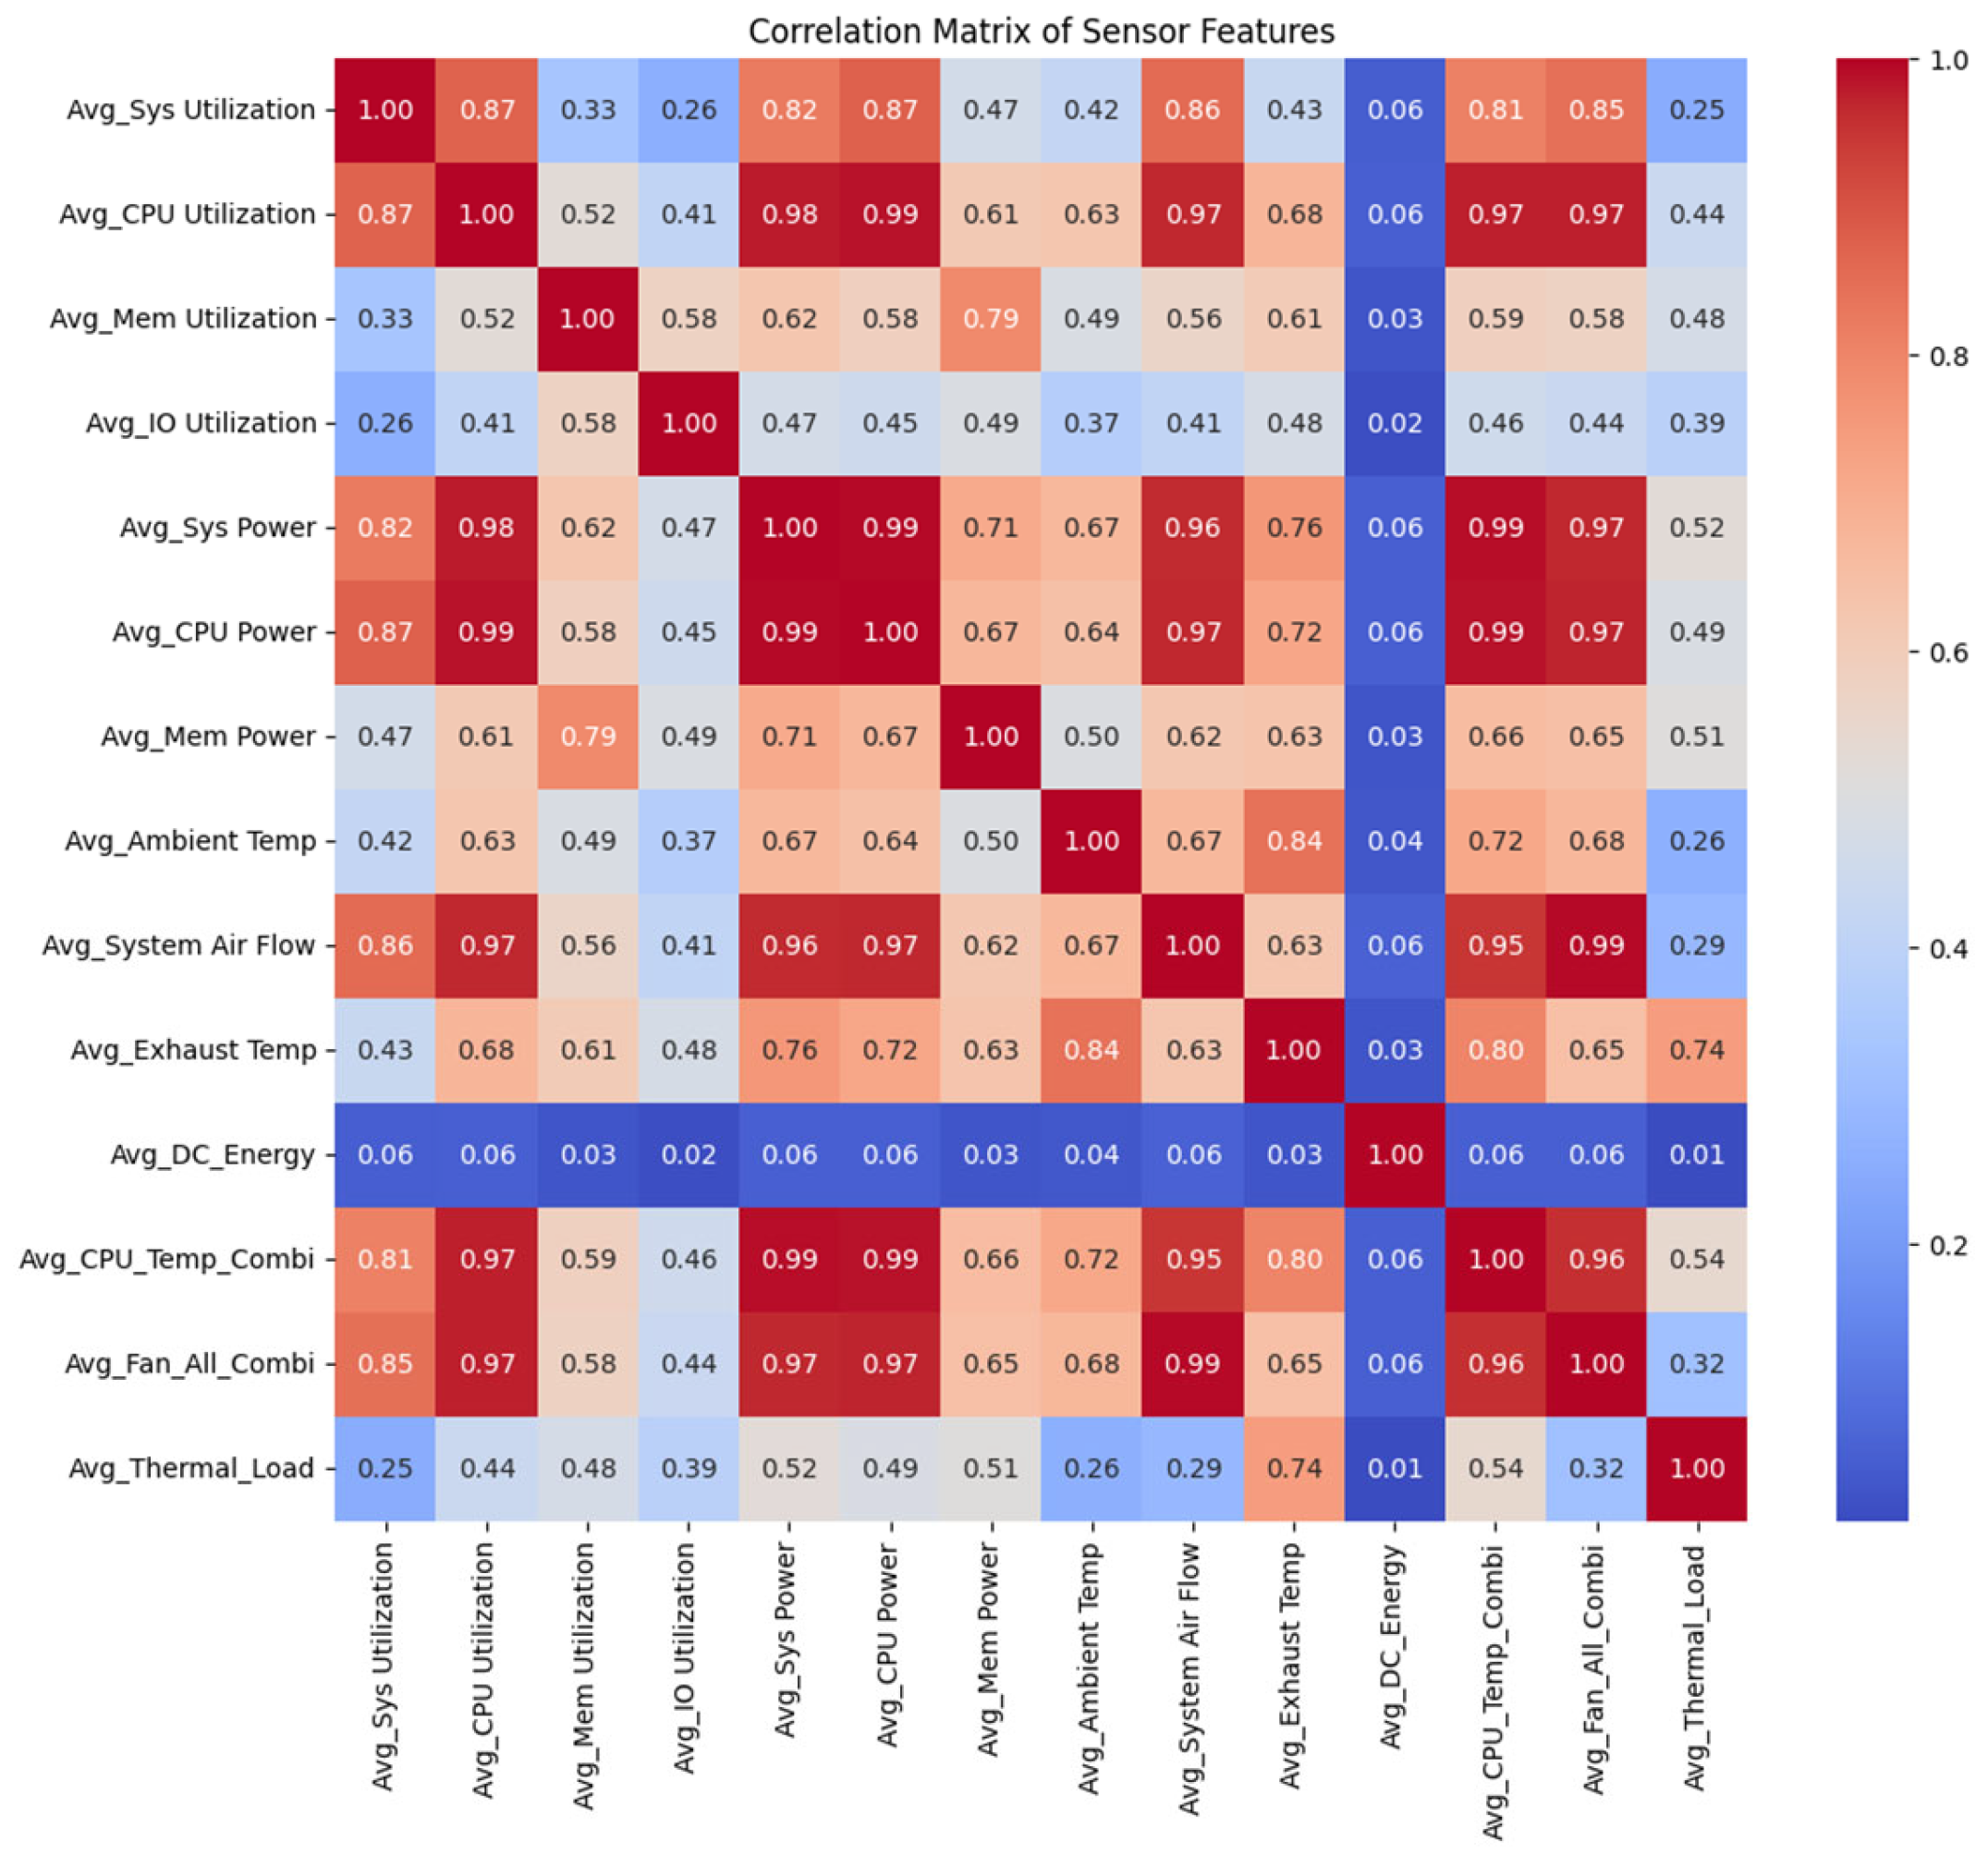
In this stage, we conducted a deeper analysis of the correlations to identify possible links between variables and datasets. Based on Figure 6, we observed some strong correlations; for instance, the average CPU temperature had a correlation with average fan speeds of r = 0.96. This indicates that higher fan speeds contribute to a reduction in CPU temperatures. Additionally, we found a significant correlation between CPU temperature and exhaust temperature, as well as ambient temperature, suggesting that the CPU values depended on the cooling temperatures of the CRESCO7 Cluster. The jobs dataset also revealed strong correlations between variables such as wall time and CPU utilization, indicating that the longer a job takes to execute, the higher the CPU utilization tends to be. Another important correlation was identified between CPU utilization and run time, which showed that during job execution, the CPU was consistently highly utilized across the engaged nodes. To analyze the correlation between the two datasets, we examined the relationship between specific variables. These were used to assess sensor readings from the particular nodes involved in the job over a +five-minute window. However, the combined correlation heatmap did not reveal strong correlations. We speculated that the choice of a five-minute window may be linked to the node scheduling policy in use. As a result, we decided to conduct a more in-depth analysis of the sensors dataset, which demonstrated strong correlations that were useful for building our model.

4.3. Phase 3: Predictive Modeling of Hot Isle Temperature and Cooling Parameters

In this phase, we transformed our cleaned time series data into a structured feature matrix suitable for supervised learning. Starting with 86,153 rows of averaged node data, we created three sets of “lag” features at 1 h, 24 h, and 168 h (one week) for each of our three targets: CPU temperature (Avg CPU Temp Combi), DC energy, and thermal load (Avg Thermal Load). Specifically, we developed a lag feature for CPU temperature that holds the value exactly 24 h prior, along with similar features for energy and load. Additionally, we computed rolling window statistics, including means and standard deviations over the past 3 h, 24 h, and 168 h for each series, while shifting these by one hour to prevent data leakage. We also generated three calendar features—hour of the day, day of the week, and a weekend flag—to capture daily and weekly cycles. After removing any rows with missing values from the shifts and rolling calculations, our final feature table consisted of 33 columns and 85,814 timestamps. Next, we executed an 80%/20% chronological split, using the first 68,651 rows for training and the last 17,163 for testing. This approach preserved the natural time order and avoided any peeking into the future. For each of the three targets, we trained a separate LightGBM Regressor with 200 trees, selected for its efficiency with large tabular data and its ability to handle both numeric and categorical inputs without the need for explicit scaling.
On the hold-out test set, the baseline models achieved the following accuracy metrics after a week of training:
-
CPU temperature: RMSE = 0.50 °C, MAE = 0.28 °C, MAPE = 0.41%
-
DC energy: RMSE = 0.04, MAE = 0.03, MAPE = 1.44%
-
Thermal load: RMSE = 0.26 °C, MAE = 0.18 °C, MAPE = 0.81%
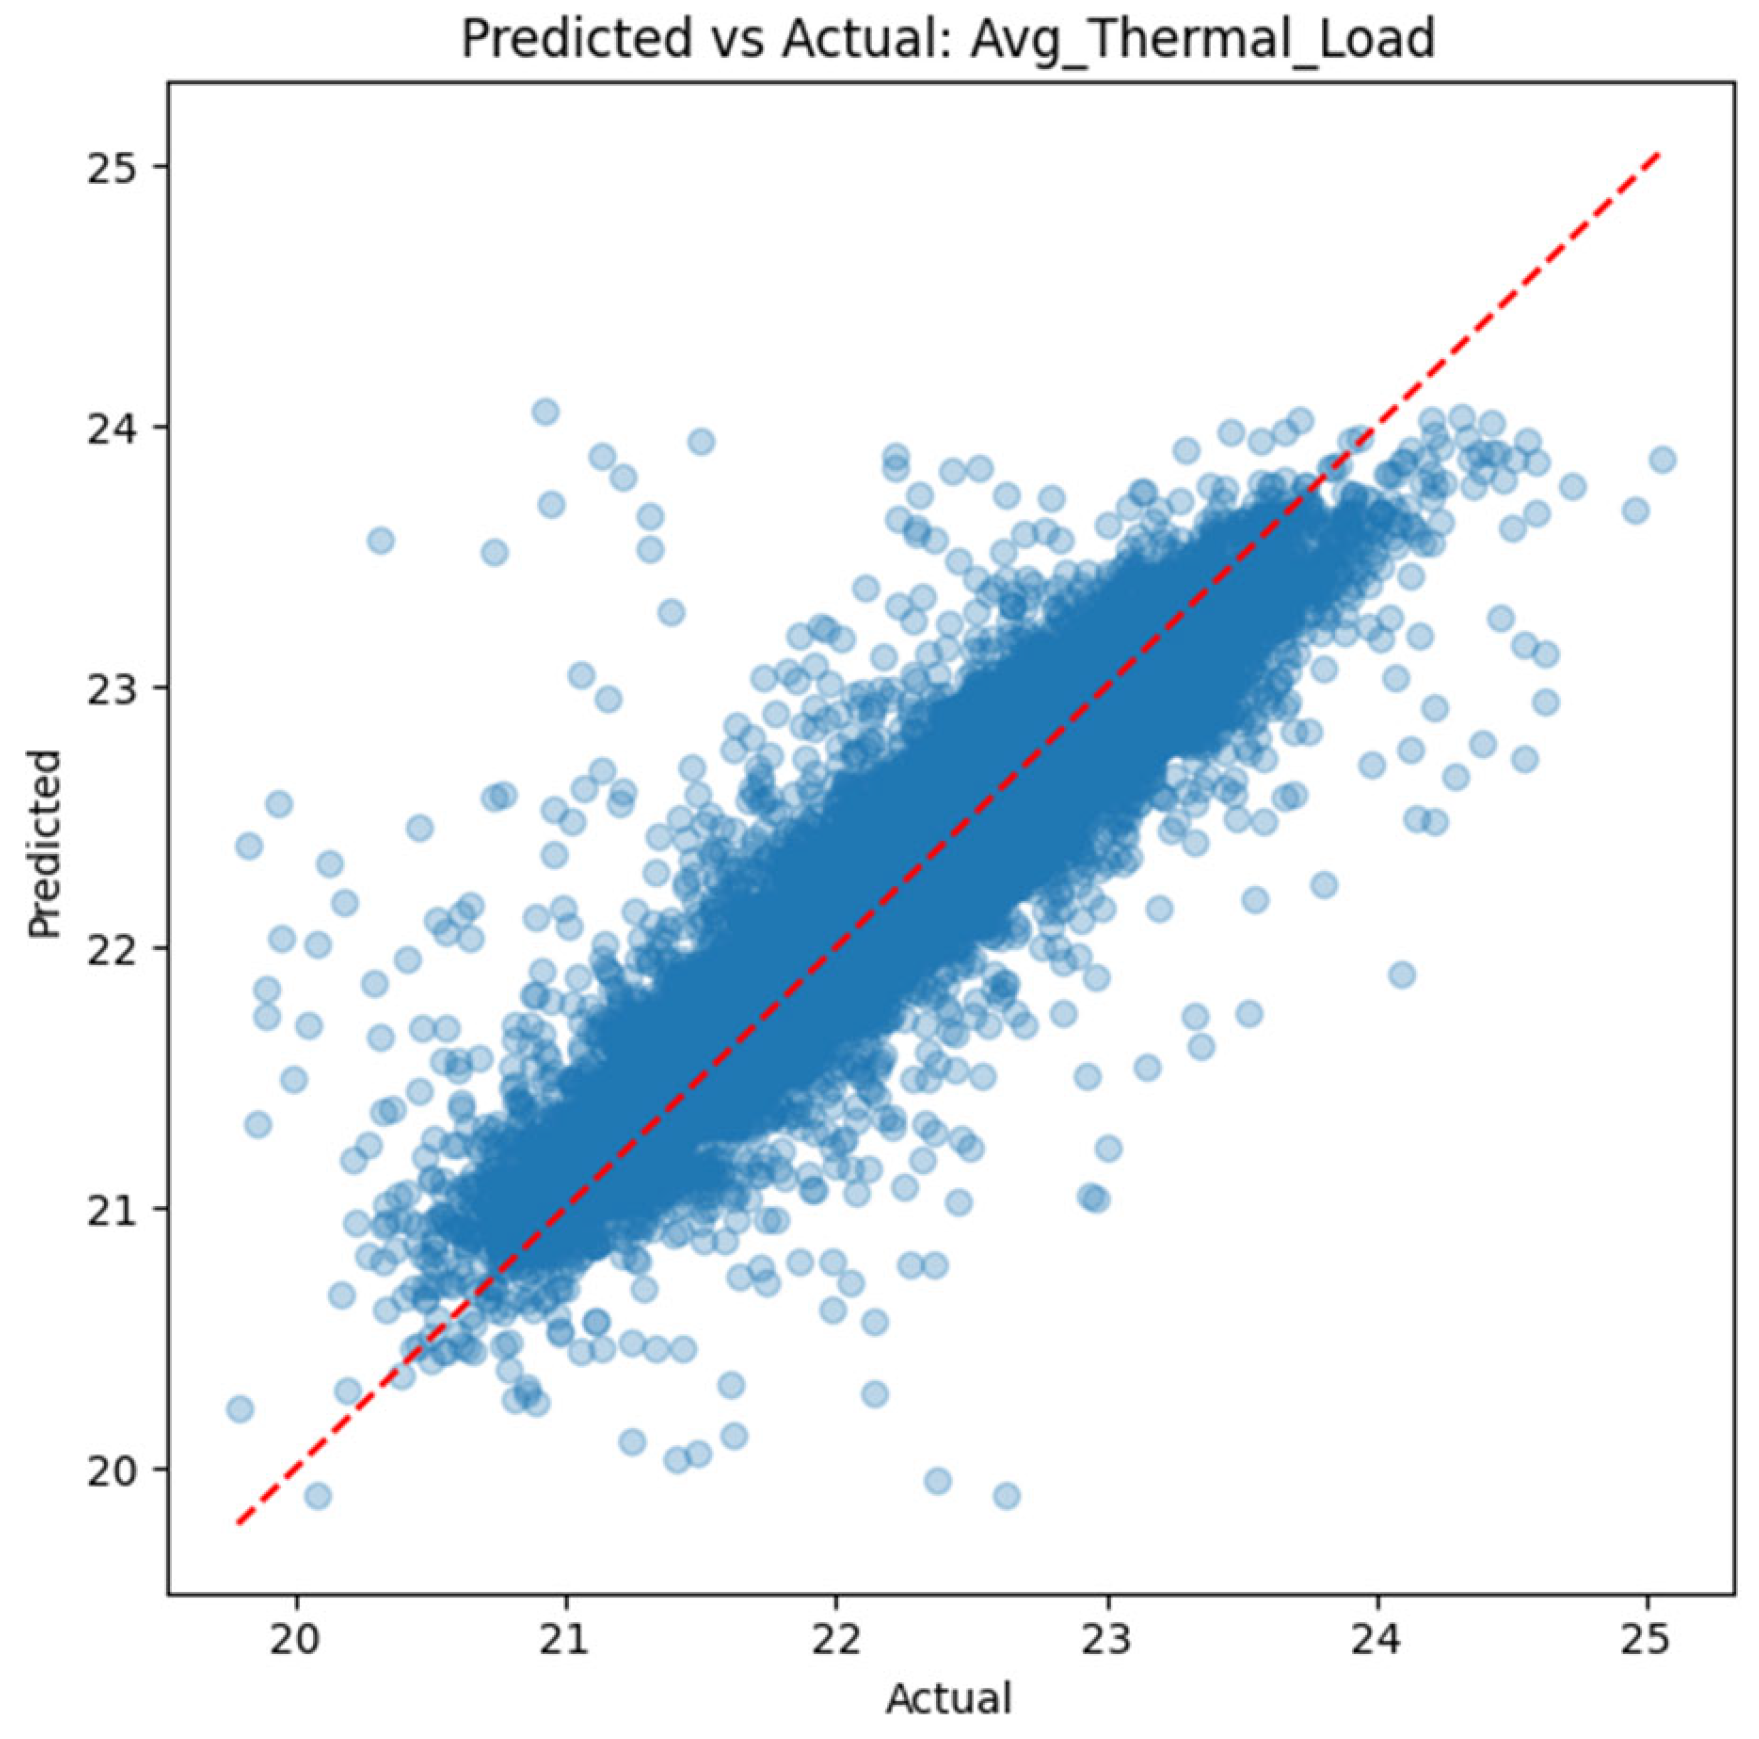
These percentage errors confirmed that a straightforward tree-based model could effectively capture the regular thermal and power dynamics of the cluster. To further enhance the performance of these models, we conducted a randomized hyperparameter search over 30 candidate configurations, tuning parameters such as learning rate (0.01–0.1), tree depth (5–15), leaf count (31–100), and subsampling ratios. We utilized a 3-fold time-series cross-validation approach in which each fold trained on an earlier window and validated on the immediately following period, ensuring the model’s ability to generalize across different temporal segments. After tuning, the MAPE of the DC energy model decreased from 1.44% to 1.36%, and the RMSE for the CPU temperature model slightly improved to 0.497 °C. These modest yet consistent gains highlighted the value of calibrating ensemble parameters without overfitting see Figure 7.
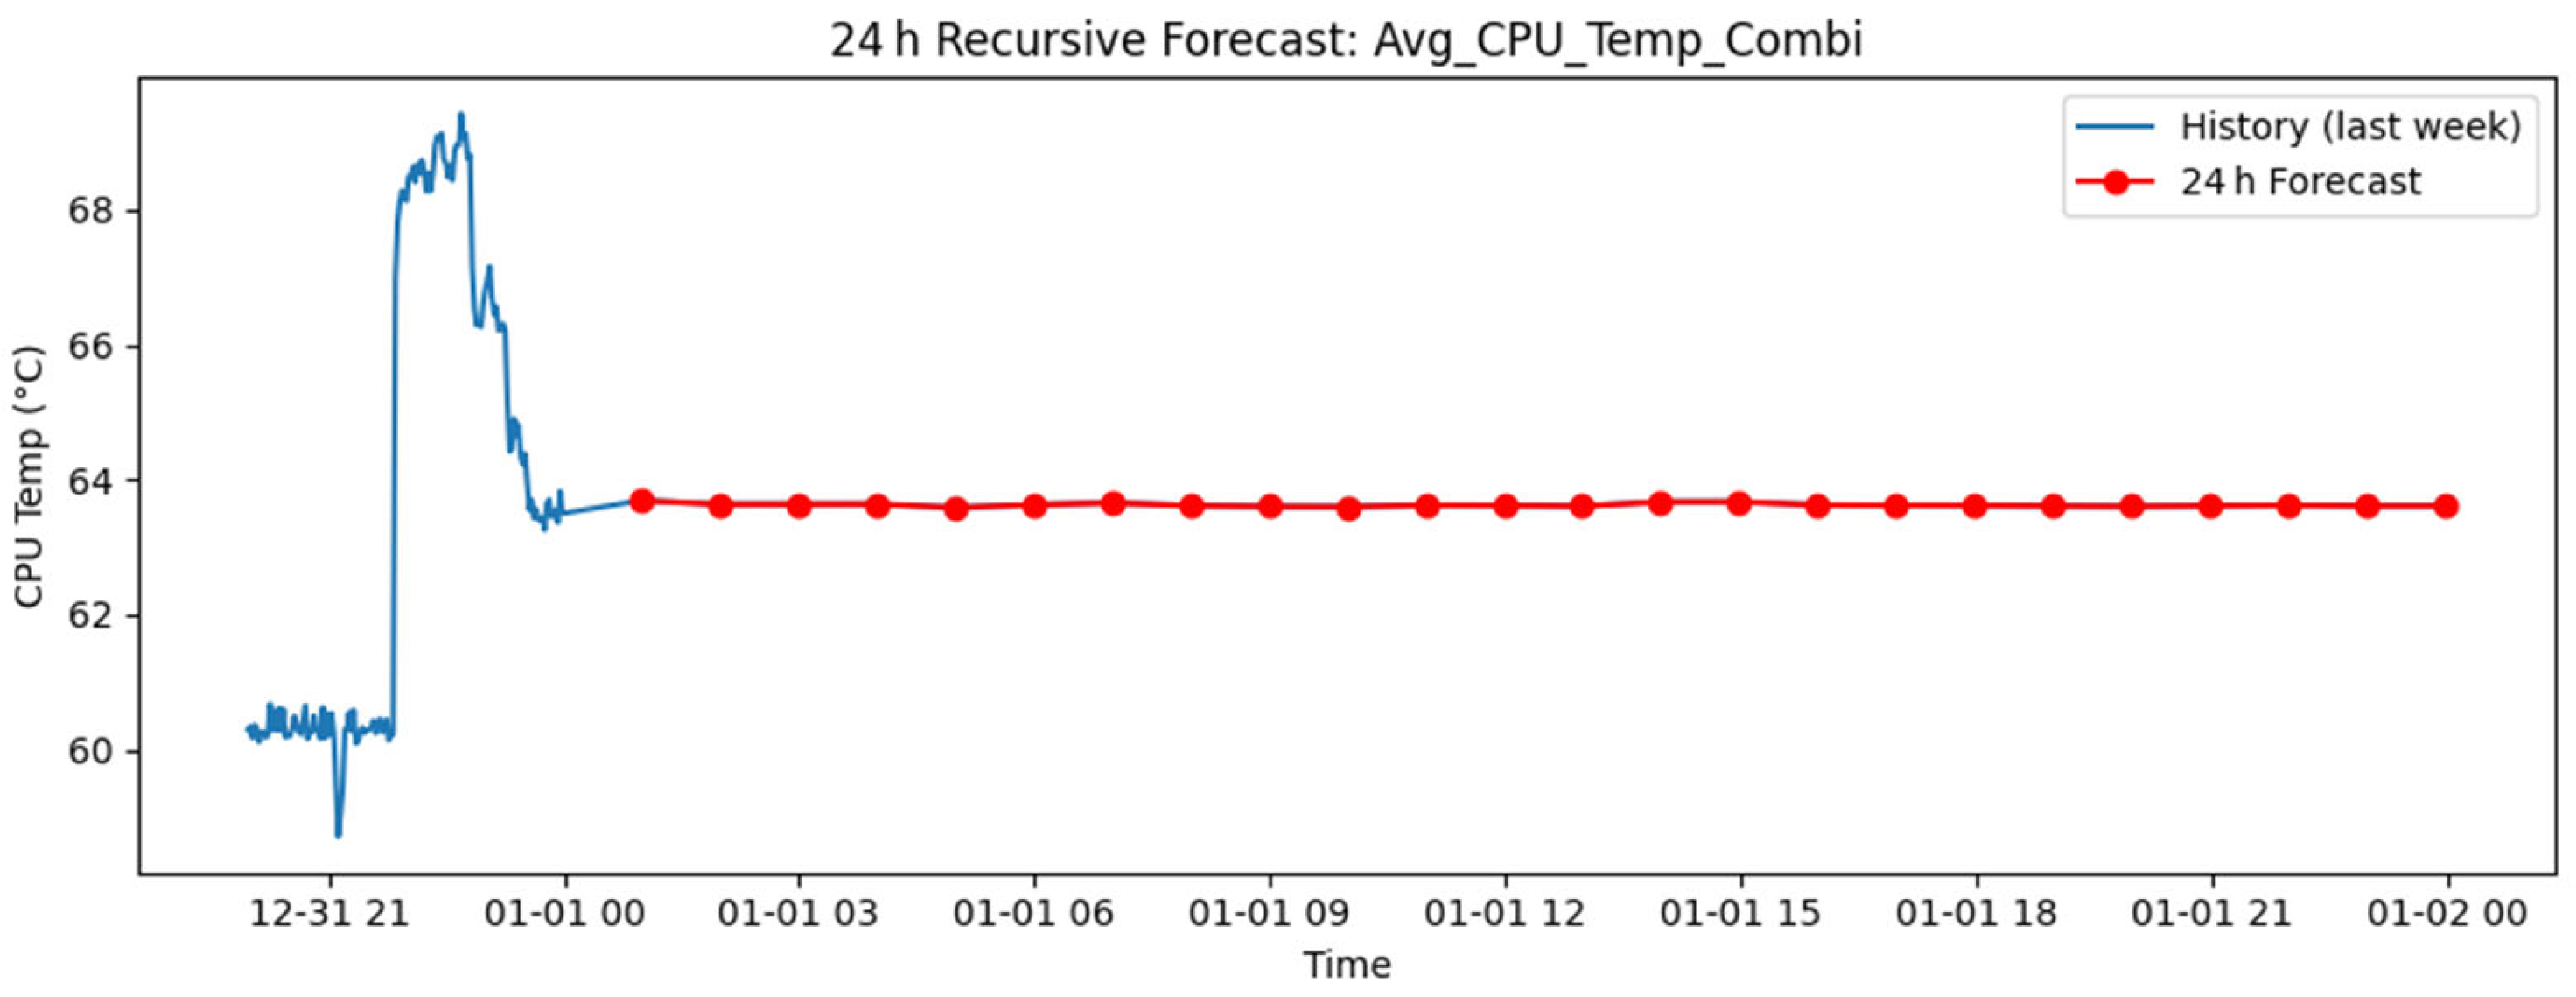
We implemented a recursive multi-step forecasting procedure to project each target up to 336 h ahead, as shown in Figure 8. Starting with the last 168 h of actual data, we continuously built feature vectors to incorporate newly predicted values into the lag and rolling features. We then applied our optimized LightGBM models on an hourly basis. Subsequently, we evaluated the predictions using scatter plots of predicted versus actual values and residual histograms, as illustrated in Figure 6. This analysis confirmed minimal bias and variance, which gives us confidence in both short-term (24-h) and long-term (2-week) predictions for capacity planning and proactive cooling management.

4.4. Phase 4: Building of the Analytical Visualization Dashboard with Modeling

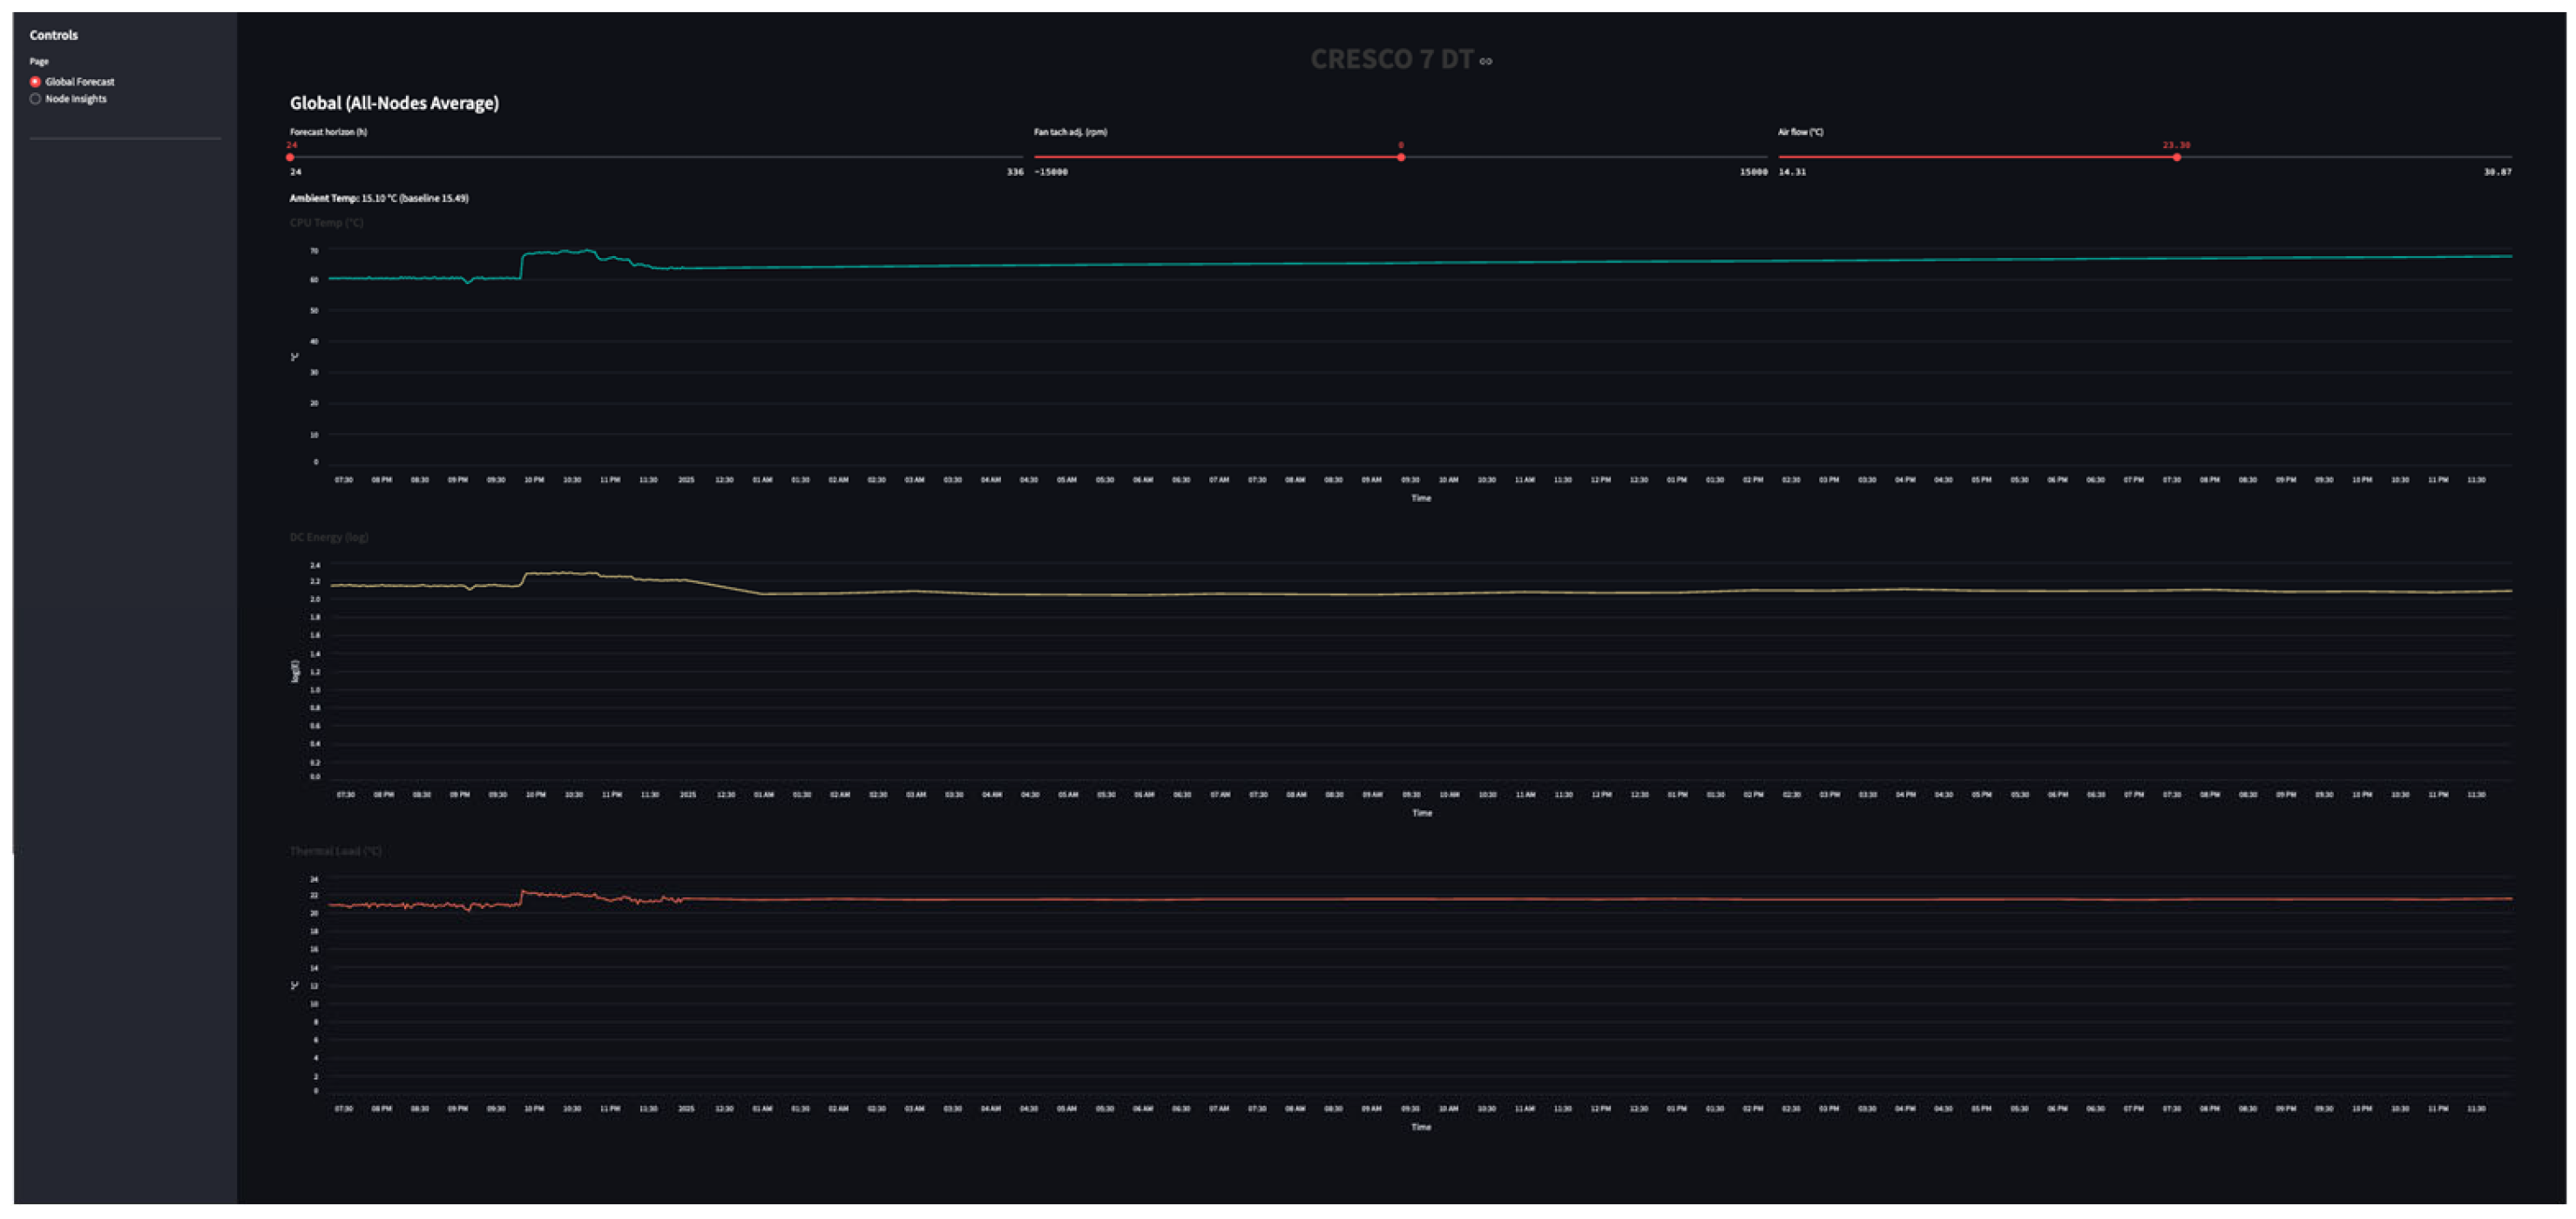
We developed an interactive dashboard using Streamlit to encapsulate our entire forecasting pipeline, transforming numerical predictions into visualizations of the digital twin for the CRESCO-7 cluster. Upon startup, the app loads and caches two datasets: 86,153 timestamps of global averages and 12,374,449 rows of per-node data, along with three tuned LightGBM models. This preloading ensures a quick response to user inputs, typically within 40 s. The Global Forecast view features three Altair line charts displaying CPU temperature, DC energy, and thermal load over the last 168 h of real data, with user-selectable options extending to 336 h. We also included sliders that allow operators to adjust the forecast horizon (24 to 336 h), fan tachometer offset (±15,000 RPM), and supply air temperature (14 to 30 °C). Each change made with the sliders triggers a recursive one-hour ahead loop that rebuilds lag and rolling features, re-predicting all three series. This process is completed quickly, enabling users to perform live “what-if” analyses. (See Figure 9).
The Node Insights page allows users to select from 144 nodes, enabling them to filter historical data specific to the chosen node. It then retrains three node-specific LightGBM models using an 80/20 data split. The page features Altair charts that display the node’s performance over the past 168 h, along with upcoming forecasts, highlighting precise timestamp and value data. Additionally, a Health Score indicator has been integrated into the dashboard. This score condenses five normalized sub-metrics—CPU utilization, memory utilization, thermal load, total power, and average fan speed—into a 0 to 100 index through weighted Min-Max scaling (25% CPU, 10% memory, 30% thermal load, 20% power, and 15% fan speed). The Health Score compares the most recent 12 h window to the preceding 12 h window. A green upward arrow indicates improvement, while a red downward arrow signifies degradation (see Figure 10).
To improve fetch times, the dashboard utilizes Streamlit’s @st. cache data to prevent redundant recomputation, along with Altair’s interactive features for built-in zooming and panning. All charts automatically scale to fit the container width and dynamically adjust their height and axis labels for better readability. By integrating rigorous machine learning forecasting with an intuitive, parameter-adjustable user interface, we created a comprehensive view that reflects both the current state of the cluster and its projected behavior. This fulfills the requirement for an actionable analytical visualization dashboard for the CRESCO7 Cluster.

5. Conclusions and Future Work

To conclude, we conducted a thorough literature review of digital twin frameworks in high-performance computing and modern time series forecasting approaches. This review surveyed possible ways to combine physical sensor data with machine learning models to anticipate thermal and power behavior. Building on these insights, we prepared datasets from the CRESCO7 cluster over the course of four months and performed a descriptive analysis to understand the contribution of each variable. Next, we carried out exploratory and inferential analysis, examining autocorrelations, seasonal patterns, and inter-relationships among temperature, power, and load in the cluster. This allowed us to develop hourly, daily, and weekly lagged and rolling features, as well as calendar indicators. Using this feature set, we trained gradient-boosted tree models (LightGBM) with an 80/20 time-based split. We tuned the hyperparameters through time series cross-validation and observed consistently tight forecast errors across all targets. Finally, we embedded these models in a Streamlit dashboard that embodies the concept of a digital twin. The dashboard features both global and per-node forecast plots, with interactive and real-time controls to test changes in predictions based on varying fan speeds and airflow. Additionally, it displays a composite health score that distills multiple sensor streams into an intuitive indicator for each node, along with carbon emissions at any given point in time. Looking ahead, we recommend expanding beyond single-model trees to include ensemble and deep learning architectures (such as LSTM or transformer-based networks). Although these methods can be time-intensive to train, they should better capture subtle non-linear interactions and provide built-in uncertainty estimates. Further analysis could also focus on job-level optimization for the nodes, including the option to shut down idle nodes. Moreover, we can integrate external data streams, such as weather forecasts, electricity pricing for hourly rates, or workload schedules, which would further enhance forecast accuracy and cost optimization. We could also develop a job scheduling algorithm for CRESCO7 to allocate jobs more evenly across nodes, leading to improved efficiency.
On the dashboard side, we could work on creating a system that automatically adjusts cooling settings or workload placement based on model predictions, enabling fully autonomous energy-efficient operations. Finally, scaling this approach across multiple clusters or an entire data center will test its robustness in diverse environments and pave the way for a unified, enterprise-wide digital twin strategy.

Author Contributions

Conceptualization, M.C. and D.D.C.; methodology, A.C. and K.L.V.; software, K.L.V.; validation, A.C., M.C. and D.D.C.; formal analysis, K.L.V.; investigation, A.C.; resources, D.D.C. and M.C.; data curation, A.C.; writing—original draft preparation, K.L.V. and A.C.; writing—review and editing, M.C.; visualization, D.D.C.; supervision, M.C.; project administration, M.C.; funding acquisition, M.C. All authors have read and agreed to the published version of the manuscript.

Funding

Project ECS 0000024 Rome Technopole, –CUP B83C22002820006, PNRR Mission 4 Component 2 Investment 1.5, funded by the European Union—NextGenerationEU.

Data Availability Statement

Data are contained within the article.

Acknowledgments

Marta Chinnici & Davide De Chiara were supported for this research by Project ECS 0000024 Rome Technopole, - CUP B83C22002820006, National Recovery and Resilience Plan (NRRP), Mission 4, Component 2 Investment 1.5", funded by the European Union – NextGenerationEU.

Conflicts of Interest

Author Davide De Chiara was employed by the company ENEA Portici Research Center. Author Marta Chinnici was employed by the company ENEA Casaccia Research Center. The remaining authors declare that the research was conducted in the absence of any commercial or financial relationships that could be construed as a potential conflict of interest.

References

  1. Galkin, N.; Ruchkin, M.; Vyatkin, V.; Yang, C.-W.; Dubinin, V. Automatic Generation of Data Center Digital Twins for Virtual Commissioning of Their Automation Systems. IEEE Access 2023, 11, 4633–4644. [Google Scholar] [CrossRef]
  2. Avgerinou, M.; Bertoldi, P.; Castellazzi, L. Trends in Data Center Energy Consumption under the European Code of Conduct for Data Center Energy Efficiency. Energies 2017, 10, 1470. [Google Scholar] [CrossRef]
  3. Muller, U.; Strunz, K. Resilience of Data Center Power System: Modelling of Sustained Operation under Outage, Definition of Metrics, and Application. J. Eng. 2019, 2019, 8419–8427. [Google Scholar]
  4. Haghighat, M.; Shoukourian, H.; Bui, H.H.; Karanasos, K.; Sehgal, N. Towards Greener Large-Scale AI Training Systems: Challenges and Design Opportunities. arXiv 2025, arXiv:2503.11011. [Google Scholar]
  5. Chinnici, A.; Ahmadzada, E.; Kor, A.-L.; De Chiara, D.; Domínguez-Díaz, A.; de Marcos Ortega, L.; Chinnici, M. Towards Sustainability and Energy Efficiency Using Data Analytics for HPC Data Center. Electronics 2024, 13, 3542. [Google Scholar] [CrossRef]
  6. Arora, N.K.; Mishra, I. United Nations Sustainable Development Goals 2030 and Environmental Sustainability: Race against Time. Environ. Sustain. 2019, 2, 339–342. [Google Scholar] [CrossRef]
  7. Berezovskaya, Y.; Yang, C.-W.; Mousavi, A.; Vyatkin, V.; Minde, T.B. Modular Model of a Data Center as a Tool for Improving Its Energy Efficiency. IEEE Access 2020, 8, 46559–46573. [Google Scholar] [CrossRef]
  8. Statista (2024). Amount of Data Created Daily (2025). Statista. Available online: https://www.google.com/url?sa=t&source=web&rct=j&opi=89978449&url=https://explodingtopics.com/blog/data-generated-per-day&ved=2ahUKEwiXh4e8zvqOAxU58bsIHV9RAzsQFnoECBcQAQ&usg=AOvVaw0R3Nt9FgoT13KUejjHnmtc (accessed on 24 July 2025).
  9. Safari, A.; Sorouri, H.; Rahimi, A.; Oshnoei, A. A Systematic Review of Energy Efficiency Metrics for Optimizing Cloud Data Center Operations and Management. Electronics 2025, 14, 2214. [Google Scholar] [CrossRef]
  10. Koronen, C.; Åhman, M.; Nilsson, L.J. Data Centers in Future European Energy Systems—Energy Efficiency, Integration and Policy. Energy Effic. 2019, 13, 129–144. [Google Scholar] [CrossRef]
  11. Ganapathy, S.; Rajendran, P.; Yuvaraj, S.; Rufus, H.A.N.; Chaithanya, T.R.; Solanki, R.S. Computational Engineering-based Approach on Artificial Intelligence and Machine Learning-Driven Robust Data Center for Safe Management. J. Mach. Comput. 2023, 3, 465–474. [Google Scholar]
  12. Hossain, A.; Abdurahman, A.; Islam, M.A.; Ahmed, K. Power-Aware Scheduling for Multi-Center HPC Electricity Cost Optimization. arXiv 2025, arXiv:2503.11011v1. [Google Scholar]
  13. Christensen, J.D.; Therkelsen, J.; Georgiev, I.; Sand, H. Data Center Opportunities in the Nordics. Nordic Council of Ministers. 2018. Available online: https://www.norden.org/en/publication/data-centre-opportunities-nordics (accessed on 24 July 2025).
  14. Nur, M.M.; Kettani, H. Challenges in Protecting Data for Modern Enterprises. J. Econ. Bus. Manag. 2020, 8, 67–73. [Google Scholar] [CrossRef]
  15. Hamann, H.; Klein, L. A Measurement Management Technology for Improving Energy Efficiency in Data Centers and Telecommunication Facilities; Office of Scientific and Technical Information (OSTI), U.S. Department of Energy: Oak Ridge, TN, USA, 2012. [Google Scholar]
  16. Kim, J.H.; Shin, D.U.; Kim, H. Data Center Energy Evaluation Tool Development and Analysis of Power Usage Effectiveness with Different Economizer Types in Various Climate Zones. Buildings 2024, 14, 299. [Google Scholar] [CrossRef]
  17. Agonafer, D.; Bansode, P.; Saini, S.; Gullbrand, J.; Gupta, A. Single Phase Immersion Cooling for Hyper Scale Data Centers: Challenges and Opportunities. In Proceedings of the ASME Heat Transfer Summer Conference (HT2023), Washington, DC, USA, 10–12 July 2023. [Google Scholar]
  18. Jia, D.; Lv, X.; Guo, T.; Xu, C.; Liu, C. Design of a New Integrated Air-Water Cooling Method to Improve Energy Use in Data Centers. In Proceedings of the 6th International Conference on Energy Systems and Electrical Power (ICESEP), Wuhan, China, 21–23 June 2024; pp. 214–217. [Google Scholar]
  19. Heydari, A.; Eslami, B.; Chowdhury, U.; Radmard, V.; Shahi, P.; Miyamura, H.; Tradat, M.; Chen, P.; Tuholski, D.; Gray, K.; et al. A Comparative Data Center Energy Efficiency and TCO Analysis for Different Cooling Technologies. In Proceedings of the ASME International Technical Conference and Exhibition on Packaging and Integration of Electronic and Photonic Microsystems (InterPACK2023), San Diego, CA, USA, 24–26 October 2023. [Google Scholar]
  20. Gao, T.; Kumar, E.; Sahini, M.; Ingalz, C.; Heydari, A.; Lu, W.; Sun, X. Innovative Server Rack Design with Bottom Located Cooling Unit. In Proceedings of the IEEE Intersociety Conference on Thermal and Thermomechanical Phenomena in Electronic Systems (ITherm), Las Vegas, NV, USA, 31 May–3 June 2016; pp. 1172–1181. [Google Scholar]
  21. Chen, H.; Li, D.; Wang, S.; Chen, T.; Zhong, M.; Ding, Y.; Li, Y.; Huo, X. Numerical Investigation of Thermal Performance with Adaptive Terminal Devices for Cold Aisle Containment in Data Centers. Buildings 2023, 13, 268. [Google Scholar] [CrossRef]
  22. Haghshenas, K.; Setz, B.; Blosch, Y.; Aiello, M. Enough hot air: The role of immersion cooling. Energy Inform. 2023, 6, 14. [Google Scholar] [CrossRef]
  23. Fouquet, F.; Hartmann, T.; Cecchinel, C.; Combemale, B. GreyCat: A Framework to Develop Digital Twins at Large Scale. In Proceedings of the ACM/IEEE 27th International Conference on Model Driven Engineering Languages and Systems, Linz, Austria, 22–27 September 2024. [Google Scholar]
  24. Botín-Sanabria, D.M.; Mihaita, A.-S.; Peimbert-García, R.E.; Ramírez-Moreno, M.A.; Ramírez-Mendoza, R.A.; de Lozoya-Santos, J.J. Digital Twin Technology Challenges and Applications: A Comprehensive Review. Remote Sens. 2022, 14, 1335. [Google Scholar] [CrossRef]
  25. Baig, S.-u.-R.; Iqbal, W.; Berral, J.L.; Carrera, D. Adaptive Sliding Windows for Improved Estimation of Data Center Resource Utilization. Future Gener. Comput. Syst. 2020, 104, 212–224. [Google Scholar] [CrossRef]
  26. Elyasi, N.; Bellini, A.; Klungseth, N.J. Digital Transformation in Facility Management: An Analysis of the Challenges and Benefits of Implementing Digital Twins in the Use Phase of a Building. IOP Conf. Ser. Earth Environ. Sci. 2023, 1176, 012001. [Google Scholar] [CrossRef]
  27. Breen, D. Immersion Cooling (Part 1): Redefining Reliability Standards for Immersion Cooling in the Data Center. Electronic Design 2025, Industrial Technologies (article), May 15 2025, authored by Dennis Breen. Available online: https://www.electronicdesign.com/technologies/industrial/article/55290691/molex-redefining-reliability-standards-for-immersion-cooling-in-the-data-center (accessed on 25 July 2025).
  28. Thomas, E. Turn Up the Volume: Data Center Liquid Immersion Cooling Advancements Fill 2024. Data Center Frontier 2024, May (online article), author by Erica Thomas. Available online: https://www.datacenterfrontier.com/cooling/article/55130995/turn-up-the-volume-data-center-liquid-immersion-cooling-advancements-so-far-in-2024 (accessed on 25 July 2025).
  29. Kumar, R.; Khatri, S.K.; Divan, M.J. Data Center Air Handling Unit Fan Speed Optimization Using Machine Learning Techniques. In Proceedings of the 9th International Conference on Reliability, Infocom Technologies and Optimization (ICRITO), Noida, India, 3–4 September 2021; pp. 1–10. [Google Scholar]
  30. Panwar, S.S.; Rauthan, M.M.S.; Barthwal, V. A Systematic Review on Effective Energy Utilization Management Strategies in Cloud Data Centers. J. Cloud Comput. 2022, 11, 95. [Google Scholar] [CrossRef]
  31. Saxena, D.; Kumar, J.; Singh, A.K.; Schmid, S. Performance Analysis of Machine Learning Centered Workload Prediction Models for Cloud. IEEE Trans. Parallel Distrib. Syst. 2023, 34, 1313–1330. [Google Scholar] [CrossRef]
  32. Islam, M.R.; Subramaniam, M.; Huang, P.-C. Image-based Deep Learning for Smart Digital Twins: A Review. Artif. Intell. Rev. 2025, 58, 146. [Google Scholar] [CrossRef]
  33. Wang, G.; Xu, W.; Zhang, L. What Can We Learn from Four Years of Data Center Hardware Failures? In Proceedings of the 47th IEEE/IFIP International Conference on Dependable Systems and Networks (DSN’17), Baltimore, MD, USA, 26–29 June 2017; pp. 45–56. [Google Scholar] [CrossRef]
  34. International Data Corporation (IDC). IDC Report Reveals AI-Driven Growth in Datacenter Energy Consumption, Predicts Surge in Datacenter Facility Spending Amid Rising Electricity Costs. Press Release, September 2024. Available online: https://my.idc.com/getdoc.jsp?containerId=prUS52611224 (accessed on 24 July 2025).
  35. Samatas, G.G.; Moumgiakmas, S.S.; Papakostas, G.A. Predictive maintenance—Bridging artificial intelligence and IoT. arXiv 2021, arXiv:2103.11148. [Google Scholar] [CrossRef]
  36. Meza, J.; Wu, Q.; Kumar, S.; Mutlu, O. Revisiting memory errors in large-scale production data centers: Analysis and modeling of new trends from the field. In Proceedings of the 45th IEEE/IFIP International Conference on Dependable Systems and Networks (DSN’15), IEEE. Rio de Janeiro, Brazil, 22–25 June 2015; pp. 415–426. [Google Scholar]
  37. U.S. EPA. eGRID 2022 Technical Guide; Table A-15: CO2 Emissions Output Emission Rates (lbs/MWh); U.S. Environmental Protection Agency: Washington, DC, USA, January 2024. [Google Scholar]
Figure 1. Missing values for cluster maintenance phase.
Electronics 14 03170 g001
Figure 2. Distribution of job allocation across nodes.
Electronics 14 03170 g002
Figure 3. Daily job submission trend.
Electronics 14 03170 g003
Figure 4. Hourly thermal load for 24 h period.
Electronics 14 03170 g004
Figure 5. Frequent Values for failed nodes.
Electronics 14 03170 g005
Figure 6. Correlation matrix between variables of sensor dataset.
Electronics 14 03170 g006
Figure 7. Scatter plot comparing actual vs. predicted thermal temperatures.
Electronics 14 03170 g007
Figure 8. 24 h forecast value for CPU temperature.
Electronics 14 03170 g008
Figure 9. Global DC view for CRESCO7 digital twin representation.
Electronics 14 03170 g009
Figure 10. Node wise view for CRESCO7 digital twin representation.
Electronics 14 03170 g010
Table 2. Dataset columns.
DatasetColumns
Jobs DataId, JobID, user, State, ExitStatus, Ncpus, Nnodes, CPU Utilized (s-core), CPU Efficiency (%), Walltime (s), Memory utilized (GB), Memory allocated (GB), Memory Efficiency (%), rat, Submit, Start, End, Node
Sensor DataId, data ITA, NodeNumber, Failed nodes [0], Sys Utilization, CPU Utilization, Mem Utilization, IO Utilization, Sys Power, CPU Power, Mem Power, CPU 1
Temp, CPU 2 Temp, Fan1A Tach, Fan1B Tach, Fan2A Tach, Fan2B Tach, Fan3A Tach, Fan3B Tach, Fan4A Tach, Fan4B Tach, Fan5A Tach, Fan5B Tach, Ambient Temp, System Air Flow, Exhaust Temp, DC Energy
Disclaimer/Publisher’s Note: The statements, opinions and data contained in all publications are solely those of the individual author(s) and contributor(s) and not of MDPI and/or the editor(s). MDPI and/or the editor(s) disclaim responsibility for any injury to people or property resulting from any ideas, methods, instructions or products referred to in the content.