Article

Transformer Fault Diagnosis Using Hybrid Feature Selection and Improved Black-Winged Kite Optimized SVM

College of Electrical Engineering, North China University of Water Resources and Electric Power, Zhengzhou 450045, China
*
Author to whom correspondence should be addressed.
Electronics 2025, 14(16), 3160; https://doi.org/10.3390/electronics14163160
Submission received: 27 June 2025 / Revised: 3 August 2025 / Accepted: 5 August 2025 / Published: 8 August 2025

Abstract

In order to solve the problems of difficulty in extracting effective features from dissolved gases in transformer oil and limited recognition accuracy of the fault diagnosis model, a feature selection and improved black-winged kite algorithm (IBKA) optimized support vector machine (SVM) transformer fault diagnosis method based on dissolved gas analysis (DGA) in oil is proposed. Firstly, a hybrid feature selection method is used to perform quantitative analysis on the constructed 20-dimensional fault candidate feature set, thereby achieving the selection of feature variables. Then, the Tent chaotic mapping, the Gompertz growth model, and the Morlet wavelet variation strategy are introduced to improve the Black-Winged Kite Algorithm (BKA) to enhance its optimization searching performance; then, the IBKA is used to optimize the hyperparameters such as kernel function and penalty factor of SVM to improve the accuracy of model diagnosis results. Finally, case analysis based on 410 sets of IEC TC10 transformer fault data shows that the fault diagnosis accuracy of the proposed method reaches 98.37%, which verifies the effectiveness of the proposed method for classifying faults according to the IEC TC10 method.

1. Introduction

Dissolved gas analysis (DGA) technology serves as a crucial method for condition monitoring of oil-immersed power transformers. By detecting the components and volume fractions of dissolved gases in the insulating oil, it can effectively identify potential internal faults while the equipment is operating normally, thus ensuring the safe operation of the power system [1]. The application of this technology mainly involves two core issues: first, the optimization and selection of DGA characteristic variables, and second, fault diagnosis based on these characteristic variables. In particular, under scenarios where industrial field data collection is incomplete, the uncertainty associated with high-dimensional features can further amplify diagnostic errors [2].
Commonly used methods in DGA feature variable selection mainly include the IEC three-ratio method [3], the Rogers ratio method [4], and David’s triangle method [5]. Although these methods are simple in principle, their inherent defects, such as incomplete coding rules and fewer feature variables, lead to limited diagnostic accuracy. Aiming at the defects such as fewer feature variables, related studies have effectively improved the recognizability of fault information through feature expansion strategies [6,7,8]. Literature [9] introduced the fourth group of gas ratios on the basis of the Rogers ratio method, constructed a four-ratio coding system, and effectively enhanced the differentiation of fault features by increasing the feature dimensions. Literature [10] constructed a 24-dimensional high-dimensional feature space by combining multi-dimensional gas concentrations, which significantly improved the linear separability of fault types. However, such feature expansion-based methods, while improving fault information recognition capabilities, also give rise to two problems: first, a large number of redundant features in high-dimensional feature spaces reduce the model’s generalization capabilities; second, the dimension catastrophe phenomenon significantly reduces the model’s computational efficiency. This indicates that it is difficult to achieve continuous optimization of diagnostic performance by simply relying on feature dimension expansion, and it is necessary to further combine with feature selection techniques to achieve feature dimensionality reduction while retaining key fault-sensitive features.
In terms of fault diagnosis based on feature variables, with the rapid development of intelligent algorithms and machine learning technologies, advanced methods based on neural networks [11,12,13], support vector machines (SVM) [14,15,16,17,18], decision trees [19], random forests (RF) [20], and extremum learning machines (ELM) [21,22] have been gradually proposed into the field of transformer fault diagnosis. Reference [23] proposed an intelligent diagnostic method based on residual analysis, which has demonstrated distinct advantages in complex industrial systems. Reference [24] proposes a transformer fault diagnosis method based on sparse convolutional neural networks, which significantly improves the accuracy of diagnosis. Reference [25] introduced a diagnostic model based on multiscale approximate entropy and an optimized CNN, which demonstrated excellent classification performance in transformer fault diagnosis. Although these neural network-based methods typically achieve high diagnostic accuracy, they generally require a large number of labeled samples for training. Additionally, their complex model architectures result in substantial computational overhead, making them prone to local optima and increasing the risk of overfitting under small-sample conditions [26]. In contrast, SVM offer a simpler structure, strong generalization capability under small-sample conditions, high computational efficiency, and a solid theoretical foundation, effectively avoiding the problem of local optima. However, the SVM method itself also has certain limitations. Its classification performance is highly sensitive to the selection of kernel functions and hyperparameters, and the model performance may be affected when dealing with highly nonlinear or extremely imbalanced datasets. In addition, SVM is relatively sensitive to outliers; the presence of noise or abnormal data in the input may impact the final diagnostic results. To address these issues, researchers have proposed relevant optimization methods. For example, Reference [27] uses the whale algorithm to optimize SVM for transformer fault diagnosis, but the whale algorithm’s local extreme value processing ability is poor, and it is difficult to jump out of the local optimum. Reference [28] proposed an improved gray wolf optimization SVM algorithm for transformer fault diagnosis, which improves the accuracy of diagnosis, but its ability to jump out of the local optimum has room for further improvement. Therefore, in practical applications, how to reasonably select kernel functions and parameters, and combine effective data preprocessing techniques, is key to enhancing the performance of SVM in fault diagnosis.
To address the aforementioned issues, this paper proposes a transformer fault diagnosis method for SVM optimization based on hybrid feature selection and an improved bald-winged kite algorithm (IBKA). The main contributions of this paper can be summarized as follows:
  • A hybrid feature selection mechanism is proposed, in which LightGBM and Random Forest algorithms are combined to construct a multi-model evaluation matrix. The dual-model scores are then integrated using the entropy weight Technique for Order Preference by Similarity to Ideal Solution (Entropy-TOPSIS), enabling the objective selection of a highly discriminative feature subset.
  • Designing a multi-strategy improved black-winged kite algorithm (IBKA): Enhancing population diversity through Tent chaotic mapping, combining Gompertz dynamic step size to balance convergence efficiency between the exploration and exploitation phases, and introducing Morlet wavelet variation strategies to avoid local optima, significantly improving the algorithm’s optimization performance.
  • Building a transformer fault diagnosis model based on IBKA-SVM: Using IBKA to optimize the key hyperparameters of SVM (kernel function parameter g and penalty factor C) improves the diagnostic accuracy and efficiency of the model, and the superiority of the method is verified through example simulations.
The structure of this paper is as follows: Section 2 introduces data preprocessing and feature selection methods. Section 3 elaborates on the principles of the improved black-winged kite algorithm (IBKA). Section 4 constructs the IBKA-SVM fault diagnosis model; Section 5 conducts experimental comparisons and analyses. Finally, Section 6 summarizes the main conclusions of this study.

2. Data Reconstruction and Feature Selection Methods

2.1. Data Reconstruction Method

Traditional diagnostic methods usually directly use five gas concentrations, such as H2, CH4, C2H2, C2H4, C2H6, etc., as characteristic inputs, but these gas concentration data do not fully reflect all the information of transformer faults, and the reliability of diagnostic results is low. Studies have shown that the ratio of dissolved gas concentration in oil is closely related to the operational status of the transformer [29].
Therefore, this paper combines the analysis principles of the IEC ratio method and the non-coded ratio method, and further adds 15 candidate features based on the five sets of benchmark feature parameters obtained from the chromatographic analysis of dissolved gases in oil. That is, the ratio between each gas and the ratio of each gas to the total gas was selected as the supplementary feature variables, and a 20-dimensional gas feature data set that can reflect the operating status of the transformer was established, as shown in Table 1, where n denotes the gas content, TH = H2 + CH4 + C2H2 + C2H4 + C2H6.

2.2. Feature Dimensionality Reduction Based on Multi-Criteria Decision-Making

Although higher feature dimensions contain more information, they also introduce more redundant information, which reduces the computational efficiency of the diagnostic model. To address the challenges posed by high-dimensional fault features, this paper proposes a hybrid feature selection method. Detailed information is shown in Algorithm 1, the specific steps are as follows:
Step 1: Train the gas feature dataset using the LightGBM and RF algorithms to obtain the importance evaluation results for each feature and construct a feature-model evaluation matrix.
F = f 1 1 f 1 2 f 1 j f 2 1 f 2 2 f 2 j f i 1 f i 2 f i j
where f i j represents the score of the ith individual under the jth model.
Step 2: Apply the min–max normalization method to the importance assessment matrix F , obtaining the normalized matrix Z , and further derive the probability matrix P .
p i j = z i j i = 1 m z i j
where p i j represents the normalized score proportion of the ith feature under the jth model.
Step 3: Use the Entropy method to determine the weights of the models, achieving an objective weight distribution through the conversion of information utility values. The entropy value for each model j is:
e j = 1 ln m i = 1 m p i j ln p i j
The smaller the entropy value, the more information the model provides, and the larger its weight. Based on the entropy value, the final weight of each model is calculated as follows:
w j = d j j = 1 n d j
where d j denotes the discrepancy coefficient of the model, and w j represents the weight of the jth model in feature evaluation.
By weighting each column of the scores using the model weights, the weighted decision matrix V is obtained, with its elements given by:
v i j = w j p i j
Step 4: The TOPSIS multi-criteria decision-making method is employed to calculate the Euclidean distance D of each feature from the positive/negative ideal solutions in the weighted evaluation space. The comprehensive ranking of feature importance is achieved through the relative closeness, expressed as:
C i = D i D i + + D i , 0 C i 1
The comprehensive feature evaluation matrix X is:
X = C 1 C 2 C i
where C i being larger indicates that the ith feature is more important.
Algorithm 1. Workflow of Entropy-TOPSIS Method
Input: Feature importance matrix F = x i j m × n
     m: number of features, n: number of models (e.g., LightGBM, RF)
Output:   Feature   importance   ranking   ( sorted   by   S core i in descending order)
  • Normalize   matrix :   z i j = f i j min ( f j ) max ( f j ) min ( f j )
  • Calculate   probability   matrix :   P i j = Z i j i Z i j
  • Calculate   entropy :   E j = k i = 1 m P i j ln P i j , k = 1 ln ( m )
  • Calculate   weights :   W j = 1 E j j = 1 n ( 1 E j )
  • Weighted   decision   matrix :   v i j = w j z i j
  • Positive / negative   ideal   solutions :   V + = max ( V ) , V = min ( V )
  • Calculate   Euclidean   distance :   D + = V V + , D = V V
  • Feature   score :   S c o r e i = D i D i + + D i
Return: Feature importance ranking

3. Improved Black-Winged Kite Algorithm

Compared to traditional algorithms, the Black-Winged Kite Algorithm (BKA) combines the Cauchy mutation strategy and the leader strategy to enhance the algorithm’s global optimization capability (refers to finding the global optimum solution of the objective function within the entire domain) and convergence speed [30,31,32]. However, the diversity of the algorithm’s population is relatively low, requiring more iterations to find an optimal solution, which in turn affects the global search capability. Therefore, in this section, the original BKA algorithm is improved upon.

3.1. Research on Multi-Strategy Hybrid Improvement

3.1.1. Population Initialization Strategy Based on Tent Chaos Mapping

To enhance the diversity and uniform distribution of the population during the initialization phase, this paper introduces the Tent mapping initialization strategy. Compared to traditional random initialization methods, the Tent mapping generates initial population positions that are more uniformly distributed and better covered, providing a higher quality initial solution for the subsequent optimization process. Therefore, the Tent mapping is used to generate a uniform random variable y in the range [0, 1], and the mathematical expression is as follows:
y t + 1 = y t u , 0 y t u 1 y t 1 u , u y t 1
where t denotes the current iteration number; u denotes the random number of [0, 1].
Applying the chaotic strategy to the population initialization of the BKA algorithm, the improved formula is obtained as:
X i , j = l b j + ( u b j l b j ) y t + 1
where X i , j is the initial position of individual i in the population in the jth dimension, and ubj and lbj are the search boundaries in the jth dimension.

3.1.2. Step Length Improvement Strategy Based on Gompertz Growth Model

In its attack behavior, the black-winged kite observes its prey by adjusting the angle of its wings and tail to the wind speed during flight, hovering silently, and then swooping quickly to attack. Its mathematical model is:
X i , j ( t + 1 ) = X i , j ( t ) + n ( 1 + sin ( r ) ) X i , j ( t ) , if   p < r X i , j ( t ) ( n ( 2 r 1 ) + 1 ) , else
where X i , j ( t + 1 ) denotes the position of the ith black-winged kite in dimension j and t + 1 iterations, r denotes a [0, 1] random number, p denotes a constant of 1, and n is the step factor.
Aiming at the problem of low search efficiency due to the fixity of the step-size factor n this paper introduces the Gompertz growth model, which enables the algorithm to enhance the global exploration capability at the beginning of the iteration and focus on the local fine search at the later stage, thus realizing the dynamic step-size adjustment:
n = A exp exp ( B Y t )
where A is the scaling factor; B is the adjustment factor; Y is the growth rate, which is related to the current number of iterations; and t is the current number of iterations.

3.1.3. Morlet Wavelet Variation Strategy

In the migration behavior, if the fitness of the current population is lower than that of a randomly selected population, the leader will relinquish its leadership and join the migrating population; otherwise, it will continue to lead the population. The mathematical model for the migration behavior is as follows:
X i , j ( t + 1 ) = X i , j ( t ) + C X i , j ( t ) L j ( t ) if   F i < F r i X i , j ( t ) + C L j ( t ) m X i , j ( t ) else
m = 2 × sin r + π 2
where C denotes the Cauchy mutation strategy. L j ( t ) denotes the jth dimensional black-winged kite leader at the tth iteration, and m is a constant.
To enhance the algorithm’s nonlinear search capability in migration behavior, a Morlet wavelet perturbation mechanism is introduced. When the population converges to a local optimum (refers to a point in the search space whose objective function value is better than all nearby points but worse than other points in the space), the oscillatory characteristics of ψ generate high-frequency perturbations near the optimal solution X i , pushing individuals away from their current position. The perturbation amplitude is adjusted adaptively with the iteration number t: large perturbations in the early stages explore new areas, while small perturbations in the later stages perform fine searches. Its mathematical definition is as follows:
m = exp a 1 1 t T b β = c × m ψ = 1 m exp β 2 2 m 2 cos a β m
In the formula, t and T respectively represent the current iteration times and the maximum iteration times, and a and b represent the control factors with values of 5 and 10, respectively. Therefore, the optimal position is disturbed by the wavelet factor, and the position disturbance is expressed as:
X i n e w = ψ × X i + X i
where X i n e w denotes the position after the optimal position perturbation, and X i denotes the current optimal position.

3.2. Performance Analysis of Improved Black-Winged Kite Algorithm

To validate the performance of the IBKA, this paper selected benchmark functions from CEC2005 (unconstrained problems) and CEC2017 (constrained problems) for testing, and compared the results with the Dolphin Optimization Algorithm (DOA), Particle Swarm Optimization (PSO), Reinforcement Incremental Multi-Attribute Evaluation Optimization Algorithm (RIME), Grey Wolf Optimization Algorithm (GWO), Whale Optimization Algorithm (WOA), and BKA algorithm. The function expressions are shown in Table 2. Among them, the first category, single-peak problems F1 and F2, features relatively simple structures and is typically used to evaluate the convergence performance of algorithms. The second category, basic multi-peak problems F9 and F10, contains multiple local optima and is mainly employed to assess the algorithm’s ability to balance global search and local exploitation. For constrained optimization problems such as g02 and g04, these problems incorporate nonlinear constraints and have extremely narrow feasible regions, which can effectively evaluate the constraint-handling capability of algorithms in complex search spaces.
Independent simulation experiments were conducted on six test functions using MATLAB 2023 software platform. To ensure the accuracy of the evaluation of the IBKA, the maximum number of iterations was set to 500, the population size was set to 30, and the dimensionality was set to 50. The simulation results are shown in Figure 1.
As seen in Table 2 and Figure 1, on the classic test functions F1~F2, IBKA demonstrates a significant improvement in both solution accuracy and convergence speed compared to the other six mainstream optimization algorithms. When dealing with multi-peak functions (F9, F10), the IBKA requires significantly fewer iterations and can quickly converge to the theoretical optimal solution. In the constrained optimization problems of CEC2017, IBKA demonstrates exceptional engineering adaptability, achieving stable convergence of the feasible solution rate to the global optimum while satisfying nonlinear constraints. These results strongly confirm its robustness and practical applicability in complex optimization tasks.

4. Fault Diagnosis Model Based on Feature Selection and IBKA-SVM

4.1. Optimize the SVM Hyperparameters Based on IBKA

Support Vector Machine (SVM) is used in transformer fault classification due to its excellent generalization ability in high-dimensional data and the adaptability of its kernel function to nonlinear problems [33,34,35]. However, the performance of SVM is highly dependent on the choice of the penalty factor C and the kernel parameter g. Traditional parameter tuning methods often face limitations such as high computational cost and the tendency to fall into local optima. Therefore, this paper uses the IBKA to search for the optimal parameter combination for SVM, thereby improving classification accuracy. The main steps of the optimization process are as follows:
Step 1: Population initialization. Generate a set of candidate solutions based on Tent chaotic mapping x i = ( C i , g i ) , each candidate solution represents a parameter combination of SVM.
Step 2: Adaptation computation. For each candidate solution, train the SVM model using the corresponding C i and g i to calculate its classification accuracy. To accommodate the minimization property of the IBKA, the objective is transformed into minimizing the classification error rate. Therefore, the objective function is defined as:
F ( C , g ) = 1 A c c u r a c y ( C , g )
A c c u r a c y ( C , g ) = j = 1 n I ( y j = y ^ j ) n
where I ( y j = y ^ j ) is an indicator function that indicates 1 if the predicted label y ^ j is equal to the true label y j and 0 otherwise, and n is the total number of samples in the test set.
Step 3: Position update. Using the Morlet wavelet variation strategy for position update, the algorithm is able to search for the optimal parameters more efficiently during the optimization process and improve the performance of the SVM classifier. The optimization process stops when the maximum number of iterations is reached.
Step 4: SVM training and prediction. After each round of iteration, the IBKA returns the current optimal solution ( C * , g * ) , and inputs this combination of parameters into the SVM for training. The objective function of the SVM is:
min ω 1 2 ω 2 + C * i = 1 n ξ i s . t .   y i ( ω T x i + b ) 1 ξ i , ξ i 0
The kernel function uses the Gaussian kernel, which is expressed as:
K ( x i , x j ) = e x p ( g * | | x i x j | | 2 )
The kernel function maps the features of the input space to a high-dimensional feature space, which enables it to effectively handle nonlinear classification problems. Finally, the optimal parameters C * and g * are used to train the SVM classifier, and the test set is predicted to yield the final classification accuracy.

4.2. Construction Process of Fault Diagnosis Model

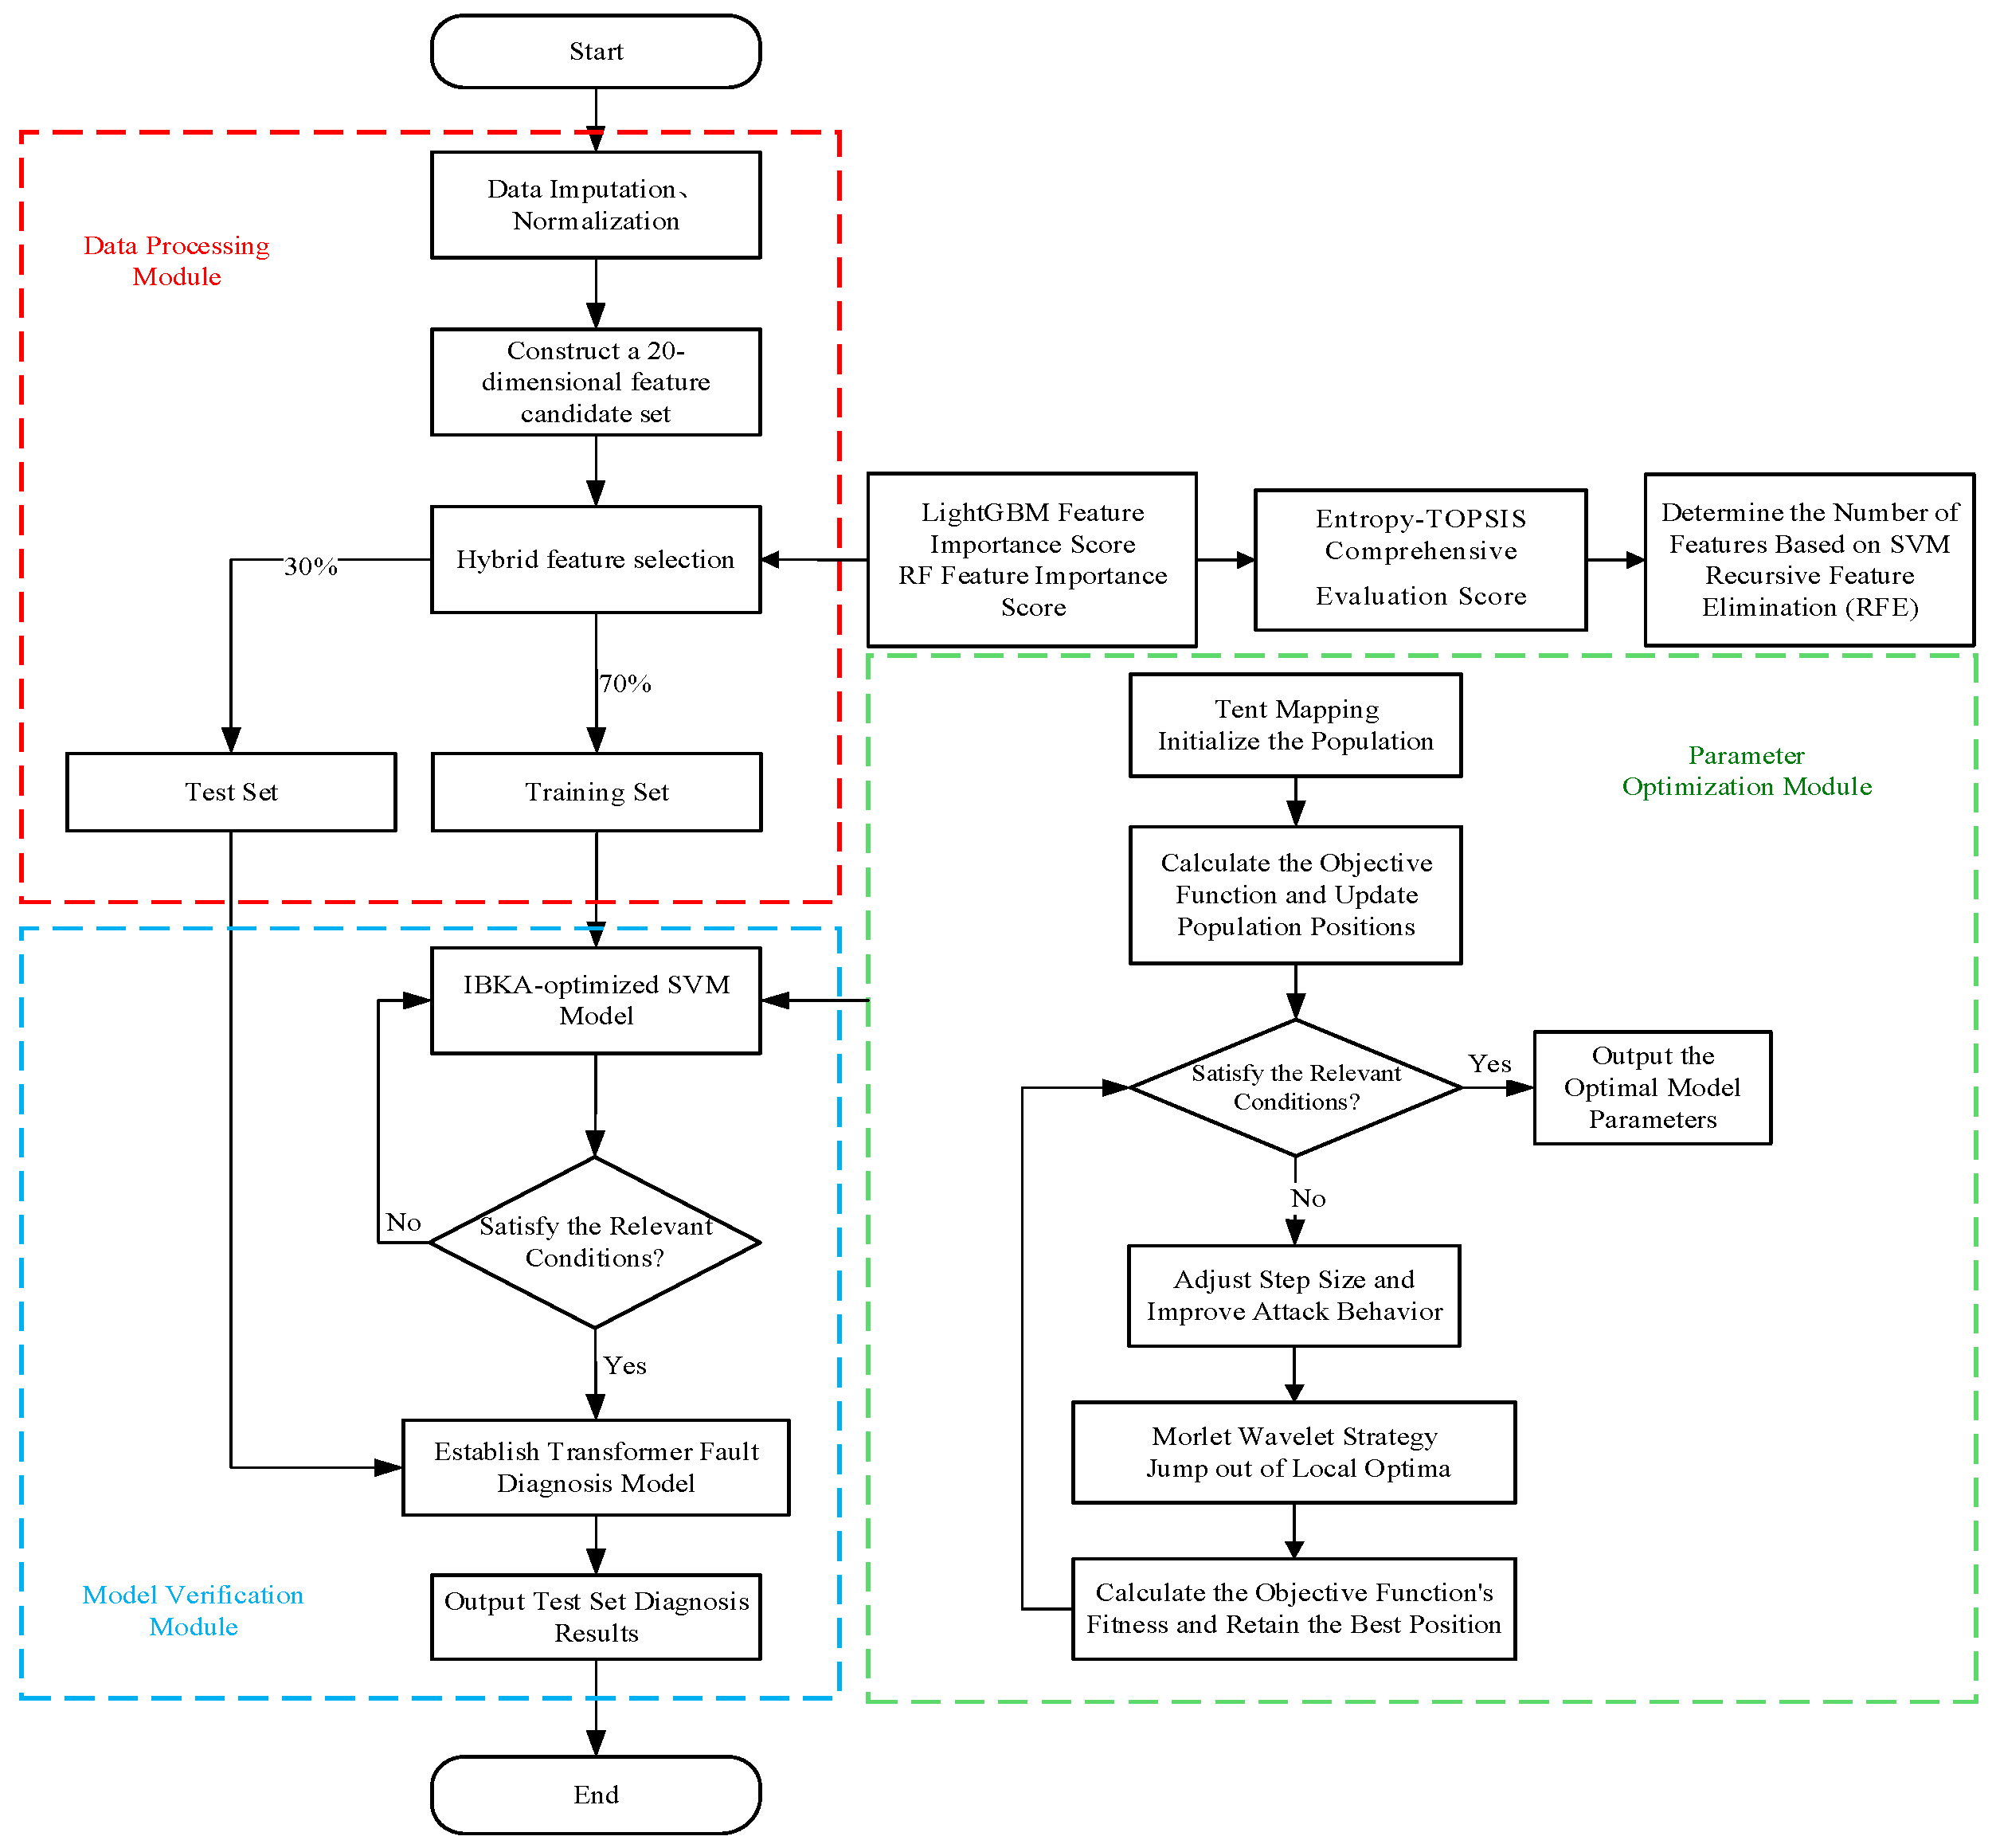
Based on the data reconstruction method, hybrid feature selection strategy, and IBKA optimization algorithm proposed in Section 2 and Section 3, this paper constructs a transformer fault diagnosis model based on hybrid feature selection and IBKA-SVM. The construction process of the model mainly includes three core parts: data processing, parameter optimization, and model validation. The block diagram of its modeling process is shown in Figure 2.

5. Statistical Analysis

5.1. Selection of Transformer Fault Characteristics

According to DL/T722-2014 [36] and IEC60599-2015 [37] standards, internal transformer faults can be categorized into five types: medium and low-temperature overheating (T1~T2), high-temperature overheating (T3), low-energy discharges (D1), high-energy discharges (D2), and partial discharges (PD), and numbered in the order of 1 to 5. In this paper, 410 sets of IEC TC 10 transformer fault data were collected, and the distribution of faults is shown in Table 3.
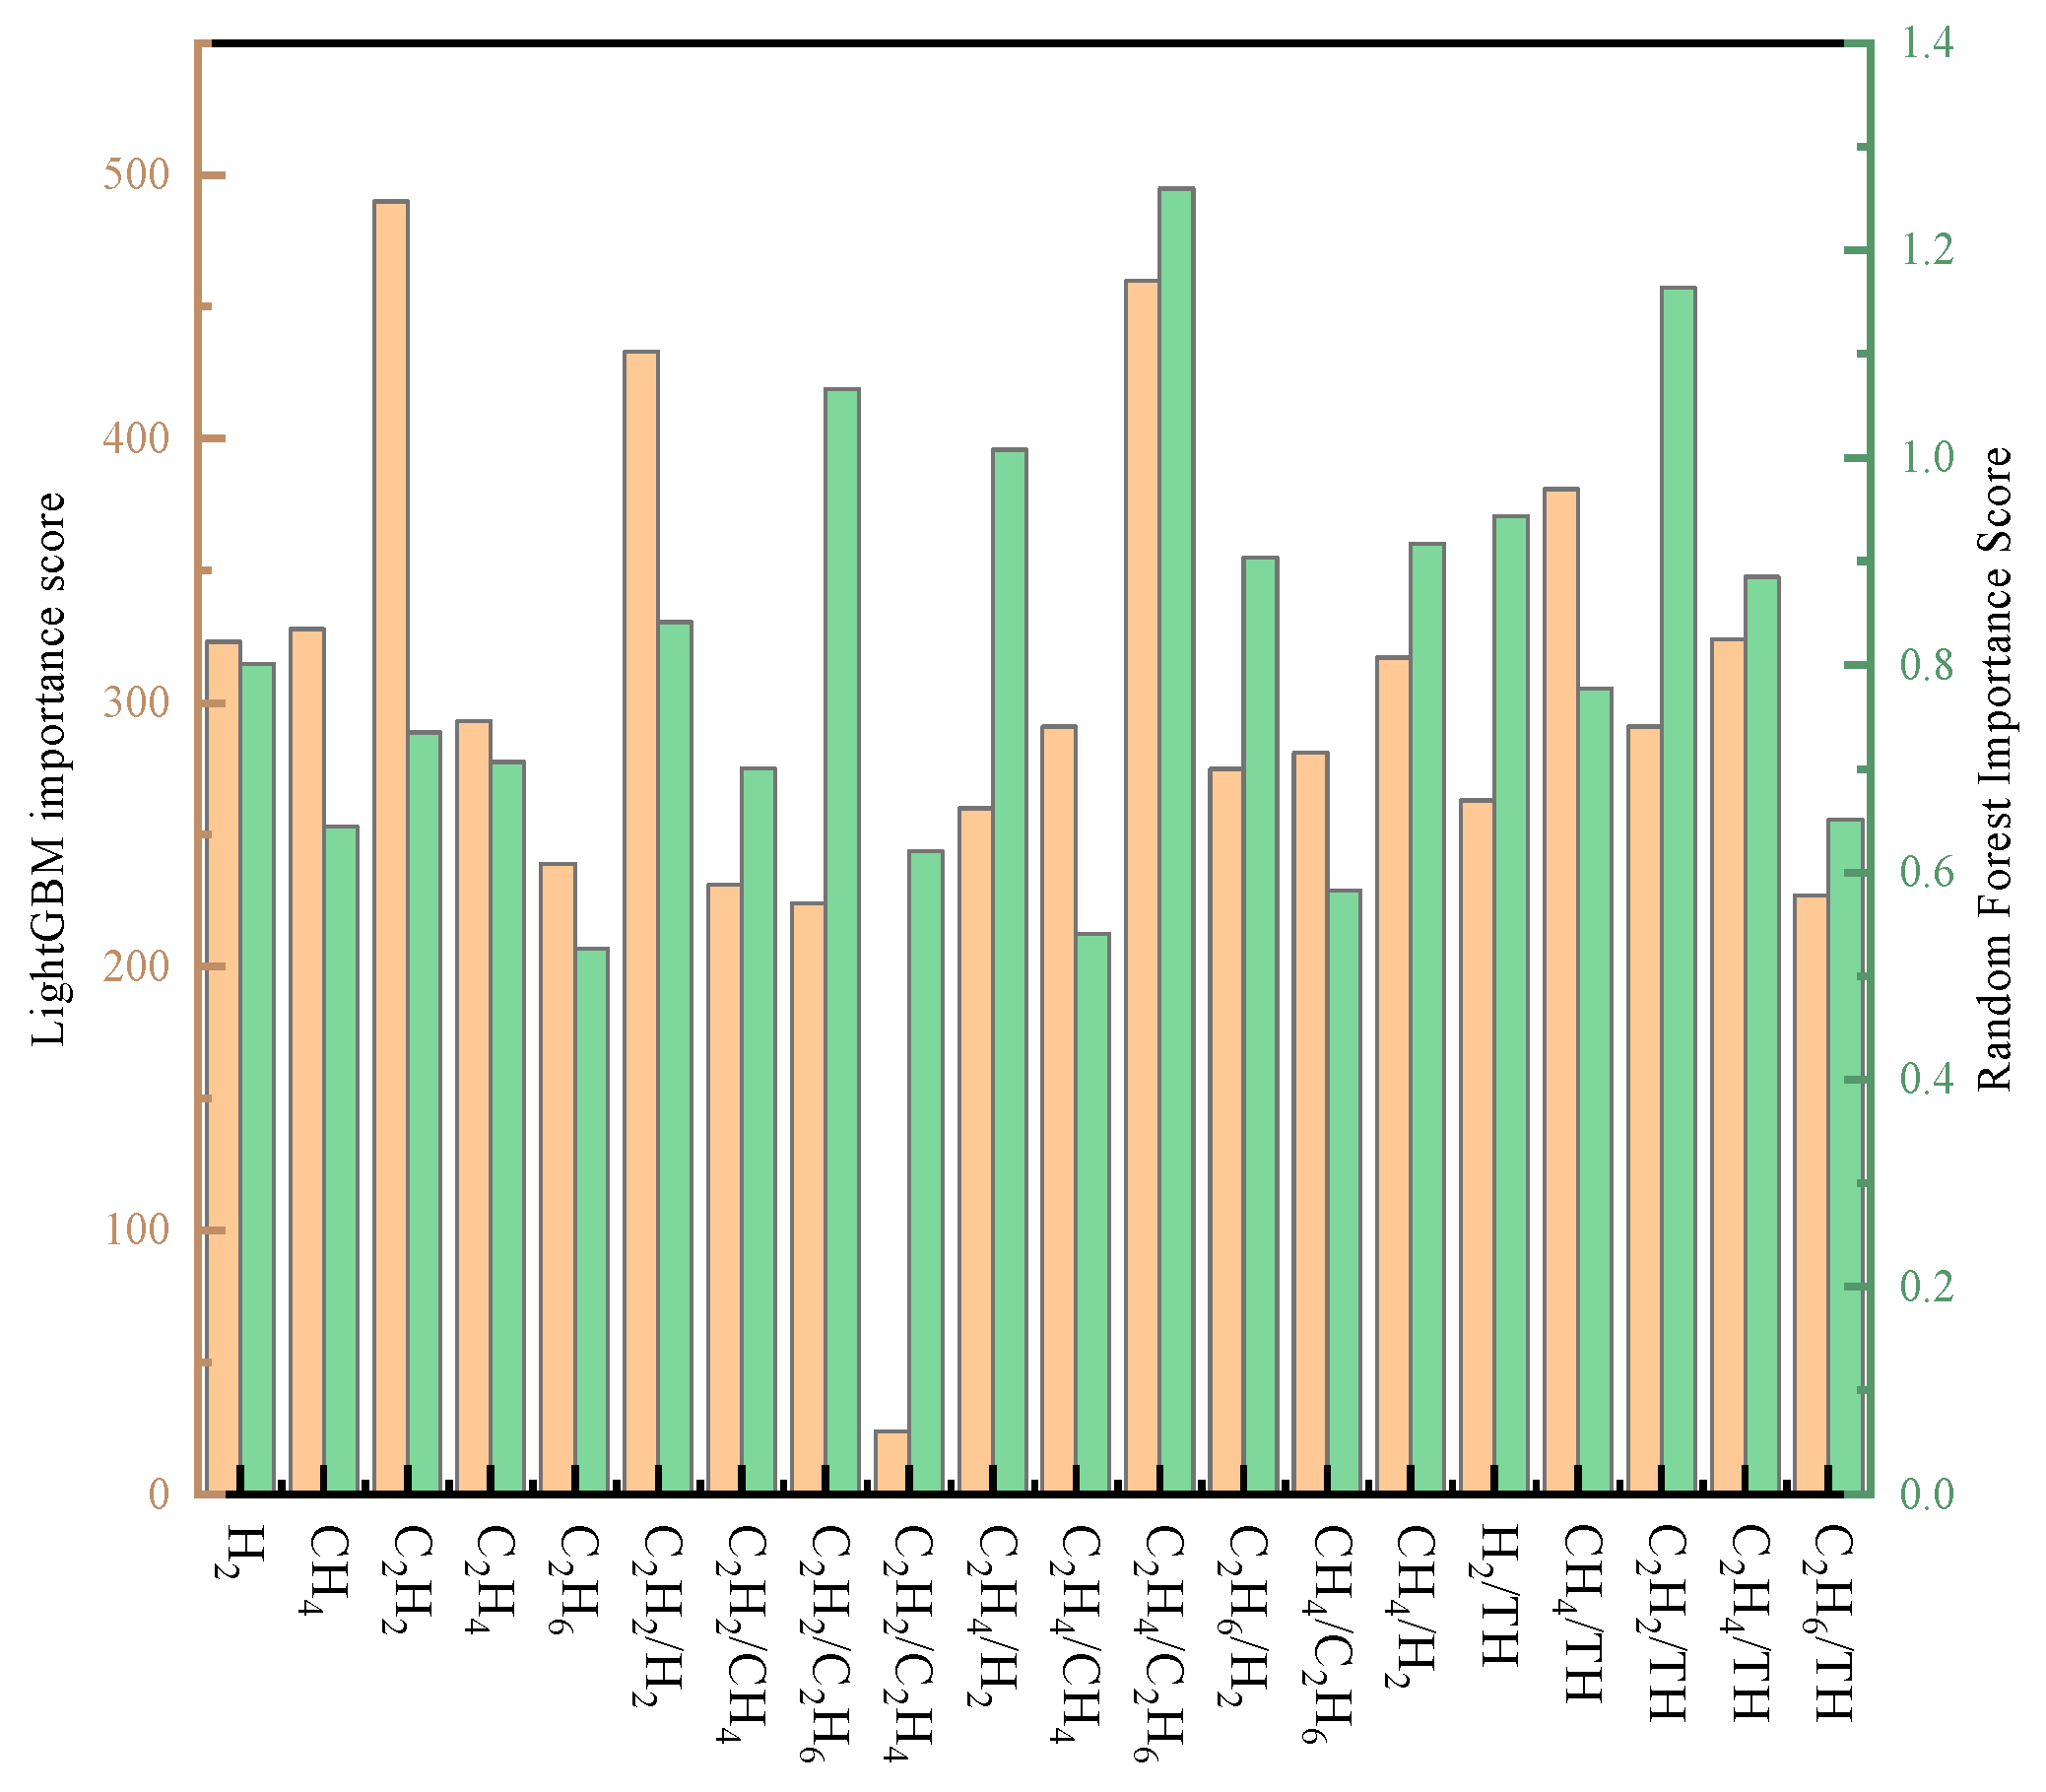
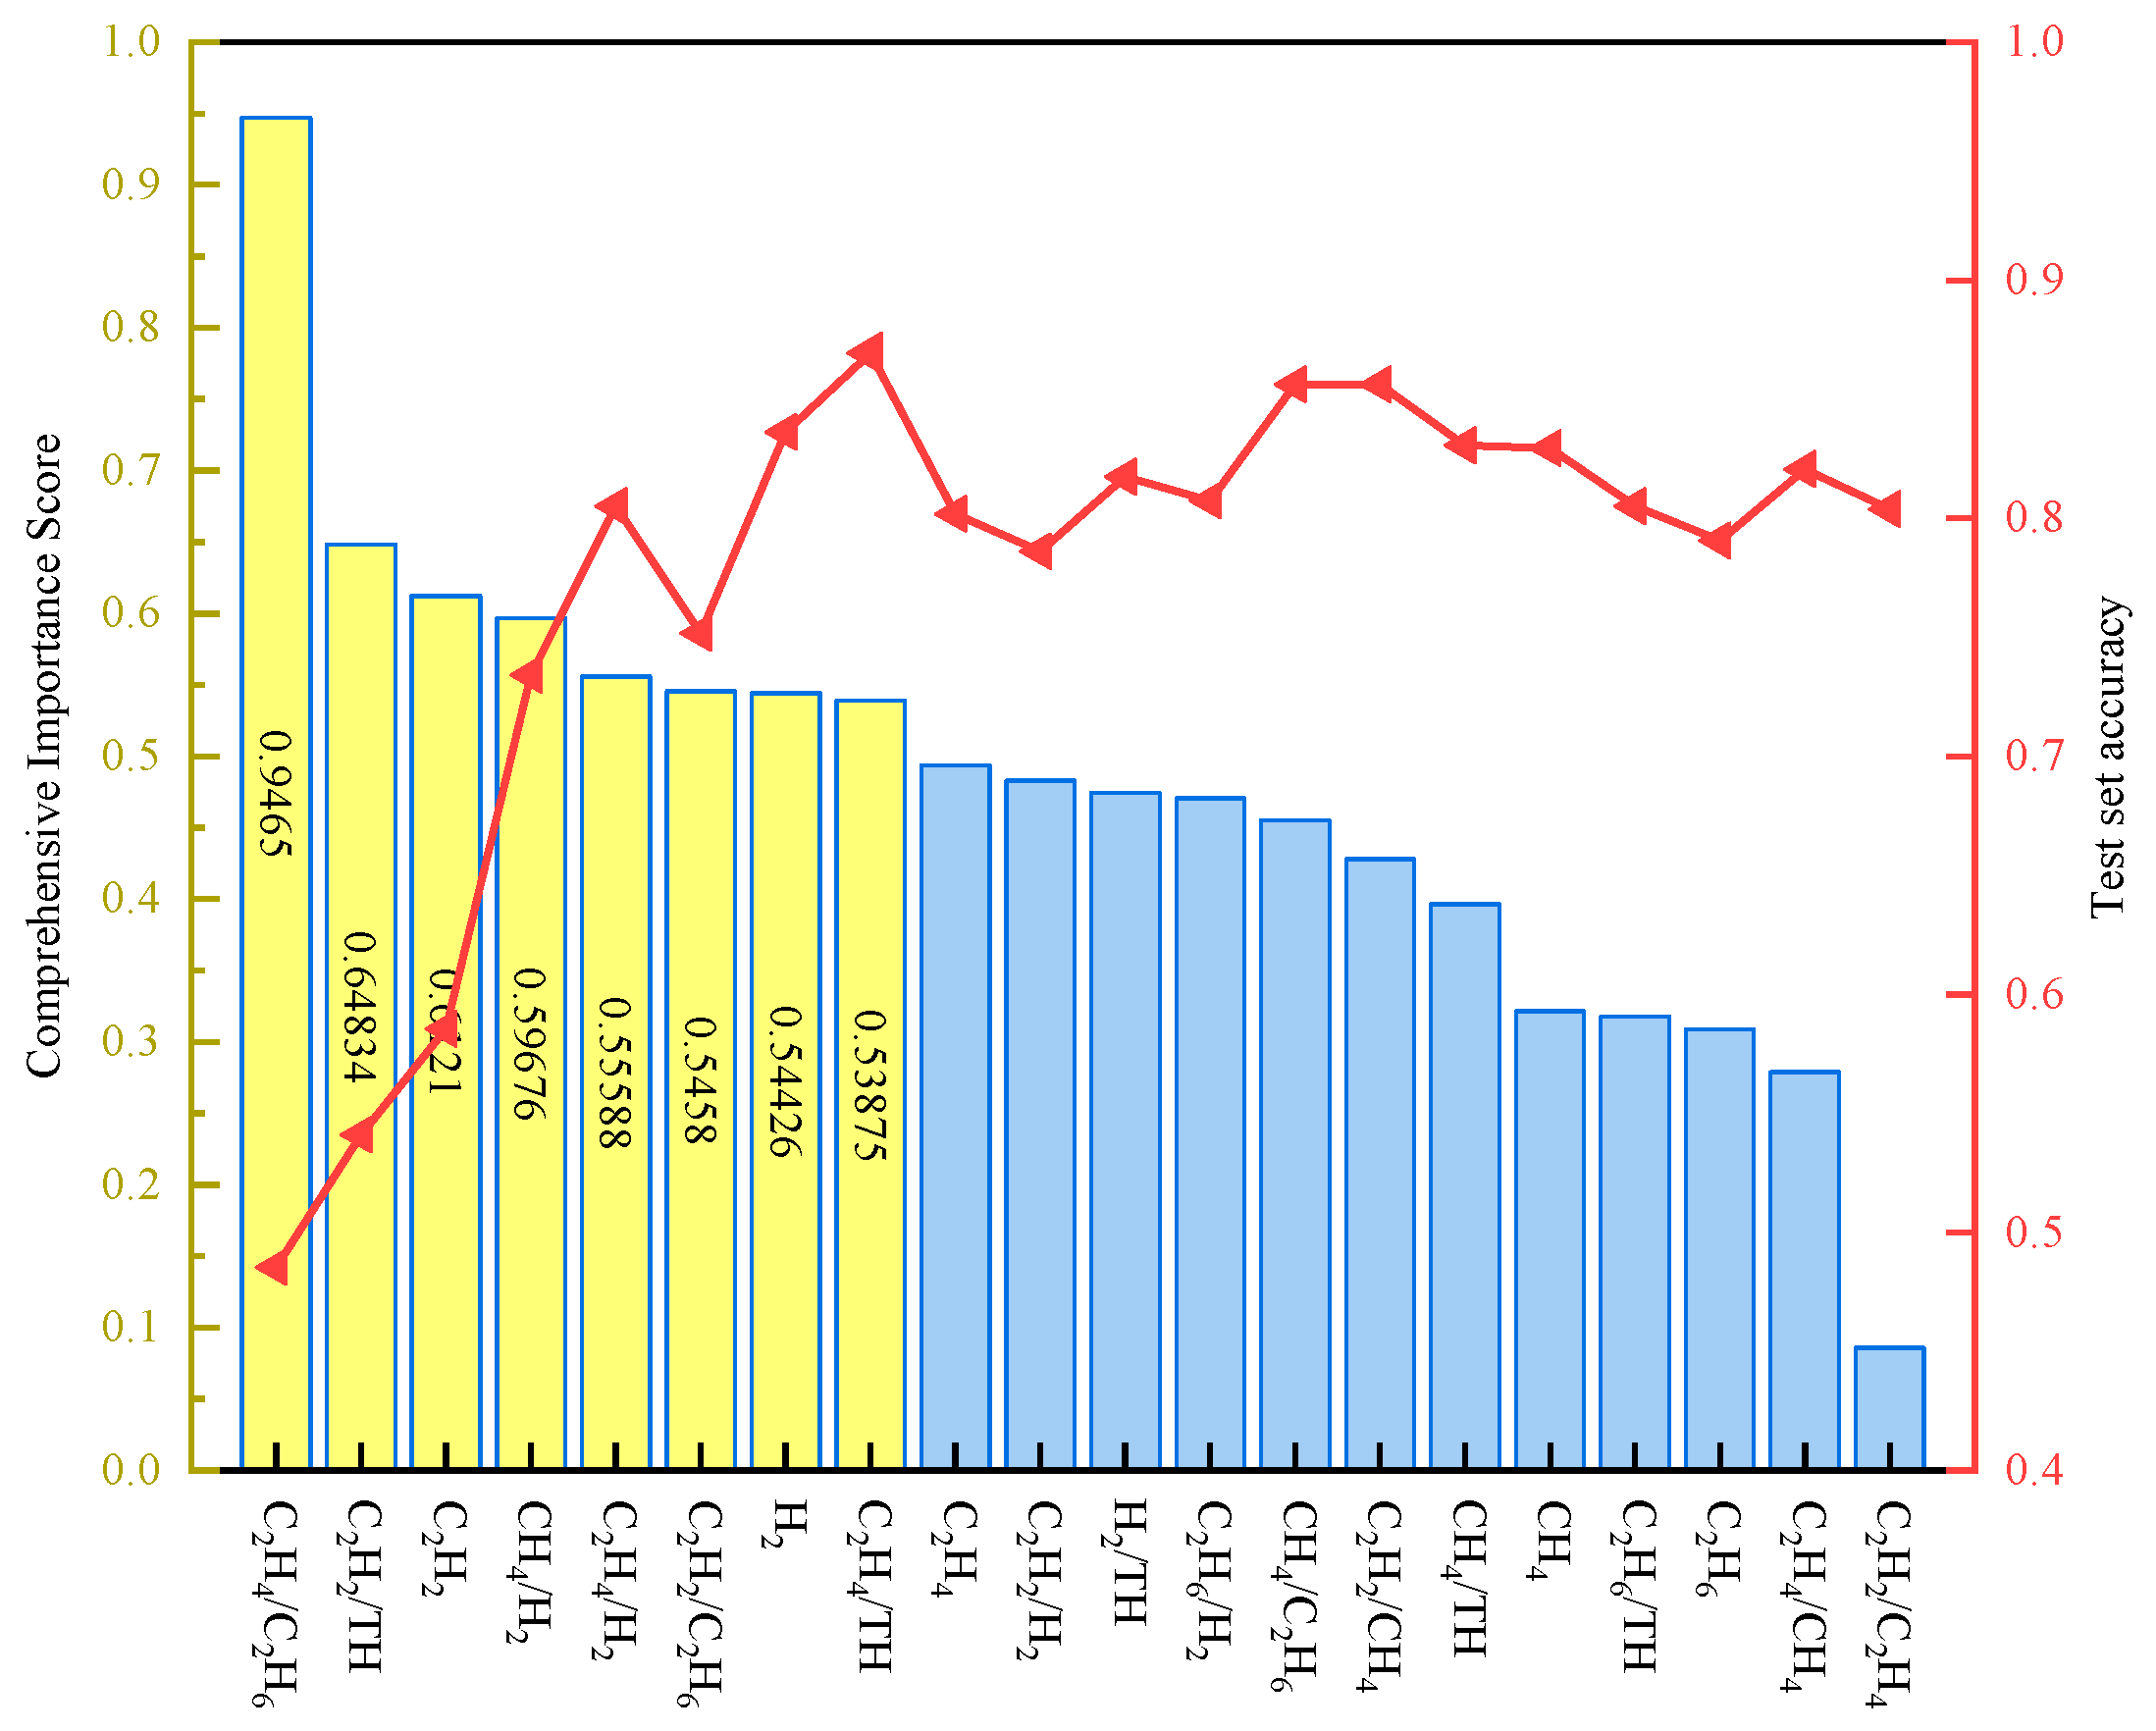
According to the method described in Section 2.2, the importance of all feature variables is first calculated using the LightGBM and RF algorithms, as shown in Figure 3. The higher the importance score, the stronger the correlation between the feature and the fault type. Subsequently, the Entropy-TOPSIS method is used to perform a weighted fusion of the dual-model scores, resulting in the comprehensive feature importance score, which is then sorted in descending order. The results are shown in Figure 4. For this study, the minimum samples per leaf in the RF model are set to 8, the number of decision trees is set to 400, the number of weak learners in LightGBM is set to 400, the maximum depth of the trees is set to 10, and the maximum number of leaves is set to 63.
As the features are added to the model in descending order of importance, the test accuracy reaches its peak at 86.7% when the eighth feature is included, and stabilizes thereafter. This indicates that the subsequent features, which have lower importance, do not significantly improve the model’s performance, and their informational contribution may already be captured by the preceding features. Based on considerations of model diagnostic efficiency, this study ultimately selects the candidate subset consisting of the first eight features as the signature subset.

5.2. Ablation Experiments

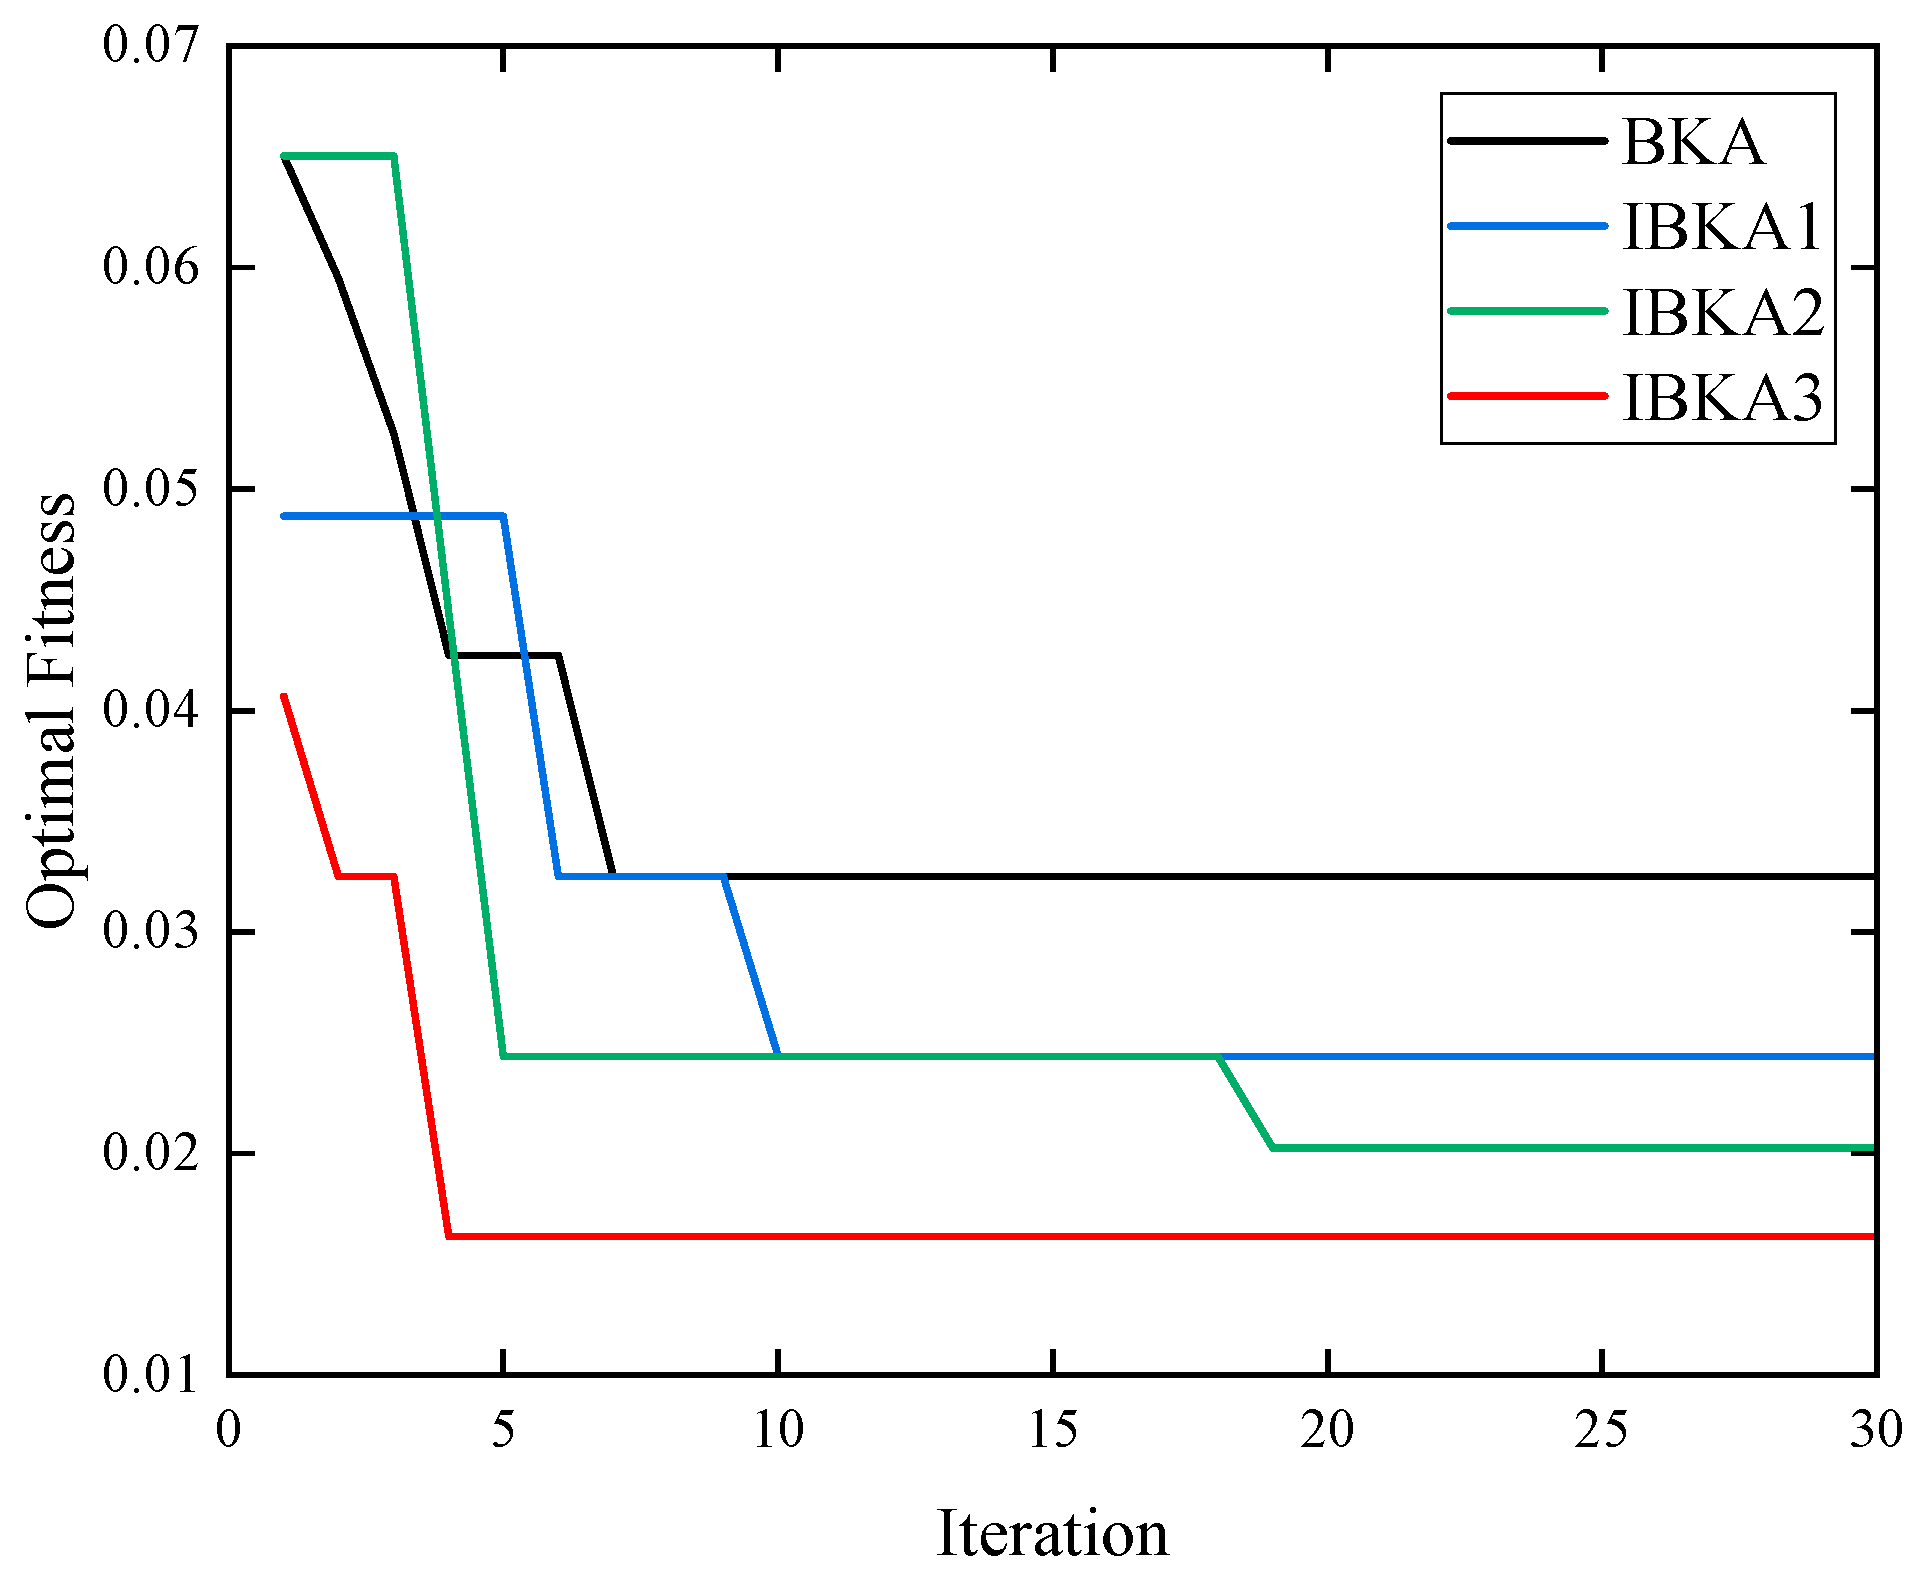
To quantitatively assess the impact of each enhancement strategy on improving the Black-winged Kite Algorithm (IBKA), we conducted ablation experiments comparing the original BKA with progressively enhanced variants. Table 4 details the configurations of these variants, with strategies progressively integrated into the SVM hyperparameter tuning optimization framework. All experiments used the same settings: population size = 20, maximum number of iterations = 30, SVM parameter range C ⋲ (0.1, 100), g ⋲ (0.1, 10).
As shown in Figure 5, the introduction of Tent chaotic mapping in IBKA-1 effectively enhances population diversity and significantly improves the algorithm’s global optimization capability. When the Gompertz growth model is further integrated in IBKA-2, its dynamic step-size adjustment mechanism achieves a better balance between global exploration and local exploitation, resulting in a markedly lower average number of convergence iterations compared to IBKA-1. Finally, IBKA-3 incorporates a Morlet wavelet variatio strategy to strengthen the nonlinear search capability during migration, achieving a superior global optimum with a diagnostic accuracy of 98.37%. These results fully demonstrate the effectiveness of the multi-strategy collaborative enhancements.

5.3. Performance Evaluation of Fault Diagnosis Methods

To validate the performance of the proposed method, evaluation metrics such as accuracy, precision, recall, Kappa coefficient, Hamming loss, false negative rate (FNR), and false positive rate (FPR) are used for quantitative analysis. The mathematical expression is:
η a c c u r a c y = n N η p r e c i s i o n = n T n p η r e c a l l = n T n R
In the above equations, n denotes the number of samples where the diagnosed fault type matches the actual fault type, N represents the total number of samples, n T indicates the number of correctly diagnosed samples for a specific fault type, n P denotes the total number of samples predicted as that fault type, and n R represents the total number of actual samples of that fault type.
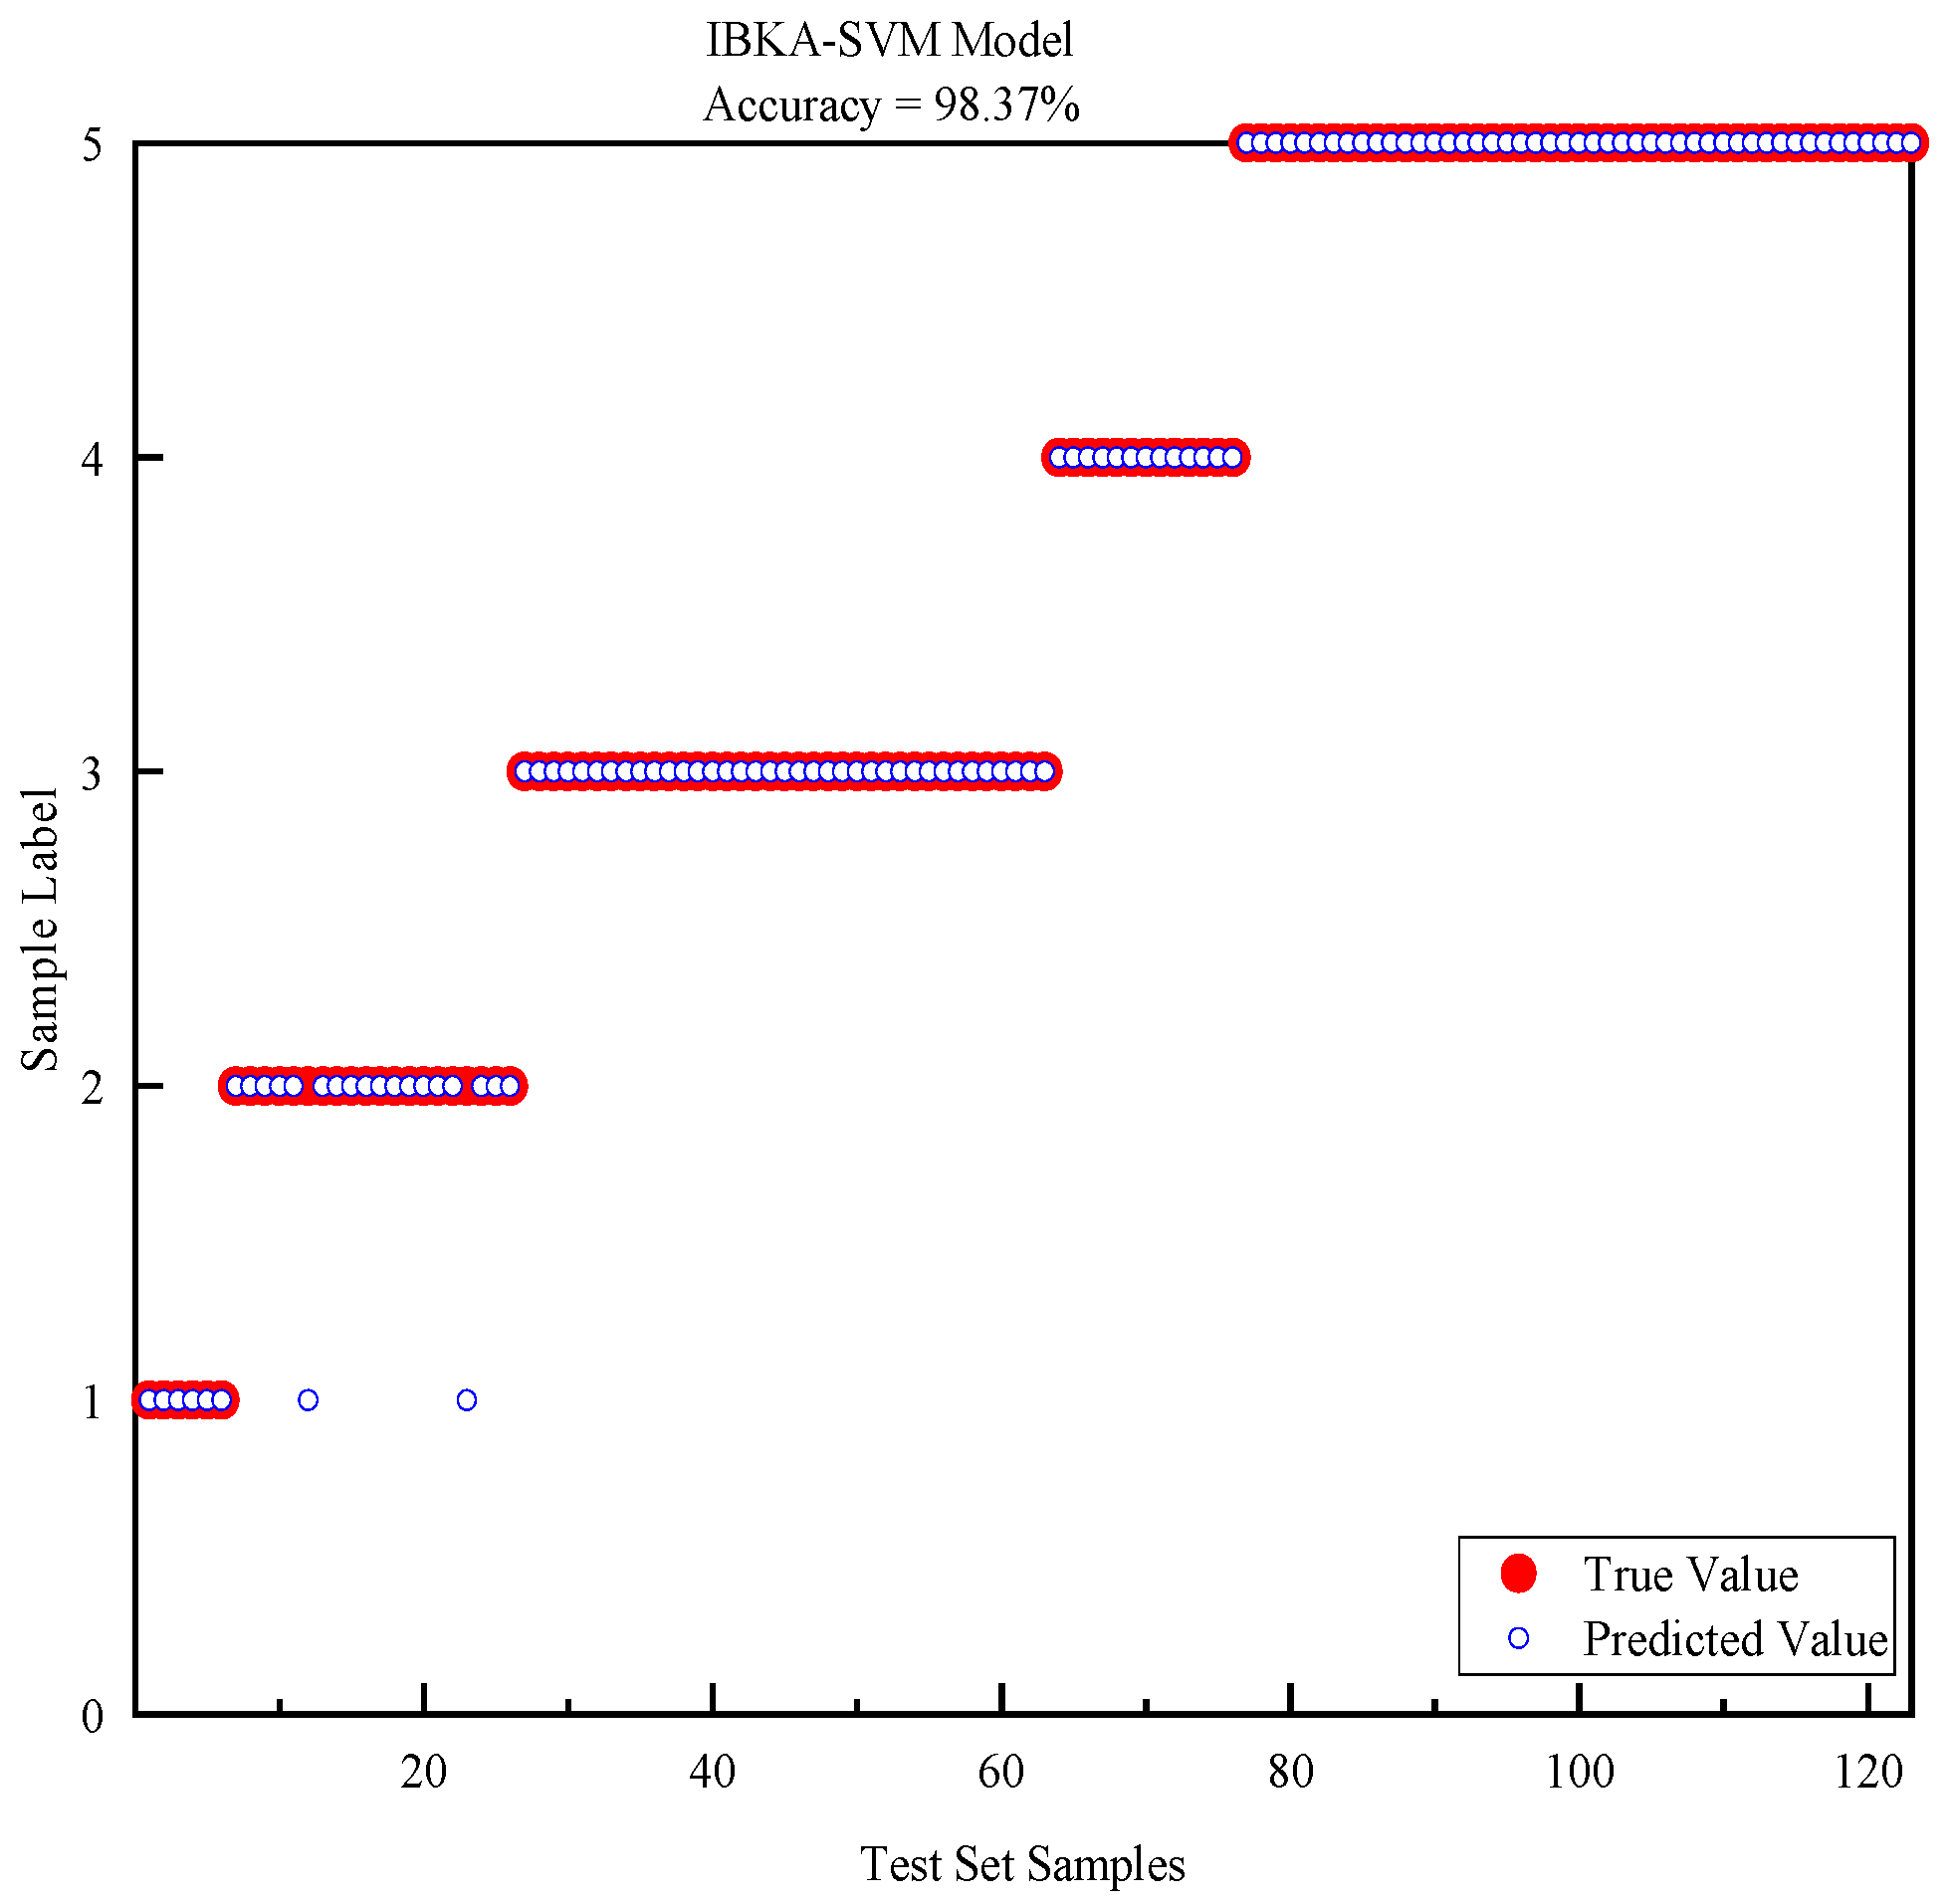
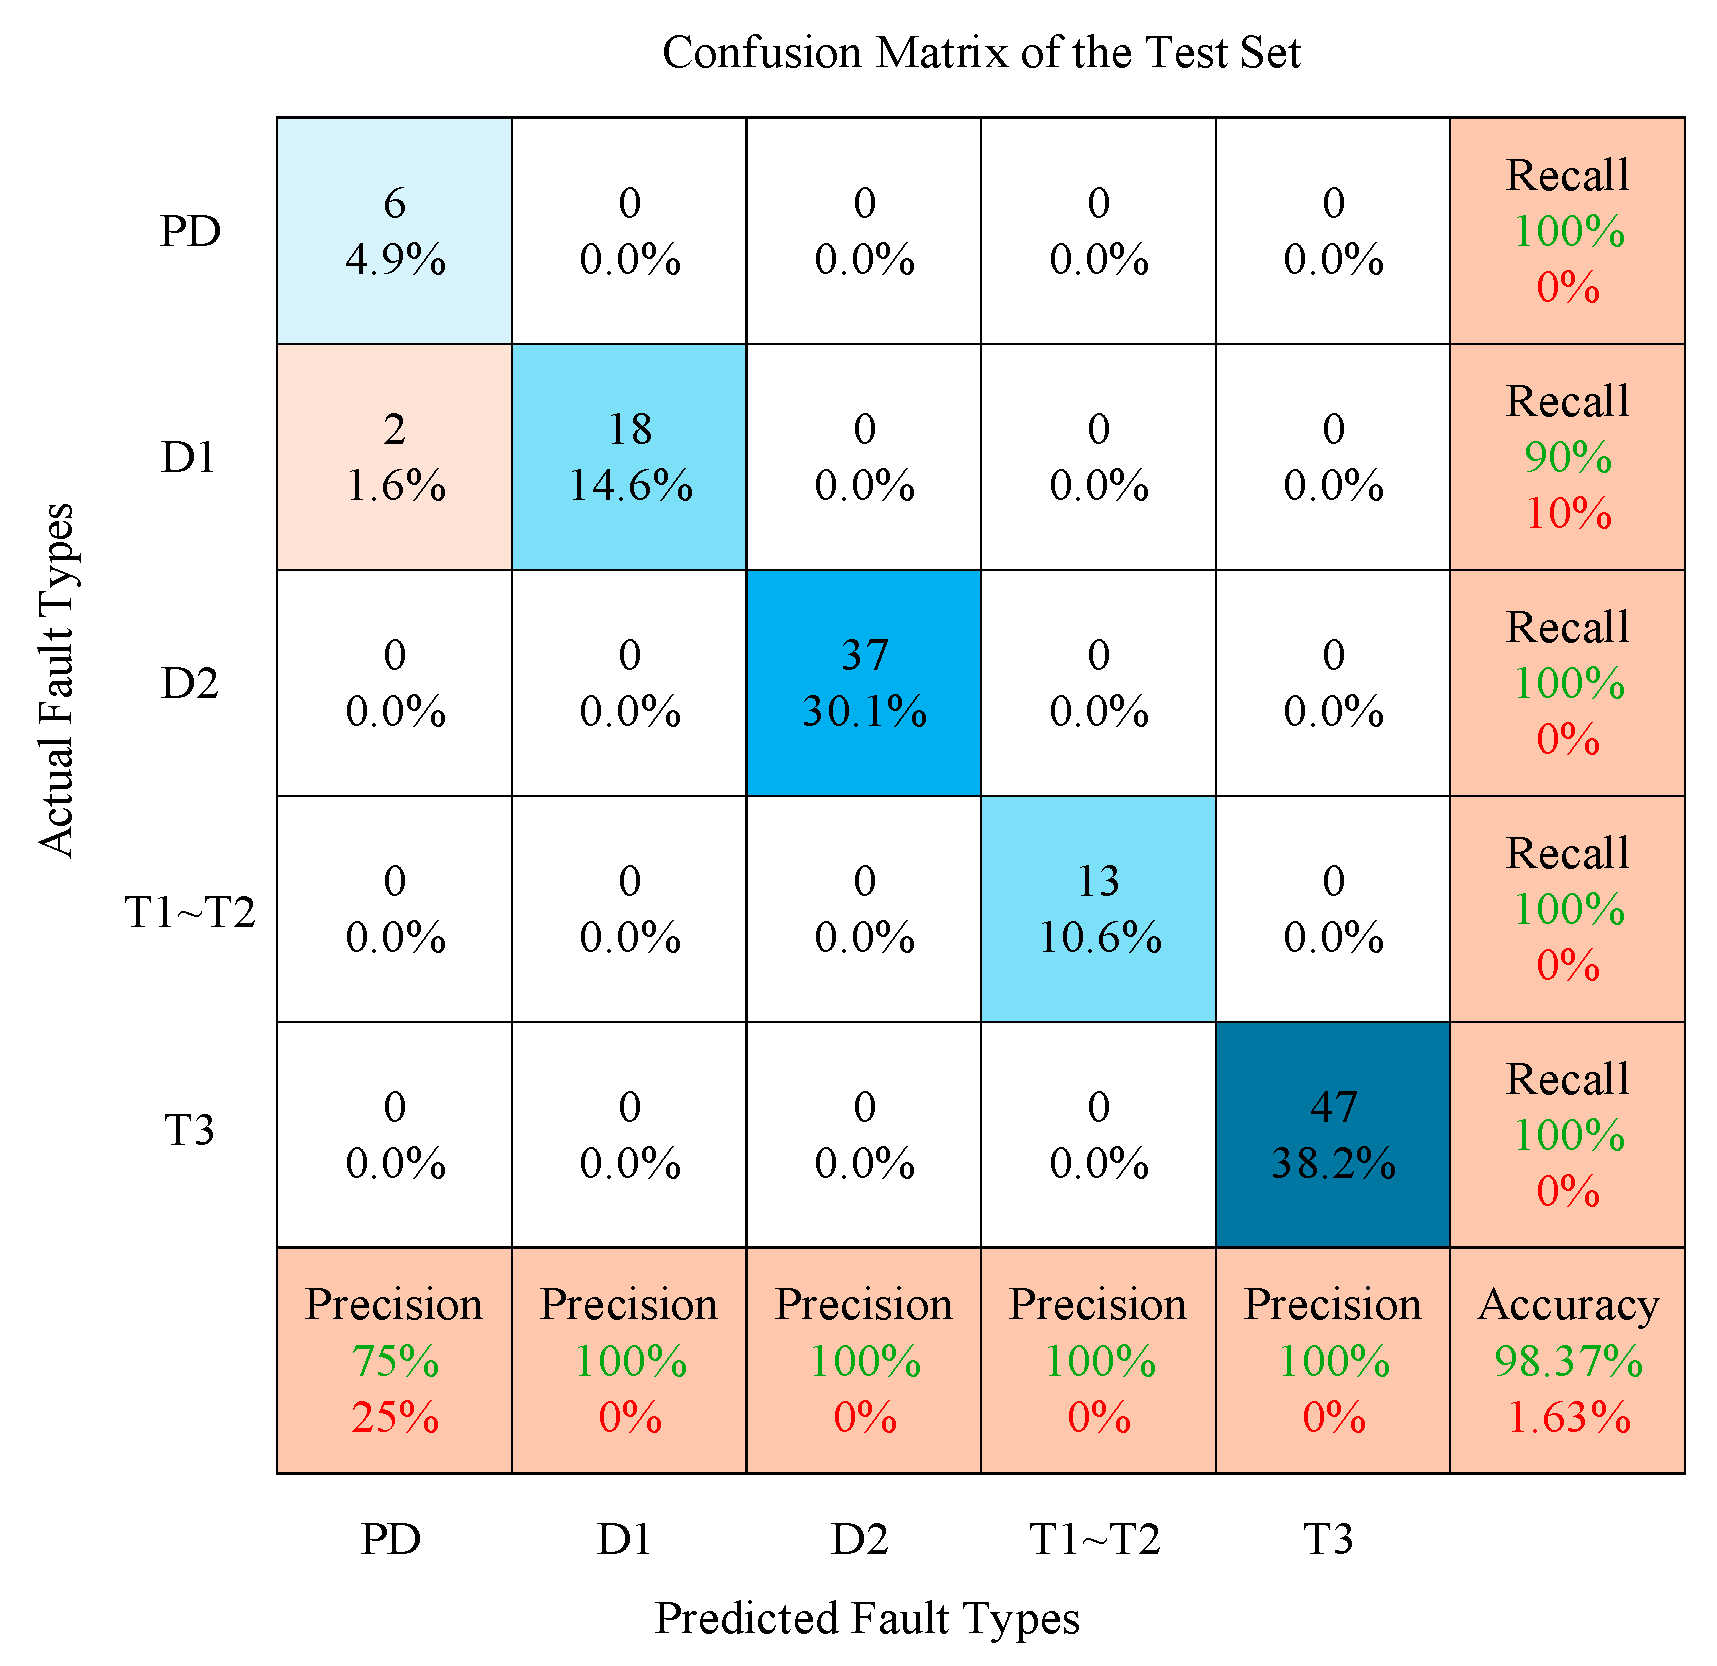
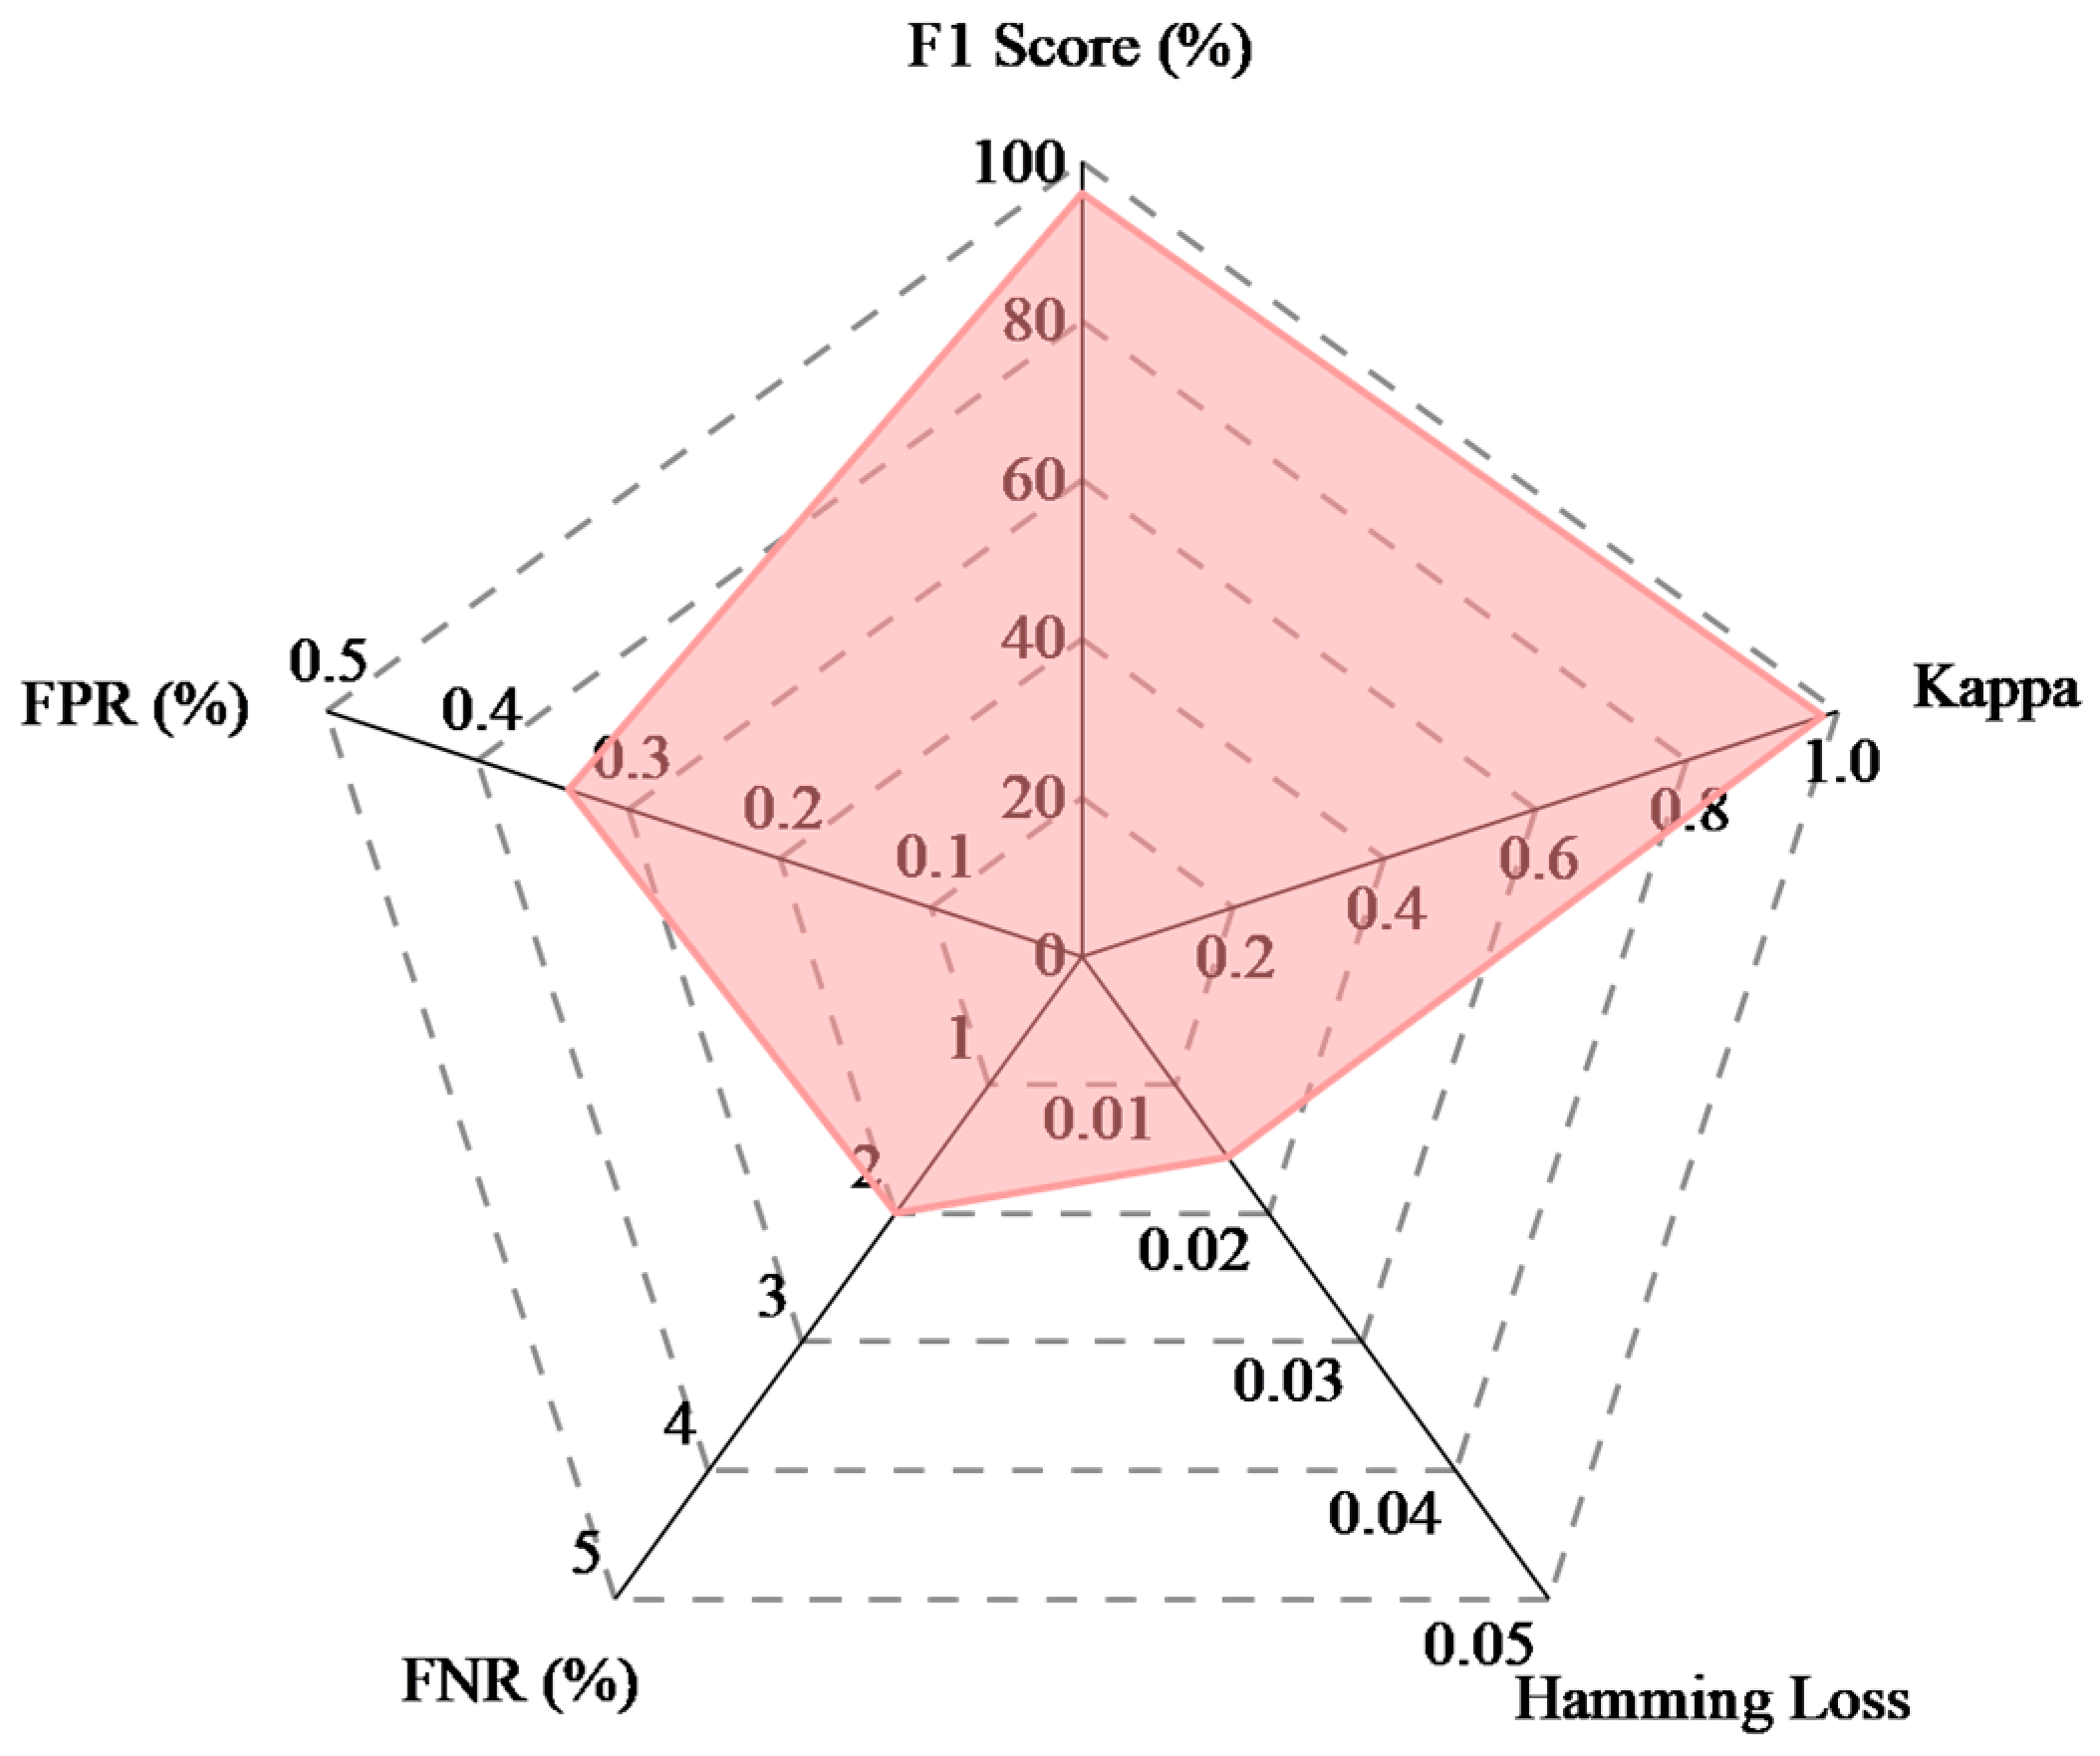
The transformer fault diagnosis results of the proposed method are shown in Figure 6, the confusion matrix is shown in Figure 7, and the evaluation index results are shown in Figure 8.
Analyzing Figure 6, Figure 7 and Figure 8, it can be seen that there are 123 fault samples in the test set, and a total of 2 samples are misclassified, and the overall accuracy of the model is 98.37%, with an overall Kappa coefficient of 0.98, and an overall leakage rate of less than 5%, which indicates that the proposed method has less misclassification and a stronger overall capability. The highest recall rate of high-temperature overheating, medium and low-temperature overheating, low-energy discharge, and high-energy discharge is 100%, the lowest recall rate of partial discharge is 75%, and the recall rate of all five fault types is above 90%, which verifies the good performance of the proposed model.

5.4. Comparative Analysis of Different Fault Classification Models

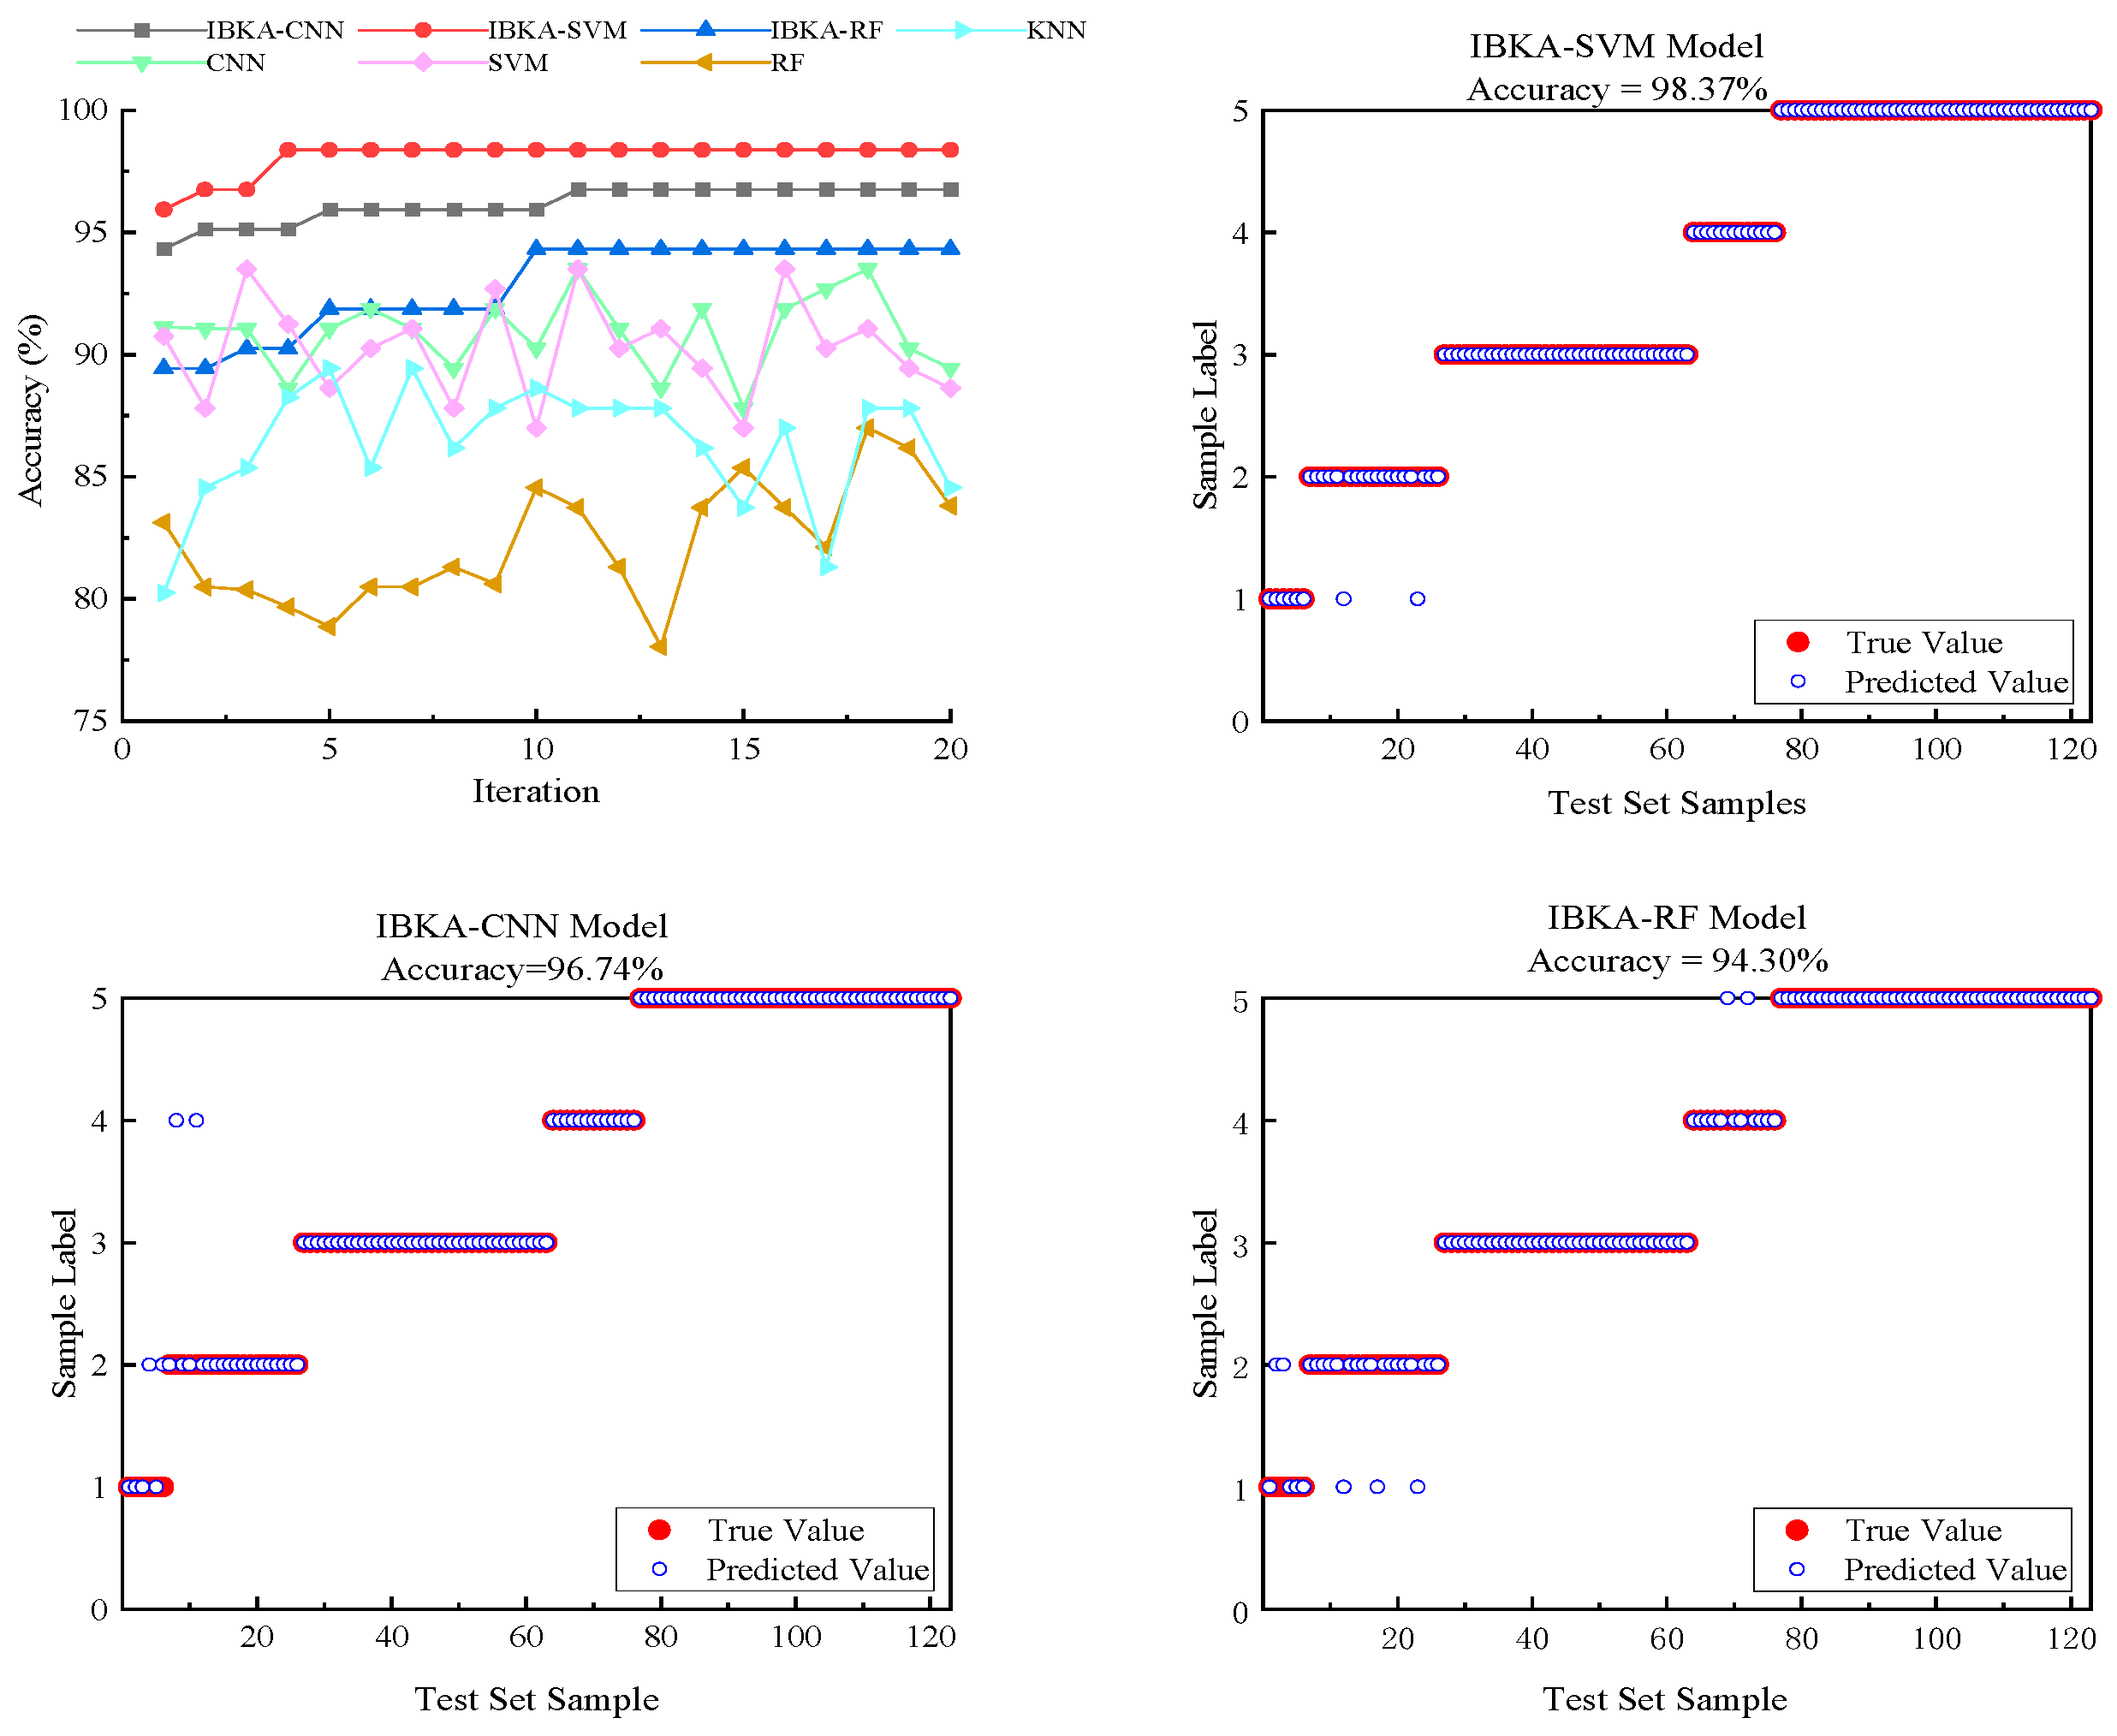
To validate the effectiveness of different classification methods, a subset of features constructed based on feature importance screening is used as model input, and the accuracy rate is used as the evaluation index. It is compared with classical classification models such as Convolutional Neural Network (CNN), K-Nearest Neighbor (KNN), Random Forest (RF), and optimized classical classification models (such as IBKA-CNN, IBKA-RF), and the relevant results are shown in Table 5 and Figure 9. For this study, the initial parameter settings for each model are as follows: The CNN adopts a two-layer structure, with 32 convolutional kernels in each layer and 2 pooling layers, with a batch size set to 64. The SVM uses the Radial Basis Function (RBF) kernel, with the regularization parameter C and the kernel parameter gamma set to 10 and 0.1, respectively. The KNN algorithm is configured with 5 neighbors, and a distance-weighted strategy is enabled.
From the analysis of Table 5 and Figure 9, it can be seen that in the transformer fault diagnosis model, the basic SVM model demonstrates a significant classification performance advantage. Compared to KNN, RF, and CNN, its discriminative accuracy is improved by 3.64%, 8.19%, and 0.32%, respectively. After further optimization with the IBKA, the comprehensive diagnostic accuracy of the IBKA-SVM model is improved by 7.78% compared to the basic SVM. At the same time, compared to similar optimized models IBKA-CNN and IBKA-RF, it achieves accuracy gains of 1.63% and 4.07%, respectively. The results show that the proposed method significantly enhances the diagnostic capability of the model, which further validates its technical advancement and robustness in engineering applications.

5.5. Comparative Analysis of Characteristic Variable Selection

To validate the superiority of the feature selection method proposed in this paper, a comparison is made using different types of feature variables. The selected features from each method are then input into the IBKA-SVM model for fault diagnosis. In this process, the penalty factor C has a search range of (0.1, 100); the kernel function parameter g has a search range of (0.1, 10); the population size N = 30; and the maximum number of iterations T = 50. The diagnostic results are shown in Table 6.
As shown in Table 6, when the basic gas feature set is used as the model input, the model fails to effectively capture the key features of the fault type, resulting in a relatively low diagnostic accuracy of only 68.25%. However, the eight-dimensional high-weight feature subset constructed based on the hybrid feature selection strategy significantly improves the model’s diagnostic accuracy to 98.37%. This indicates that the selected features not only enhance diagnostic accuracy but also reduce computational burden, thereby validating their importance and feasibility in optimizing fault diagnosis models.

5.6. Comparative Analysis of Different Optimization Algorithms

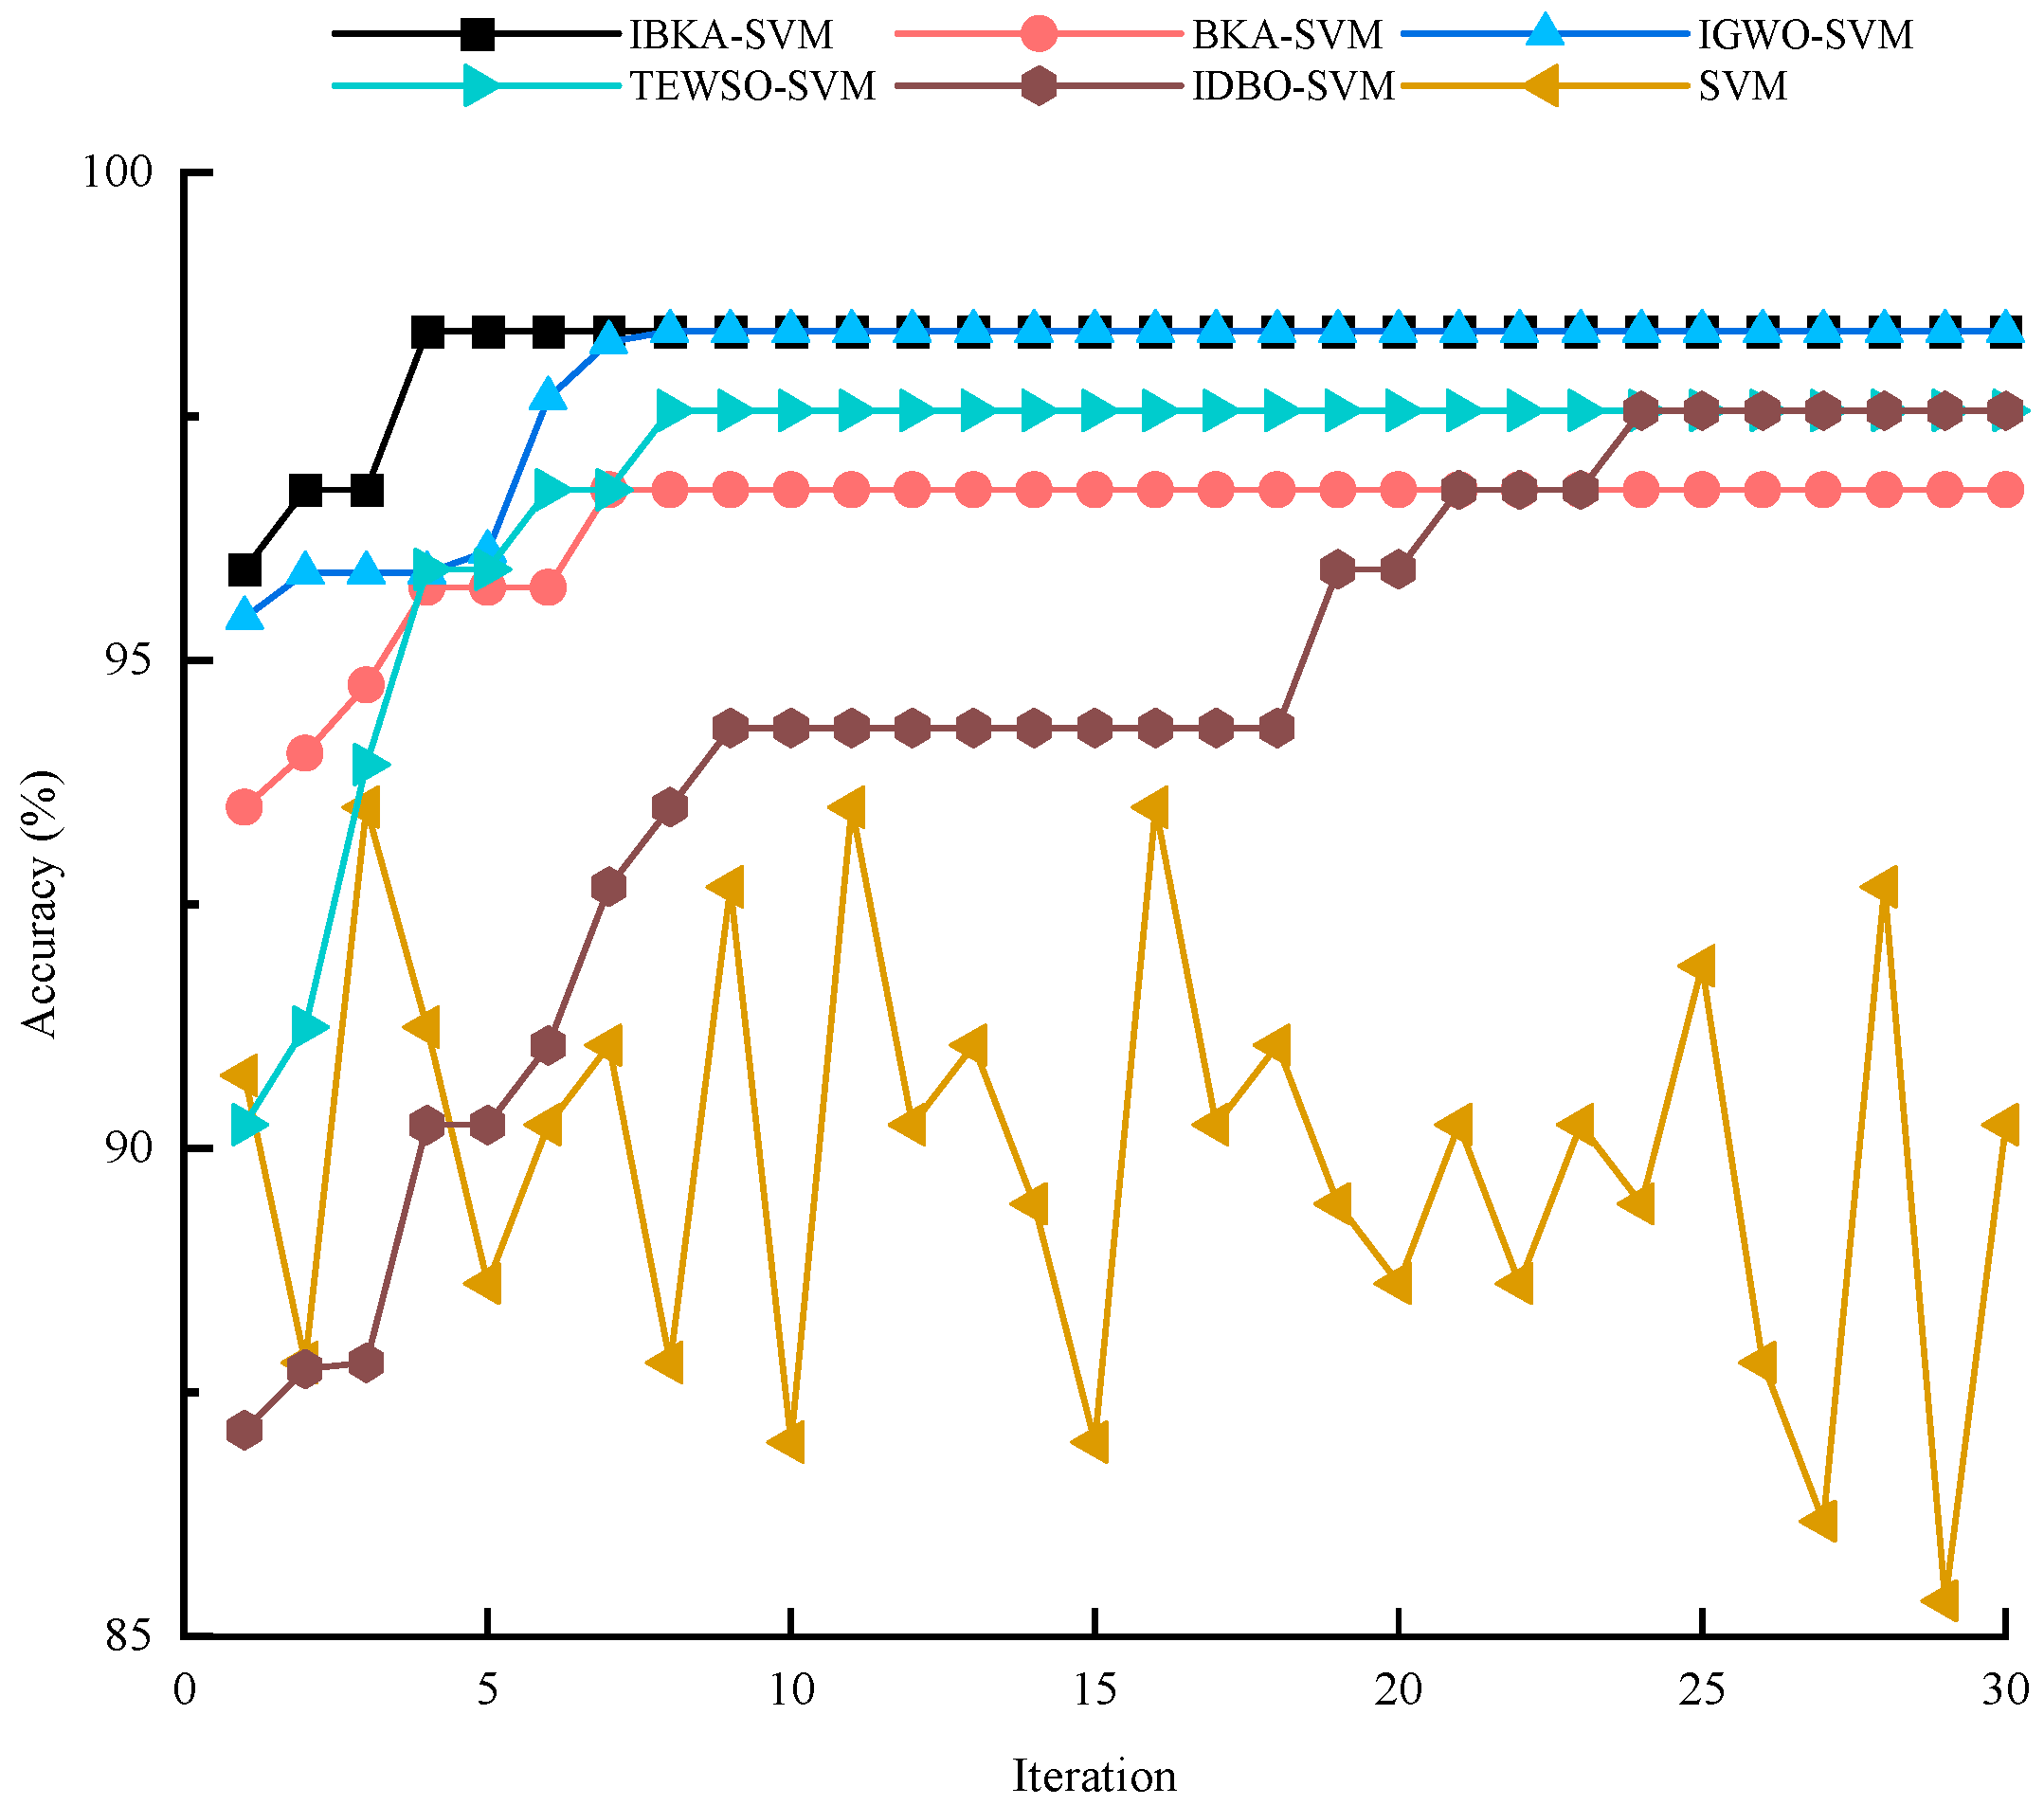
To validate the superiority of the IBKA-SVM model, the selected highly discriminative feature subset (8 dimensions) was used as the model input and compared with several advanced machine learning methods. For all optimization algorithms, the initial population size was set to 20, and the maximum number of iterations was set to 30. The results are presented in Table 7 and Figure 10.
Analysis of Table 7 and Table 8 and Figure 10 reveals that, compared to the baseline SVM model, all improved SVM methods—including IBKA-SVM, BKA-SVM, IGWO-SVM [38], IDBO-SVM [39], and TEWSO-SVM [15]—achieve significant improvements in accuracy. Notably, both IBKA-SVM and IGWO-SVM attain the highest accuracy of 98.37% owing to their strong global optimization capabilities. However, IBKA-SVM converges in only four iterations, demonstrating greater efficiency compared to IGWO-SVM, which requires eight iterations. Although the per-iteration time cost of IBKA-SVM (74.66 ms) is slightly higher, its rapid convergence reduces the total computational time to just 0.3 s. Furthermore, IBKA-SVM avoids the accuracy loss observed in TEWO-SVM due to accelerated convergence and fully satisfies the IEC 61850 standard [40] for sub-second response times required in real-time monitoring of power equipment.
In addition, due to the imbalance of data in the IEC TC10 dataset, existing methods generally face generalization challenges. To address this issue, the literature [41] proposes a new method that combines domain knowledge with capsule networks (CapsNet), achieving an accuracy rate of 95.93%. However, this method’s network model is complex. The methods proposed in the literature [42,43,44] significantly improve the accuracy of transformer diagnosis, but they often suffer from issues such as model complexity and slow computation speed. Through comprehensive comparisons with other methods, the superiority of the IBKA-SVM method in transformer fault diagnosis has been fully validated.

6. Discussion and Conclusions

To address the difficulty in extracting effective features from dissolved gases in transformer oil and the limited identification accuracy of fault diagnosis models, a transformer fault diagnosis method combining feature selection and IBKA-optimized SVM is proposed. The effectiveness of this method is verified through comparative analysis, and the following conclusions are drawn:
(1)
In the selection of feature variables for transformer fault diagnosis, by conducting quantitative analysis with LightGBM-RF and employing entropy weight-TOPSIS for comprehensive evaluation, an 8-dimensional subset of highly discriminative features was selected from the original 20-dimensional DGA feature set. This method effectively removes the influence of redundant features while preserving critical fault-sensitive information, resulting in a 60% reduction in model input dimensionality.
(2)
Aiming at the common problem that traditional optimization algorithms are prone to fall into local optimum, this paper adopts Tent chaotic mapping, Gompertz growth model, and Morlet wavelet variation strategy to improve the BKA algorithm. Benchmark tests based on the CEC2005 and CEC2017 functions demonstrate that, compared to the DOA, PSO, RIME, GWO, WOA, and BKA algorithms, the IBKA achieves at least a 15% improvement in convergence speed, thereby providing a highly robust foundation for SVM parameter optimization.
(3)
To address the limitations of manual experience in selecting SVM hyperparameters, the IBKA is used to optimize the penalty factor C and the kernel parameter g. The optimized SVM fault classification accuracy reaches 98.37%, which is 1.63% and 4.07% higher than that of the IBKA-CNN and the IBKA-RF, respectively. Moreover, convergence is achieved in only four iterations—50% fewer than IGWO-SVM—while the total computation time is just 0.3 s, fully meeting the real-time requirements of IEC 61850. On the imbalanced IEC TC10 dataset, the model attains a Kappa coefficient of 0.98 and a miss rate of less than 5%, demonstrating strong generalization capability.
(4)
It should be noted that the present study covers only the basic transformer fault types of single discharge (D1/D2) and overheating (T1–T3), and does not yet address more complex scenarios such as moisture-related faults or electrothermal composite faults. Future work will focus on exploring the correlation mechanisms between dissolved gas data and multiphysical field faults (e.g., the coupled effects of insulation moisture and overheating), with the goal of developing a more comprehensive fault diagnosis framework.

Author Contributions

Conceptualization, J.L. and F.W.; methodology, J.L. and F.W.; software, F.W.; validation, F.W.; formal analysis, J.L.; investigation, J.L.; resources, J.L.; data curation, F.W.; writing—original draft preparation, F.W.; writing—review and editing, J.L. All authors have read and agreed to the published version of the manuscript.

Funding

This research was funded by the National Natural Science Foundation of China (U1804149).

Data Availability Statement

The original contributions presented in this study are included in the article. Further inquiries can be directed to the corresponding author.

Conflicts of Interest

The authors declare no conflicts of interest.

References

  1. Sun, T.; Chen, X.; Du, M.; Guo, W.; Zhang, J.; Li, Y. LightGBM-ICOA-CNN Transformer Fault Diagnosis Method Based on DGA. J. Electr. Eng. 1–10. Available online: https://link.cnki.net/urlid/10.1289.TM.20240820.1122.012 (accessed on 4 August 2025).
  2. Shao, X.; Cai, B.; Zou, Z.; Shao, H.; Yang, C.; Liu, Y. Artificial intelligence enhanced fault prediction with industrial incomplete information. Mech. Syst. Signal Process. 2025, 224, 112063. [Google Scholar] [CrossRef]
  3. Taha, I.B.; Hoballah, A.; Ghoneim, S.S. Optimal ratio limits of rogers’ four-ratios and IEC 60599 code methods using particle swarm optimization fuzzy-logic approach. IEEE Trans. Dielectr. Electr. Insul. 2020, 27, 222–230. [Google Scholar] [CrossRef]
  4. Hechifa, A.; Lakehal, A.; Labiod, C.; Nanfak, A.; Mansour, D.-E.A.; Said, D. The effect of source data on graphical pentagons DGA methods for detecting incipient faults in power transformers. In Proceedings of the 2023 International Conference on Decision Aid Sciences and Applications (DASA), Annaba, Algeria, 21–23 November 2023; pp. 152–157. [Google Scholar]
  5. Hechifa, A.; Lakehal, A.; Nanfak, A.; Saidi, L.; Labiod, C.; Kelaiaia, R.; Ghoneim, S.S. Improved intelligent methods for power transformer fault diagnosis based on tree ensemble learning and multiple feature vector analysis. Electr. Eng. 2024, 106, 2575–2594. [Google Scholar] [CrossRef]
  6. Houxian, D.; Hao, L.; Longwu, L.; Jie, T.; Jianye, H.; Guoming, M. Power Transformer Fault Detection Based on Multi-Eigenvalues of Vibration Signal. Trans. China Electrotech. Soc. 2023, 38, 83–94. [Google Scholar] [CrossRef]
  7. Leijiao, G.; Wenlong, L.; Yusen, W.; Like, S. Data Augmentation Method for Transformer Fault Based on Improved Auto-Encoder Under the Condition of Insufficient Data. Trans. China Electrotech. Soc. 2021, 36, 84–94. [Google Scholar] [CrossRef]
  8. Leixiao, L.; Yigang, H.; Qixin, Y.; Zhikai, X. Zero-Shot Fault Diagnosis Technique of Transformer Based on Weighted Attribute Matrix. Trans. China Electrotech. Soc. 2024, 39, 6577–6590. [Google Scholar] [CrossRef]
  9. Yuwei, Z. Transformer Fault Diagnosis Based on Fuzzy Rogers 4 Rogers Method. Electr. Eng. 2021, 546, 89–92. [Google Scholar] [CrossRef]
  10. Zhao, B.; Yang, D.; Karimi, H.R.; Zhou, B.; Feng, S.; Li, G. Filter-wrapper combined feature selection and adaboost-weighted broad learning system for transformer fault diagnosis under imbalanced samples. Neurocomputing 2023, 560, 126803. [Google Scholar] [CrossRef]
  11. Huidong, W.; Haiyan, Y.; Qiang, G.; Xiaoling, Y.; Xufeng, Z.; Longkun, C. A transformer fault diagnosis method based on multiscale 1DCNN. J. Electr. Power Sci. Technol. 2023, 38, 104–112. [Google Scholar] [CrossRef]
  12. Ping, L.; Genming, H. Transformer Fault Diagnosis Method Based on the Fusion of Improved Neural Network and Ratio Method. High Volt. Eng. 2023, 49, 3898–3906. [Google Scholar] [CrossRef]
  13. Yuehan, Q.; Hongshan, Z.; Libo, M.; Shice, Z.; Zengqiang, M. Multi-depth Neural Network Synthesis Method for Power Transformer Fault Identification. Proc. CSEE 2021, 41, 8223–8231. [Google Scholar] [CrossRef]
  14. Haifeng, Q.; Ning, S.; Songlin, T. Research on the application of improved support vector machine in power transformer fault diagnosis. Electr. Meas. Instrum. 2022, 59, 48–53. [Google Scholar] [CrossRef]
  15. Hu, S.; Wu, J.; Ciren, O.; Zhu, R. Fault diagnosis of power transformers based on t-SNE and ECOC-TEWSO-SVM. AIP Adv. 2024, 14, 055126. [Google Scholar] [CrossRef]
  16. Xingzhen, B.; Yuan, Z.; Leijiao, G.; Changyun, L.; Jing, L.; Xiyao, Y. Selection Method of Feature Derived from Dissolved Gas in Oil for Transformers Fault Diagnosis. High Volt. Eng. 2023, 49, 3873–3886. [Google Scholar] [CrossRef]
  17. Yeshuang, Z.; Shichun, L.; Ling, L. Transformer Fault Diagnosis Based on Multi-strategy ISOA Optimized SVM. Digit. Power Grid Technol. 2023, 51, 38–44. [Google Scholar]
  18. Yunhao, L.; Richang, X.; Haiqiang, Z.; Feilong, Z.; Jiayang, L.; Wei, W.; Zengyue, L. Fault Diagnosis for Power Transformers Based on Improved Grey Wolf Algorithm Coupled with Least Squares Support Vector Machine. Power Syst. Technol. 2023, 47, 1470–1478. [Google Scholar] [CrossRef]
  19. Guozhi, Z.; Kang, C.; Rongxing, F.; Kun, W.; Xiaoxing, Z. Transformer fault diagnosis based on DGA and a whale algorithm optimizing a LogitBoost-decision tree. Power Syst. Prot. Control 2023, 51, 63–72. [Google Scholar] [CrossRef]
  20. Xue, W.; Tao, H. Transformer fault diagnosis based on Bayesian optimized random forest. Electr. Meas. Instrum. 2021, 58, 167–173. [Google Scholar] [CrossRef]
  21. Liqian, S.; Hongbo, L.; Yadong, H.; Chenhao, H.; Jiantao, Z. Short-Term Power Load Forecasting Based on Feature Selection and Optimized Extreme Learning Machine. J. Xi’an Jiaotong Univ. 2022, 56, 165–175. [Google Scholar]
  22. Wang, F.; Li, Z. ResearchontransformerfaultdiagnosisbasedonEBWO-SVM. Electron. Meas. Technol. 2024, 47, 101–107. [Google Scholar] [CrossRef]
  23. Kong, X.; Cai, B.; Yu, Y.; Yang, J.; Wang, B.; Liu, Z.; Shao, X.; Yang, C. Intelligent diagnosis method for early faults of electric-hydraulic control system based on residual analysis. Reliab. Eng. Syst. Saf. 2025, 261, 111142. [Google Scholar] [CrossRef]
  24. Liu, Z.; He, W.; Liu, H.; Luo, L.; Zhang, D.; Niu, B. Fault identification for power transformer based on dissolved gas in oil data using sparse convolutional neural networks. IET Gener. Transm. Distrib. 2024, 18, 517–529. [Google Scholar] [CrossRef]
  25. Shang, H.; Liu, Z.; Wei, Y.; Zhang, S. A Novel Fault Diagnosis Method for a Power Transformer Based on Multi-Scale Approximate Entropy and Optimized Convolutional Networks. Entropy 2024, 26, 186. [Google Scholar] [CrossRef]
  26. Li, Z.; Liu, F.; Yang, W.; Peng, S.; Zhou, J. A Survey of Convolutional Neural Networks: Analysis, Applications, and Prospects. IEEE Trans. Neural Netw. Learn. Syst. 2022, 33, 6999–7019. [Google Scholar] [CrossRef]
  27. Guoqing, A.; Zhewen, S.; Shifeng, M.; Xiaohui, H.; Zhenbin, D.; Chunlin, Z. Fault Diagnosis of WOA-SVM Transformer Based on RF Feature Optimization. High Volt. Appar. 2022, 58, 171–178. [Google Scholar] [CrossRef]
  28. Xin, O.; Zhibin, L. Transformer fault diagnosis technology based on sample expansion and feature. selection and SVM optimized by IGWO. Power Syst. Prot. Control 2023, 51, 11–20. [Google Scholar] [CrossRef]
  29. Jinxin, Y.; Caibo, L.; Xiong, H.; Wenqing, Z.; Xu, Z.; Bang, L. Transformer fault diagnosis based on DGA and TPE-LightGBM. J. Electr. Power Sci. Technol. 2024, 39, 70–77. [Google Scholar] [CrossRef]
  30. Du, C.; Zhang, J.; Fang, J. An innovative complex-valued encoding black-winged kite algorithm for global optimization. Sci. Rep. 2025, 15, 932. [Google Scholar] [CrossRef] [PubMed]
  31. Wang, J.; Wang, W.-C.; Hu, X.-X.; Qiu, L.; Zang, H.-F. Black-winged kite algorithm: A nature-inspired meta-heuristic for solving benchmark functions and engineering problems. Artif. Intell. Rev. 2024, 57, 98. [Google Scholar] [CrossRef]
  32. Zhao, H.; Li, P.; Duan, S.; Gu, J. Inversion of image-only intrinsic parameters for steel fibre concrete under combined rate-temperature conditions: An adaptively enhanced machine learning approach. J. Build. Eng. 2024, 94, 109836. [Google Scholar] [CrossRef]
  33. Chaoyueling, L.; Yunxin, Z.; Zhenyu, X.; Yulong, X.; Mingcheng, D.; Li, L. Improved GWO-SVM Transformer Fault Diagnosis Method Based on Borderline-SMOTE-IHT Mixed Sampling. Power Grid Anal. Study 2023, 51, 108–114. [Google Scholar]
  34. Xiangxi, Y.; Ying, Z.; Guozhi, Z.; Jun, L.; Mingwei, W. SCNGO-SVM-AdaBoost Transformer Fault Diagnosis Technology Based on Data Augmentation and Fault Feature Optimization. South. Power Syst. Technol. 2025, 19, 1–11. [Google Scholar]
  35. Xiaohua, Z.; Yuchen, F.; Xuchu, H.; Wenguang, L.; Yongge, L. Transformer Fault Diagnosis Based on SVM Optimized by Bald Eagle Search Algorithm. South. Power Syst. Technol. 2023, 17, 99–106+116. [Google Scholar] [CrossRef]
  36. DL/T 722-2014; Guide to the Analysis and the Diagnosis of Gases Dissolved in Transformer Oil. National Energy Administration: Beijing, China, 2014.
  37. IEC 60599:2015; Mineral Oil-Impregnated Electrical Equipment in Service—Guide to the Interpretation of Dissolved and Free Gases Analysis. International Electrotechnical Commission: Geneva, Switzerland, 2015.
  38. Wei, S. Transformer Fault Diagnosis Based on DLH-GWO-SVM. J. Phys. Conf. Ser. 2023, 2527, 012050. [Google Scholar] [CrossRef]
  39. Zhang, S.; Zhou, H. Transformer Fault Diagnosis Based on Multi-Strategy Enhanced Dung Beetle Algorithm and Optimized SVM. Energies 2024, 17, 6296. [Google Scholar] [CrossRef]
  40. IEC/IEEE 61850-9-3:2016; Communication Networks and Systems for Power Utility Automation—Part 9-3: Precision Time Protocol Profile for Power Utility Automation. IEC/IEEE: Geneva, Switzerland, 2016. [CrossRef]
  41. Shi, X.; Li, T.; Fang, F.; Zhu, Y.; Yang, W.; Luo, B. Dissolved gas analysis for power transformer fault diagnosis combining domain knowledge and capsule network. IEEE Trans. Dielectr. Electr. Insul. 2024, 31, 3386–3395. [Google Scholar] [CrossRef]
  42. Guan, S.; Yang, H.; Wu, T. Transformer fault diagnosis method based on TLR-ADASYN balanced dataset. Sci. Rep. 2023, 13, 23010. [Google Scholar] [CrossRef] [PubMed]
  43. Li, J.; Hai, C.; Feng, Z.; Li, G. A Transformer Fault Diagnosis Method Based on Parameters Optimization of Hybrid Kernel Extreme Learning Machine. IEEE Access 2021, 9, 126891–126902. [Google Scholar] [CrossRef]
  44. Yang, X.; Chen, W.; Li, A.; Yang, C.; Xie, Z.; Dong, H. BA-PNN-based methods for power transformer fault diagnosis. Adv. Eng. Inform. 2019, 39, 178–185. [Google Scholar] [CrossRef]
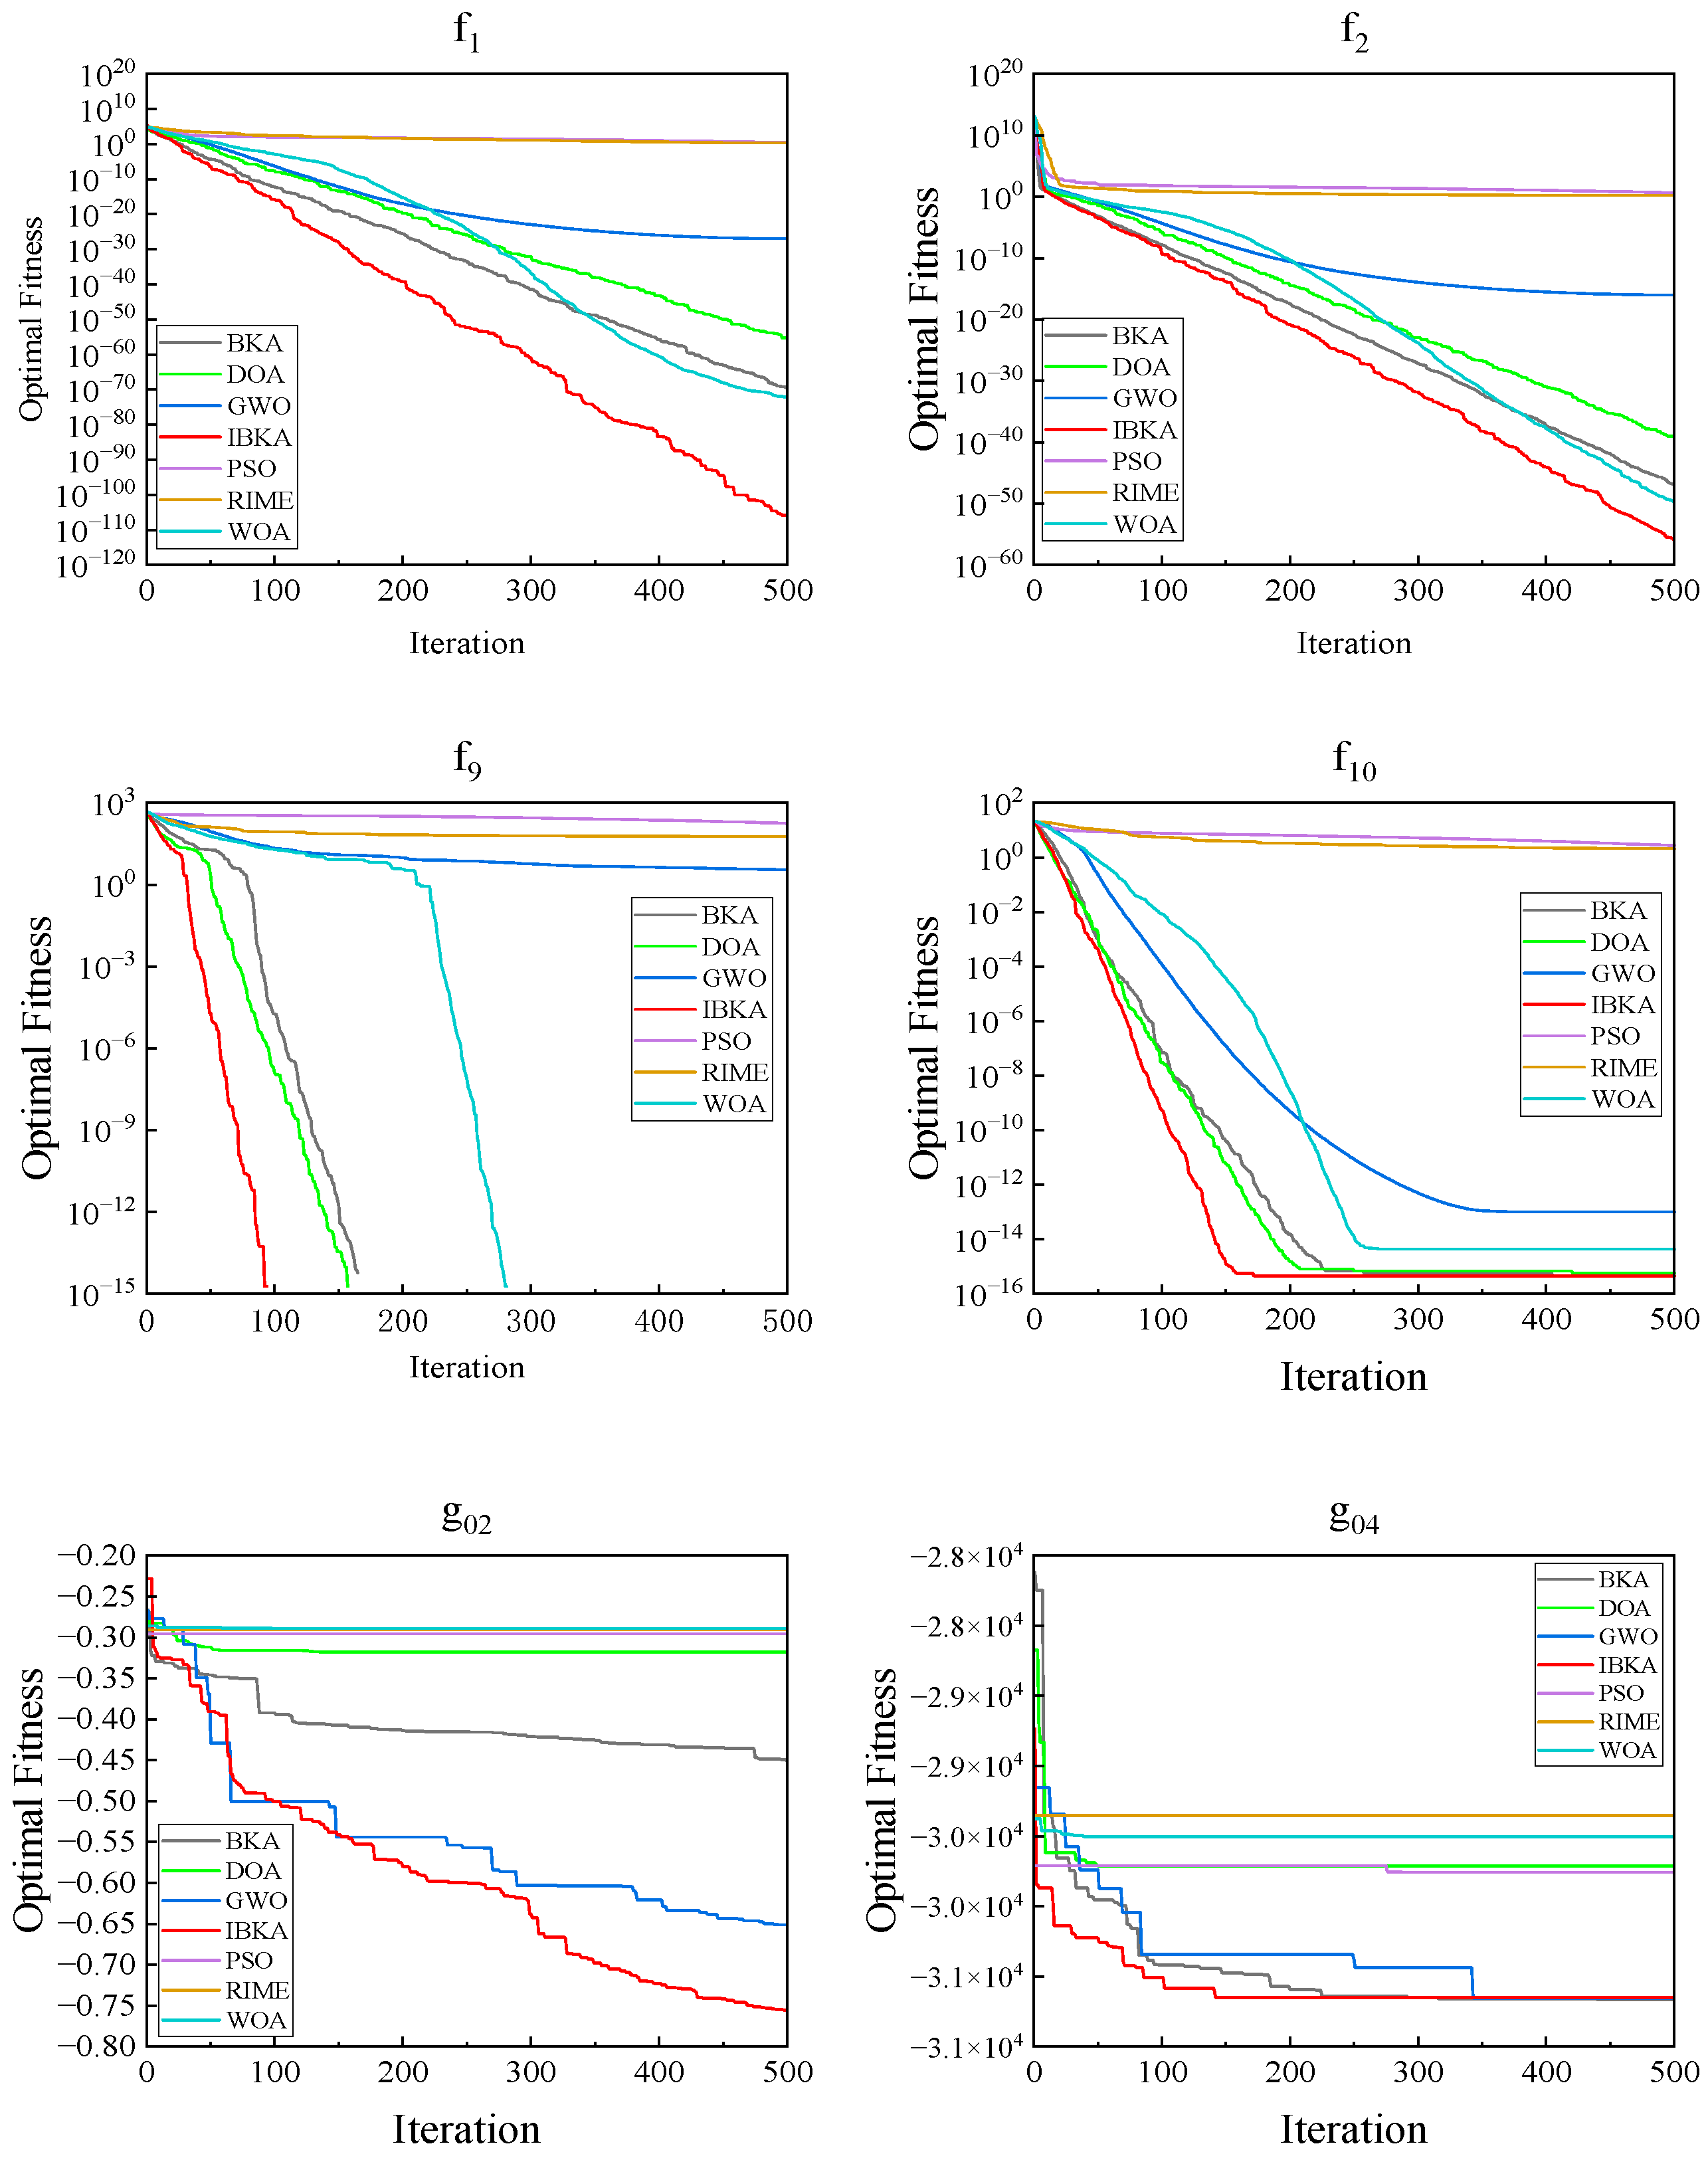
Figure 1. Convergence curves of different algorithms.
Electronics 14 03160 g001
Figure 2. Transformer fault diagnosis flow chart.
Electronics 14 03160 g002
Figure 3. Importance score of fault candidate feature set.
Electronics 14 03160 g003
Figure 4. Characteristic variable importance results.
Electronics 14 03160 g004
Figure 5. IBKA iteration curves for different strategies.
Electronics 14 03160 g005
Figure 6. Transformer diagnosis results.
Electronics 14 03160 g006
Figure 7. Confusion matrix of fault diagnosis results.
Electronics 14 03160 g007
Figure 8. Evaluation coefficients of the diagnostic model.
Electronics 14 03160 g008
Figure 9. Comparison of accuracy of different classification methods.
Electronics 14 03160 g009
Figure 10. Comparison of different optimization algorithms.
Electronics 14 03160 g010
Table 1. Feature sets.
NumberFeatureNumberFeature
1n(H2)11n(C2H4)/n(CH4)
2n(CH4)12n(C2H4)/n(C2H6)
3n(C2H2)13n(C2H6)/n(H2)
4n(C2H4)14n(CH4)/n(C2H6)
5n(C2H6)15n(CH4)/n(H2)
6n(C2H2)/n(H2)16n(H2)/n(TH)
7n(C2H2)/n(CH4)17n(CH4)/n(TH)
8n(C2H2)/n(C2H6)18n(C2H2)/n(TH)
9n(C2H2)/n(C2H4)19n(C2H4)/n(TH)
10n(C2H4)/n(H2)20n(C2H6)/n(TH)
Table 2. Classic test functions.
Test FunctionSearch RangeOptimal Solution
F 1 ( x ) = i = 1 D x i 2 [−100, 100]0
F 2 ( x ) = i = 1 D | x i | + i = 1 D | x i | [−100, 100]0
F 9 ( x ) = i = 1 D x i 2 10 c o s ( 2 π x i ) + 10 [−5.12, 5.12]0
F 10 ( x ) = 20 exp u ( x ) exp ( v ( x ) ) + 20 + e [−32, 32]0
g 2 ( x ) = i = 1 n cos 4 ( x i ) 2 i = 1 n cos 2 ( x i ) i = 1 n i x i 2 [0, 10]−0.803619
g 4 ( x ) = 5.3578547 x 3 2 + 0.8356891 x 1 x 5 + 37.293239 x 1 40792.141 [78, 102]
[33, 45]
[27, 45]
−30,665.539
Table 3. Fault sample distribution and coding.
Operating ConditionStatus CodeNumber of Samples
Partial Discharge120
Low-Energy Discharge266
High-Energy Discharge3124
Low-to-Medium Temperature Overheating444
High-Temperature Overheating5156
Table 4. Introducing different strategies to improve BKA.
AlgorithmIntroduced StrategiesParameter Settings
BKANoneNone
IBKA1Tent chaotic mapu = 0.5
IBKA2Tent chaotic mapu = 0.5
Gompertz modelA = 1.0, B = 0.5, Y = 0.1
IBKA3Tent chaotic mapu = 0.5
Gompertz modelA = 1.0, B = 0.5, Y = 0.1
Morlet wavelet variationa = 5, b = 10
Table 5. Accuracy of different fault classification methods.
Classification MethodAccuracy (%)
CNN90.27
SVM90.59
RF82.40
KNN86.95
IBKA-CNN96.74
IBKA-RF94.30
IBKA-SVM98.37
Table 6. Comparison and analysis of different characteristic variables.
Feature Variable TypeParameters (C, g)Accuracy (%)
Three-Ratio Method(11.74, 1.68)73.81
Rogers Ratio Method(31.2, 7.23)84.13
Basic Features(23.34, 1.27)68.25
Hybrid feature selection(42.4, 3.32)98.37
Table 7. Fault accuracy of different optimization methods.
ModelsAccuracy (%)Convergence IterationsTime per
Iteration (ms)
Total Time (s)
IBKA-SVM98.37474.660.3
BKA-SVM96.74764.180.45
IGWO-SVM98.37843.950.35
IDBO-SVM97.562434.520.83
TEWSO-SVM97.56835.750.28
Table 8. Evaluation coefficients of different optimization algorithms.
Model NameAccuracy (%)F1 Score (%)KappaRecall (%)FPR (%)
IBKA-SVM98.3796.090.980198.000.34
CapsNet95.9391.70.950591.591.03
MGWO-KELM92.6889.180.910490.661.77
SO-RF96.7593.370.960395.460.78
GA-BPNN95.9392.590.943894.381.04
Disclaimer/Publisher’s Note: The statements, opinions and data contained in all publications are solely those of the individual author(s) and contributor(s) and not of MDPI and/or the editor(s). MDPI and/or the editor(s) disclaim responsibility for any injury to people or property resulting from any ideas, methods, instructions or products referred to in the content.