
Design of an Interactive System by Combining Affective Computing Technology with Music for Stress Relief


Abstract
1. Introduction
1.1. Research Background
1.2. Research Motivation
1.3. Research Objectives
- (1)
- Can a wearable EEG device effectively detect users’ emotional states in the context of an interactive, music-based relaxation experience?
- (2)
- Does transforming brainwave data into visual feedback help users become more aware of their emotional responses?
- (3)
- Does the combination of EEG-based emotional detection, music-assisted care, and visual emotional feedback lead to improved subjective feelings of relaxation and emotional clarity among users?
- (1)
- To explore the integration of music in interactive systems for stress reduction;
- (2)
- To propose design principles based on literature and expert input;
- (3)
- To develop a wearable EEG-based interactive system using music as the input, integrating it with EEG signals from a brainwave device to conduct stress-relief research;
- (4)
- To verify the role of emotional sensing in promoting relaxation through musical interaction and visual presentation; and
- (5)
- To examine the impact of visual emotional feedback on user awareness and engagement.
1.4. Limitations of This Study
- (1)
- The term music therapy, as used in this article, is not intended to denote clinical psychological treatment; to avoid misunderstanding, the term music-assisted care is used where appropriate;
- (2)
- All experiments were conducted in a controlled environment free from external disturbances to ensure a comfortable and secure experience;
- (3)
- Participants were aged 18 to 24; and
- (4)
- The evaluation of the system’s effectiveness is based on post-experience surveys and interviews, without comparisons between pre- and post-experience data or a control group.
1.5. Research Process of This Study
- (1)
- Selection of research topic—involving the design of the research direction and selection of research goals.
- (2)
- Literature review—covering relevant studies in music-assisted care, interactive technology, and emotion sensing.
- (3)
- System development—including the establishment of design principles, system design, and prototype construction.
- (4)
- Experience and evaluation—comprising a preliminary experiment, prototype modification, and a formal experiment:
- (a)
- Preliminary experiment—involving initial field tests with users and experts, followed by user interviews and expert interviews to gather feedback;
- (b)
- Prototype modification—refining the prototype based on collected feedback;
- (c)
- Formal experiment—inviting additional users to test the updated prototype, followed by user interviews and a questionnaire survey, with EEG data and user feedback analyzed to assess emotional responses and user experience.
- (5)
- Analysis and conclusion—involving the analysis of research results, conclusions drawn from the study, and suggestions for future work.
2. Literature Review
2.1. Psychological Stress
2.1.1. Definition of Psychological Stress
- (1)
- Alarm stage—The body reacts to stress by going into “fight or flight” mode. Heart rate rises, and stress hormones like adrenaline are released to provide extra energy.
- (2)
- Resistance stage—The body starts to calm down, but stays alert. Hormone levels begin to drop, but if stress continues, they stay high. People may seem to cope, but can feel irritable, frustrated, or have trouble concentrating.
- (3)
- Exhaustion stage—Long-term stress wears the body out. Energy runs low, making it harder to cope. People may feel tired, hopeless, or emotionally drained, often experiencing fatigue, depression, or anxiety.
2.1.2. Youth Life Stress
2.1.3. Stress Relief Methods
2.2. Music Therapy
2.2.1. Definition of Music Therapy
2.2.2. Music Therapy and Therapeutic Application Models
- (A)
- Psychodynamic-oriented music therapy—This approach treats music as a therapeutic medium comparable to verbal psychotherapy. Rooted in Freudian concepts—such as the unconscious, the ego, and transference—it emphasizes emotional expression, personality transformation, and an active therapeutic relationship [23,24]. Sessions are typically held once or twice a week. This method remains influential and is widely used in clinical practice.
- (B)
- Guided imagery and music therapy (GIM)—Developed by Helen Bonny in the 1970s [25], GIM combines psychodynamic theory with music-guided introspection. In a relaxed state, clients listen to selected classical music, which evokes emotional and symbolic imagery to support self-awareness and growth. A typical GIM session includes four phases: (1) initial discussion and music selection, (2) induction into a relaxed state, (3) music listening with therapist guidance, and (4) post-session integration of insights into daily life.
2.3. Emotional Detection
2.3.1. Definition of Emotion
2.3.2. Music and Emotion
2.3.3. Classification of Emotions
2.3.4. Affective Computing
- (1)
- Emotion recognition, which involves identifying emotions through physiological signals or external inputs using computational methods;
- (2)
- Emotion expression, where computers respond appropriately to recognized emotions;
- (3)
- having emotions, which explores enabling machines to exhibit emotional behaviors influenced by stimuli; and
- (4)
- Emotional intelligence, where systems regulate and balance their own emotional states.
2.3.5. Measurement of Brainwaves and Emotions
2.3.6. Brainwaves and Their Applications in Daily Life
- (1)
- Neurocam [47]—a wearable system that uses brainwave input to trigger smartphone-based recording, capturing 5-s memory GIF (graphics interchange format) images when emotional arousal exceeds a threshold, and is designed for entertainment by combining EEG sensing with visual memory capture.
- (2)
- Eunoia [48]—an interactive installation that converts brainwave data into sound waves, which ripple water in a pool to visually reflect the user’s mental state, using EEG input to adjust audio parameters and promote emotional observation through a multisensory experience.
- (3)
- Meditation Interaction Device [49]—a wearable system, produced by InteraXon Inc., headquartered in Toronto, Ontario, Canada, monitors relaxation through brainwave signals and uses colored lights, nature sounds, and fragrance feedback to guide meditation, with the degree of lotus flower bloom visualizing the user’s relaxation level for emotional observation.
- (4)
- Mind-Reading Tree [50]—an EEG-based artwork that visualizes user relaxation through a growing virtual tree and animated natural scenes, using brainwave input to trigger changes in projected visuals and ambient effects to promote calmness in an entertainment setting.
- (5)
- Muse 2 [51]—a brainwave-sensing device, manufactured by InteraXon Inc. in Toronto, Canada, tracks relaxation, focus, heart rate, and breathing via EEG and other physiological signals, displaying real-time data in smartphone charts to support meditation, stress reduction, and self-observation.
2.4. Interactive Technology
2.4.1. Human–Computer Interaction
2.4.2. Case Studies of Music Applied in Interactive Technology
- (1)
- McTrax [56]—a music placemat developed by McDonald’s Nederland, using conductive ink and Bluetooth to let users compose and mix music directly on the mat via smartphone, promoting intuitive music-making and brand interaction.
- (2)
- Archifon [57]—an interactive church installation where laser-pointing at architectural elements triggers unique sounds and illuminations, turning the space into a collaborative, immersive musical instrument.
- (3)
- LINES [58]—a sound art exhibition featuring suspended and wall-mounted lines that trigger diverse sounds upon contact, enabling multiple users to create music simultaneously and explore new musical expressions.
- (4)
- Embracing X Surroundings [59]—an installation blending traditional and natural sounds in a bamboo structure, where visitors physically engage with ambient audio and filtered light to deepen their connection with nature.
- (5)
- Dream Sound [60]—an audiovisual work that synchronizes frame-by-frame animation with music, using viewer-triggered sensors to vary soundtracks and visuals, enhancing subconscious perception of musical flow.
2.5. A Summary of Literature Survey and Derivation of Design Principles
- (1)
- Emotion-sensing is implemented using NeuroSky’s portable MindWave Mobile EEG device, reducing physical burden and facilitating data collection.
- (2)
- The system process is structured according to the static activity model by Jaremko and Meichenbaum [14], emphasizing relaxation, music, and meditation to guide emotional calming and cognitive restructuring.
- (3)
- The four-phase model of guided imagery and music by Bonny [25] is applied, focusing on the induction (relaxation/focus) and music listening (guided imagery) phases.
- (4)
- Music selections include crystal, α wave, and classical music, characterized by slow tempos and subtle melodies, intended to relax both mind and body.
- (5)
- EEG data are segmented and analyzed, with emotional feedback visualized through colorful images representing seasons, weather, oceans, and similar themes to reflect participants’ emotional states.
3. Methods
3.1. Concepts and Selections of Research Methods
3.2. System Development
3.3. Interview Survey
3.4. Questionaire Survey
4. System Design
4.1. Design Ideas of Proposed System
4.2. Architecture of the Proposed System
4.3. Interactive Experience Flow and Interface Design of the Work
- (1)
- Initial Setup—
- (i)
- User seated—The user is guided to be seated by the proposed system and wear a brainwave headset, and the experimental procedure is explained.
- (ii)
- Login in—A login screen is displayed, asking a researcher to start the system.
- (iii)
- Device connection—Device connection is conducted to establish communication between the system and the EEG.
- (iv)
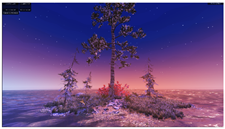
- Standby screen—The island in the visual display appears barren, with no tree present; and an audio prompt is given to instruct the user to focus intently on the island.
- (2)
- Growing Phase (Pre-Session Conversation)—
- (i)
- Tree growth initiated—Tree growth on the island is initiated when the user’s real-time EEG attention value surpasses a designated threshold.
- (ii)
- Tree growth accelerated—Higher attention levels accelerate tree growth, while increased meditation levels enhance the density of the island’s vegetation.
- (3)
- Stress Phase—
- (i)
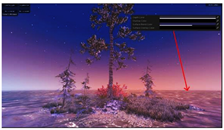
- Increasing pressure—After tree growth finishes, the ocean wave parameters are increased to create intense waves, increasing the sense of psychological pressure.
- (ii)
- Screen darkened—The system gradually darkens the scene to create further an immersive atmosphere of pressure.
- (4)
- Music Listening Phase—
- (i)
- Immerse in music—The user is prompted by the system to relax his/her body, close their eyes, listen to the music, and fully immerse themselves in the music for 2.5 min. The user is then prompted to open their eyes afterwards.
- (ii)
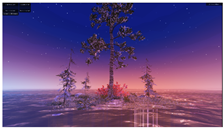
- Visual scene changes—Various visual scenes are displayed on the screen to guide the user through different emotional states, including: (a) four seasons; (b) varying plant sizes and leaf densities; (c) varying wind strength; (d) varying rain quantity.
- (5)
- Viewing Phase (Post-Session Integration)—
- (i)
- Emotional calming—The user continues music listening for an additional 2.5 min to settle their emotions.
- (ii)
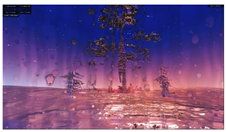
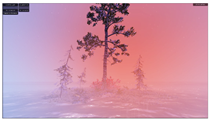
- Emotion analysis—The user’s brainwaves are read to yield an emotion type with its visual display presented: (a) anxiety; (b) tension; (c) blankness; (d) relaxation. Each user was presented with a single emotional visualization during the viewing phase, customized based on their averaged EEG data during the music listening phase.
- (6)
- Session End—
- (i)
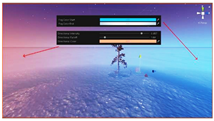
- Showing emotion diagram—When the music ends, an emotion diagram, including the user’s “relaxation level” and the corresponding “emotional state”, is generated based on all the emotion data and presented on the screen for the user to view.
- (ii)
- Screen darkened—When the time is up, a notification indicating the end of detection is displayed, the screen gradually darkens, and the data are saved.
- (iii)
- Detection ended—A message appears, instructing the participant to remove the brainwave headset.
4.4. Creation of Visual Scenes for Emotion Representaiton
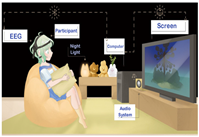
- (1)
- Emotion-sensing module—While seated comfortably, the user wears an EEG headset that captures brainwave signals and transmits them via a Bluetooth device to a computer.
- (2)
- Processing module—EEG data are analyzed in real time to identify the user’s emotional state and generate the corresponding visual and auditory feedback.
- (3)
- Feedback display module—Based on the analysis, the system presents dynamic visualizations on screen that reflect the user’s emotional changes.
4.4.1. Ocean Visualization and Parameter Control
4.4.2. Mist Visualization and Parameter Control
4.4.3. Island Visualization and Parameter Control
4.4.4. Interactive Feedback and Triggers
- Relaxation: in the range with meditation = (0, 50) and attention = (0, 50);
- Blankness: in the range with meditation = (0, 50) and attention = (−50, 0);
- Tension: in the range with meditation = (−50, 0) and attention = (0, 50); and
- Anxiety: in the range with meditation = (−50, 0) and attention = (−50, 0).
5. System Experience and Data Analysis
5.1. Preliminary Experiment
5.1.1. User Interaction and Feedback Interviews
- (1)
- Objective—Users tested four music tracks with relaxing elements while wearing an EEG headset. Brainwave data (average meditation values) were collected, and semi-structured interviews assessed whether visuals, music, and feedback effectively conveyed relaxation and aligned with emotional states.
- (2)
- Participants—11 persons aged 18–24.
- (3)
- Equipment—NeuroSky’s EEG headset and the prototype system “Serenity Island”.
- (4)
- Procedure—After setup and instructions, participants experienced four 2-min music sessions while observing the system in operation (with EEG monitoring and system resets between each) and then completed a semi-structured interview.
- (5)
- Interview process—Sessions lasting 10 to 15 min focused on two aspects, “theme and stress relief” and “visuals and emotions”, recorded via audio and written notes. The interview questions are listed in Table 10.
- (6)
- Findings from the user interviews—
- (a)
- About theme and stress relief—Most participants reported using music, rest, games, or exercise to relax and responded positively to natural sounds like water and birds. The prototype was seen as calming, though suggestions included adding more nature visuals and improving immersion. The guided narration received mixed feedback, with calls for a softer tone and clearer, better-paced audio.
- (b)
- About visuals and emotions—Participants generally noticed visual changes (e.g., tree growth) linked to emotional states, though some found them too subtle. The color scheme was viewed as calming, though bright or saturated elements were discouraged. For anxiety, darker tones and intense weather were preferred; for relaxation, visuals were mostly effective with minor suggestions to enhance immersion.
5.1.2. Identification of Optimal Relaxation Music
5.1.3. Expert Engagement and Post-Use Interviews
- (1)
- Invited experts—Three psychological counseling experts, specializing in psychotherapy, art therapy, and student counseling, were selected for this study. These professionals primarily work with university students and possess extensive experience in psychological support and therapy (see Table 14).
- (2)
- Before-interview activity—The experts participated in the same interactive experience with the prototype system as the 11 participants mentioned above.
- (3)
- Interview process—Each expert was interviewed for approximately 40 min using a semi-structured, one-on-one format. The interviews focused mainly on the two aspects “feasibility of the project concept” and “elements and important details of the work”, with a particular emphasis on integrating music-assisted care and wearable EEG technology. Sessions were audio-recorded and supplemented with notes. A list of interview questions is provided in Table 15.
- (4)
- Findings from expert interviews: (a) the system “Serenity Island” was commended for its innovation and entertainment value, though some counseling-based elements require refinement; (b) EEG-driven visual scenes were effective in helping users recognize their emotions; (c) All four music tracks were considered suitable for relaxation and were used to guide the final selection process; (d) the narration should adopt a gentler tone, and tree growth content should avoid evoking stressful memories; (e) emotion visuals were well received except for the “blankness” scene, which needs minor visual and color adjustments; (f) the atmosphere could be enhanced with soft yellow lighting and comforting elements like sofas and plush toys to foster a sense of safety.
5.1.4. Prototype Refinement Based on Feedback
- (1)
- System implementation improvements—
- (i)
- The guided narration was re-recorded with a softer tone.
- (ii)
- The growing phase narration was revised to: “Please recall a recent troubling matter that has left you indecisive—Serenity Island will transform this into growth energy”.
- (iii)
- The growth curve driven by attention and meditation values was adjusted.
- (iv)
- The transition animation between the growing and music listening phases was refined for smoother flow.
- (v)
- The four emotional scenes were revised, as detailed in Table 16.
- (2)
- Surrounding Environment improvements (as shown in Table 17)—
- (i)
- A soft yellow night light was added to the experiment site.
- (ii)
- A sofa chair and carpet were added to the space.
- (iii)
- Cotton fabric was used around the area to cover and block nearby equipment.
- (iv)
- The screen was replaced with a 50-inch monitor.
5.2. Formal Experiment
5.2.1. Field Tests with Invited Users
- (1)
- Objective—To evaluate the stress-relief effectiveness of the improved system, the focus of the experiment is put on its ability to facilitate a relaxed emotional state.
- (2)
- Participants—A total of 52 persons were invited to participate. Among the 52 participants, 29 identified as female and 23 as male. All participants were university students aged 18–24, recruited via campus announcements.
- (3)
- Procedure—The procedure, using the most effective relaxation music selected earlier, was conducted once and divided into three stages, with the corresponding atmospheres illustrated in Figure 7.
- (a)
- Stage I: growing and stress phases—Participants viewed a visual scene of a barren island on the screen while recalling personal worries. The EEG tracked their attention and meditation values, which influenced the growth of a virtual tree.
- (b)
- Stage II: music listening and viewing phases—Participants listened to the relaxing music while dynamic visuals, updated based on the EEG input, reflected their emotional states.
- (c)
- Stage III: session end—After music playback, the participants received visual feedback on the screen with a relaxation score and an emotional coordinate map derived from their EEG data.
5.2.2. Analysis of Users’ Emotional States
5.2.3. User Interviews
- (1)
- Ease of use and engagement—The system was seen as intuitive and engaging.
- (2)
- Emotional awareness and feedback—EEG-driven emotional visualization enhanced users’ self-awareness, and the relaxation feedback screen was clear.
- (3)
- Audio effectiveness—Guided prompts and music supported immersion, though improvements in audio recording quality were suggested.
- (4)
- Visual and environmental design—Lighting, visuals, and soft furnishings helped induce calmness and matched users’ emotional states.
- (5)
- System performance—Occasional frame drops occurred during EEG headset connection.
- (6)
- Session duration—Participants generally desired a longer experience.
5.3. Questionnaire Survey
5.3.1. Questionnaire Design and Data Collection
5.3.2. Analysis of Questionnaire Survey Data—Introduction
- (1)
- Stage I: analysis of the reliability and validity of the questionnaire dataset—
- (a)
- Step 1: verifying the adequacy of the questionnaire dataset;
- (b)
- Step 2: finding the latent dimensions of the questions from the collected data;
- (c)
- Step 3: verifying the reliability of the collected questionnaire dataset;
- (d)
- Step 4: verifying the applicability of the structural model established with the dimensions;
- (e)
- Step 5: verification of the validity of the collected questionnaire data.
- (2)
- Stage II: analysis of the meanings of the latent dimensions of the dataset—
- (a)
- deriving the meanings of the dataset of each latent dimension of the first scale;
- (b)
- deriving the meanings of the dataset of each latent dimension of the second scale.
5.3.3. Analysis of the Reliability and Validity of the Questionnaire Dataset
- (A) Verification of the Adequacy of the Questionnaire Dataset
- (B) Finding the Latent Dimensions of the Questions from the Collected Data
- (C) Verifying the Reliability of the Collected Questionnaire Data
- (D) Verification of Applicability of the Structural Model Established with the Dimensions
- (E) Verification of the Validity of the Collected Questionnaire Data
5.3.4. Analysis of Questionnaire Data About the Scale of User Interaction Experience
- (A) Data Analysis for the Latent Dimension of “Emotional Experience”
- (1)
- Average scores for this “emotional experience” dimension ranged from 3.81 to 4.33, indicating generally positive emotional responses.
- (2)
- Item 6 (T12) received less than 80% agreement and had a standard deviation above 0.93, suggesting some divergence in opinion, though the average exceeded 4.02.
- (3)
- Item 1 (T13) showed the lowest agreement rate (65.4%) and a standard deviation of 0.95. This may be due to participants interpreting “daily life” in terms of practicality or frequency of use, rather than relaxation effectiveness.
- (4)
- Items 3 and 4 (T4 and T15) had agreement rates above 80%, with no negative responses, indicating that participants generally felt emotionally uplifted and relaxed.
- (5)
- Of the seven items, five received agreement rates above 80%, suggesting most participants were satisfied with the emotional feedback from the experience.
- (B) Data Analysis for the Latent Dimension of “Device Experience”
- (1)
- Average scores for this “device experience” dimension ranged from 4.00 to 4.40, suggesting that the experience flow, system operation, and visual presentation were perceived as smooth, comfortable, and relatable.
- (2)
- Standard deviations for Items 8 and 9 (T2 and T3) were below 0.7, with no negative responses, indicating strong consensus regarding the system’s fluency.
- (3)
- Item 11 (T14) had the highest standard deviation (0.84), indicating varied views on connecting stress-relief elements to personal experience.
- (4)
- Four of the five items received over 85% agreement, reflecting high overall satisfaction with the device experience.
- (C) Data Analysis for the Latent Dimension of “Interface Design and Perception”
- (1)
- The average scores for this dimension of “interface design and perception” ranged from 4.21 to 4.29, indicating that the system’s interface and sensory feedback were found to be engaging.
- (2)
- All items in this dimension received scores above 4, reflecting generally positive perceptions regarding interface design and sensory experience.
- (3)
- All four items had agreement rates exceeding 80%, suggesting that most participants were satisfied with the system’s visual and auditory design.
5.3.5. Analysis of Questionnaire Data About the Scale of Relaxation Level
- (A) Data Analysis for the Latent Dimension of “Physiological Feedback”
- (1)
- The average scores for this dimension ranged from 3.50 to 4.31, indicating that the participants generally experienced a sense of physical and psychological relaxation.
- (2)
- For Items 3, 4, and 5 (S2, S5, and S9), the average scores were mostly above 4, with Item 3 (S2) approaching 4, suggesting that participants reported a relaxed and softened physical state.
- (3)
- Higher standard deviations for Items 1 and 2 (S4 and S6) suggest diverse views on psychological relaxation, with average scores of 3.67 and 3.50 indicating less consensus. While physical relaxation was evident, some participants may have experienced lingering mental concerns that the system could not fully address.
- (4)
- Among the five items in this dimension, only one item exceeded an 80% agreement rate, accounting for 20% of the total. This implies that participant opinions varied across these items.
- (B) Data Analysis for the Latent Dimension of “Emotional Feedback”
- (1)
- The average scores for the “emotional feedback” dimension ranged from 4.17 to 4.40, indicating that participants generally felt relaxed, calm, and at ease after the experience.
- (2)
- The standard deviation for Item 7 (S7) was 0.86, suggesting some variation in responses; however, the average score of 4.19 still reflects that most participants felt rested and refreshed.
- (3)
- All four items in this dimension had agreement rates exceeding 80%, showing that the majority of participants experienced emotional relaxation following the session.
5.4. Data Analysis and Discussions
- (1)
- Most participants (48 individuals) reported achieving a sense of relaxation.
- (2)
- Many (39 individuals) found the EEG-driven transformation of emotions into seasonal and weather-based visuals to align well with their emotional perceptions.
- (3)
- Questionnaire responses showed consistent and positive feedback on physical relaxation.
- (4)
- EEG data indicated a shift toward relaxed and blank states after the music listening phase, especially during the viewing stage.
- (5)
- While physiological relaxation received high average ratings (3.94, 4.02, 4.31), psychological relaxation ratings (3.67, 3.50) were more varied—possibly due to participants’ unclear definitions of mental relaxation, despite physiological evidence of calm.
- (6)
- Participants rated interactivity (avg. 4.17) and overall satisfaction (avg. 4.02) highly.
- (7)
- A majority (43 individuals) felt the session duration was too short.
- (8)
- Although guided prompts were considered effective (47 individuals), their content and equipment should be carefully selected, ideally with input from counseling professionals.
- (9)
- Participants showed greater willingness to engage in future experiences (avg. 4.38).
6. Conclusions and Suggestions
6.1. Conclusions
- (1)
- The integration of emotion-sensing and music listening offers an innovative interactive experience—A wearable EEG device is utilized in this study to incorporate emotion detection into the proposed interactive music-based stress relief system “Serenity Island”. The system was developed using Unity3D (ver. 6000.0.0) and structured around Bonny’s four-stage guided imagery method [25]. Participants reported positive emotional experiences, and interview findings affirmed the novelty and creativity of this emotion-aware interaction model.
- (2)
- Emotions can be effectively visualized through natural metaphors like seasons and weather—The system translated users’ emotional states—measured through EEG-derived attention and meditation values—into dynamic visual scenes that changed in response to seasonal and weather metaphors. This approach provided intuitive, engaging feedback and maintained user interest through its visual interactivity.
- (3)
- The proposed system promotes emotional relaxation by combining music listening, guided imagery, and real-time emotion feedback—While participants initially experienced discomfort when reflecting on unpleasant memories, post-experience feedback revealed improved psychological calmness, physical relaxation, and reduced focus on stressors. These results confirm the system’s effectiveness in promoting relaxation through a combination of music listening and emotion-sensing feedback.
6.2. Suggestions for Future Research
- (1)
- Enhancing atmosphere and lighting—In terms of environmental atmosphere creation, more careful testing is needed to assess the visual effects of various color tones on the screen and the balance of ambient lighting.
- (2)
- Improving music selection—For the proposed music-based stress relief interactive system, adding a wider variety of relaxing music options would enhance the diversity of user choice.
- (3)
- Optimizing real-time feedback in emotion sensing—Regarding the proposed system’s feedback design, the feedback mechanism could be optimized to provide real-time responses or reduce the time interval for data processing to improve user interaction.
- (4)
- Extending relaxation experience—With regard to the proposed system’s flow design, extending the relaxation phase would allow users to enjoy a longer, more immersive stress-relief experience.
- (5)
- Enhancing emotional representation—In terms of presenting digital content, more emotional expressions may be added to the emotion coordinates, and additional emotional states may be incorporated into the feedback screens to enrich the content.
- (6)
- Incorporating psychologist guidance—During the system’s operation, it would be beneficial to incorporate in-depth discussions led by psychological counselors based on the individual case characteristics, replacing the role of guiding prompts, to unify the psychological and physiological states of the users.
- (7)
- Applying AI-driven dynamic musical adaptation or generation—Incorporating AI-driven dynamic musical adaptation or generation could enhance the system to provide users with a more affectively aware interactive visual experience, in which music responsively reflects their emotional and physiological states.
- (8)
- Validating the mapping between the (valence, arousal) and (meditation, attention) parameter pairs—Conducting a theoretically grounded and empirically tested validation of the mapping from “valence” and “meditation” to “arousal” and “attention”, respectively, would enhance the credibility of the proposed emotion model described in Figure 6 and strengthen its applicability across emotion-aware interactive systems.
- (9)
- Integrating additional physiological stress measures—Incorporating additional physiological biomarkers such as heart rate variability (HRV) or cortisol levels can enhance the objectivity and comprehensiveness of stress assessment while improving the accuracy of evaluating stress reduction effects within the system.
- (10)
- Incorporating a robust control condition—Including a well-defined control group, such as participants exposed to the same music without interactive visuals or engaged in a standardized relaxation method, can strengthen the validity of experimental findings.
- (11)
- Comparing interactive and non-interactive systems—Conducting controlled experiments to compare the effects of interactive systems (with EEG feedback and responsive visuals) against non-interactive methods using static imagery or music-only listening can clarify the specific contribution of system interactivity.
- (12)
- Exploring cross-cultural validation of emotional metaphors—Investigating the cultural universality of visual emotional metaphors (e.g., seasons, weather) through user studies involving participants from different cultural backgrounds can help to assess the clarity, relatability, and emotional accuracy of these visual representations.
- (13)
- Assessing effects of long-term engagement and stress-relief persistence—Investigating user retention, repeated usage behavior, and the sustained effectiveness of stress-relief responses over extended periods (e.g., days or weeks) could help to evaluate the durability of relaxation benefits and long-term user engagement with the system.
Author Contributions
Funding
Institutional Review Board Statement
Informed Consent Statement
Data Availability Statement
Conflicts of Interest
References
- Hedegaard, H.; Curtin, S.C.; Warner, M. Suicide Mortality in the United States, 1999–2017. NCHS Data Brief 2018, 309, 1–8. [Google Scholar]
- Finkelstein, D.M.; Kubzansky, L.D.; Capitman, J.; Goodman, E. Socioeconomic differences in adolescent stress: The role of psychological resources. J. Adolesc. Health 2007, 40, 127–134. [Google Scholar] [CrossRef] [PubMed]
- Anderson, S.F.; Salk, R.H.; Hyde, J.S. Stress in romantic relationships and adolescent depressive symptoms: Influence of parental support. J. Fam. Psychol. 2015, 29, 339–348. [Google Scholar] [CrossRef] [PubMed]
- Ip, H.H.S.; Kwong, B. Smart Ambience Games for Children with Learning Difficulties. Lect. Notes Comput. Sci. 2006, 3942, 476–487. [Google Scholar] [CrossRef]
- Murray, J.H. Inventing the Medium: Principles of Interaction Design as a Cultural Practice; MIT Press: Cambridge, MA, USA, 2012. [Google Scholar]
- Selye, H. A Syndrome produced by Diverse Nocuous Agents. Nature 1936, 138, 32. [Google Scholar] [CrossRef]
- Lazarus, R.S.; Folkman, S. Stress, Appraisal, and Coping; Springer Publishing Company: New York, NY, USA, 1984. [Google Scholar]
- Clark, D.A.; Steer, R.A.; Beck, A.T. Common and specific dimensions of self-reported anxiety and depression: Implications for the cognitive and tripartite models. J. Abnorm. Psychol. 1994, 103, 645. [Google Scholar] [CrossRef]
- Hensley, W.E. The Measurement of Stress among College Students. Psychol. Rep. 1991, 68, 1235–1240. [Google Scholar] [CrossRef]
- Villanova, P.; Bownas, D.A. Dimensions of College Student Stress. J. Coll. Stud. Dev. 1984, 25, 105–113. [Google Scholar]
- Whitman, N.A.; Spendlove, D.C.; Clark, C.H. Student Stress: Effects and Solutions; Association for the Study of Higher Education: Washington, DC, USA, 1985. [Google Scholar]
- Jackson, E.M. Stress relief: The role of exercise in stress management. ACSM’s Health Fit. J. 2013, 17, 14–19. [Google Scholar] [CrossRef]
- Selye, H. Stress without Distress. In Psychopathology of Human Adaptation; Serban, G., Ed.; Springer: Boston, MA, USA, 1976; pp. 137–146. [Google Scholar]
- Meichenbaum, D.; Jaremko, M.E. Stress Reduction and Prevention; Plenum Press: New York, NY, USA, 1983. [Google Scholar]
- Wen, S.-S. Stress Management. San Min Book Co.: Taipei, Taiwan, 2017. (In Chinese) [Google Scholar]
- Davis, W.B.; Gfeller, K.E.; Thaut, M.H. An Introduction to Music Therapy: Theory and Practice, 3rd ed.; American Music Therapy Association: Silver Spring, MD, USA, 2008. [Google Scholar]
- American Music Therapy Association. What Is Music Therapy? Available online: https://www.musictherapy.org/about/musictherapy/ (accessed on 6 May 2024).
- Storr, A. Music and the Mind; Free Press: New York, NY, USA, 1992. [Google Scholar]
- Frenkel, M.; Ben-Arye, E.; Cohen, L. Complementary and alternative medicine (CAM) and supportive care in cancer: A synopsis of research perspectives and contributions by an interdisciplinary team. Support. Care Cancer 2007, 15, 565–568. [Google Scholar] [CrossRef]
- Liu, K.-H. Music Therapy: Theory and Practice. Guid. Couns. 1994, 104, 21–25. (In Chinese) [Google Scholar]
- Robarts, J.Z. Music Therapy and Children with Autism: Protocols for Intervention and Future Directions. In Music Therapy in the Treatment of Adults with Mental Disorders: Theoretical Bases and Clinical Interventions; Unkefer, R.F., Ed.; Macmillan Publishing Company: New York, NY, USA, 1998; pp. 123–145. [Google Scholar]
- Huang, C.-H.; Wu, H.-J. A Comparative Analysis of Theoretical Models of Music Therapy—A Case Study of the Effects of Orff Music Therapy Groups. J. Couns. Guid. 2004, 10, 1–29. (In Chinese) [Google Scholar]
- Unkefer, R.F.; Thaut, M. Music Therapy in the Treatment of Adults with Mental Disorders: Theoretical Bases and Clinical Interventions. Arts Psychother. 1990, 17, 91–104. [Google Scholar]
- Wolberg, L.R. The Technique of Psychotherapy, 4th ed.; Grune & Stratton, Inc.: Orlando, FL, USA; Harcourt Brace: Orlando, FL, USA, 1988. [Google Scholar]
- Bonny, H.L. Facilitating Guided Imagery and Music Sessions; ICM Books: Baltimore, MD, USA, 1978. [Google Scholar]
- Drever, J. A Dictionary of Psychology; Penguin Books: Oxford, UK, 1952. [Google Scholar]
- Plutchik, R. Chapter 1—A General Psychoevolutionary Theory of Emotion. In Theories of Emotion; Plutchik, R., Kellerman, H., Eds.; Academic Press: New York, NY, USA, 1980; pp. 3–33. [Google Scholar]
- Dworetsky, J.P. Psychology. West Publishing Company: St. Paul, MN, USA, 1988. [Google Scholar]
- Norman, D.A. Emotional Design: Why We Love (or Hate) Everyday Things; Basic Books: New York, NY, USA, 2004. [Google Scholar]
- Strongman, K.T. The Psychology of Emotion: Theories of Emotion in Perspective, 4th ed.; Wiley: Chichester, UK, 1996. [Google Scholar]
- Ruiz-Padial, E.; Sollers, J.J., III; Vila, J.; Thayer, J.F. The rhythm of the heart in the blink of an eye: Emotion-modulated startle magnitude covaries with heart rate variability. Psychophysiology 2003, 40, 306–313. [Google Scholar] [CrossRef] [PubMed]
- Zentner, M.; Grandjean, D.; Scherer, K.R. Emotions evoked by the sound of music: Characterization, classification, and measurement. Emotion 2008, 8, 494–521. [Google Scholar] [CrossRef] [PubMed]
- Schellenberg, E.G.; Krysciak, A.M.; Campbell, R.J. Perceiving emotion in melody: Interactive effects of pitch and rhythm. Music. Percept. 2000, 18, 155–171. [Google Scholar] [CrossRef]
- Thayer, R.E. The Biopsychology of Mood and Arousal; Oxford University Press: New York, NY, USA, 1989. [Google Scholar]
- Juslin, P.N. Perceived emotional expression in synthesized performances of a short melody: Capturing the listener’s judgment policy. Music. Sci. 1997, 1, 225–256. [Google Scholar] [CrossRef]
- Picard, R.W. Affective Computing; MIT Press: Cambridge, MA, USA, 1995. [Google Scholar]
- Picard, R.W.; Klein, J. Computers That Recognise and Respond to User Emotion: Theoretical and Practical Implications. Interact. Comput. 2002, 14, 141–169. [Google Scholar] [CrossRef]
- Reynolds, C.; Picard, R.W. Designing for affective interactions. In Proceedings of the 9th International Conference on Human–Computer Interaction (HCI International 2001), New Orleans, LA, USA, 5–10 August 2001; Kumar, S., Ed.; Lawrence Erlbaum Associates: Mahwah, NJ, USA, 2001; pp. 1–6. [Google Scholar]
- Soleymani, M.; Pantic, M.; Pun, T. Multimodal Emotion Recognition in Response to Videos. IEEE Trans. Affect. Comput. 2012, 3, 211–223. [Google Scholar] [CrossRef]
- Wu, D.; Li, C.; Yin, Y.; Zhou, C.; Yao, D. Music Composition from the Brain Signal: Representing the Mental State by Music. Comput. Intell. Neurosci. 2010, 2010, 267671. [Google Scholar] [CrossRef]
- Valenza, G.; Lanata, A.; Scilingo, E.P. The Role of Nonlinear Dynamics in Affective Valence and Arousal Recognition. IEEE Trans. Affect. Comput. 2012, 3, 237–249. [Google Scholar] [CrossRef]
- Berger, H. Über das Elektrenkephalogramm des Menschen. Arch. Psychiatr. Nervenkr. 1929, 87, 527–570. [Google Scholar] [CrossRef]
- Berger, H. Über das Elektrenkephalogramm des Menschen. Arch. Psychiatr. Nervenkr. 1931, 94, 16–60. [Google Scholar] [CrossRef]
- Sammler, D.; Grigutsch, M.; Fritz, T.; Koelsch, S. Music and Emotion: Electrophysiological Correlates of the Processing of Pleasant and Unpleasant Music. Psychophysiology 2007, 44, 293–304. [Google Scholar] [CrossRef]
- Petrantonakis, P.; Hadjileontiadis, L. Emotion Recognition from Brain Signals Using Hybrid Adaptive Filtering and Higher Order Crossings Analysis. IEEE Trans. Affect. Comput. 2010, 1, 81–97. [Google Scholar] [CrossRef]
- NeuroSky, Inc. MindWave Mobile: User Guide; NeuroSky, Inc.: San Jose, CA, USA, 2015; Available online: https://download.neurosky.com/support_page_files/MindWaveMobile/docs/mindwave_mobile_plus_user_guide.pdf (accessed on 6 May 2025).
- Neurowear. Neurocam. Available online: http://neurowear.com/projects_detail/neurocam.html (accessed on 6 May 2025).
- Park, L. Beautiful Mind “Eunoia”. Available online: https://www.thelisapark.com/work/eunoia (accessed on 6 May 2025).
- Tsai, J.-P. Meditation Practice and Interactive Installation Integrated with Wearable EEG Device. 2015. Available online: https://www.youtube.com/watch?v=_dOlTg3iEsY (accessed on 6 May 2025).
- Li, T.-Y. Mind-Reading Tree. 2015. Available online: https://digitalartfestival.tw/daf15/zh/award-4-0103.html (accessed on 6 May 2025).
- Muse. Muse 2. 2018. Available online: https://choosemuse.com/ (accessed on 6 May 2025).
- Kantowitz, B.H.; Sorkin, R.D. Human Factors: Understanding People-System Relationships; Wiley: New York, NY, USA, 1983. [Google Scholar]
- Buxton, W.A.S.; Baecker, R.M. Readings in Human-Computer Interaction: A Multidisciplinary Approach; Morgan Kaufmann: Los Altos, CA, USA, 1987. [Google Scholar]
- Preece, J.; Rogers, Y.; Sharp, H.; Benyon, D.; Holland, S.; Carey, T. Human-Computer Interaction; Addison-Wesley: Wokingham, UK, 1994. [Google Scholar]
- Rogers, Y.; Sharp, H.; Preece, J. Interaction Design: Beyond Human–Computer Interaction, 3rd ed.; Wiley: Chichester, UK, 2011. [Google Scholar]
- McDonald’s Nederland. McTrax. 2016. Available online: https://www.youtube.com/watch?v=X6zPbogDPgU (accessed on 6 May 2025).
- Dvořák, T.; Gregor, D. Archifon. 2016. Available online: https://www.youtube.com/watch?v=NF8S0p1bu7s (accessed on 6 May 2025).
- Lind, A. LINES—An Interactive Sound Art Exhibition. 2016. Available online: https://www.youtube.com/watch?v=hP36xoPXDnM (accessed on 6 May 2025).
- Lien, M. Embracing X Surroundings. Available online: https://matthewlien.com/embracing-x-surroundings-16-channel-outdoor-sound-sculpture/ (accessed on 6 May 2025).
- Chen, Y.-S. Immersing in the Wonderland that We Create: The Music Interaction Device. Master’s Thesis, National Cheng Kung University, Tainan, Taiwan, 2022. [Google Scholar]
- Bunt, L.; Stige, B. Music Therapy: An Art Beyond Words, 2nd ed.; Routledge: London, UK, 2014. [Google Scholar]
- Russell, J.A. A Circumplex Model of Affect. J. Personal. Soc. Psychol. 1980, 39, 1161–1178. [Google Scholar] [CrossRef]
- Yeh, C.-C.; Yeh, L.-C. Research Methods and Thesis Writing; Shang-Ding Culture: Taipei, Taiwan, 2011. (In Chinese) [Google Scholar]
- Flick, U. An Introduction to Qualitative Research, 6th ed.; SAGE Publications: London, UK, 2018. [Google Scholar]
- Chin, J.P.; Diehl, V.A.; Norman, K.L. Development of an Instrument Measuring User Satisfaction of the Human–Computer Interface. In Proceedings of the SIGCHI Conference on Human Factors in Computing Systems (CHI ’88), Washington, DC, USA, 15–19 May 1988; pp. 213–218. [Google Scholar] [CrossRef]
- Likert, R. A Technique for the Measurement of Attitudes. Arch. Psychol. 1932, 140, 1–55. [Google Scholar]
- Smith, J.C. Smith Relaxation States Inventory 3 (SRSI3). Available online: https://bpb-us-e1.wpmucdn.com/blogs.roosevelt.edu/dist/9/20/files/2016/09/SRSI3.pdf (accessed on 6 May 2025).
- IBM KMO and Bartlett’s Test. Available online: https://www.ibm.com/docs/en/spss-statistics/28.0.0?topic=detection-kmo-bartletts-test (accessed on 10 May 2023).
- Trochim, W.M.K. Hosted by Conjointly. Research Methods Knowledge Base. Available online: https://conjointly.com/kb/theory-of-reliability/ (accessed on 10 May 2023).
- Taber, K.S. The use of Cronbach’s alpha when developing and reporting research instruments in science education. Res. Sci. Educ. 2018, 48, 1273–1296. [Google Scholar] [CrossRef]
- Guilford, J.P. Psychometric Methods, 2nd ed.; McGraw-Hill: New York, NY, USA, 1954. [Google Scholar]
- Hu, L.T.; Bentler, P.M. Cutoff criteria for fit indexes in covariance structure analysis: Conventional criteria versus new alternatives. Struct. Equ. Model. 1999, 6, 1–55. [Google Scholar] [CrossRef]


| Value | Index Range | Meditation Level Status | Attention Level Status |
|---|---|---|---|
| 81–100 | elevated | very relaxed | highly focused |
| 61–80 | slightly elevated | slightly relaxed | slightly focused |
| 41–60 | neutral | neutral | neutral |
| 21–40 | reduced | slightly tense | slightly distracted |
| 0–20 | strongly lowered | very tense | highly distracted |
| Work Title | Interactive Feedback | Data Source | Purpose |
|---|---|---|---|
| Neurocam [47] | Memory images | Focus, thinking, relaxation | Entertainment |
| Eunoia [48] | Size of water ripples | Focus, relaxation | Interactive installation, emotional observation |
| Meditation Interaction Device [49] | Degree of lotus bloom | Relaxation, focus | Interactive installation, emotional observation |
| Mind-Reading Tree [50] | Visual animation | Relaxation | Entertainment, interactive installation |
| Muse 2 [51] | Physiological data displayed via smartphone charts | Relaxation, focus, heart rate, breathing | Meditation and relaxation, self-observation |
| Work Title | Content | Music Type |
|---|---|---|
| McTrax [56] | The placemat connects to a smartphone via Bluetooth and enables song creation using conductive ink. | Energetic, electronic music, percussion |
| Archifon [57] | Music is triggered by sensors when activated with a laser pointer. | Nature sounds, crystal music |
| LINES [58] | Pitch varies depending on the participant’s distance from the sensors. | Electronic tones, cheerful |
| Embracing X Surroundings [59] | Sound plays when participants hug the interactive installation. | Nature sounds, relaxing |
| Dream Sound [60] | Visual changes are triggered by detecting the viewers with layered effects created through image overlay. | Relaxing, crystal music |
| Procedure | Diagram | Description | |
|---|---|---|---|
| Phase | Step | ||
| (1) Initial setup: | (i) User seated |  | The user is guided to be seated beside the proposed system and wear a brainwave headset, and the experimental procedure is explained. |
| (ii) Login in | 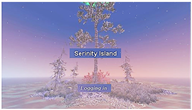 | A login screen is displayed, asking a researcher to start the system. | |
| (iii) Device connection |  | Device connection is conducted to establish communication between the system and the EEG. | |
| (vi) Standby screen | 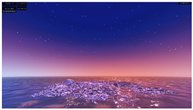 | The island in the visual display appears barren, with no tree present; and an audio prompt is given to instruct the user to focus intently on the island. | |
| (2) Growing phase | (i) Tree growth initiated |  | Tree growth on the island is initiated when the user’s real-time EEG attention value surpasses a designated threshold. |
| (ii) Tree growth accelerated |  | Higher attention levels accelerate tree growth, while increased meditation levels enhance the density of the island’s vegetation. | |
| (3) Stress phase | (i) Increasing pressure | 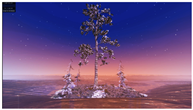 | After tree growth finishes, the ocean wave parameters are increased to create intense waves, intensifying the sense of psychological pressure. |
| (ii) Screen darkened | 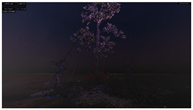 | The system gradually darkens the scene to create an immersive atmosphere of pressure. | |
| (4) Music listening phase | (i) Immerse in the music | 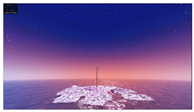 | The user is prompted by the system to relax his/her body, close their eyes, listen to the music, and fully immerse themselves in the music for 2.5 min. The user is then prompted to open their eyes. |
| (ii) Visual scene changes (a1) spring |  | Various visual scenes like different seasons are displayed on the screen to guide the user through different emotional states, including: (a) four seasons—(a1) spring. | |
| (ii) Visual scene changes (a2) summer |  | Various visual scenes like different seasons are displayed on the screen to guide the user through different emotional states, including: (a) four seasons—(a2) summer. | |
| (ii) Visual scene changes (a3) autumn |  | Various visual scenes like different seasons are displayed on the screen to guide the user through different emotional states, including: (a) four seasons—(a3) autumn. | |
| (ii) Visual scene changes (a4) winter |  | Various visual scenes like different seasons are displayed on the screen to guide the user through different emotional states, including: (a) four seasons—(a4) winter. | |
| (5) Viewing phase | (i) Emotion calming |  | The user continues music listening for additional 2.5 min to settle their emotions. |
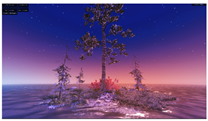
| (ii) Emotion analysis (a) anxiety |  | The user’s brainwaves are read to yield an emotion type with its visual display presented: anxiety. | |
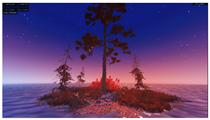
| (ii) Emotion analysis (b) tension |  | The user’s brainwaves are read to yield an emotion type with its visual display presented: tension | |
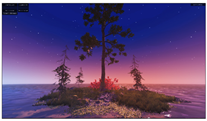
| (ii) Emotion analysis (c) blankness |  | The user’s brainwaves are read to yield an emotion type with its visual display presented: blankness. | |
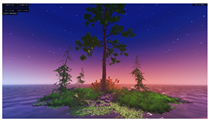
| (ii) Emotion analysis (d) relaxation |  | The user’s brainwaves are read to yield an emotion type with its visual display presented: relaxation. | |
| (6) Session end | (i) Showing emotion diagram |  | When the music ends, an emotion diagram, including the user’s “relaxation level” and the corresponding “emotional state”, is generated based on all the emotion data and presented on the screen |
| (ii) Screen darkened |  | When the time is up, a notification indicating the end of detection is displayed, the screen gradually darkens, and the data is saved. | |
| (iii) Detection ended | 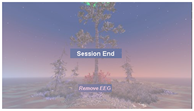 | A message appears, instructing the participant to remove the brainwave headset. | |
| Class | Parameters and Visual Scenes | |
|---|---|---|
| Wave crest | High | Low |
 |  | |
| Speed | Quick | Slow |
 |  | |
| Sea | Above surface | Underwater |
 |  | |
| Class | Parameters and Visual Scenes | |
|---|---|---|
| Mist intensity | Dense | Light |
 |  | |
| Mist coverage | HIgh | Low |
 |  | |
| Mist color (adjusted through three color palettes) | Defined freely | |
 | ||
| Class | Parameters and Visual Scenes | |
|---|---|---|
| Seasons | Spring | Summer |
 |  | |
| Autumn | Winter | |
 |  | |
| Plant Size and Leaf Density | Spare | Dense |
 |  | |
| Wind | No wind | Fierce wind |
 |  | |
| Rain | No rain | Heavy rain |
 |  | |
| Anxiety | Tension | Blankness | Relaxation | |
|---|---|---|---|---|
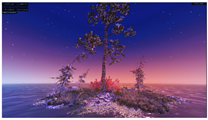
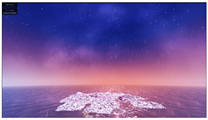
| season | winter | winter | autumn | summer |
| wind | fierce | moderate | slight | slight |
| rain | heavy | moderate | slight | none |
| wave patterns (ocean) | high | moderate | slow | moderate |
| overall color tone (mist) | black | red | purple | blue-green |
| Emotional State | Anxiety | Tension |
|---|---|---|
| Visual scene |  | 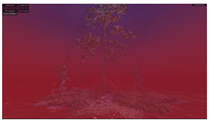 |
| Emotional State | Blankness | Relaxation |
| Visual scene | 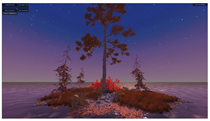 |  |
| Perspectives | Questions |
|---|---|
| Theme and stress relief |
|
| Visuals and emotions |
|
| Round | Music Type | Instruments | Tempo | Melody Clarity | Features |
|---|---|---|---|---|---|
| T1 | meditation | electronic sounds | slow | most blurred | small pitch range |
| T2 | crystal music | electronic, percussion | slow | fairly blurred | α waves, water flow sounds |
| T3 | symphony | piano, string instruments | lively | clear | piano, clear melody |
| T4 | nature sounds | piano | lively | very clear | water flow, insect chirps, bird calls |
| Music | T1 | T2 | T3 | T4 | ||||
|---|---|---|---|---|---|---|---|---|
| Phase | Tree_A | Music_A | Tree_A | Music_A | Tree_A | Music_A | Tree_A | Music_A |
| A | 56.33 | 56.3 | 34.33 | 40.53 | 45.44 | 53.71 | 38.48 | 21.4 |
| B | 45.12 | 43.61 | 39.40 | 48.08 | 46.84 | 46.76 | 39.92 | 33.33 |
| C | 42.53 | 44.77 | 36.82 | 38.70 | 53.30 | 52.22 | 46.90 | 25.83 |
| D | 49.73 | 48.03 | 41.88 | 45.52 | 45.94 | 48.93 | 46.51 | 21.17 |
| E | 57.26 | 41.17 | 41.01 | 42.33 | 51.71 | 46.16 | 38.04 | 19.66 |
| F | 57.96 | 43.80 | 47.57 | 49.92 | 61.67 | 53.51 | 37.45 | 32.27 |
| G | 46.40 | 56.20 | 34.22 | 39.50 | 53.94 | 47.65 | 38.66 | 24.90 |
| H | 57.04 | 51.34 | 45.53 | 39.84 | 49.81 | 40.11 | 48.83 | 32.12 |
| I | 51.82 | 41.06 | 35.72 | 41.65 | 60.38 | 43.62 | 45.79 | 27.77 |
| J | 56.88 | 47.72 | 38.67 | 46.56 | 45.06 | 51.53 | 37.27 | 34.53 |
| K | 48.90 | 45.67 | 35.77 | 38.44 | 59.30 | 45.20 | 30.10 | 22.41 |
| Avg | 51.81 | 47.24 | 39.17 | 42.82 | 52.12 | 48.12 | 40.72 | 26.85 |
| Music | T1 | T2 | T3 | T4 | ||||
|---|---|---|---|---|---|---|---|---|
| Phase | Tree_A | Music_A | Tree_A | Music_A | Tree_A | Music_A | Tree_A | Music_A |
| A | 42.60 | 67.75 | 33.43 | 53.14 | 29.17 | 56.34 | 39.11 | 43.11 |
| B | 41.58 | 61.08 | 39.85 | 66.50 | 39.84 | 62.71 | 25.200 | 60.84 |
| C | 37.24 | 67.03 | 41.67 | 51.23 | 36.81 | 53.01 | 27.83 | 59.15 |
| D | 31.20 | 47.18 | 34.45 | 63.82 | 35.26 | 59.68 | 37.09 | 54.09 |
| E | 33.30 | 64.28 | 42.54 | 68.03 | 33.92 | 66.35 | 39.23 | 65.16 |
| F | 29.81 | 63.43 | 57.33 | 53.33 | 34.07 | 56.85 | 25.91 | 53.31 |
| G | 31.97 | 62.71 | 36.63 | 67.55 | 30.50 | 51.37 | 36.70 | 42.29 |
| H | 32.58 | 55.12 | 34.08 | 51.92 | 35.57 | 53.45 | 40.35 | 47.44 |
| I | 36.46 | 49.02 | 35.13 | 54.12 | 41.70 | 53.09 | 29.51 | 51.95 |
| J | 34.04 | 64.37 | 44.81 | 63.26 | 31.24 | 54.83 | 26.04 | 55.35 |
| K | 31.59 | 68.63 | 57.38 | 60.20 | 37.58 | 59.17 | 38.62 | 52.45 |
| Avg | 34.76 | 60.09 | 41.57 | 59.37 | 35.06 | 48.12 | 33.23 | 53.19 |
| Label | Affiliation | Profession | Expertise |
|---|---|---|---|
| A | National university | Full-time counseling psychologist | Emotional regulation, stress management, Individual counseling |
| B | National university | Resource teacher guidance counselor | Psychological counseling for students with special needs, individual counseling |
| C | National university | Intern counseling psychologist | Art therapy, self-exploration, individual counseling |
| Perspectives | Questions |
|---|---|
| Feasibility of the project concept |
|
| Elements and important details of the work |
|
| Class | Before Modification | After Modification |
|---|---|---|
| Anxiety |  | 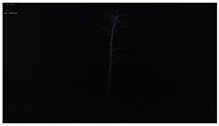 |
| Tension |  | 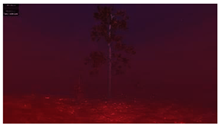 |
| Blankness |  | 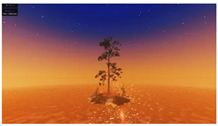 |
| Relaxation |  |  |
| Illustration of Environment | Before improvement | After improvement |
 |  | |
| Real Environment | Before improvement | After improvement |
 |  |
| Item | Question |
|---|---|
| T1 | I find the interactive format engaging. |
| T2 | I think the experience flow is smooth. |
| T3 | I find the system operates smoothly. |
| T4 | I think the device is appealing. |
| T5 | I felt relaxed during the experience. |
| T6 | I feel the colors on the screen are comfortable. |
| T7 | I find the overall visual design of the system calming. |
| T8 | I find the ambient sounds in the system relaxing. |
| T9 | I think the system’s ambient sounds are rich and immersive. |
| T10 | I find the animation design engaging. |
| T11 | The auditory feedback captured my attention. |
| T12 | The device helped me better understand emotional changes. |
| T13 | This device is useful in my daily life. |
| T14 | The system’s stress-relief elements are relevant to my life experiences. |
| T15 | After the experience, I felt emotionally uplifted. |
| T16 | The experience boosted my willingness to join similar activities. |
| Item No. | Min. | Max. | Avg. | S.D. | Strongly Agree (5) | Agree (4) | Neutral (3) | Disagree (2) | Strongly Disagree (1) | Agree + Strongly Agree |
|---|---|---|---|---|---|---|---|---|---|---|
| T1 | 2 | 5 | 4.17 | 0.81 | 38.5% | 44.2% | 13.5% | 3.8% | 0% | 82.7% |
| T2 | 3 | 5 | 4.40 | 0.64 | 50.0% | 40.4% | 9.6% | 0% | 0% | 90.4% |
| T3 | 3 | 5 | 4.38 | 0.69 | 50.0% | 38.5% | 11.5% | 0% | 0% | 88.5% |
| T4 | 1 | 5 | 4.23 | 0.80 | 38.5% | 51.9% | 5.8% | 1.9% | 1.9% | 90.4% |
| T5 | 3 | 5 | 4.33 | 0.73 | 48.1% | 36.5% | 15.4% | 0% | 0% | 84.6% |
| T6 | 3 | 5 | 4.31 | 0.70 | 44.2% | 42.3% | 13.5% | 0% | 0% | 86.5% |
| T7 | 3 | 5 | 4.27 | 0.63 | 36.5% | 53.8% | 9.6% | 0% | 0% | 90.3% |
| T8 | 1 | 5 | 4.27 | 0.77 | 40.4% | 50.0% | 7.7% | 0% | 1.9% | 90.4% |
| T9 | 3 | 5 | 4.29 | 0.72 | 44.2% | 40.4% | 15.4% | 0% | 0% | 84.6% |
| T10 | 2 | 5 | 4.21 | 0.75 | 38.5% | 46.2% | 13.5% | 1.9% | 0% | 84.7% |
| T11 | 3 | 5 | 4.23 | 0.73 | 40.4% | 42.3% | 17.3% | 0% | 0% | 82.7% |
| T12 | 1 | 5 | 4.02 | 0.93 | 34.6% | 40.4% | 19.2% | 3.8% | 1.9% | 75.0% |
| T13 | 1 | 5 | 3.81 | 0.95 | 25.0% | 40.4% | 26.9% | 5.8% | 1.9% | 65.4% |
| T14 | 2 | 5 | 4.00 | 0.84 | 28.8% | 48.1% | 17.3% | 5.8% | 0% | 76.9% |
| T15 | 3 | 5 | 4.23 | 0.67 | 44.2% | 44.2% | 11.5% | 0% | 0% | 88.4% |
| T16 | 2 | 5 | 4.38 | 0.74 | 51.9% | 36.5% | 9.6% | 1.9% | 0% | 88.4% |
| Item | Question |
|---|---|
| S1 | I felt a sense of peace. |
| S2 | My muscles were deeply relaxed. |
| S3 | My heart felt calm and unburdened. |
| S4 | I felt that all my worries were cast aside. |
| S5 | My hands, arms, or legs felt loose and tension-free. |
| S6 | The things I cared about no longer seemed important. |
| S7 | I felt rested. |
| S8 | I felt physically and mentally refreshed. |
| S9 | My body felt at ease. |
| Item No. | Min. | Max. | Avg. | S.D. | Strongly Agree (5) | Agree (4) | Neutral (3) | Disagree (2) | Strongly Disagree (1) | Agree + Strongly Agree |
|---|---|---|---|---|---|---|---|---|---|---|
| S1 | 3 | 5 | 4.40 | 0.64 | 50.0% | 40.4% | 9.6% | 0% | 0% | 90.4% |
| S2 | 1 | 5 | 3.94 | 0.97 | 30.8% | 44.2% | 15.4% | 7.7% | 1.9% | 75.0% |
| S3 | 1 | 5 | 4.02 | 0.93 | 34.6% | 40.4% | 19.2% | 3.8% | 1.9% | 75.0% |
| S4 | 1 | 5 | 3.67 | 1.00 | 23.1% | 34.6% | 30.8% | 9.6% | 1.9% | 57.7% |
| S5 | 1 | 5 | 4.02 | 0.085 | 28.8% | 50.0% | 17.3% | 1.9% | 1.9% | 78.8% |
| S6 | 1 | 5 | 3.50 | 1.18 | 26.9% | 21.2% | 30.8% | 17.3% | 3.8% | 48.1% |
| S7 | 2 | 5 | 4.17 | 0.81 | 38.5% | 44.2% | 13.5% | 3.8% | 0% | 82.7% |
| S8 | 3 | 5 | 4.38 | 0.69 | 50.0% | 38.5% | 11.5% | 0% | 0% | 88.5% |
| S9 | 2 | 5 | 4.31 | 0.70 | 42.3% | 48.1% | 7.7% | 1.9% | 0% | 90.4% |
| Scale | Name of Measure or Test | Value | |
|---|---|---|---|
| User interaction experience | KMO measure of sampling adequacy | 0.717 | |
| Bartlett test of sphericity | Approx. Chi-Square | 288.846 | |
| Degree of freedom | 120 | ||
| Significance | 0.000 | ||
| Relaxation level | KMO measure of sampling adequacy | 0.668 | |
| Bartlett test of sphericity | Approx. Chi-Square | 166.827 | |
| Degree of freedom | 36 | ||
| Significance | 0.000 | ||
| Question Dimension | |||
|---|---|---|---|
| No 0. | 1 | 2 | 3 |
| T13 | 0.760 | −0.181 | 0.015 |
| T8 | 0.670 | 0.139 | 0.095 |
| T4 | 0.670 | 0.473 | 0.028 |
| T15 | 0.657 | 0.349 | −0.020 |
| T5 | 0.614 | 0.110 | 0.320 |
| T12 | 0.585 | 0.133 | 0.056 |
| T1 | 0.512 | 0.511 | 0.073 |
| T2 | 0.017 | 0.772 | 0.162 |
| T3 | −0.116 | 0.765 | 0.283 |
| T6 | 0.227 | 0.642 | 0.054 |
| T14 | 0.367 | 0.562 | −0.048 |
| T16 | 0.154 | 0.545 | 0.135 |
| T7 | −0.063 | 0.081 | 0.782 |
| T11 | 0.044 | 0.101 | 0.726 |
| T10 | 0.143 | 0.240 | 0.711 |
| T9 | 0.441 | 0.053 | 0.607 |
| Question Dimension | ||
|---|---|---|
| No 0. | 1 | 2 |
| S4 | 0.812 | −0.044 |
| S6 | 0.778 | −0.159 |
| S2 | 0.759 | 0.353 |
| S5 | 0.746 | 0.147 |
| S9 | 0.711 | 0.193 |
| S3 | 0.119 | 0.759 |
| S7 | 0.005 | 0.726 |
| S1 | −0.038 | 0.706 |
| S8 | 0.333 | 0.500 |
| Indicator | Question Dimension | Group of Related Questions |
|---|---|---|
| User interaction experience | Emotional experience (Group RA1) | RA1 = (T13, T8, T4, T15, T5, T12, T1) |
| Device experience (Group RA2) | RA2 = (T2, T3, T6, T14, T16) | |
| Interface design and perception (Group RA3) | RA3 = (T7, T11, T10, T9) | |
| Relaxation level | Physiological feedback (Group RB1) | RB1 = (S4, S6, S2, S5, S9) |
| Emotional feedback (Group RB2) | RB2 = (S3, S7, S1, S8) |
| Dimension | Item | Question |
|---|---|---|
| Emotional experience | T13 | This device is useful in my daily life. |
| T8 | I find the ambient sounds in the system relaxing. | |
| T4 | I think the device is appealing. | |
| T15 | After the experience, I felt emotionally uplifted. | |
| T5 | I felt relaxed during the experience. | |
| T12 | The device helped me better understand emotional changes. | |
| T1 | I find the interactive format engaging. | |
| Device experience | T2 | I think the experience flow is smooth. |
| T3 | I find the system operates smoothly. | |
| T6 | I feel the colors on the screen are comfortable. | |
| T14 | The system’s stress-relief elements are relevant to my life experiences. | |
| T16 | The experience boosted my willingness to join similar activities. | |
| Interface design and perception | T7 | I find the overall visual design of the system calming. |
| T11 | The auditory feedback captured my attention. | |
| T10 | I find the animation design engaging. | |
| T9 | I think the system’s ambient sounds are rich and immersive. |
| Dimension | Item | Question |
|---|---|---|
| Physiological feedback | S4 | I felt that all my worries were cast aside. |
| S6 | The things I cared about no longer seemed important. | |
| S2 | My muscles were deeply relaxed. | |
| S5 | My hands, arms, or legs felt loose and tension-free. | |
| S9 | My body felt at ease. | |
| Emotional feedback | S3 | My heart felt calm and unburdened. |
| S7 | I felt rested. | |
| S1 | I felt a sense of peace. | |
| S8 | I felt physically and mentally refreshed. |
| Indicator | Question Dimension (Q.D.) | Cronbach’s α Coeff. of Q.D. | Cronbach’s α Coeffi. of Indicator |
|---|---|---|---|
| User interaction experience | Emotional experience (Group RA1) | 0.723 | 0.717 |
| Device experience (Group RA2) | 0.716 | ||
| Interface design and perception (Group RA3) | 0.741 | ||
| Relaxation level | Physiological feedback (Group RB1) | 0.726 | 0.668 |
| Emotional feedback (Group RB2) | 0.649 |
| Scale | df | χ2 | χ2/df | cfi | RMSEA | RMSEA (90% CI) | |
|---|---|---|---|---|---|---|---|
| LO | HI | ||||||
| User interaction experience | 101 | 121.151 | 1.2 | 0.903 | 0.063 | 0.000 | 0.100 |
| Relaxation level | 25 | 36.617 | 1.465 | 0.920 | 0.095 | 0.000 | 0.158 |
| Indicator | Question Dimension | Group of Related Questions | Construct Validity Value |
|---|---|---|---|
| User interaction experience | Emotional experience (Group RA1) | RA1 = (T13, T8, T4, T15, T5, T12, T1) | 0.811 |
| Device experience (Group RA2) | RA2 = (T2, T3, T6, T14, T16) | 0.749 | |
| Interface design and perception (Group RA3) | RA3 = (T7, T11, T10, T9) | 0.726 | |
| Relaxation level | Physiological feedback (Group RB1) | RB1 = (S4, S6, S2, S5, S9) | 0.802 |
| Emotional feedback (Group RB2) | RB2 = (S3, S7, S1, S8) | 0.652 |
| Item No. | Question | Min | Max | Mean | S.D. | Strongly Agree | Agree | No Opinion | Disagree | Strongly Disagree | Strongly Agree + Agree | |
|---|---|---|---|---|---|---|---|---|---|---|---|---|
| (A) | (B) | (C) | (D) | (E) | (F = A + B) | |||||||
| 1 | T13 | This device is useful in my daily life. | 1 | 5 | 3.81 | 0.95 | 25.0% | 40.4% | 26.9% | 5.8% | 1.9% | 65.4% |
| 2 | T8 | I find the ambient sounds in the system relaxing. | 1 | 5 | 4.27 | 0.77 | 40.4% | 50.0% | 7.7% | 0% | 1.9% | 90.4% |
| 3 | T4 | I think the device is appealing. | 1 | 5 | 4.23 | 0.80 | 38.5% | 51.9% | 5.8% | 1.9% | 1.9% | 90.4% |
| 4 | T15 | After the experience, I felt emotionally uplifted. | 3 | 5 | 4.23 | 0.67 | 44.2% | 44.2% | 11.5% | 0% | 0% | 88.4% |
| 5 | T5 | I felt relaxed during the experience. | 3 | 5 | 4.33 | 0.73 | 48.1% | 36.5% | 15.4% | 0% | 0% | 84.6% |
| 6 | T12 | The device helped me better understand emotional changes. | 1 | 5 | 4.02 | 0.93 | 34.6% | 40.4% | 19.2% | 3.8% | 1.9% | 75.0% |
| 7 | T1 | I find the interactive format engaging. | 2 | 5 | 4.17 | 0.81 | 38.5% | 44.2% | 13.5% | 3.8% | 0% | 82.7% |
| Item No. | Question | Min | Max | Mean | S.D. | Strongly Agree | Agree | No Opinion | Disagree | Strongly Disagree | Strongly Agree + Agree | |
|---|---|---|---|---|---|---|---|---|---|---|---|---|
| (A) | (B) | (C) | (D) | (E) | (F = A + B) | |||||||
| 8 | T2 | I think the experience flow is smooth. | 3 | 5 | 4.40 | 0.64 | 50.0% | 40.4% | 9.6% | 0% | 0% | 90.4% |
| 9 | T3 | I find the system operates smoothly. | 3 | 5 | 4.38 | 0.69 | 50.0% | 38.5% | 11.5% | 0% | 0% | 88.5% |
| 10 | T6 | I feel the colors on the screen are comfortable. | 3 | 5 | 4.31 | 0.70 | 44.2% | 42.3% | 13.5% | 0% | 0% | 86.5% |
| 11 | T14 | The system’s stress-relief elements are relevant to my life experiences. | 2 | 5 | 4.00 | 0.84 | 28.8% | 48.1% | 17.3% | 5.8% | 0% | 76.9% |
| 12 | T16 | The experience boosted my willingness to join similar activities. | 2 | 5 | 4.38 | 0.74 | 51.9% | 36.5% | 9.6% | 1.9% | 0% | 88.4% |
| Item No. | Question | Min | Max | Mean | S.D. | Strongly Agree | Agree | No Opinion | Disagree | Strongly Disagree | Strongly Agree + Agree | |
|---|---|---|---|---|---|---|---|---|---|---|---|---|
| (A) | (B) | (C) | (D) | (E) | (F = A + B) | |||||||
| 13 | T7 | I find the overall visual design of the system calming. | 3 | 5 | 4.27 | 0.63 | 36.5% | 53.8% | 9.6% | 0% | 0% | 90.3% |
| 14 | T11 | The auditory feedback captured my attention. | 3 | 5 | 4.23 | 0.73 | 40.4% | 42.3% | 17.3% | 0% | 0% | 82.7% |
| 15 | T10 | I find the animation design engaging. | 2 | 5 | 4.21 | 0.75 | 38.5% | 46.2% | 13.5% | 1.9% | 0% | 84.7% |
| 16 | T9 | I think the system’s ambient sounds are rich and immersive. | 3 | 5 | 4.29 | 0.72 | 44.2% | 40.4% | 15.4% | 0% | 0% | 84.6% |
| Item No. | Question | Min | Max | Mean | S.D. | Strongly Agree | Agree | No Opinion | Disagree | Strongly Disagree | Strongly Agree + Agree | |
|---|---|---|---|---|---|---|---|---|---|---|---|---|
| (A) | (B) | (C) | (D) | (E) | (F = A + B) | |||||||
| 1 | S4 | I felt that all my worries were cast aside. | 1 | 5 | 3.67 | 1.00 | 23.1% | 34.6% | 30.8% | 9.6% | 1.9% | 57.7% |
| 2 | S6 | The things I cared about no longer seemed important. | 1 | 5 | 3.50 | 1.18 | 26.9% | 21.2% | 30.8% | 17.3% | 3.8% | 48.1% |
| 3 | S2 | My muscles were deeply relaxed. | 1 | 5 | 3.94 | 0.97 | 30.8% | 44.2% | 15.4% | 7.7% | 1.9% | 75.0% |
| 4 | S5 | My hands, arms, or legs felt loose and tension-free. | 1 | 5 | 4.02 | .085 | 28.8% | 50.0% | 17.3% | 1.9% | 1.9% | 78.8% |
| 5 | S9 | My body felt at ease. | 2 | 5 | 4.31 | 0.70 | 42.3% | 48.1% | 7.7% | 1.9% | 0% | 90.4% |
| Item No. | Question | Min | Max | Mean | S.D. | Strongly Agree | Agree | No Opinion | Disagree | Strongly Disagree | Strongly Agree + Agree | |
|---|---|---|---|---|---|---|---|---|---|---|---|---|
| (A) | (B) | (C) | (D) | (E) | (F = A + B) | |||||||
| 6 | S3 | My heart felt calm and unburdened. | 2 | 5 | 4.19 | 0.68 | 32.7% | 55.8% | 9.6% | 1.9% | 0% | 88.5% |
| 7 | S7 | I felt rested. | 2 | 5 | 4.19 | 0.86 | 42.3% | 40.4% | 11.5% | 5.8% | 0% | 82.7% |
| 8 | S1 | I felt a sense of peace. | 3 | 5 | 4.40 | 0.66 | 50.0% | 40.4% | 9.6% | 0% | 0% | 90.4% |
| 9 | S8 | I felt physically and mentally refreshed. | 2 | 5 | 4.17 | 0.81 | 38.5% | 44.2% | 13.5% | 3.8% | 0% | 82.7% |
Disclaimer/Publisher’s Note: The statements, opinions and data contained in all publications are solely those of the individual author(s) and contributor(s) and not of MDPI and/or the editor(s). MDPI and/or the editor(s) disclaim responsibility for any injury to people or property resulting from any ideas, methods, instructions or products referred to in the content. |
© 2025 by the authors. Licensee MDPI, Basel, Switzerland. This article is an open access article distributed under the terms and conditions of the Creative Commons Attribution (CC BY) license (https://creativecommons.org/licenses/by/4.0/).
Share and Cite
Wang, C.-M.; Lin, C.-H. Design of an Interactive System by Combining Affective Computing Technology with Music for Stress Relief. Electronics 2025, 14, 3087. https://doi.org/10.3390/electronics14153087
Wang C-M, Lin C-H. Design of an Interactive System by Combining Affective Computing Technology with Music for Stress Relief. Electronics. 2025; 14(15):3087. https://doi.org/10.3390/electronics14153087
Chicago/Turabian StyleWang, Chao-Ming, and Ching-Hsuan Lin. 2025. "Design of an Interactive System by Combining Affective Computing Technology with Music for Stress Relief" Electronics 14, no. 15: 3087. https://doi.org/10.3390/electronics14153087
APA StyleWang, C.-M., & Lin, C.-H. (2025). Design of an Interactive System by Combining Affective Computing Technology with Music for Stress Relief. Electronics, 14(15), 3087. https://doi.org/10.3390/electronics14153087