1. Introduction
Modern society confronts an increasing burden of chronic, lifestyle-related conditions: hypertension affects approximately 1.28 billion adults aged 30–79 and causes around 10 million deaths annually [
1]. Type 2 diabetes now impacts nearly 589 million adults, with this figure expected to rise to 853 million by 2050; alarmingly, about 40% of those affected remain undiagnosed [
2]. These largely preventable conditions require ongoing monitoring, something episodic, clinic-based care often fails to provide. The COVID-19 pandemic further underscored the urgency for scalable, remote, and non-invasive health tools that empower individuals to manage their own health from home.
Cardiorespiratory Fitness (CRF) is widely recognized as one of the most powerful predictors of long-term health outcomes. A higher CRF level is strongly associated with reduced risk of cardiovascular disease, metabolic disorders, and all-cause mortality [
3]. The gold standard for assessing CRF is maximal oxygen uptake (VO
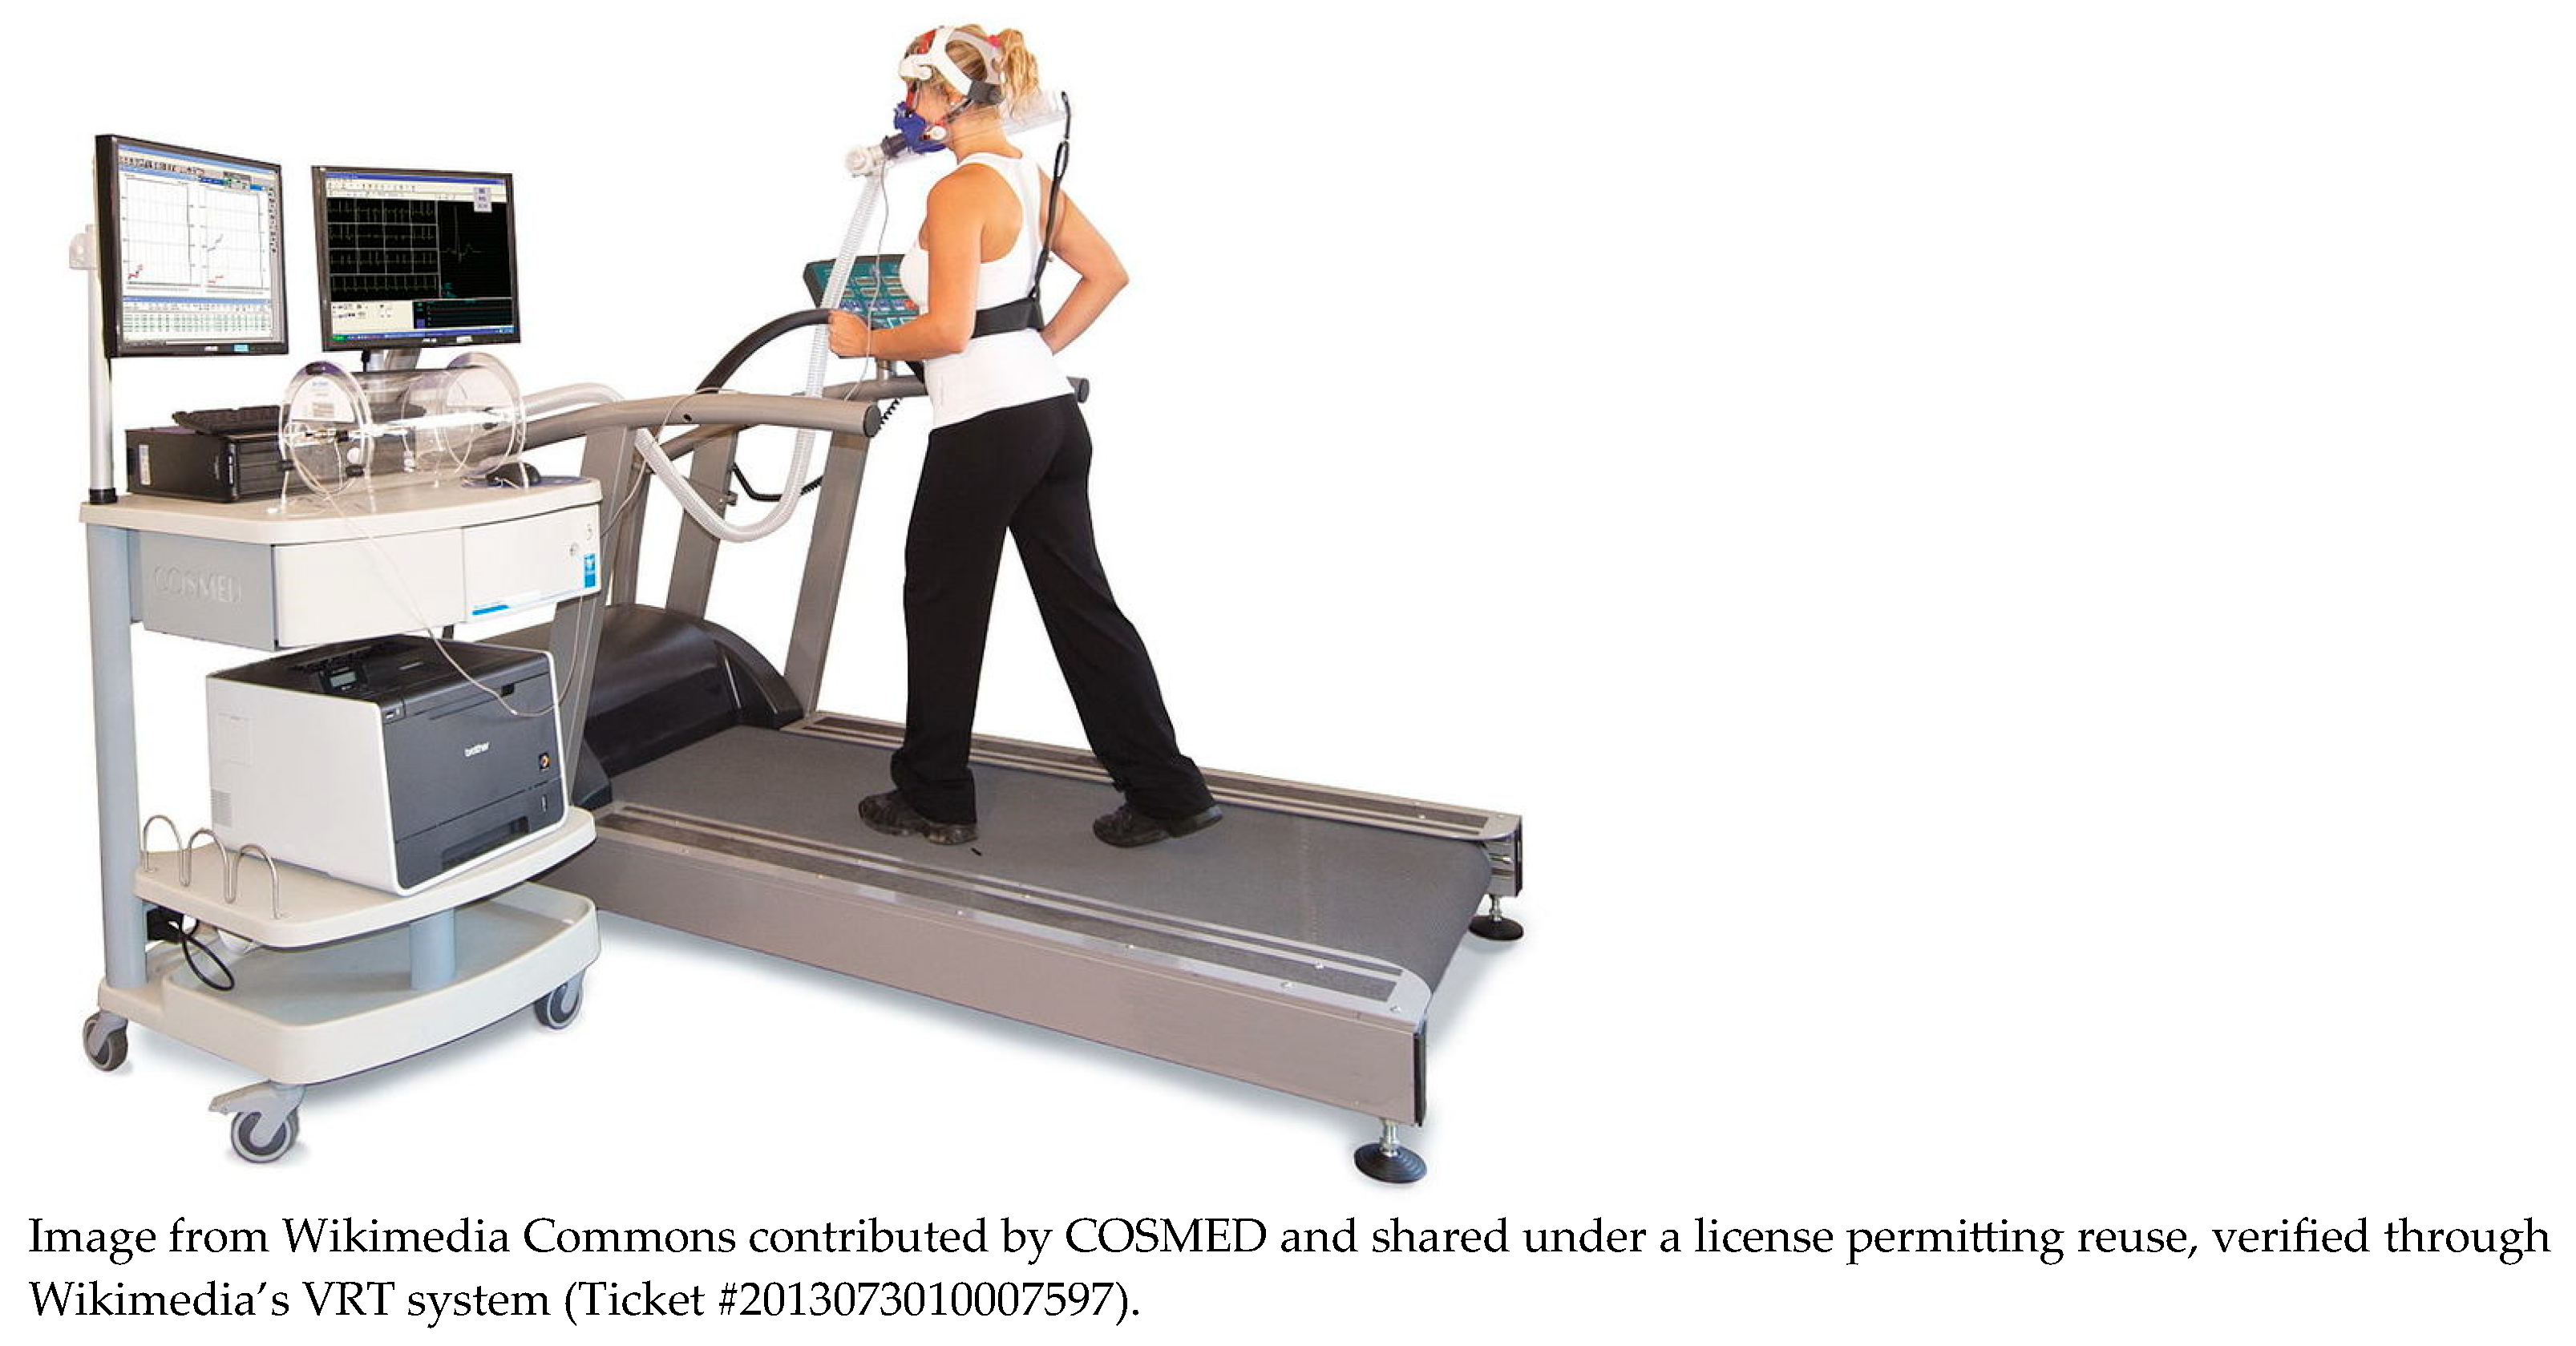
2max); however, its assessment typically requires a cardiopulmonary exercise test (CPET), involving lab-grade equipment (shown in
Figure 1, e.g., metabolic gas analyzers, ergometers, electrocardiogram), trained personnel, and maximal exertion from the participant.
Submaximal alternatives such as the Queens College Step Test [
4] offer practical alternatives. This standardized protocol involves stepping at a prescribed cadence for three minutes and then measuring the participant’s heart rate during recovery. The resulting post-test heart rate is used in validated equations to estimate VO
2max with reasonable accuracy. As a lower-burden alternative to CPET, the step test maintains clinical relevance while being simpler to administer, making it a practical bridge between wearable measurements and established fitness indicators. In this study, the heart rate predicted as if the participant had completed a step test serves as an intermediate variable, enabling VO
2max estimation from unconstrained, daily activity data.
While CPET is highly accurate, its complexity, cost, and physical demand limit its use in preventive care and for populations such as older adults or high-risk patients.
Wearable technologies offer a promising opportunity to improve CRF assessment by continuously collecting heart rate, SpO2, and motion data in a non-invasive, user-friendly way. Beyond capturing raw biomarkers, they also support real-time activity recognition, providing essential context for interpreting physiological changes. For example, an elevated heart rate during walking is expected, but the same value at rest may indicate a problem. By integrating this contextual layer, wearables enable more personalized and meaningful health insights.
Despite its clinical importance, CRF remains difficult to assess in real-world conditions, as traditional protocols require structured effort and specialized equipment, while passive monitoring often lacks the context needed to interpret physiological signals. This study investigates whether it is possible to estimate an individual’s cardiorespiratory capacity (specifically, their post step test heart rate) based on physiological behavior during natural, unconstrained activities. By analyzing responses to everyday tasks such as walking or folding clothes, our approach aims to bypass formal exercise protocols and support more scalable, user-centered fitness assessment in free-living environments.
1.1. Related Work
1.1.1. Protocol-Guided or Submaximal Exercise-Based Estimation
Several studies have estimated VO
2max using structured submaximal protocols such as step tests, cycling, or treadmill walks, aiming to reduce the burden of maximal cardiopulmonary testing while preserving predictive accuracy. For instance, Sheridan et al. [
5] used team sport simulations to estimate oxygen uptake from inertial and heart rate data, and Wiecha et al. [
6] predicted VO
2max using submaximal effort and body composition in athletes. Akay and Abut [
7] reviewed machine learning and statistical models applied to VO
2max prediction in structured environments. Though more accessible than maximal tests, these methods still require supervised physical effort and synchronization with protocols, often targeting specific populations, limiting their applicability in broader, unsupervised real-world settings.
1.1.2. Wearable-Based Estimation of Cardiorespiratory Fitness
Recent studies have used consumer-grade wearables to estimate CRF in semi-controlled or free-living environments, typically using heart rate, step count, or photoplethysmography (PPG) data. Neshitov et al. [
8], for example, estimated CRF from heart rate and step count collected during free-living activity, but their method required at least 200 min of active data, limiting its use for real-time or short-duration assessments.
Similarly, Spathis et al. [
9] introduced a longitudinal approach to VO
2max prediction using wearable data, emphasizing the value of repeated measures over time. While promising, this approach requires prolonged usage and assumes consistent device adherence, as the window size is one week of data. In a more controlled setting, Hsiao et al. [
10] developed a custom wearable system incorporating multichannel PPG to estimate VO
2 during treadmill exercise, showcasing real-time estimation capabilities but still requiring structured physical effort and specialized hardware.
While wearable-based CRF models have advanced non-invasive fitness assessments, many still depend on long-term tracking, structured effort, or device-specific setups, limiting their use for rapid or flexible deployment. In contrast, our two-model framework provides a faster, context-aware estimation from just a few minutes of wearable data collected during natural activities, making it well suited for opportunistic use in real-world settings.
1.1.3. Modeling CRF with Indirect or Non-Exercise Features
Recent approaches have explored estimating CRF without requiring structured physical exertion. Instead of relying on exercise protocols, these models infer fitness from demographic data, short physiological snapshots, or latent health indicators. For instance, Lee and Park [
11] proposed a deep learning model that predicts health status from ordered questionnaire responses, demonstrating the feasibility of low-effort CRF estimation.
A promising alternative involves two-step strategies that first predict an intermediate value, like post-exercise heart rate, then estimate CRF using validated formulas. This preserves alignment with VO2max while avoiding maximal or submaximal testing, offering a practical balance between accuracy and accessibility in settings where traditional protocols are impractical.
1.1.4. Human Activity Recognition Using Inertial Sensors
HAR is a core application of wearable sensing, especially with inertial measurement units (IMUs) that capture motion in free-living conditions. Deep learning models such as Convolutional Neural Networks (CNNs) and Long-Short Term-Memory LSTMs have improved classification accuracy, moving from handcrafted features to end-to-end learning [
12]. Qureshi et al. [
13] reviewed HAR challenges, including sensor variability, class imbalance, and real-time demands. While HAR is mainly used for context inference, its integration into health analytics is expanding. Recognizing physical activity enriches physiological signal interpretation and supports context-aware modeling, yet few HAR systems connect activity context with individualized physiological responses in CRF estimation.
1.2. Study Proposal: Context-Aware Step Test HR Estimation from Wearable Data
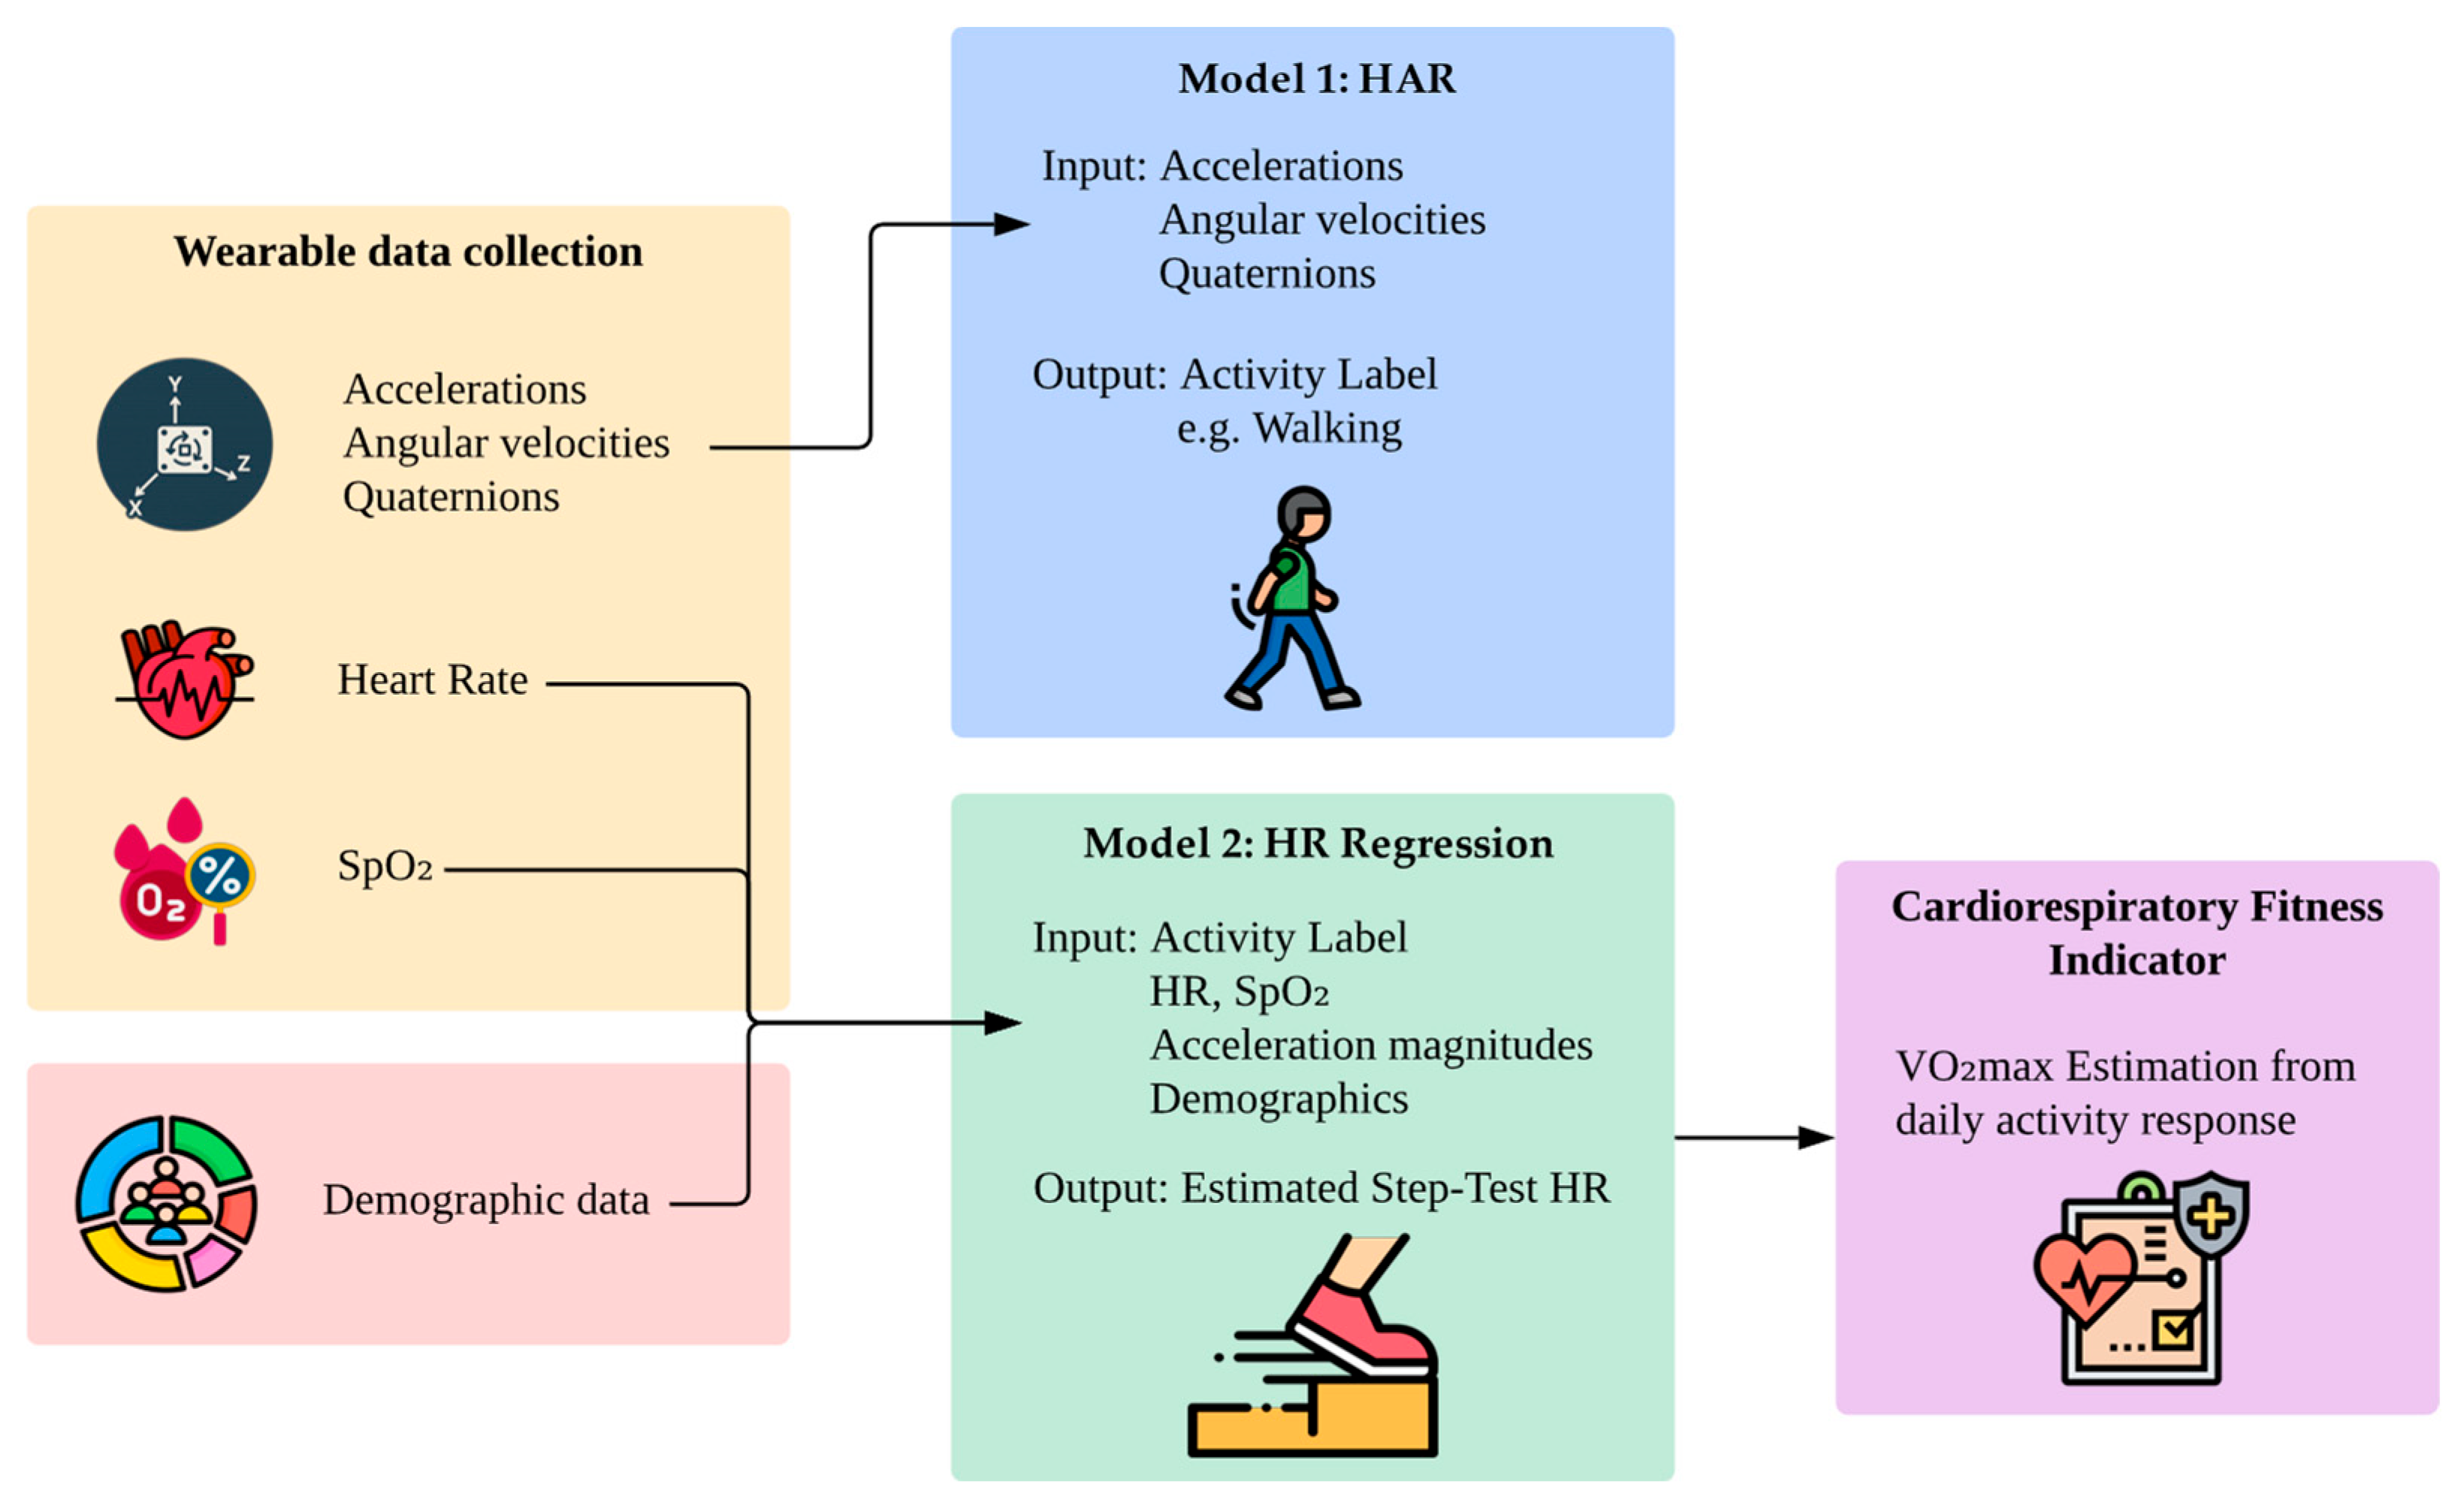
This study introduces a novel two-model framework for indirectly estimating cardiorespiratory fitness from wearable sensor data collected during daily life, eliminating the need for structured exercise testing or prolonged tracking. The key innovation lies in combining context-aware activity recognition with physiological modeling to approximate a step test-equivalent heart rate.
The first model employs a HAR model to classify physical activities based on inertial sensor data. In the second model, the classified activity, combined with physiological signals (heart rate and oxygen saturation), motion features, and demographic information, is used to predict the heart rate the individual would exhibit after completing a standardized step test.
Figure 2 illustrates the full pipeline of the proposed method. Wearable devices capture accelerations, angular velocities, quaternions, heart rate, and SpO
2 during daily activities, while demographic variables such as age, sex, and body composition are collected separately. Model 1 uses motion features to infer the current activity. Model 2 then uses the corresponding activity label, collected independently during the protocol, alongside physiological signals and user metadata to estimate the step test-equivalent heart rate. Although both models use activity context, they are trained independently.
By modeling natural physiological responses during free-living activities, this approach introduces a new path toward unsupervised, low-burden fitness assessment. Unlike prior CRF estimation methods that require structured exertion, dedicated testing, or long-term data aggregation, this framework allows opportunistic CRF estimation from just a few minutes of wearable data, supporting real-world deployment in remote and preventive care.
1.3. Contributions and Paper Organization
The main contributions of this work include: (1) a unified framework that integrates activity recognition and physiological modeling to estimate step test-equivalent heart rate from daily wearable data, and (2) an indirect method for VO2max estimation that does not require participants to follow formal exercise protocols. Future directions include expanding the dataset to incorporate broader demographic and health diversity, replacing activity classification with effort-based regression for more generalized modeling, and validating predicted fitness indicators against direct VO2max measurements obtained via gas exchange analysis in clinical settings.
The rest of the paper is structured as follows:
Section 2 details the study protocol, wearable setup, data processing, and models.
Section 3 presents evaluation results for activity classification and heart rate prediction.
Section 4 discusses the implications, limitations, and future directions.
Section 5 concludes with a summary of contributions and the significance of this approach for health monitoring.
2. Materials and Methods
This section describes the experimental protocol, data collection procedures, wearable setup, preprocessing steps, and deep learning architectures used in the study. It outlines how participants were recruited and monitored using wearables during a structured protocol involving real-world physical activities. Two separate pipelines were established: one for HAR and another for estimating post-exercise heart rate through regression.
2.1. Participants and Protocol
This study received ethical approval from the Institutional Review Board (IRB) of the University of Puerto Rico. All research procedures complied with the ethical standards set by the Collaborative Institutional Training Initiative (CITI Program) for research involving human participants. Approval was granted prior to the start of data collection. Before participating, each subject received a full explanation of the study’s objectives and procedures and provided written informed consent. To ensure participant’s safety, all individuals completed the Physical Activity Readiness Questionnaire (PAR-Q) and disclosed basic health information prior to participation.
Data collection took place in a controlled indoor environment that adhered to ANSI/CTA recommendations for real-world testing [
14]. The room was private, free from distractions, and maintained under consistent conditions, including a constant temperature of 21 °C, with lighting and humidity levels set within comfortable indoor ranges. These measures were intended to minimize external influences on physiological measurements and promote participant comfort throughout the experimental protocol.
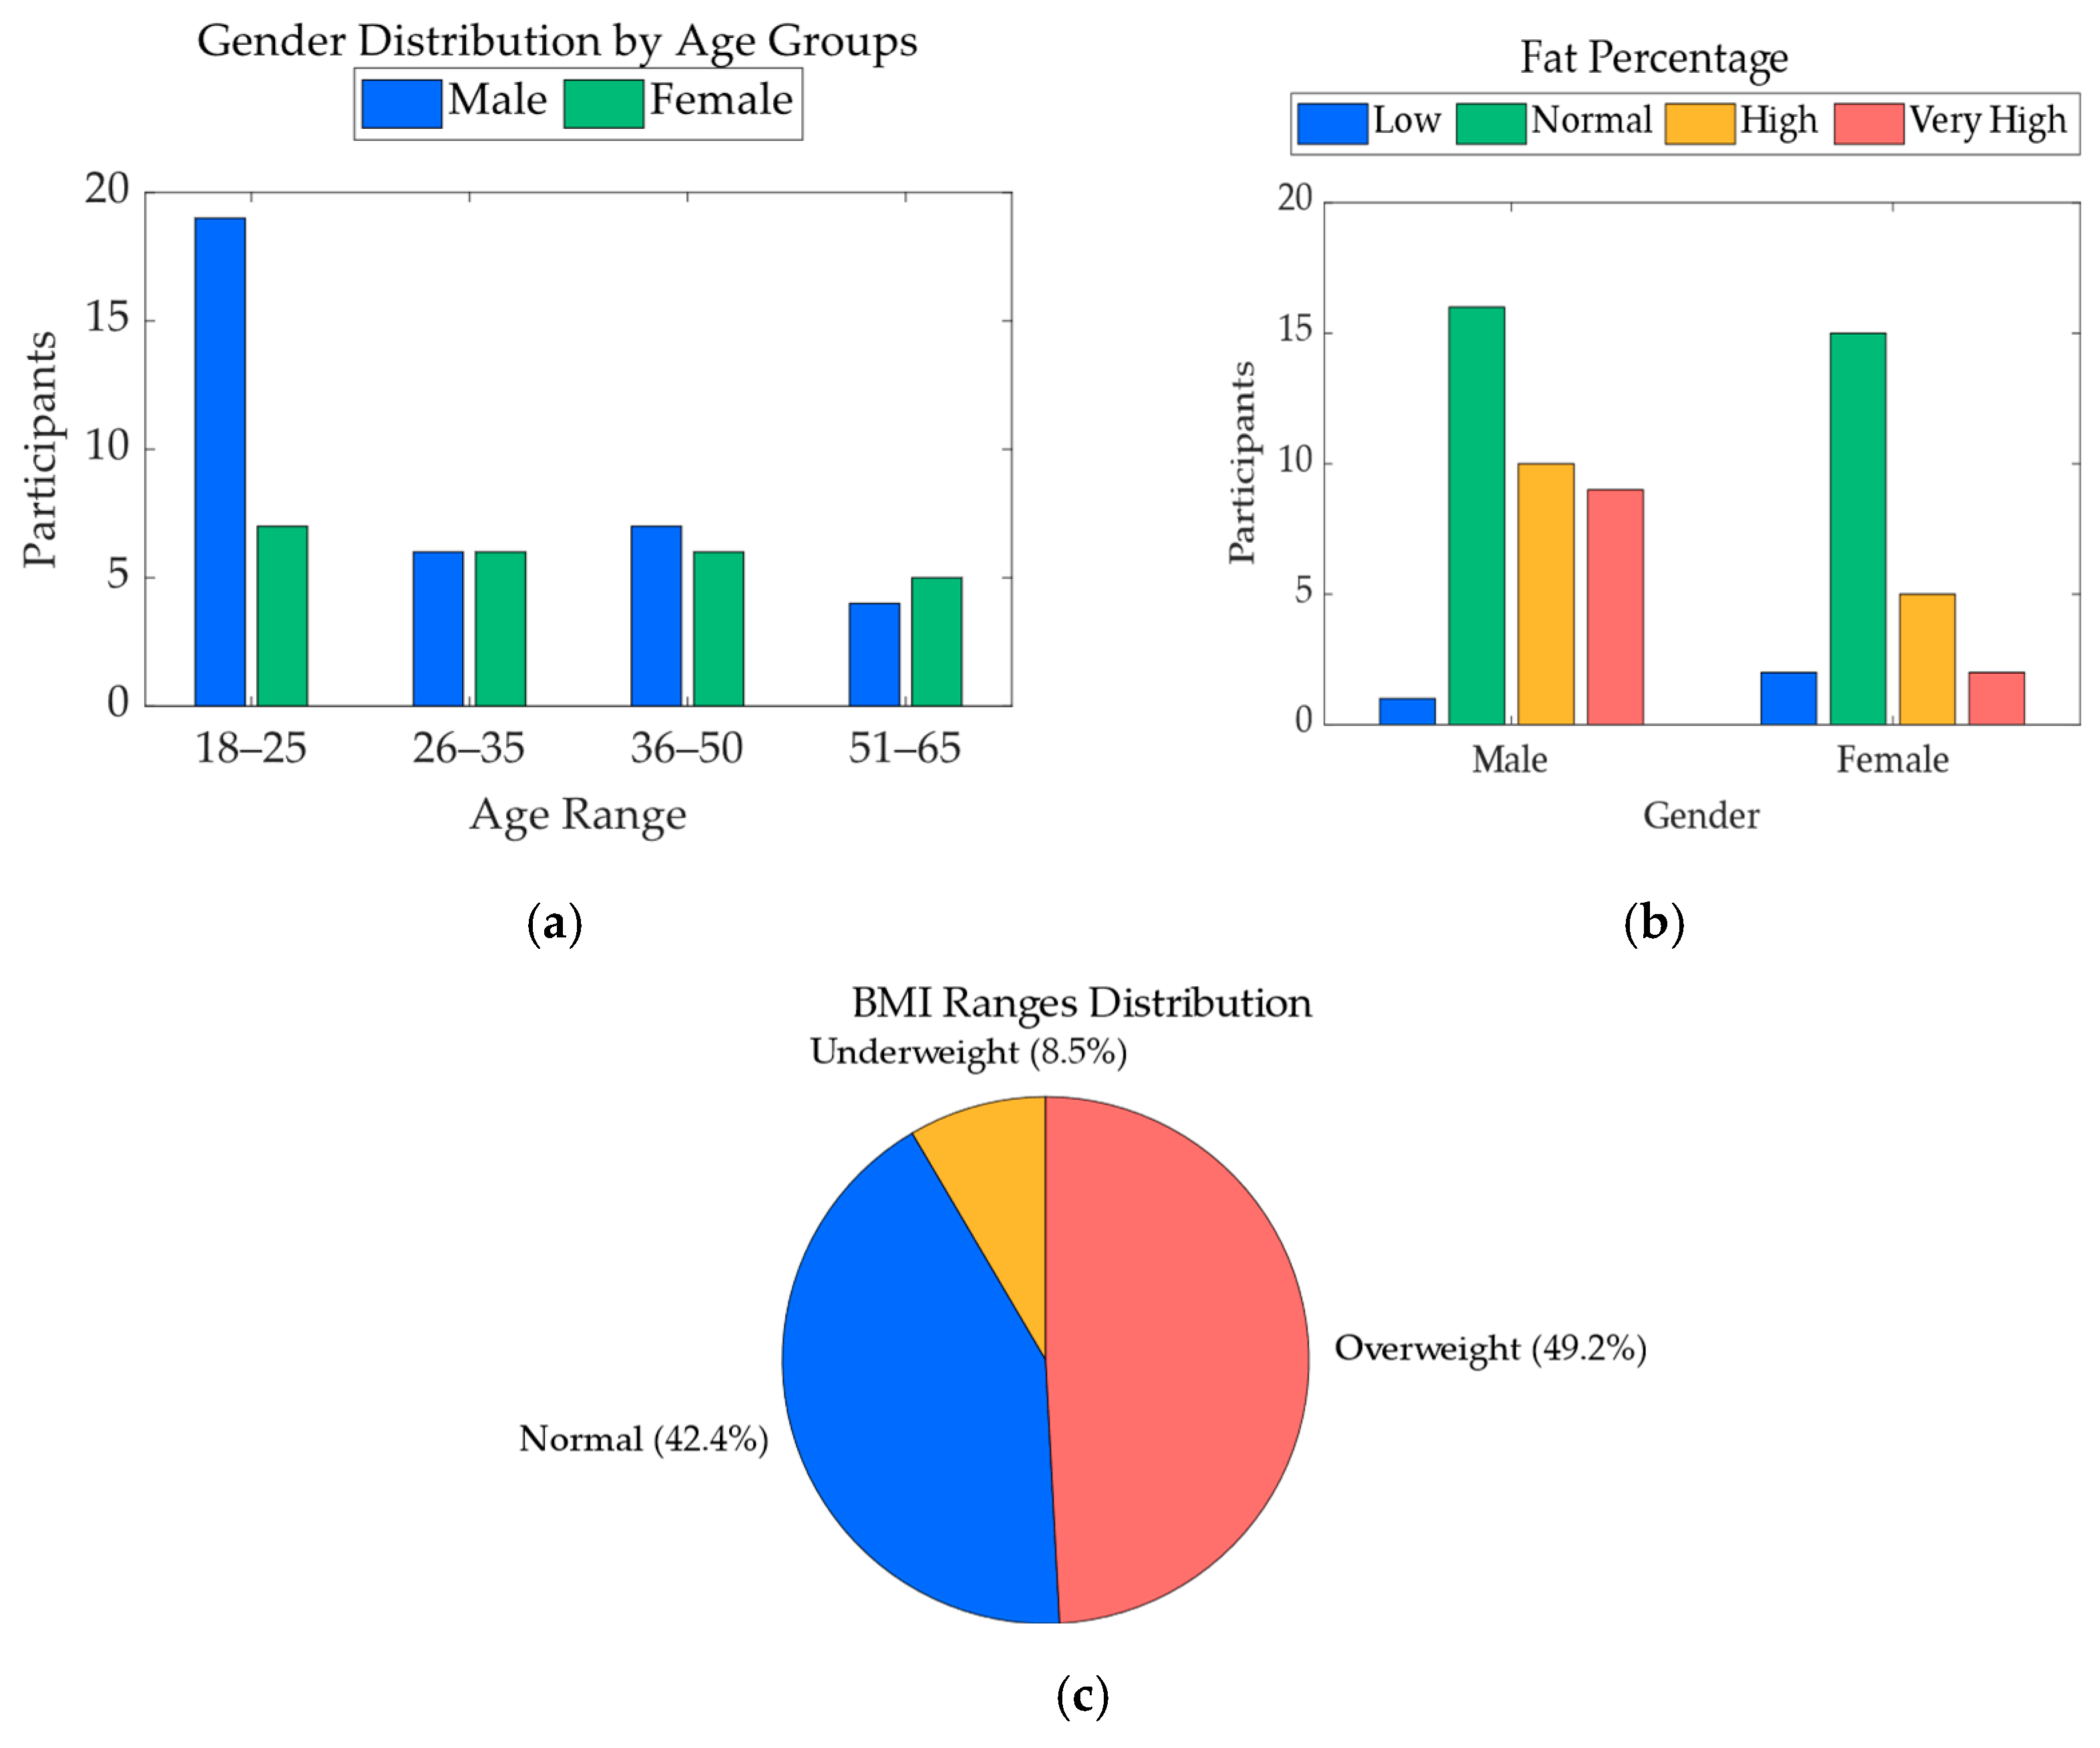
A total of 67 participants were initially enrolled in the study. However, data from 7 participants were excluded from the final analysis due to issues affecting the quality or completeness of the recorded data. The resulting dataset includes 60 participants, consisting of 36 males and 24 females, with ages ranging from 19 to 64 years. For each participant, key demographic variables were collected, including age, sex, height, weight, body fat percentage, and body mass index (BMI). These variables were used to characterize the study population and were also included as features in the heart rate regression model.
Figure 3 illustrates the demographic distribution of the final participant pool, including sex proportions, age ranges, body fat percentage, and BMI categories. This visual summary highlights the diversity in body composition and physical profiles across the sample, supporting the robustness of the physiological modeling approach.
Each participant began the session by performing the Queens College Step Test [
4], a standardized submaximal exercise protocol used to assess cardiorespiratory recovery. The test involves stepping up and down on a platform at a fixed cadence of 24 steps per minute for men and 22 steps per minute for women, over a period of three minutes. Maintaining this cadence is essential for producing consistent post-exercise heart rate responses, which are later used to estimate cardiorespiratory fitness. Participants were given verbal instructions, and a metronome was used to help them keep the correct rhythm. At the end of the test, the heart rate was measured manually at the wrist by a trained researcher.
Following the step test, wearable sensors were placed on the participants to monitor physiological and motion data during a sequence of activities. Details about the sensor setup, body placement, and signal types are provided in
Section 2.2.
After the step test and sensor setup, each participant completed a structured activity protocol designed according to the ANSI/CTA-2108 Framework for Validation of Health Technology Derived Metrics under Naturalistic or Unconstrained Conditions [
15] and the ANSI/CTA-2065.1 Standard for Physical Activity Monitoring for Heart Rate—Real World Analysis [
14]. Activity intensity levels were categorized following CTA-2074 guidelines [
16], which define physical effort using Metabolic Equivalent of Task (MET) values and real-world examples. The protocol included alternating periods of rest, light, moderate, and vigorous activity, simulating common daily tasks while eliciting varied cardiovascular responses.
The full activity protocol lasted 37 min and was consistent with all participants. Activities were selected to cover a representative spectrum of daily movements with increasing physiological demand.
Table 1 summarizes the activity types, their assigned MET values, and their corresponding activity codes from the 2024 Adult Compendium of Physical Activities [
17].
This sequence allowed for the capture of wearable data across a realistic range of physical intensities, while incorporating recovery periods to observe heart rate dynamics. To ensure consistent task execution, an automated timer system provided visual and auditory cues to the participants at each activity transition, indicating the start and end of every segment.
2.2. Wearable Setup
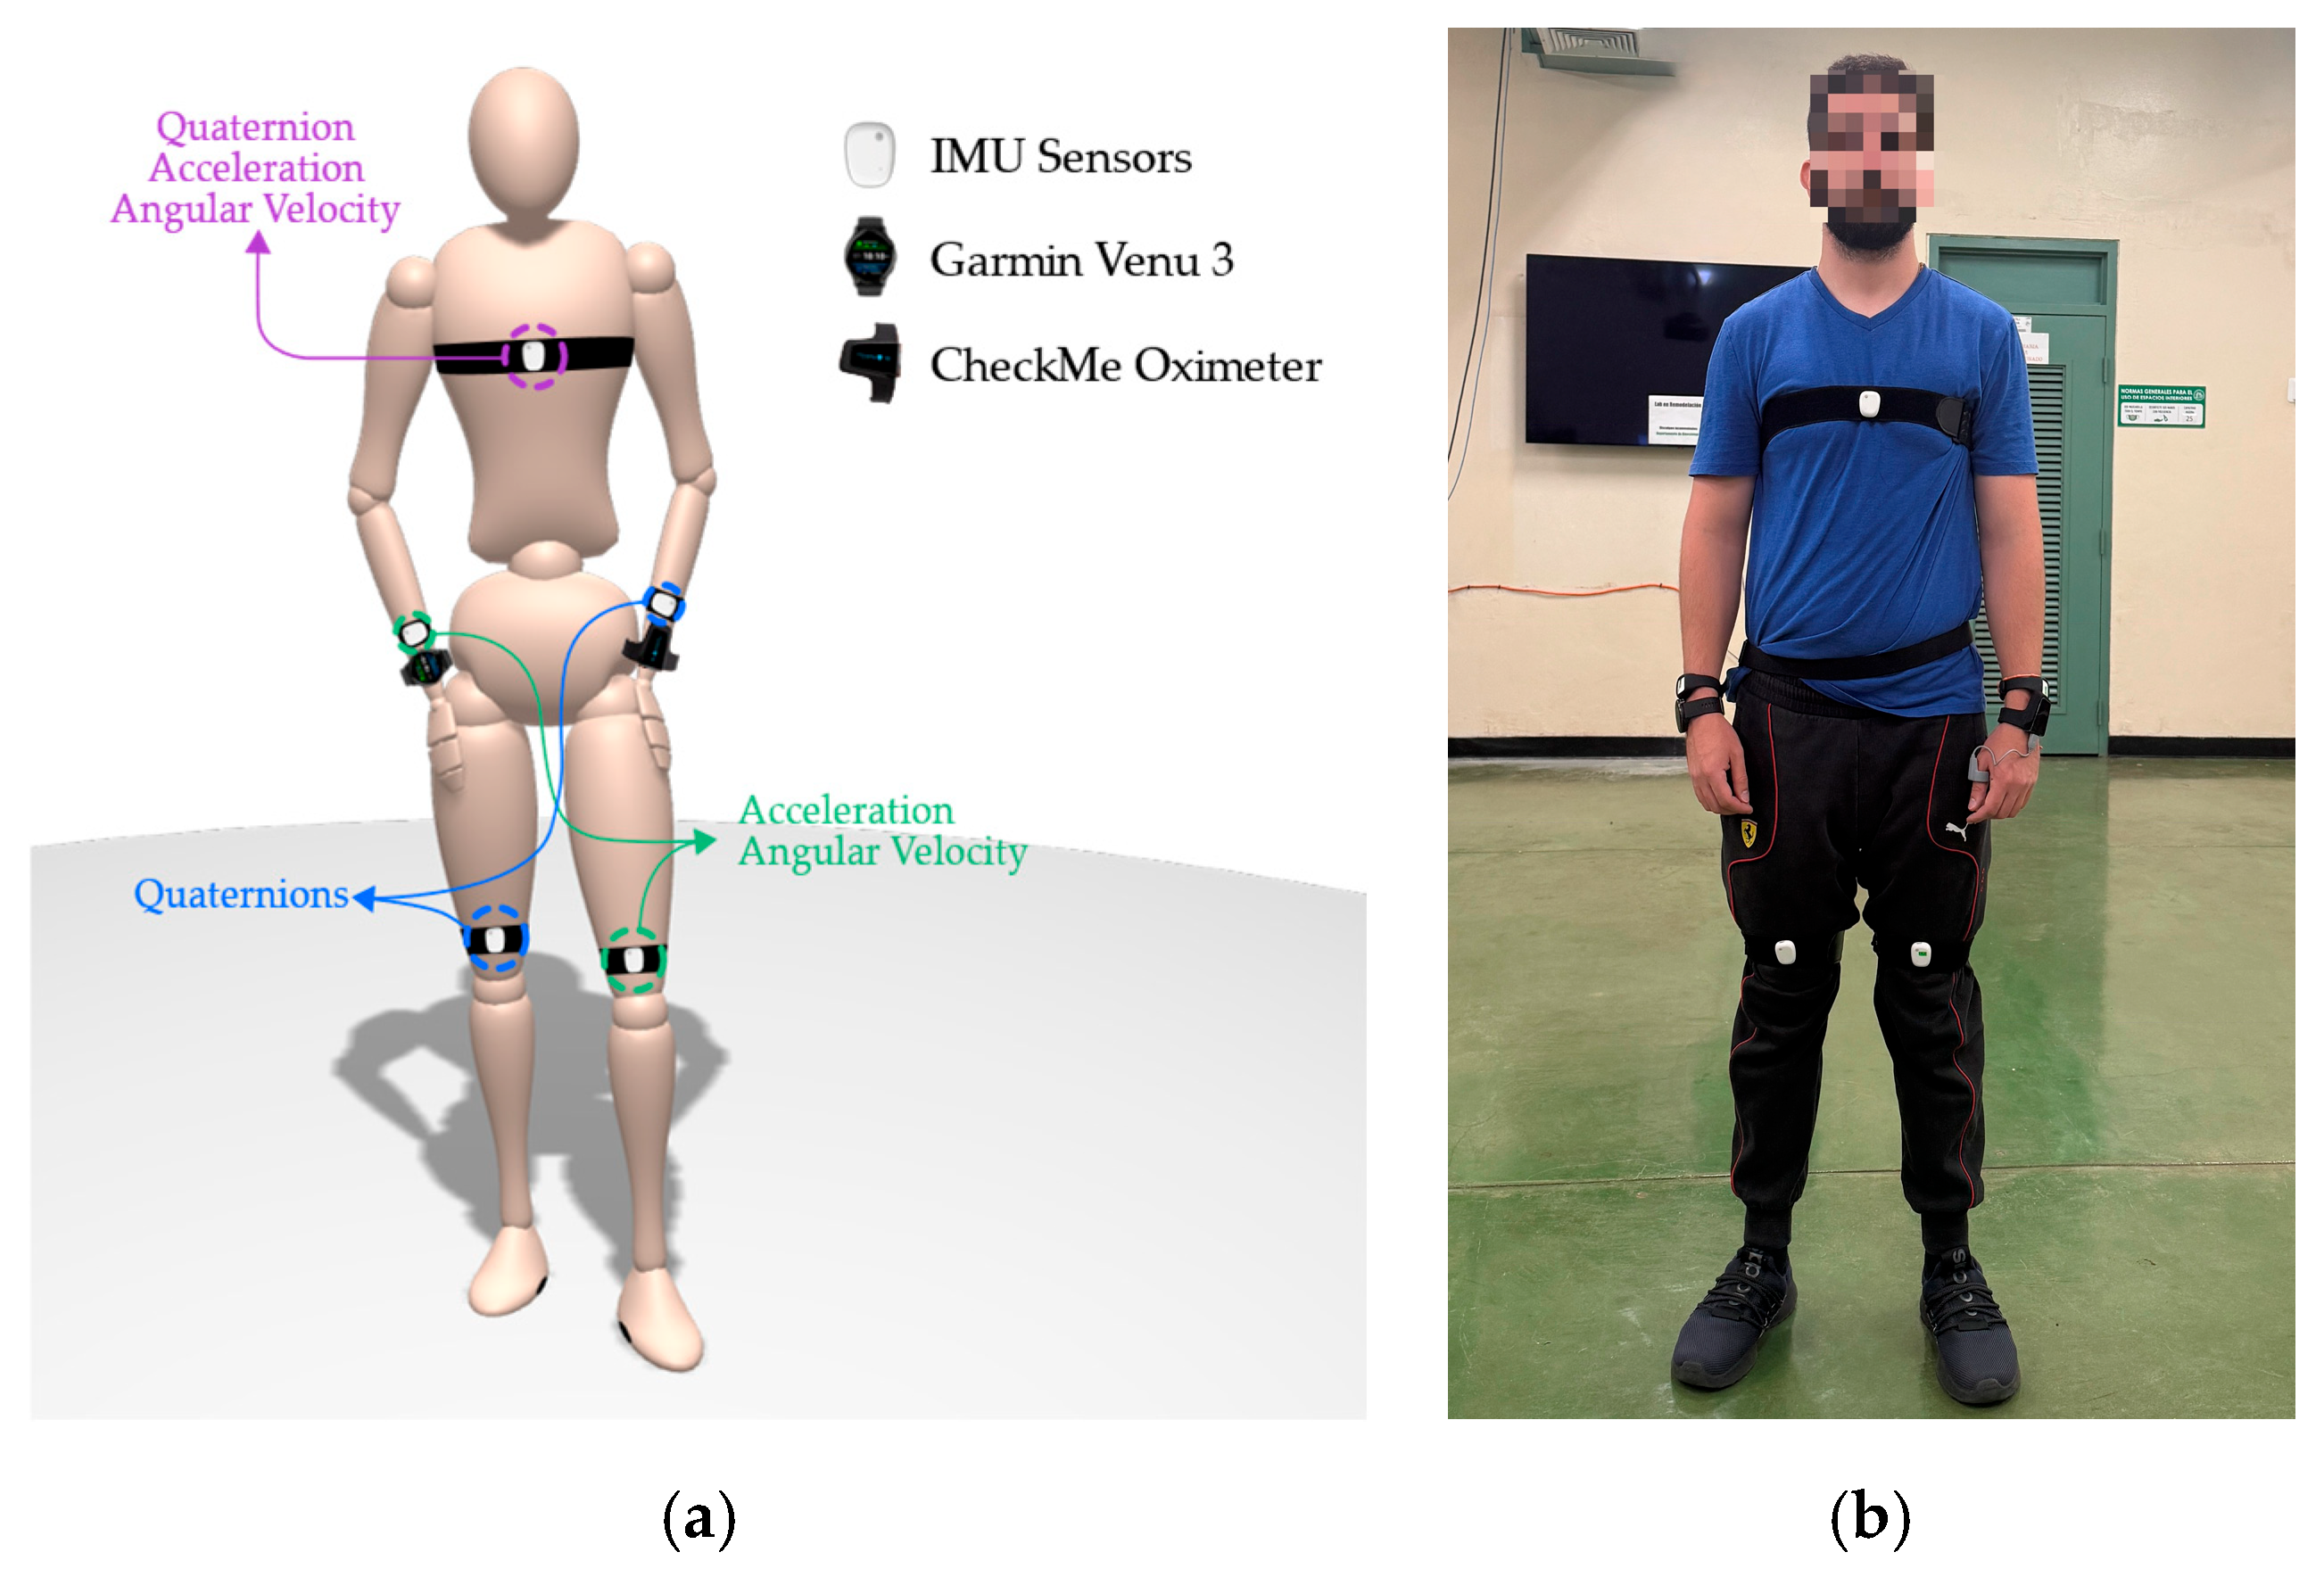
To capture detailed biomechanical and physiological signals, participants were instrumented with a combination of motion sensors and wearable biomarker devices. The motion capture setup was designed to ensure symmetry and provide coverage of both the upper and lower limbs, as well as the torso. A total of five Inertial Measurement Units (IMUs) MetaMotionRL from MbientLab Inc. were used, positioned on the chest, left hand, right hand, left knee, and right knee. These IMUs operated in streaming mode during the activity protocol and transmitted their data via Bluetooth after each session for synchronization and storage. Each IMU captured a specific subset of motion features:
Chest: Quaternions, tri-axial acceleration, and gyroscope (50 Hz);
Left hand: Quaternions only (50 Hz);
Right hand: Acceleration and gyroscope (50 Hz);
Left knee: Acceleration and gyroscope (50 Hz);
Right knee: Quaternions only (50 Hz).
The asymmetrical configuration resulted from hardware limitations: the MetaMotionRL sensors could not record quaternions and raw acceleration/gyroscope data simultaneously. To balance signal diversity while minimizing device count, we adopted a complementary layout, assigning quaternions to one limb and acceleration/gyroscope to the opposite. This strategy leveraged the symmetric nature of the protocol’s activities (e.g., walking, sweeping), allowing mirrored motion patterns to be inferred. Moreover, prior findings [
18] showed that quaternion-based representations improve classification performance, and that full-body instrumentation can be reduced without significant loss of accuracy, supporting the idea that a reduced, strategically distributed configuration can still capture the essential features for activity recognition. The chest sensor was assigned the most comprehensive sensing role, serving as a central anchor point to contextualize upper and lower limb movements with respect to the trunk.
IMU calibration was performed immediately following sensor placement on each participant. After all devices were secured, participants were instructed to sit upright with their hands resting on their knees and remain still. During this neutral and reproducible posture, the IMUs were initialized and calibrated to establish a reference frame for motion tracking. Since individual posture and body geometry vary across participants, the resulting orientation references naturally differed between subjects. This strategy promotes robustness and real-world applicability, enabling the model to tolerate small deviations in sensor alignment or anatomical differences, conditions that are common in everyday use.
To track orientation, quaternions were used instead of Euler angles, as they prevent the gimbal lock effect and support smooth, multi-axis rotational representation; as validated in our previous work [
19]. This combination of data quality and minimal sensor burden supports both modeling accuracy and future real-world deployment.
For physiological monitoring, two wrist-worn devices were used, each capturing HR and SpO
2 at a sampling rate of 0.5 Hz. A Garmin Venu 3 smartwatch, worn on the right wrist, and a CheckMe™ oximeter, worn on the left wrist, provided redundant measurements for cross-validation and robustness during motion. During data review, the Garmin watch occasionally returned zero values for SpO
2 during movement periods, indicating signal dropout, in contrast, the CheckMe™ oximeter provided more stable and complete recordings. As a result, SpO
2 data from the CheckMe™ was prioritized during preprocessing to ensure signal continuity.
Figure 4 provides a schematic overview of sensor placement, indicating the precise body locations and signal types associated with each device.
To ensure temporal alignment across all sensor inputs, including IMUs and physiological devices, linear extrapolation based on timestamps was used for synchronization. This step enabled frame-level integration of biomechanical and cardiorespiratory data, resulting in a rich, unified dataset suitable for downstream analysis in both activity classification and physiological modeling. The collected dataset is available in the resource [
20].
2.3. Data Processing
2.3.1. Preprocessing for Human Activity Recognition
Raw IMU data collected at 50 Hz, including acceleration, gyroscope, and quaternion signals, underwent a multi-step preprocessing pipeline prior to activity classification.
First, signals were smoothed using a fifth-order Butterworth low-pass filter with a cutoff frequency of 5 Hz, which preserves human movement frequencies while eliminating high-frequency noise. The filtered signals were then Z-score normalized feature-wise, with the mean and standard deviation computed per feature channel and per participant, to account for inter-individual differences in baseline physiology and motion patterns, ensuring that the model focuses on relative changes over time rather than being biased by absolute values that vary naturally across individuals.
To assign activity labels, each sample was timestamp-aligned and segmented into predefined time intervals according to the standardized activity protocol. A 5 s margin was trimmed after each activity transition to reduce transitional noise and avoid label ambiguity.
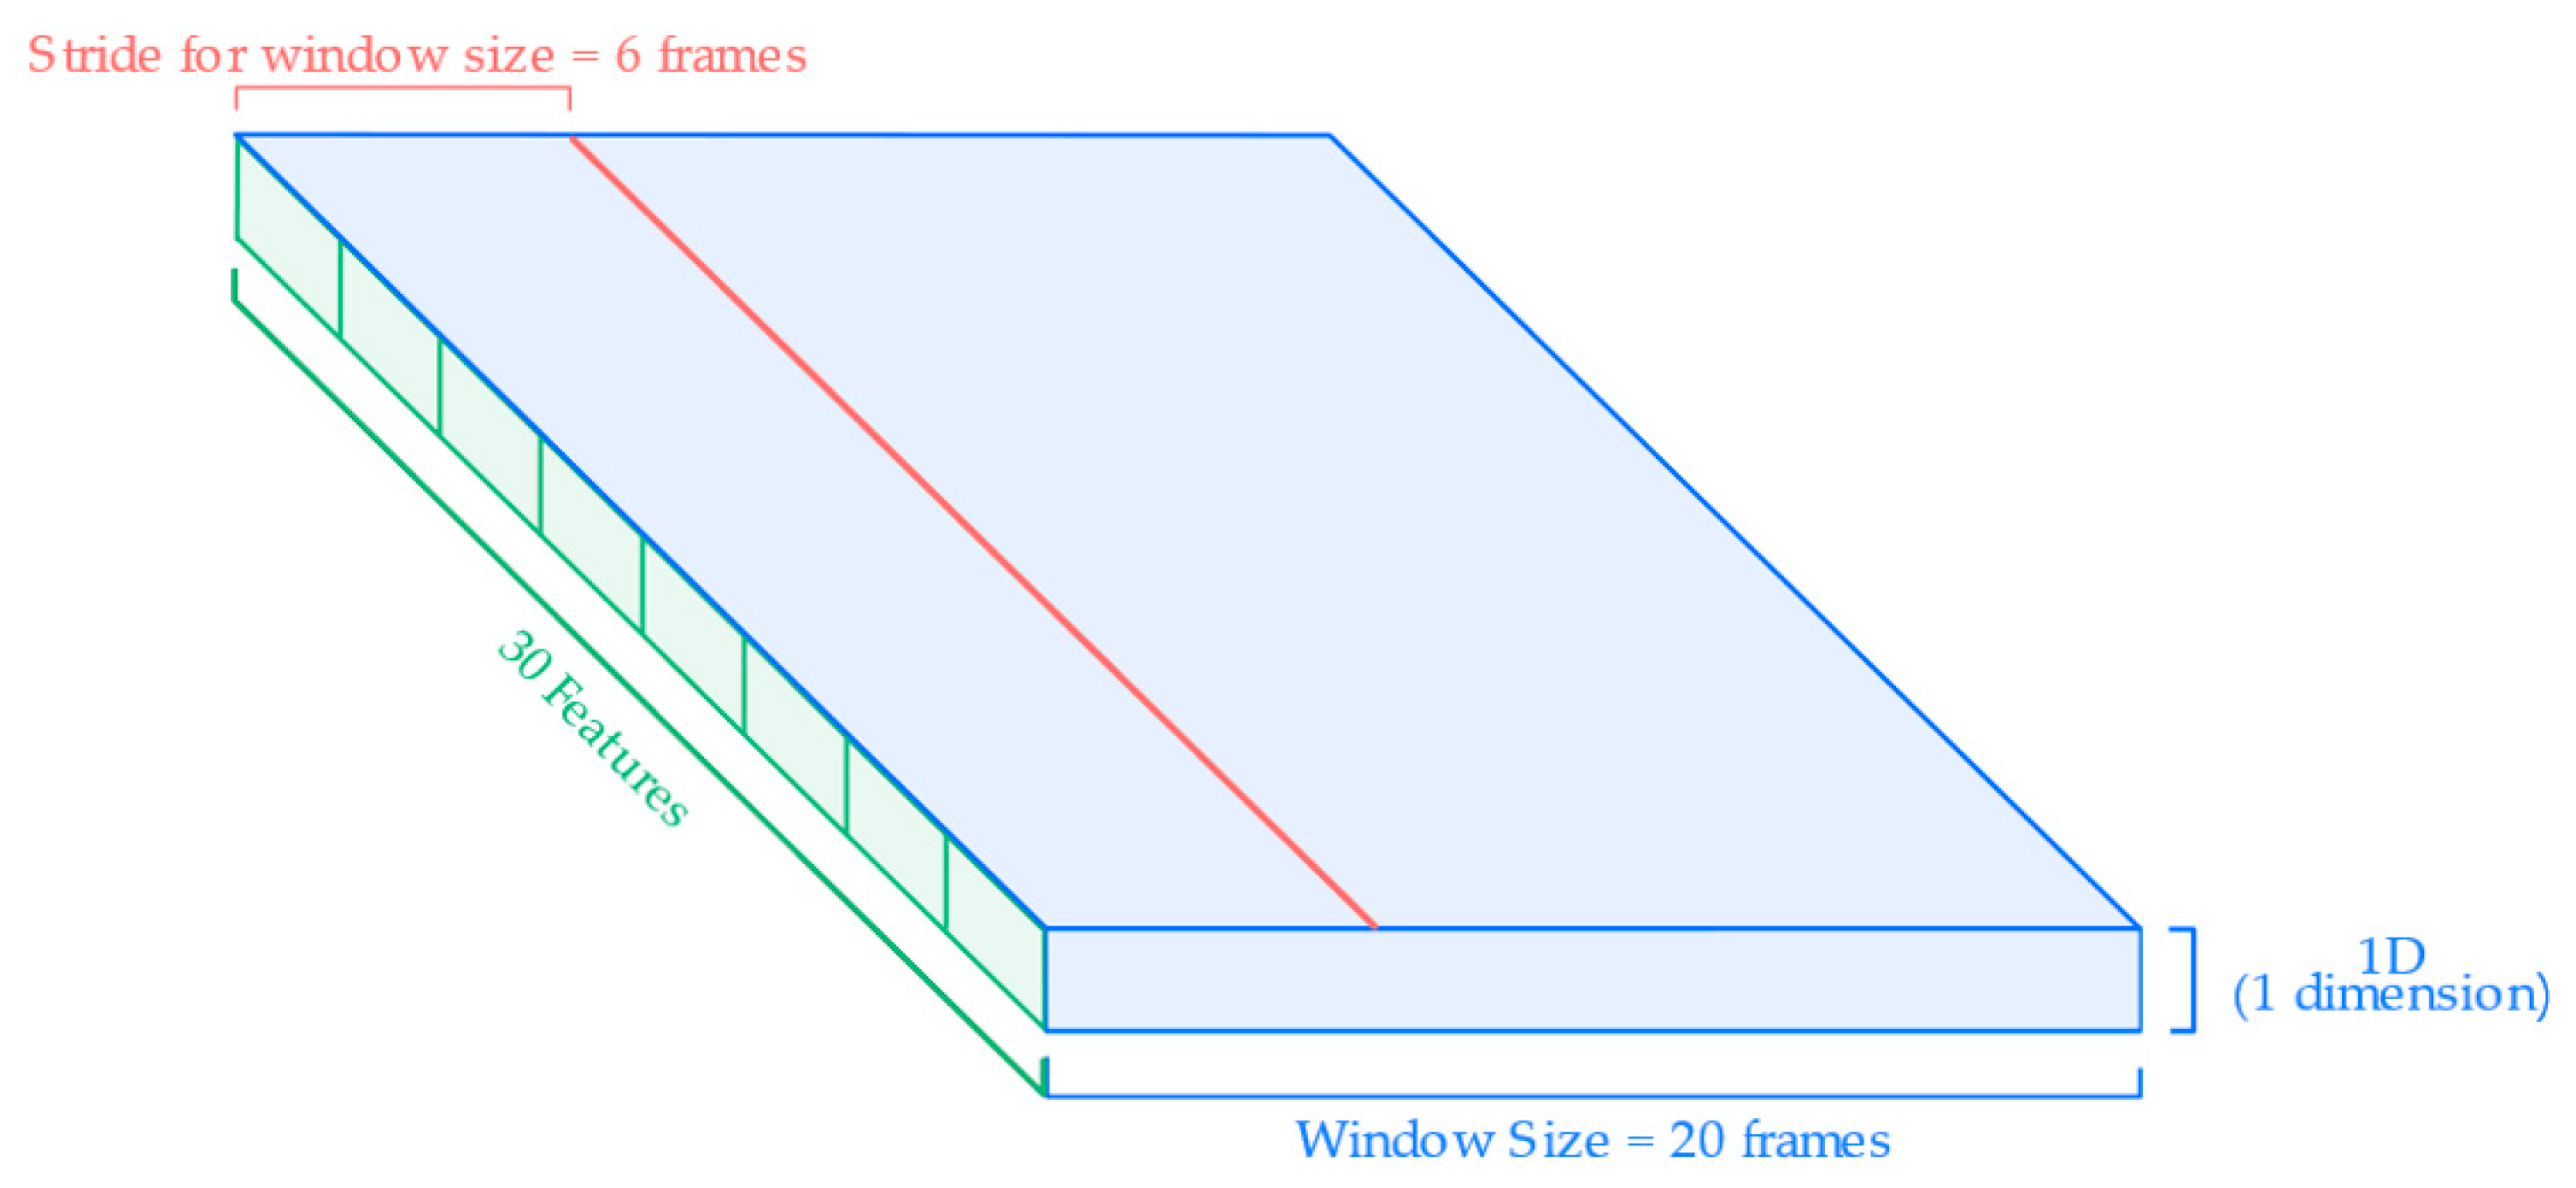
After labeling, the continuous signal was segmented into overlapping sliding windows to create fixed-length samples for input to the neural network.
Figure 5 illustrates the segmentation and input structure used for HAR model training. Each input sample consists of a sliding window of 20 frames (0.4 s) and is defined by a set of individual features derived from the wearable sensors. These features include quaternions, linear accelerations, and angular velocities collected from the chest, knees, and hands, based on the specific sensor configuration described in
Section 2.2. Each signal component (e.g., x, y, z of acceleration or w, x, y, z of quaternions) is treated as a separate input feature in the model. The windowing process uses a stride of 6 frames, resulting in a 70% overlap between windows. This approach maximizes the temporal resolution of the input while preserving the sequential structure of the movement data.
2.3.2. Preprocessing for Heart Rate Regression
For the HR regression task, the pipeline integrated synchronized physiological, biomechanical, and demographic data into a unified input structure suitable for deep learning. The goal was to model how each individual’s body responded to natural activities to predict their step test-equivalent heart rate.
For the sequential data, time-series signals were collected at 0.5 Hz and formed the basis of the sequential input branch. These included:
HR and SpO2 recorded at 0.5 Hz;
Acceleration magnitudes computed from tri-axial accelerometer data at the chest, left knee, and right hand. Each signal was first filtered with a 5th-order Butterworth low-pass filter (cutoff = 5 Hz) and then downsampled to match the 0.5 Hz sampling rate of the biomarkers.
This set of five features per time step formed the sequential portion of the input matrix, capturing the moment-to-moment physiological and motion response of the participant during the activity protocol.
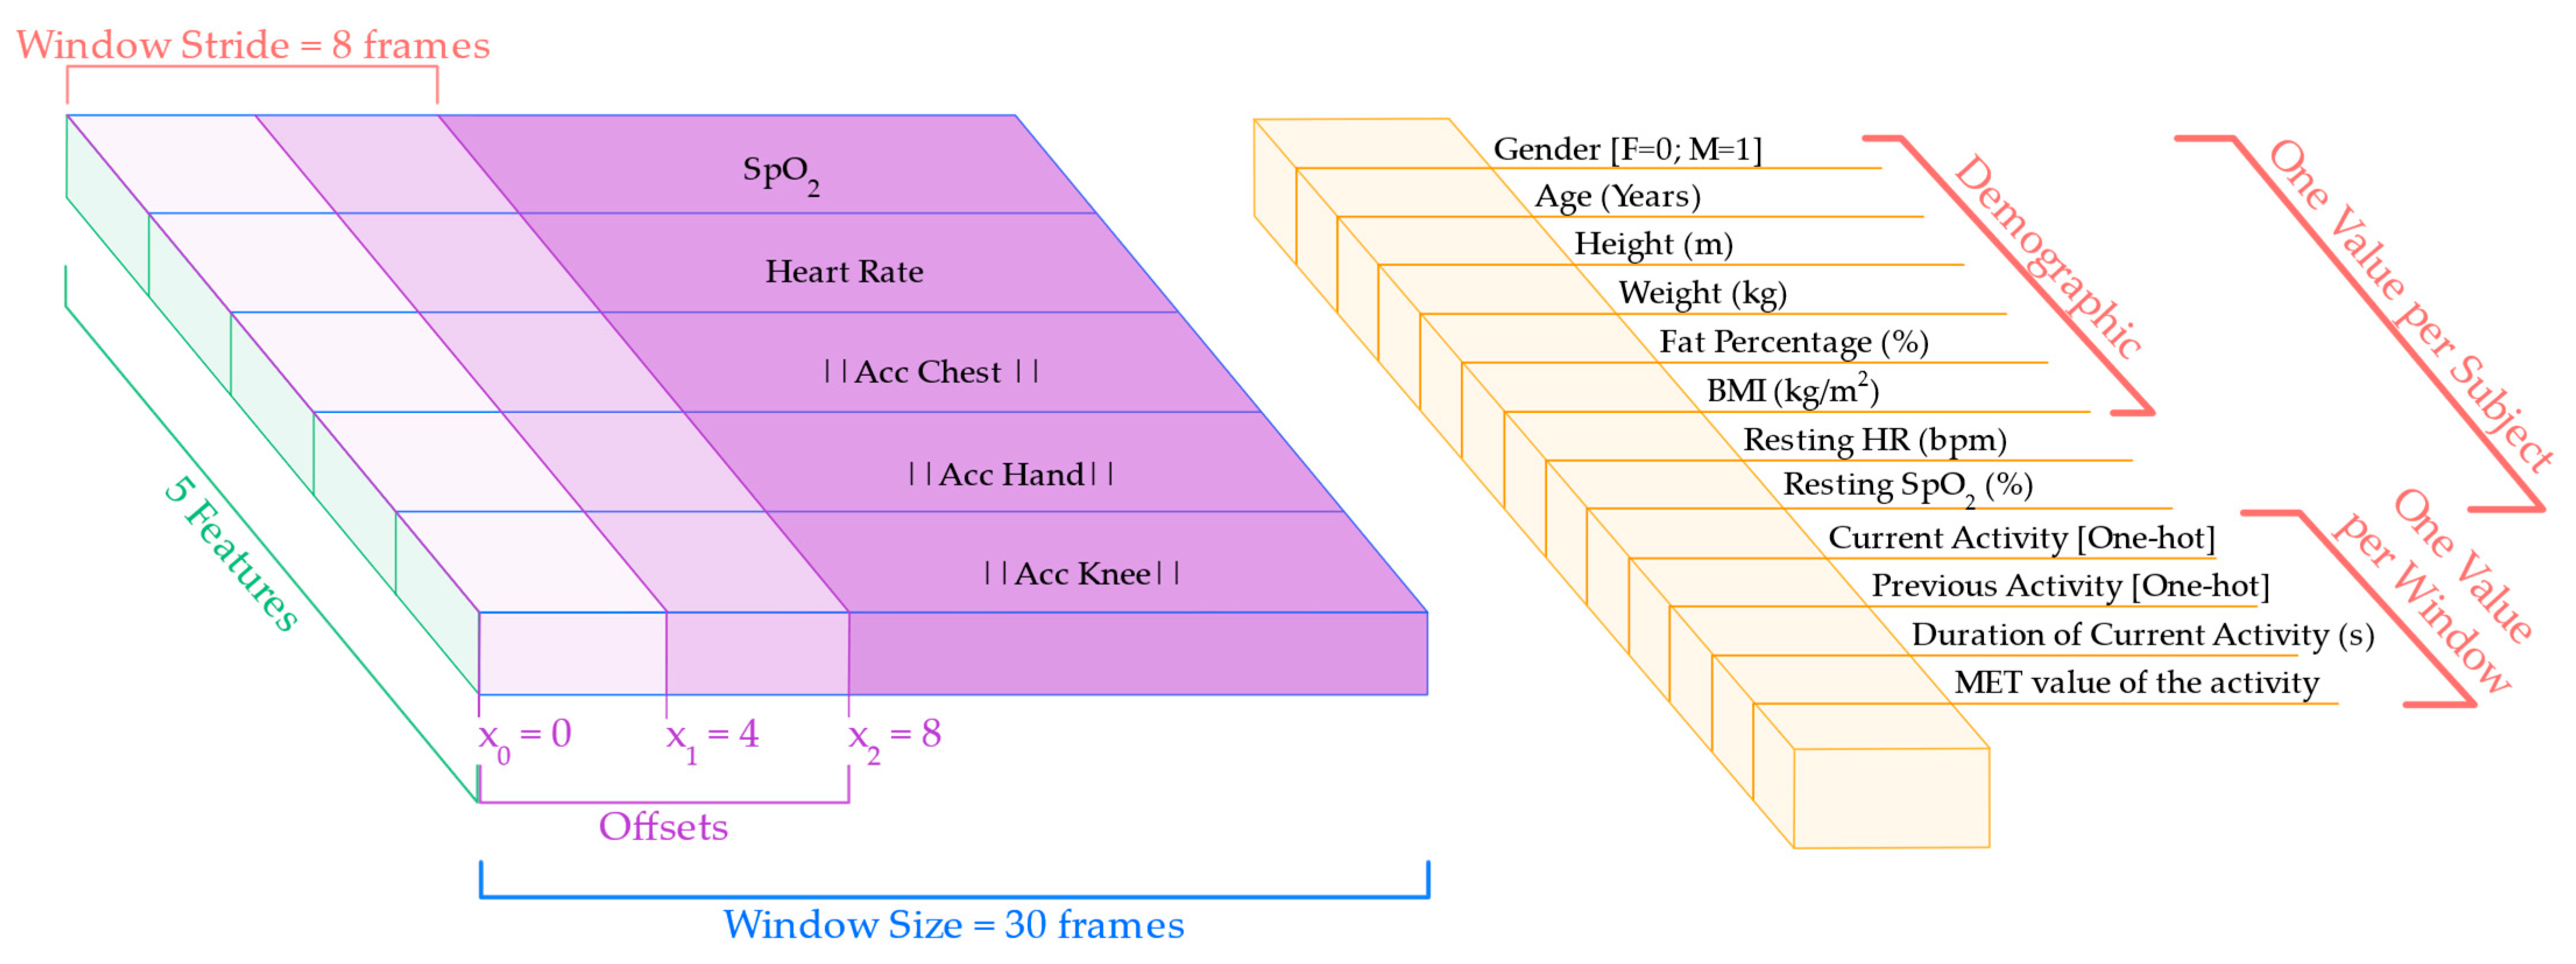
To capture temporal patterns in physiological response, the sequential data was segmented into sliding windows of 30 frames, corresponding to 60 s of continuous activity. This window size was selected to reflect a typical adaptation timescale of HR and SpO2 to physical effort. A stride of 8 frames was used between windows, enabling significant overlap and increasing the number of training samples. Additionally, the segmentation process was repeated using three different offsets (0, 4, and 8 frames), producing multiple views of the same signal and improving robustness against alignment variability.
In parallel with the sequential input, each window was enriched with a vector of contextual data and participant-specific variables, appended once per window:
Demographic data: age, sex, height, weight, BMI, and body fat percentage;
Baseline values: resting HR and SpO2, computed from the initial resting segment of the protocol;
Activity context: current activity label, previous activity label, duration (in seconds) of the current activity up to that point, and MET value representing the estimated physical intensity.
These metadata features provided the model with static context and physiological background for each subject, enabling more personalized and accurate predictions. The resulting multimodal input is illustrated in
Figure 6, which shows the segmentation of the sequential features and the alignment of the contextual data with each window. The final input to the model consisted of a pair, i.e., a (30, 5) matrix representing the sequential features and a single 12-dimensional context data vector per window.
2.4. Model Architecture
2.4.1. Human Activity Recognition Classification Model
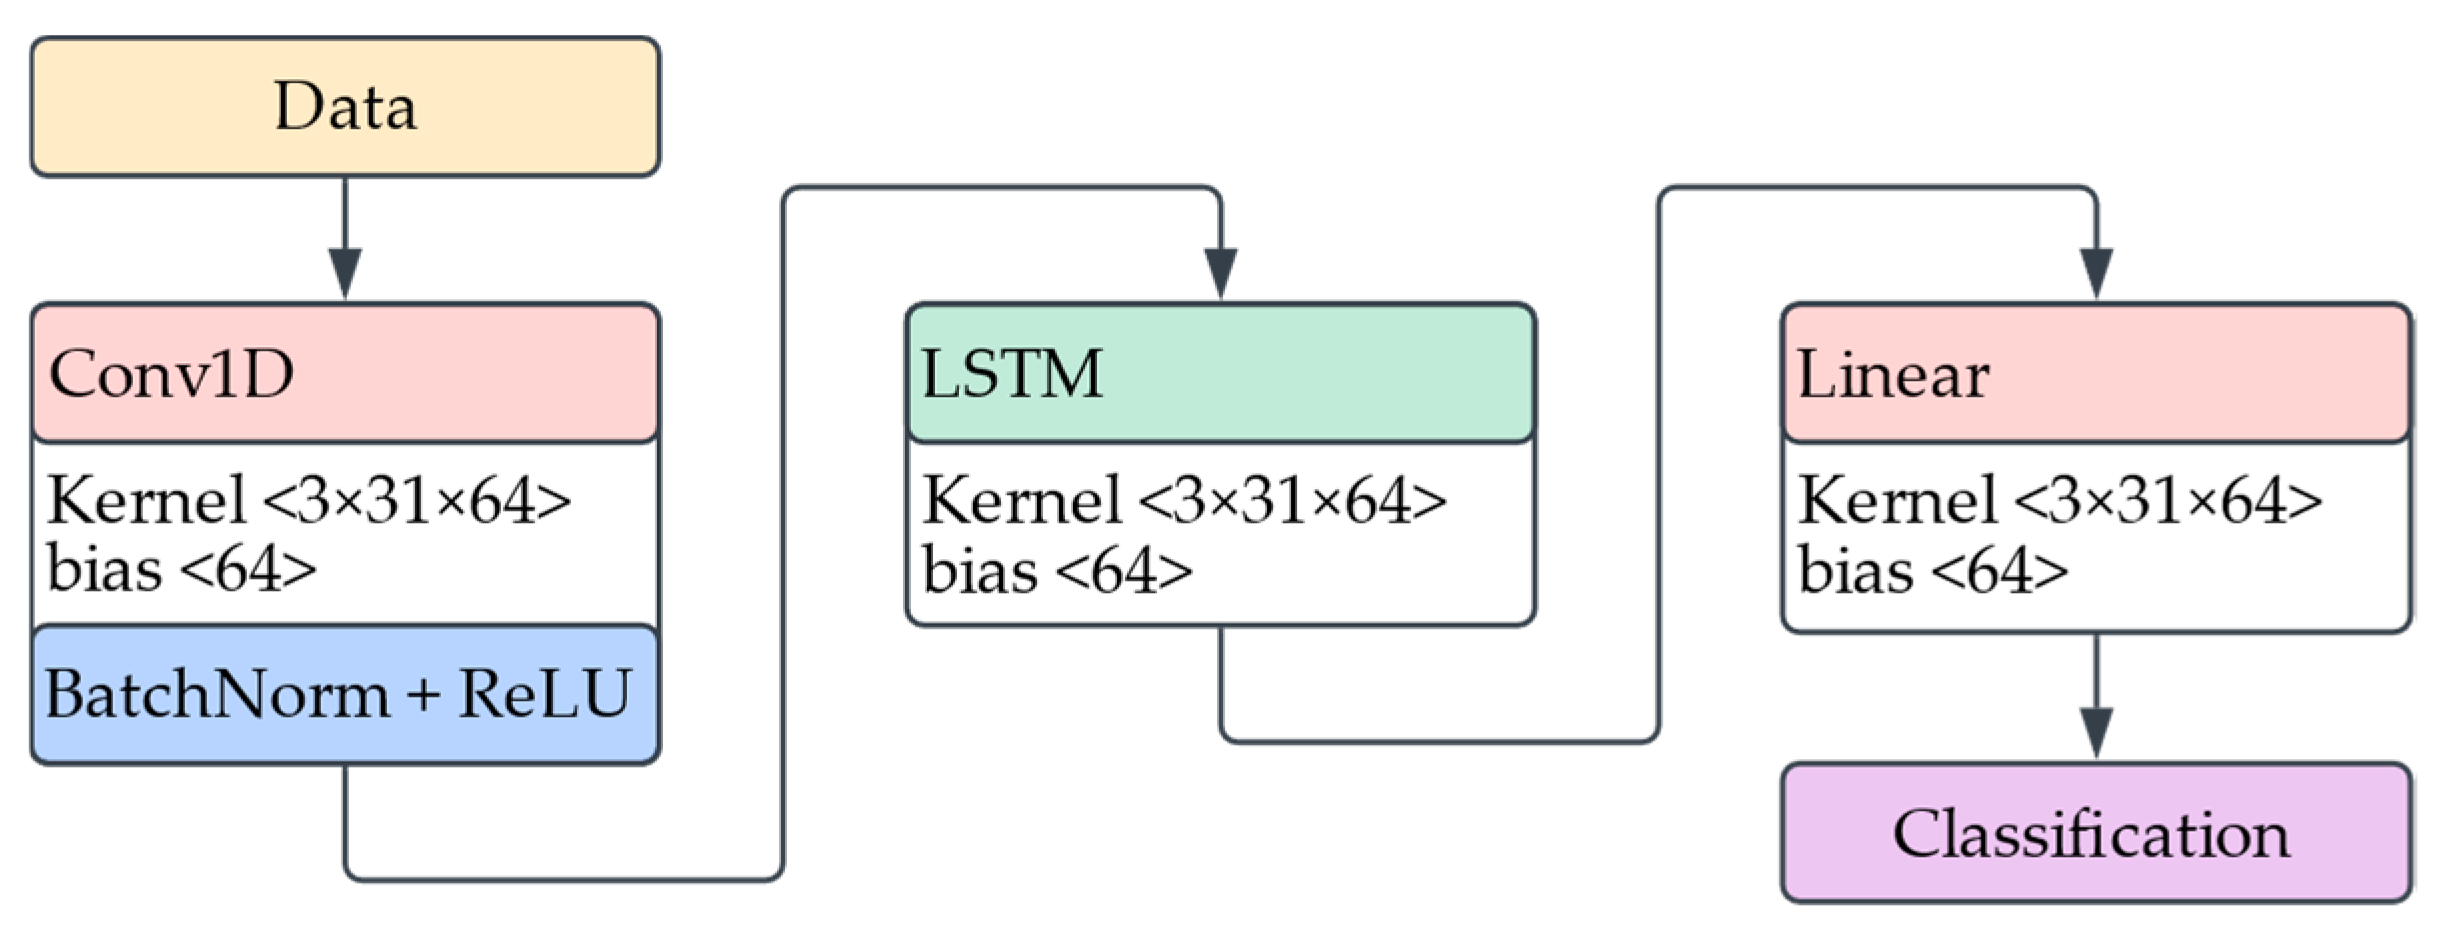
To classify physical activities from wearable motion data, we implemented a deep learning model that combines a one-dimensional CNN with an LSTM layer. The model receives as input a time-series tensor of shape (batch size, time steps, features), where each frame contains multichannel IMU features.
Figure 7 illustrates the architecture of the model; it begins with a 1D convolutional layer that extracts short-term temporal patterns across input features using a kernel size of 3. This is followed by batch normalization and a ReLU activation function to stabilize training and introduce non-linearity. The resulting feature maps are then permuted and passed into an LSTM layer, which captures long-range temporal dependencies across the windowed sequence. A final fully connected layer maps the LSTM outputs to per-time-step activity class probabilities.
Hyperparameter tuning was conducted using Optuna [
21], an open-source framework for automatic hyperparameter optimization based on Bayesian search strategies. Key parameters, including CNN output channels, LSTM hidden size, learning rate, and batch size were explored across predefined ranges. Trials were evaluated on validation accuracy after a few training epochs to identify optimal configurations.
2.4.2. Heart Rate Regression Model
To estimate the heart rate a participant would reach after completing a standardized step test, we developed a deep learning model that integrates sequential time-series data with contextual metadata. The model aims to learn cardiorespiratory responses to daily activities using fused physiological and biomechanical signals.
The first branch of the model processes sequential data: five time-series channels sampled at 0.5 Hz, including HR, SpO2, and acceleration magnitudes from the chest, right hand, and left knee. These signals are passed through two stacked 1D convolutional layers with batch normalization, ReLU activation, max pooling, and dropout. The resulting temporal features are encoded by an LSTM layer into a fixed-length hidden representation.
In parallel, the context data branch encodes a 12-dimensional vector consisting of participant-specific features (age, sex, height, weight, BMI, body fat %), resting physiological baselines (HR, SpO2), and contextual activity features (current/previous activity, duration, MET). This vector is processed through a fully connected layer with ReLU and dropout to produce a compact contextual embedding.
The two branches are concatenated and passed to a fusion module, a two-layer Multilayer Perceptron (MLP) that outputs a scalar prediction of the post-exercise heart rate.
Figure 8 gives a visual representation of the architecture description.
3. Results
This section presents the performance outcomes of the two proposed models: the HAR classifier and the post step test HR regression model. Evaluation focused on their accuracy, generalizability across participants, and ability to capture both movement patterns and physiological responses. Metrics such as accuracy, F1-score, RMSE, and NRMSE were used to assess model effectiveness under real-world conditions.
3.1. Human Activity Recognition Classification Model’s Performance
The final HAR model was evaluated on a held-out test set using the hyperparameters selected through Optuna tuning. The model showed strong performance in recognizing physical activities from wearable IMU data, with a weighted accuracy of 96.93% across all activity types.
To further assess model performance, we calculated precision, recall, and F1-score using a weighted average to account for potential class imbalance. All three metrics consistently exceeded 95%, suggesting both high sensitivity and precision in detecting a variety of everyday tasks.
Figure 9 presents the confusion matrix of the HAR model, summarizing its classification performance across all six activity types.
The matrix reveals high accuracy overall, with most predictions correctly aligned along the diagonal. This indicates that the model was highly effective at distinguishing between different physical activities based on wearable motion data.
While most samples were correctly classified, some minor misclassifications were observed. Interestingly, the greatest confusion occurred between the bike and rest activities, two tasks with clearly distinct physical intensities. This misclassification may be attributed to the similarity in upper body movement, as the hands remain relatively still in both activities. Additionally, the transition period at the beginning of the biking segment (when participants were seated and adjusting their position before pedaling) may have contributed to the overlap in motion patterns captured by the sensors. Despite these challenges, all activity classes maintained high recognition rates, indicating that the model generalizes effectively across the diverse set of movements in the protocol.
3.2. Heart Rate Regression Model’s Performance
The heart rate regression model was evaluated using Leave-One-Subject-Out (LOSO) [
22] cross-validation, ensuring generalizability by testing on each participant while training on all others. This approach was repeated for all 60 participants, ensuring robust and personalized performance evaluation across the population.
To identify the optimal model architecture, a grid search was performed over key hyperparameters: the number of output channels in the convolutional layers, the hidden size of the LSTM, and the dimensionality of the context branch. The context branch is a Multi-Layer Perceptron (MLP) responsible for processing non-sequential metadata, including demographic variables, resting biomarkers, and activity context. These features are projected into a compact representation and fused with the output of the sequential layers.
Figure 10 displays the RMSE results across hyperparameter combinations: panel (a) shows results for models with 32 convolutional channels, and panel (b) for 64. Each line corresponds to a different number of neurons in the context MLP layer, while the x-axis indicates the LSTM hidden layer size.
While
Figure 10 highlights the best-performing configurations for clarity, the full hyperparameter search included additional LSTM sizes (up to 1024), as well as variations in dropout rates and learning rates. These extended configurations revealed that model performance generally saturates at an LSTM hidden size of 768, with no consistent improvements beyond that point. In some cases, larger configurations led to slightly higher RMSE or training instability, particularly when the LSTM and context layers were both large. A consistent trend emerges across configurations: models perform better when the LSTM hidden layer size exceeds the context MLP layer size. This suggests that allocating more capacity to temporal modeling of physiological and motion signals is critical for accurate heart rate prediction, while a smaller context representation is sufficient to encode static metadata.
The best results were obtained with a model that used 64 convolutional output channels, an LSTM hidden layer size of 768, and 384 units in the context MLP branch. This configuration achieved an average RMSE of 5.13 beats per minute (bpm), a MAE of 4.37 bpm, and a NRMSE of 0.174. These results indicate that the model can accurately estimate the heart rate a participant would reach after performing the Queens College Step Test, based solely on their physiological and motion responses to free-living activities.
To assess the agreement between predicted and actual values, a Bland–Altman analysis [
23] was performed.
Figure 11 shows the mean bias between predicted and ground truth post-test heart rate values, which was just 0.13 bpm. Most differences fell within the 95% limits of agreement, suggesting strong alignment and minimal systematic bias in the model’s predictions.
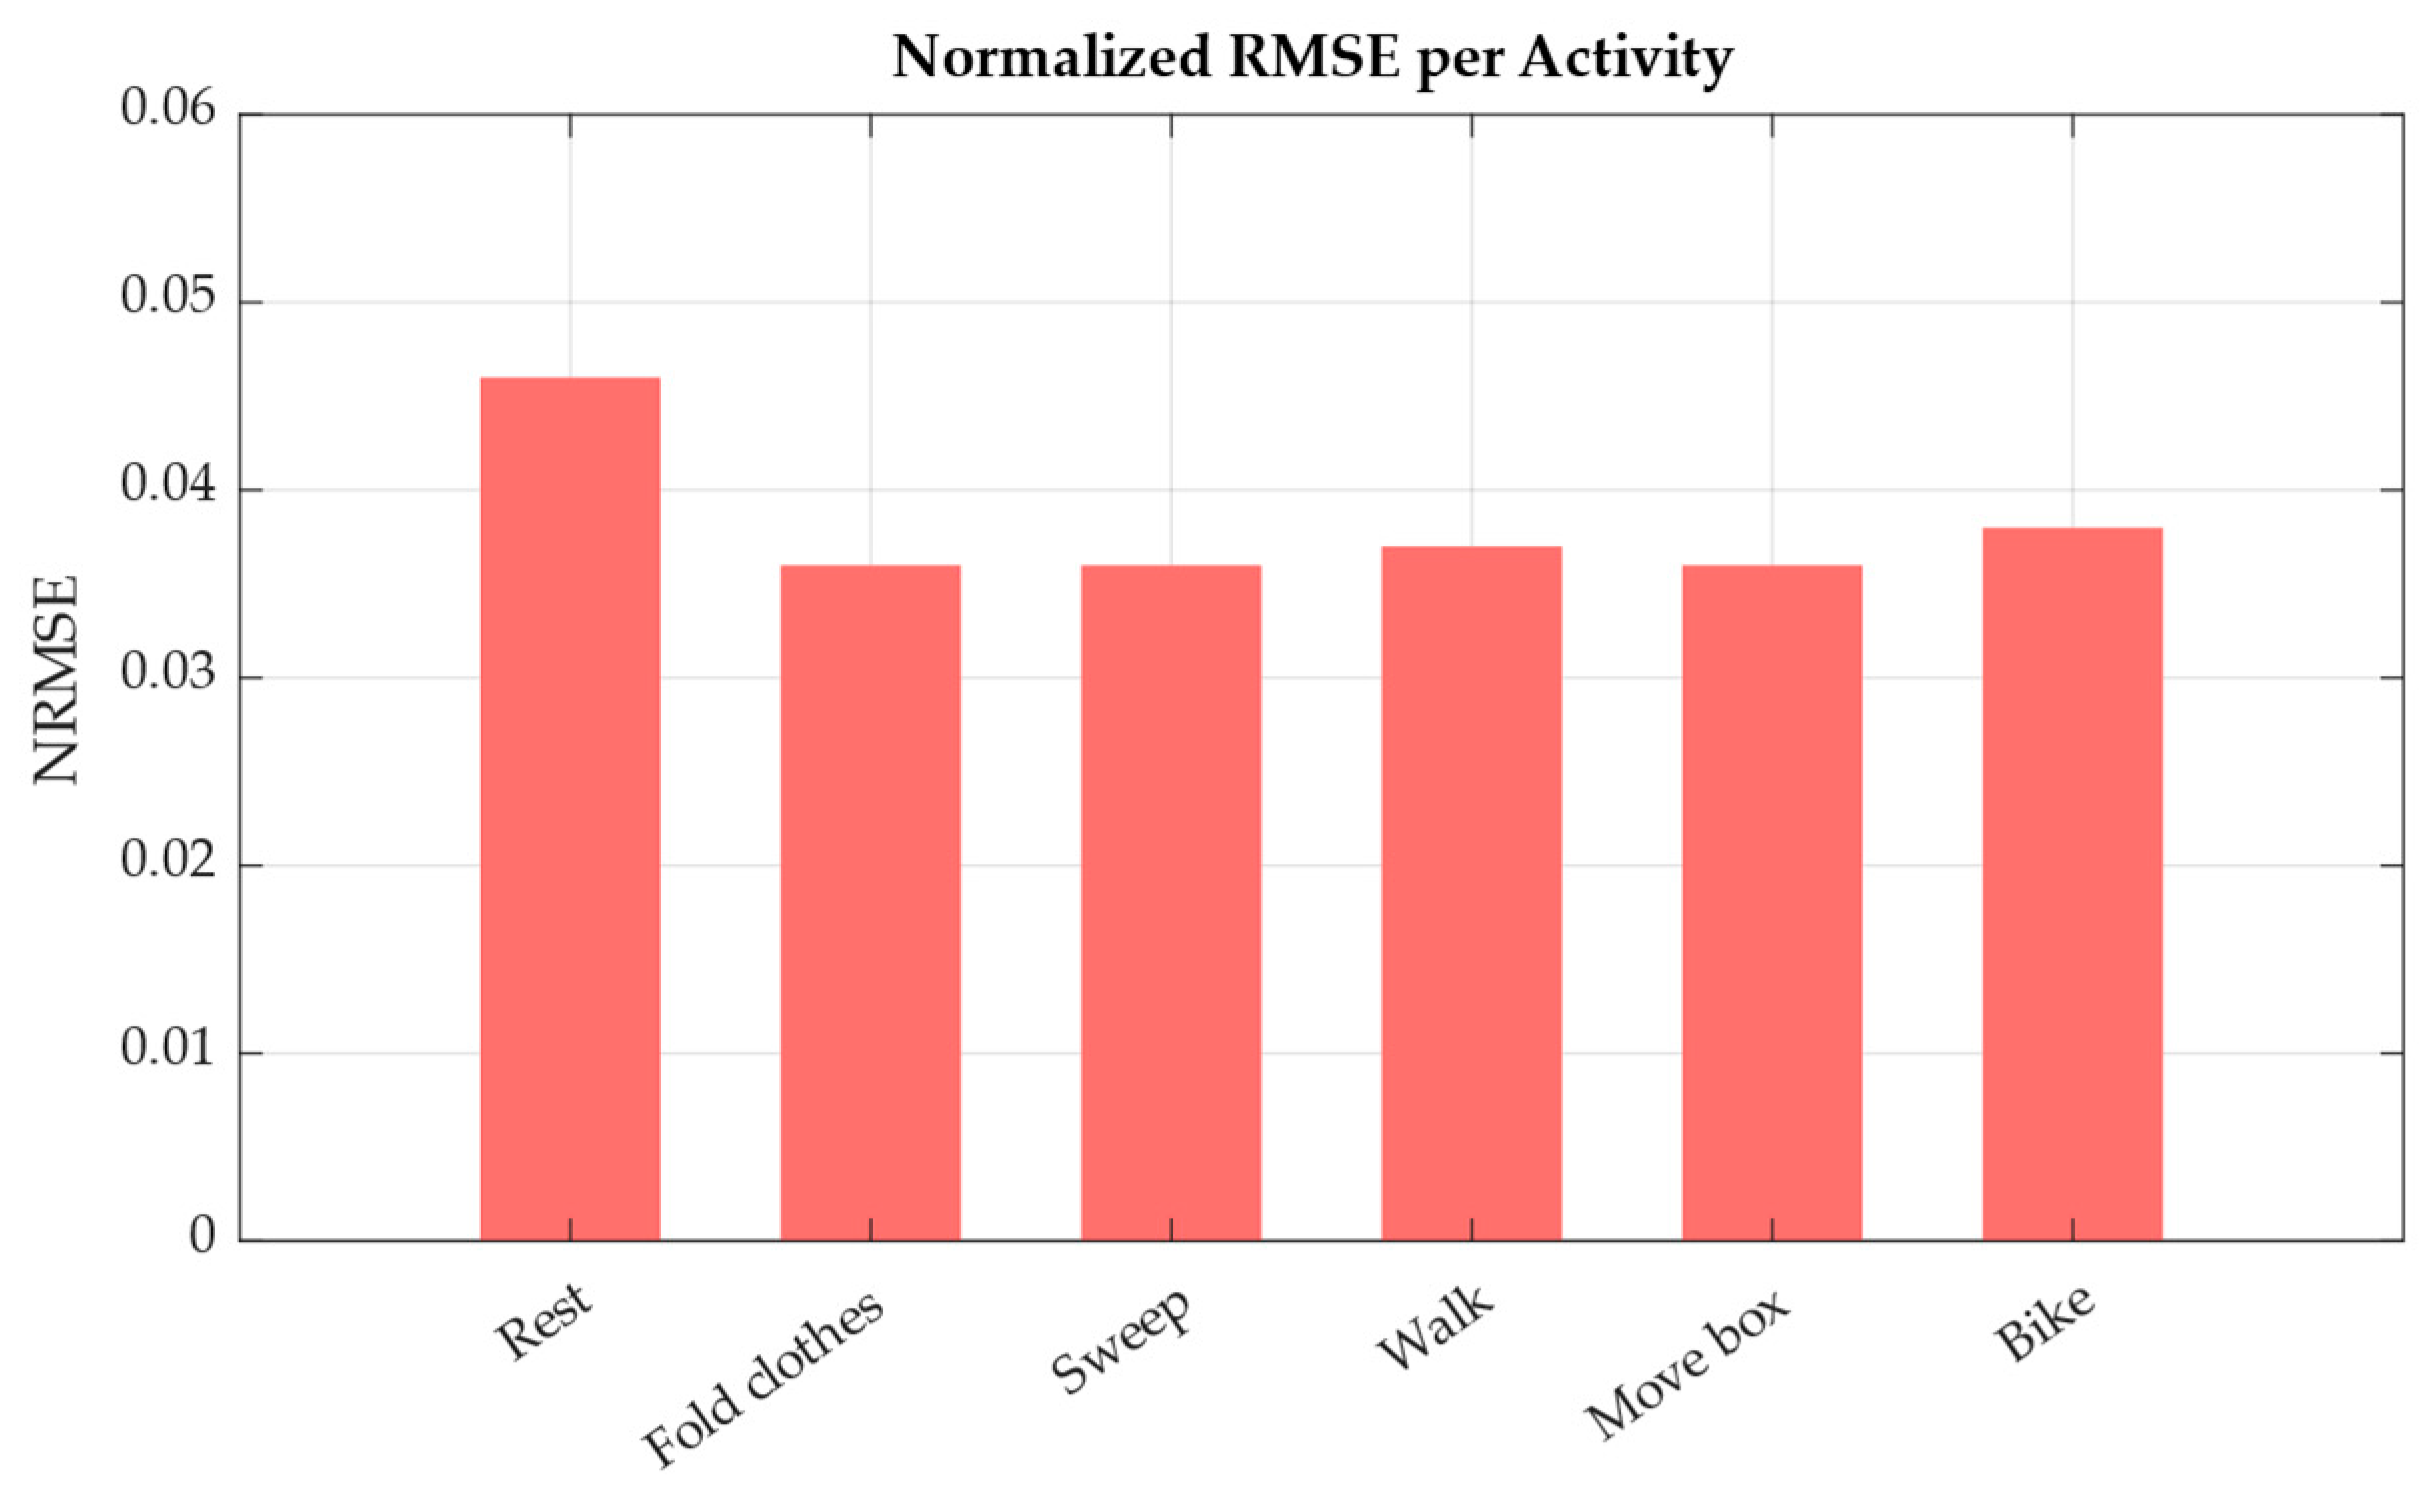
Finally, model performance was also analyzed by activity type. As shown in
Figure 12, the NRMSE was computed separately for each task.
Activities such as sweeping, walking, and moving a box led to the lowest prediction errors, with NRMSE values around 0.036–0.037. These activities typically elicit consistent physiological responses, making it easier to model across participants. On the other hand, resting periods showed the highest error (NRMSE = 0.046), likely due to higher inter-individual variability in baseline heart rate. These results reinforce the model’s ability to learn exertion-driven trends from natural activity, while also highlighting the challenges of modeling personalized rest-state physiology.
4. Discussion and Future Work
This study presents a framework for estimating an individual’s post step test heart rate using wearable data collected during natural daily activities. By integrating movement and physiological signals from wearable sensors, the proposed model enables an indirect estimation of VO2max, the gold-standard indicator of CRF, without requiring structured exercise protocols. Unlike traditional assessments involving treadmills or cycle ergometers under supervision, our method allows users to be passively monitored through everyday movement.
The results demonstrate that this indirect VO2max estimation is feasible, with the model achieving an average error of just 5.13 bpm across participants. The HAR model further reinforces this framework by providing reliable activity context information, with classification metrics consistently exceeding 96%. These components support the feasibility of context-aware, at-home monitoring of cardiorespiratory health, opening the door to more accessible and user-friendly fitness evaluation systems beyond clinical environments.
A key advantage of this approach lies in its efficiency. Unlike many existing methods in the literature, which rely on long-term data aggregation, ranging from hours to entire weeks of wearable recordings, our framework produces a fitness estimate from just a few minutes of daily activity. This substantial reduction in data requirements not only lowers the burden on users but also makes the method more compatible with opportunistic and on-demand assessment. It eliminates the need for continuous tracking or strict protocol adherence, offering greater flexibility for real-world deployment and broader population use.
Our approach emphasizes generalizability, as demonstrated through LOSO cross-validation, which confirmed the model’s robustness across unseen individuals despite the moderate dataset size. While the activity protocol was structured, it was carefully designed to reflect free-living conditions by incorporating a variety of realistic daily tasks rather than isolated or treadmill-based exercises. Notably, the HAR model sustained high classification performance despite inter-individual differences in how movements were executed, suggesting that it reliably captures activity-specific patterns across diverse users. This design helps bridge the gap between controlled clinical protocols and real-world, unsupervised monitoring.
While the dataset used in this study includes participants with a range of ages and body compositions, it primarily represents individuals in average health. For safety reasons defined in the consent protocol, participants with known cardiovascular, pulmonary, or frailty-related conditions were excluded. As a result, the model has not yet been validated in clinical or high-risk populations, and its current findings should be interpreted within this context.
This model serves as a first step toward broader applications. Looking ahead, several improvements can be made to strengthen this framework. Future work should focus on expanding the dataset with a greater number of participants across a broader range of health conditions, ages, and fitness levels. Clinical validation in controlled environments (particularly with high-risk populations) will be essential to ensure safety and extend applicability to those who would benefit most from fitness monitoring. In these settings, future studies should compare predicted values against gold-standard VO2max measurements (e.g., via metabolic gas analysis) to formally establish the clinical accuracy of the proposed framework. Integrating additional biomarkers, such as respiration rate, ECG, or skin temperature, could enhance the model’s understanding of internal physiological states, and it is also recommended to explore higher sampling rates for these signals to improve temporal resolution and capture finer physiological variations. In addition, analyzing performance across demographic groups could help ensure fairness and generalizability.
Validation under real-world free-living conditions is necessary to evaluate the model’s robustness in practical, uncontrolled environments. Introducing variable intensity levels within the same activity class would support the development of more nuanced models capable of distinguishing effort gradients. Moreover, rather than relying on predefined activity classes, future models could benefit from regressing MET values directly, providing a continuous and more generalized representation of physical effort.
Finally, a key long-term goal is to move beyond offline estimation toward real-time feedback systems. With further refinement, this approach could power wearable-based fitness and recovery trackers that provide personalized health insights on the go, enabling early detection of decline, optimizing rehabilitation, and empowering users to engage in proactive health management from the comfort of their home. Future work should also consider optimizing model size and efficiency for on-device deployment, minimizing impact on battery life and processing.
5. Conclusions
This work presents a novel, data-driven approach to estimating cardiorespiratory fitness using wearable sensors in natural, unsupervised settings. By combining a deep learning-based HAR model with an HR regression model that integrates motion, physiological biomarkers, and contextual metadata, we demonstrate the feasibility of predicting the heart rate a person would reach after a standardized step test, without requiring them to perform the test. This predicted heart rate can then be used to estimate a cardiorespiratory fitness indicator.
A key strength of this framework lies in its ability to operate with just a few minutes of daily activity data, in contrast to many existing methods that require prolonged monitoring periods. This enables more opportunistic, user-friendly assessments compatible with real-world deployment. The model also showed strong generalizability across participants, achieving high accuracy in both activity classification and heart rate prediction, as demonstrated through LOSO cross-validation.
The ability to infer a CRF indicator from free-living activity data, without requiring treadmills, structured protocols, invasive equipment, or clinical supervision, represents a significant breakthrough. It bridges the gap between controlled laboratory assessments and real-world conditions, paving the way for more accessible, scalable, and personalized tools for cardiorespiratory fitness monitoring beyond clinical settings.
Author Contributions
Conceptualization, L.S.-A., J.L.R.-C., K.N.-T. and J.F.P.-M.; methodology, L.S.-A., J.L.R.-C. and J.F.P.-M.; software, L.S.-A.; validation, L.S.-A. and J.L.R.-C.; formal analysis, L.S.-A. and J.F.P.-M.; investigation, L.S.-A., J.L.R.-C. and J.F.P.-M.; resources, L.S.-A. and J.L.R.-C.; data curation, L.S.-A.; writing—original draft preparation, L.S.-A.; writing—review and editing, L.S.-A., J.L.R.-C., K.N.-T. and J.F.P.-M.; visualization, L.S.-A. and K.N.-T.; supervision, J.F.P.-M.; project administration, J.F.P.-M.; funding acquisition, J.F.P.-M. All authors have read and agreed to the published version of the manuscript.
Funding
This research received financial support from the NSF EPSCoR Center for the Advancement of Wearable Technologies (CAWT) under Grant No. OIA-1849243 and the NSF CAREER Intelligent Biomarker Analysis based on Wearable Distributed Computing under Grant No. OAC-2439345.
Institutional Review Board Statement
The study was conducted under the Declaration of Helsinki and approved by the University of Puerto Rico’s Institutional Review Board (IRB) (approved on 27 January 2025).
Informed Consent Statement
Informed consent was obtained from all subjects involved in the study.
Data Availability Statement
Conflicts of Interest
The authors declare no conflict of interest.
Abbreviations
The following abbreviations are used in this manuscript:
| HR | Heart Rate |
| HAR | Human Activity Recognition |
| RMSE | Root Mean Squared Error |
| bpm | beats per minute |
| MAE | Mean Absolute Value |
| CRF | Cardiorespiratory Fitness |
| VO2max | Maximal Oxygen Uptake |
| CPET | Cardiopulmonary Exercise Test |
| ECG | Electrocardiogram |
| SpO2 | Blood Oxygen Saturation |
| PPG | Photoplethysmography |
| IMU | Inertial Measurement Unit |
| CNN | Convolutional Neural Network |
| LSTM | Long-Short Term-Memory |
| PAR-Q | Physical Activity Readiness Questionnaire |
| ANSI/CTA | American National Standards Institute/Consumer Technology Association |
| BMI | Body Mass Index |
| MET | Metabolic Equivalent of Task |
| LOSO | Leave-One-Subject-Out |
| MLP | Multi-Layer Perceptron |
References
- World Health Organization. Hypertension. Available online: https://www.who.int/news-room/fact-sheets/detail/hypertension (accessed on 30 July 2025).
- International Diabetes Federation. IDF Diabetes Atlas, 10th ed.; 2021. Available online: https://diabetesatlas.org/atlas/tenth-edition/ (accessed on 30 July 2025).
- Ross, R.; Blair, S.N.; Arena, R.; Church, T.S.; Despres, J.P.; Franklin, B.A.; Haskell, W.L.; Kaminsky, L.A.; Levine, B.D.; Lavie, C.J.; et al. Importance of Assessing Cardiorespiratory Fitness in Clinical Practice: A Case for Fitness as a Clinical Vital Sign: A Scientific Statement From the American Heart Association. Circulation 2016, 134, e653–e699. [Google Scholar] [CrossRef] [PubMed]
- Rafiq, N.; Nabi, T.; Qayoom, O. Assessment of cardiovascular fitness [VO2max] among medical students by Queens College step test. Int. J. Biomed. Adv. Res. 2015, 6, 418–421. [Google Scholar] [CrossRef]
- Sheridan, D.; Jaspers, A.; Cuong, D.V.; De Beéck, T.O.; Moyna, N.M.; de Beukelaar, T.T.; Roantree, M.; Naseer, N. Estimating oxygen uptake in simulated team sports using machine learning models and wearable sensor data: A pilot study. PLoS ONE 2025, 20, e0319760. [Google Scholar] [CrossRef] [PubMed]
- Wiecha, S.; Kasiak, P.S.; Szwed, P.; Kowalski, T.; Cieśliński, I.; Postuła, M.; Klusiewicz, A. VO2max prediction based on submaximal cardiorespiratory relationships and body composition in male runners and cyclists: A population study. eLife 2023, 12, e86291. [Google Scholar] [CrossRef] [PubMed]
- Akay, F.; Abut, F. Machine learning and statistical methods for the prediction of maximal oxygen uptake: Recent advances. Med. Devices Evid. Res. 2015, 8, 369–379. [Google Scholar] [CrossRef] [PubMed]
- Neshitov, A.; Tyapochkin, K.; Kovaleva, M.; Dreneva, A.; Surkova, E.; Smorodnikova, E.; Pravdin, P. Estimation of cardiorespiratory fitness using heart rate and step count data. Sci. Rep. 2023, 13, 15808. [Google Scholar] [CrossRef] [PubMed]
- Spathis, D.; Perez-Pozuelo, I.; Gonzales, T.I.; Wu, Y.; Brage, S.; Wareham, N.; Mascolo, C. Longitudinal cardio-respiratory fitness prediction through wearables in free-living environments. NPJ Digit. Med. 2022, 5, 176. [Google Scholar] [CrossRef] [PubMed]
- Hsiao, C.-T.; Tong, C.; Coté, G.L. Machine Learning-Based VO2 Estimation Using a Wearable Multiwavelength Photoplethysmography Device. Biosensors 2025, 15, 208. [Google Scholar] [CrossRef] [PubMed]
- Lee, C.; Park, T. Deep learning health space model for ordered responses. BMC Med. Inform. Decis. Mak. 2025, 25, 191. [Google Scholar] [CrossRef] [PubMed]
- Kaseris, M.; Kostavelis, I.; Malassiotis, S. A Comprehensive Survey on Deep Learning Methods in Human Activity Recognition. Mach. Learn. Knowl. Extr. 2024, 6, 842–876. [Google Scholar] [CrossRef]
- Qureshi, T.S.; Shahid, M.H.; Farhan, A.A.; Alamri, S. A systematic literature review on human activity recognition using smart devices: Advances, challenges, and future directions. Artif. Intell. Rev. 2025, 58, 276. [Google Scholar] [CrossRef]
- ANSI/CTA-2065.1; Physical Activity Monitoring for Heart Rate-Real-World Analysis. Consumer Technology Association: Arlington, VA, USA, 2023. Available online: https://www.cta.tech/standards/ansicta-20651/ (accessed on 30 July 2025).
- ANSI/CTA-2108-2022; Framework for Validation of Health Technology-Derived Metrics Under Naturalistic or Unconstrained Conditions. Consumer Technology Association: Arlington, VA, USA, 2022. Available online: https://www.cta.tech/standards/ansicta-2108/ (accessed on 30 July 2025).
- ANSI/CTA-2074 R-2025; Intensity Metrics: Physical Activity Monitoring. Consumer Technology Association: Arlington, VA, USA, 2025.
- Herrmann, S.D.; Willis, E.A.; Ainsworth, B.E.; Barreira, T.V.; Hastert, M.; Kracht, C.L.; Schuna, J.M.; Cai, Z.; Quan, M.; Tudor-Locke, C.; et al. 2024 Adult Compendium of Physical Activities: A third update of the energy costs of human activities. J. Sport Health Sci. 2024, 13, 6–12. [Google Scholar] [CrossRef] [PubMed]
- Zmitri, M.; Fourati, H.; Vuillerme, N. Human Activities and Postures Recognition: From Inertial Measurements to Quaternion-Based Approaches. Sensors 2019, 19, 4058. [Google Scholar] [CrossRef] [PubMed]
- Saldaña-Aristizábal, L.; Niño-Tejada, K.; Rivas-Caicedo, J.L.; Patarroyo-Montenegro, J.F. Evaluating Quaternion-Based Representations for Human Activity Recognition Using Motion Capture. In Proceedings of the International Symposium on Intelligent Computing Netowrking (ISICN2025), San Juan, PR, USA, 17–19 March 2025. [Google Scholar]
- Saldaña-Aristizabal, L.; Rivas-Caicedo, J.L.; Niño-Tejada, K.; Patarroyo-Montenegro, J.F. Daily Activities Wearable Dataset for Cardiorespiratory Fitness Estimation. 2025. Available online: https://zenodo.org/records/15857137 (accessed on 30 July 2025).
- Akiba, T.; Sano, S.; Yanase, T.; Ohta, T.; Koyama, M. Optuna: A Next-generation Hyperparameter Optimization Framework. In Proceedings of the 25th ACM SIGKDD International Conference on Knowledge Discovery & Data Mining (KDD ‘19), Anchorage, AK, USA, 4–8 August 2019; pp. 2623–2631. [Google Scholar] [CrossRef]
- Kunjan, S.; Grummett, T.S.; Pope, K.J.; Powers, D.M.W.; Fitzgibbon, S.P.; Bastiampillai, T.; Battersby, M.; Lewis, T.W. The Necessity of Leave One Subject Out (LOSO) Cross Validation for EEG Disease Diagnosis. In Proceedings of the International Conference on Brain Informatics, Virtual Event, 17–19 September 2021; pp. 558–567. [Google Scholar] [CrossRef]
- Giavarina, D. Understanding Bland Altman analysis. Biochem. Med. 2015, 25, 141–151. [Google Scholar] [CrossRef] [PubMed]
Figure 1.
Standard CPET equipment: Blood pressure monitor, mask (volume sensor and gas analyzer tubing), electrocardiogram (ECG), ergometer, pulse oximeter, gas analyzer, display of breath-by-breath data and exercise ECG.
Figure 1.
Standard CPET equipment: Blood pressure monitor, mask (volume sensor and gas analyzer tubing), electrocardiogram (ECG), ergometer, pulse oximeter, gas analyzer, display of breath-by-breath data and exercise ECG.
Figure 2.
Overview of the proposed two-model framework for cardiorespiratory fitness estimation. Model 1 classifies physical activity using motion data from wearable sensors. Model 2 independently uses the ground-truth activity label along with physiological signals, movement features, and demographic metadata to estimate the heart rate a person would reach after a standardized step test.
Figure 3.
Demographic distribution of study participants. (a) Distribution of participants based on age and gender; (b) distribution of participants by gender and fat percentage ranges; (c) distribution of participants based on BMI ranges.
Figure 3.
Demographic distribution of study participants. (a) Distribution of participants based on age and gender; (b) distribution of participants by gender and fat percentage ranges; (c) distribution of participants based on BMI ranges.
Figure 4.
Wearable sensor placement overview. (a) Wearable sensing prototype; (b) human subject instrumented with the proposed sensor setup.
Figure 4.
Wearable sensor placement overview. (a) Wearable sensing prototype; (b) human subject instrumented with the proposed sensor setup.
Figure 5.
Input features and segmentation for the HAR model.
Figure 5.
Input features and segmentation for the HAR model.
Figure 6.
Structure of input data used for the heart rate regression model.
Figure 6.
Structure of input data used for the heart rate regression model.
Figure 7.
Architecture of the HAR model.
Figure 7.
Architecture of the HAR model.
Figure 8.
Architecture of the HR regression model.
Figure 8.
Architecture of the HR regression model.
Figure 9.
Confusion matrix for the HAR model predictions on the test set.
Figure 9.
Confusion matrix for the HAR model predictions on the test set.
Figure 10.
Grid search results show RMSE performance across LSTM, and context hidden sizes. (a) Results for CNN hidden size 32 and (b) Results for CNN hidden size 64. Each line represents a different context MLP layer size, illustrating how LSTM hidden layer size affects the results.
Figure 10.
Grid search results show RMSE performance across LSTM, and context hidden sizes. (a) Results for CNN hidden size 32 and (b) Results for CNN hidden size 64. Each line represents a different context MLP layer size, illustrating how LSTM hidden layer size affects the results.
Figure 11.
Bland–Altman plot comparing predicted and true HR values. Each point represents a participant’s prediction. The solid black line shows the mean bias (0.13 bpm), while the dashed red lines indicate the 95% limits of agreement (±1.96 SD). Color intensity has no additional meaning, and all points reflect individual HR predictions.
Figure 12.
Normalized root mean squared error (NRMSE) of heart rate prediction across activity types.
Figure 12.
Normalized root mean squared error (NRMSE) of heart rate prediction across activity types.
Table 1.
Structured activity protocol with MET values.
Table 1.
Structured activity protocol with MET values.
| Time [min] | Activity | Activity Code | MET |
|---|
| 0–3 | Sit | 07021 | 1.0 |
| 3–8 | Fold clothes while seated | 05091 | 2.0 |
| 8–13 | Sweep, light effort | 05011 | 2.3 |
| 13–16 | Sit | 07021 | 1.0 |
| 16–21 | Walk at 5.6 km/h, treadmill surface | 17190 | 3.8 |
| 21–26 | Move a 4.5 kg box from the table to the floor and vice versa | 11615 | 4.5 |
| 26–29 | Sit | 07021 | 1.0 |
| 29–34 | Static bike, 101–125 watts | 01224 | 6.8 |
| 34–37 | Sit | 07021 | 1.0 |
| Disclaimer/Publisher’s Note: The statements, opinions and data contained in all publications are solely those of the individual author(s) and contributor(s) and not of MDPI and/or the editor(s). MDPI and/or the editor(s) disclaim responsibility for any injury to people or property resulting from any ideas, methods, instructions or products referred to in the content. |
© 2025 by the authors. Licensee MDPI, Basel, Switzerland. This article is an open access article distributed under the terms and conditions of the Creative Commons Attribution (CC BY) license (https://creativecommons.org/licenses/by/4.0/).


 ,
, 


