Article

An Intelligent Optimization-Based Secure Filter Design for State Estimation of Power Systems with Multiple Disturbances

Electric Power Research Institute of State Grid Shanxi Electric Power Corporation, Taiyuan 030001, China
*
Author to whom correspondence should be addressed.
Electronics 2025, 14(15), 3059; https://doi.org/10.3390/electronics14153059 (registering DOI)
Submission received: 2 July 2025 / Revised: 27 July 2025 / Accepted: 28 July 2025 / Published: 31 July 2025
(This article belongs to the Section Systems & Control Engineering)

Abstract

To address multiple disturbance threats such as system anomalies and cyberattacks faced by power systems, an intelligent optimized secure filter method is developed in this paper for state estimation of power systems with the aid of the improved sparrow search algorithm–optimized unscented Kalman filter (ISSA-UKF). Firstly, the problem of insufficient robustness in noise modeling and parameter selection of the conventional unscented Kalman filter (UKF) is analyzed. Secondly, an intelligent optimization method is adopted to adaptively update the UKF’s process and measurement noise covariances in real time, and an ISSA-UKF fusion framework is constructed to improve the estimation accuracy and system response capability. Thirdly, an adaptive weight function based on disturbance observation differences is provided to strengthen the stability of the algorithm in response to abnormal measurements at edge nodes and dynamic system changes. Finally, simulation analysis under a typical power system model shows that compared with the conventional UKF method, the developed ISSA-UKF algorithm demonstrates significant improvements in estimation accuracy, robustness, and dynamic response performance and can effectively cope with non-ideal disturbances that may occur in power systems.

1. Introduction

The stable operation of power systems is crucial for ensuring the normal functioning of society and supporting economic development. However, with the continuous increase in the scale and complexity of power systems, their accurate monitoring and control face growing challenges, such as model uncertainty, equipment anomalies, communication interference, and malicious cyberattacks [1,2]. The uncertainty brought by multiple disturbances may lead to power angle instability, voltage collapse, or even large-scale system separation, causing serious safety incidents [3]. Therefore, achieving accurate perception and robust estimation of power system operating states under complex disturbances has become a key issue in smart grid research.
Dynamic state estimation (DSE) is a common method for improving the observability of power systems. Its core idea is to integrate structural modeling information with real-time measurement data to approximate the true evolution of system states, even during disturbances or anomalies. As the earliest estimation algorithm applied in power systems, the Kalman filter (KF) [4] performs recursive estimation through state transition and measurement models. However, its assumptions of linearity, Gaussian noise, and known covariances limit its estimation accuracy in nonlinear scenarios. To address the nonlinear modeling demands of power systems, ref. [5] introduced the Extended Kalman filter (EKF), which linearizes nonlinear system models using Taylor’s expansion. Nevertheless, it requires frequent Jacobian matrix computation, which is computationally expensive and prone to divergence in strongly nonlinear systems. The UKF proposed in [6] adopts the Unscented Transform (UT) technique to generate sigma points, which can more accurately capture the nonlinear propagation process, thus improving estimation performance and becoming one of the mainstream nonlinear filtering solutions.
Although the EKF and the UKF demonstrate satisfactory performance under standard conditions, they exhibit notable shortcomings when facing frequent anomalies and data disturbances in actual power systems. In particular, observational anomalies or malicious tampering of measurement data can cause enlarged estimation bias and filter divergence. To address these problems, researchers have proposed various robust filtering enhancements. For example, by combining the UKF with the Weighted Least Squares (WLS) for real-time application, ref. [7] detects the difference between estimated values to identify Deliberate Data Injection Attacks (FDIAs). Ref. [8] establishes a DC Microgrid (DC MG) model including FDIAs and analyzes the attacked system. Ref. [9] introduces an attack amplitude planning strategy to utilize noise tolerance and bypass residual detection by reviewing the limitations of traditional residual methods and Kalman filter-based detectors in FDIA detection in noise and complex networks. In [10], a novel outlier detection and state correction strategy is proposed by comparing the deviation between the EKF and the WLS with an offline threshold. In [11], the robustness of the Cubature Kalman filter (CKF) algorithm is enhanced by a decay factor, and an interactive multi-model is integrated to achieve hypersonic target tracking. Ref. [12] improves the robustness of the CKF algorithm through M-estimation, enabling target tracking in the case of missing measurements. Ref. [13] uses the maximum cross-correlation criterion to optimize the CKF algorithm to solve the scenario where process or measurement noise is unknown.
In addition to algorithmic enhancements within estimation frameworks, cross-disciplinary research has introduced noise-resilient modeling and diagnostic strategies to improve state observability under non-Gaussian and unknown disturbances. For instance, ref. [14] proposes a cyclostationarity-based blind deconvolution method for early bearing fault detection in non-Gaussian noise, while [15] formulates a dynamic acoustic emission detection model to simulate fault evolution and signal response. These works offer new modeling perspectives for robust system monitoring and inspire improvements in estimation robustness in complex industrial scenarios.
Furthermore, ref. [16] proposes an unscented Kalman filter based on the robust M-estimation (M-UKF) algorithm. Although this method can handle observational anomalies, it does not address the impact of measurement and model parameter tampering attacks on dynamic state estimation algorithms. Aiming at outliers and non-Gaussian noise in measurements, ref. [17] improves the UKF based on generalized maximum likelihood estimation, improving the accuracy and efficiency of estimation. While these methods improve robustness against measurement anomalies and statistical deviations, they still lack sufficient resistance to active attacks, such as tampering with measurements or model parameters. This vulnerability can lead to state drift and estimation distortion, posing significant operational risks to power systems. Therefore, developing dynamic state estimation methods that combine adaptability with anti-attack capabilities is an urgent research need.
In summary, the traditional UKF algorithm suffers from limited convergence, fixed parameters, and vulnerability to attacks when operating under complex disturbance environments in power systems, making it difficult to meet the future requirements for highly reliable situational awareness in smart grids. To this end, this paper proposes an improved sparrow search algorithm–optimized unscented Kalman filter (ISSA-UKF) method. This method introduces an intelligent optimization mechanism to realize the adaptive adjustment of UKF parameters and combines an anomaly-aware estimation strategy to improve the adaptability to system anomalies and cyberattacks. This article conducts simulation verification in typical power system models and systematically evaluates the robustness and performance advantages of the algorithm from three scenarios: normal state, observational anomalies, and cyberattacks, verifying its effectiveness and practicability in complex disturbance environments.

2. Power System Dynamic Model

To accurately model generator and power grid operating conditions, this section establishes a power system dynamics model for subsequent estimation algorithms. The model reflects the dynamic response of generators under different operating conditions, providing a foundation for False Data Injection Attack (FDIA) detection and analysis. The dynamics model is based on the classical generator model and is described by the following equations:
δ ˙ i = ω i ω 0
ω ˙ i = ω 0 2 H i ( P m i P G i D ( ω i ω 0 ) )
where δ i , ω i , P m i , and P G i represent the rotor angle, angular speed, mechanical power, and output power of generator i . ω 0 is the synchronous (rated) speed. D denotes the damping coefficient, and H represents the inertia constant of the generator. The output power P G i is described as
P G i = E i j = 1 n E j Y i j cos ( δ i δ j θ i j )
where Y denotes the admittance matrix of a simplified network consisting only of internal generator buses, E is the internal voltage of the generator, and θ is the angle of Y . The calculation for Y follows Equation (4):
Y = Y 22 Y 21 × Y 11 1 × Y 12
where Y 11 and Y 22 are the load and rotor admittance matrices, and Y 12 = Y 21 T is the admittance matrix between loads and generators. The discrete form of Equation (1) is shown as
f ( x k , u k ) = { δ i , k 1 + ω 0 × ( ω i , k 1 1 ) + ω i , δ ω i , k = ω i , k 1 + Δ t × ( P m i P G i , k 1 D ( ω i , k 1 1 ) ) / M + ω i , ω
where ω i , δ and ω i , ω  are the process noise regarding corresponding state variables, and  is the simulation time step. Therefore, the parameters to be predicted are the rotor angle δ and the rotor angular velocity ω .
A nonlinear measurement function is used for DSE in power systems, referred to as the measurement model. In the DSE of power systems, the active and reactive power obtained from generators, as well as the voltage magnitude and phase angle measurements of each bus, are typically used as inputs. The expression for the active power output of a generator is given in Equation (3), while the expression for the reactive power output of the generator is represented as follows:
Q G i = E i j = 1 n E j Y i j sin ( δ i δ j θ i j )
The voltage magnitude and phase angle measurements can be derived from Equation (7), where Y e x p represents the extended system matrix, expressed as
Y e x p V e x p = ( Y 11 Y 12 Y 21 Y 22 ) ( V θ E θ ) = ( 0 I G δ )
In this expression, V e x p denotes the extended voltage vector, including the internal rotor voltage E and the bus voltage vector V . I G is the current injected by the rotor. From Equation (7), the relationship between V and E can be derived as
V θ = ( Y 11 ) 1 Y 22 E δ = R V E δ
with R V being the matrix of voltage reconstruction. Therefore, the DSE model and the measurement model can be formulated as follows:
X = [ δ T ω T ]
Z = [ P G i T Q G i T V T θ T ]

3. Sparrow Search Algorithm and Its Improvements

3.1. Sparrow Search Algorithm

To enhance the state estimation performance under disturbances in the above models, this paper introduces the intelligent optimization algorithm known as the Sparrow Search Algorithm (SSA), which is a novel swarm intelligence optimization algorithm proposed in [18]. Inspired by the foraging and anti-predation behavior of sparrows, the SSA categorizes sparrows into three roles: discoverers, followers, and sentinels, to achieve efficient optimization searches. In the SSA algorithm, discoverers are responsible for locating food sources and providing information on foraging areas and directions. Followers obtain food based on the information provided by discoverers. When sentinels detect predators, they sound the alarm, prompting edge individuals to quickly move to safe areas, a behavior known as anti-predation. It is important to note that discoverers and followers can interchange roles. If a more optimal food location is discovered, any sparrow can become a discoverer. However, the proportion of discoverers and followers within the population remains constant. The fitness matrix of the sparrow population is expressed as in
F x = [ f ( x 1 ) , f ( x 2 ) , , f ( x N ) ] T f ( x i ) = [ f ( x i , 1 ) , f ( x i , 2 ) , f ( x i , d ) ]
where N is the size of the sparrow population, and d is the dimensionality.
The sparrow population consists of three components: discoverers, followers, and sentinels. Individuals with high fitness in the population are referred to as discoverers. Compared to other individuals, discoverers own a larger search range, and their position update is shown in Equation (12):
X i , j t + 1 = { X i , j t exp ( i α i t e r ) , R 2 < S T X i , j k + Q L , R 2 S T
where i represents the i-th sparrow in the population ( i   = 1 , 2 , , n ); j represents the j-th dimension of the optimization problem ( j   = 1 , 2 , , d ); t represents the t-th iteration of the optimization algorithm; i t e r is the maximum iteration number of the optimization algorithm; α is a random value in the interval (0, 1]; R 2 [ 0 , 1 ] is the vigilance value during the foraging process of sparrows; S T [ 0.5 , 1.0 ] is the safety value during the foraging process; Q is a random value following a normal distribution; and L represents a 1 × D matrix. When R 2 < S T , the sparrow population is in a safe environment, and discoverers should expand their search range; when R 2 > S T , the population is in a dangerous area and should move to a safe area to forage.
During the foraging process of the sparrow population, followers follow the actions of discoverers, and their position update is shown in Equation (13):
X i , j t + 1 = { Q exp ( X w o r s t X i , j t i 2 ) ,                                                 i > n 2 X p t + 1 + | X i , j t X p t + 1 | A + L ,           i n 2
where X w o r s t represents the worst position in the sparrow population; X p represents the best position reached by discoverers; A represents a 1 × D matrix, with elements randomly being 1 or −1, A + = A T ( A A T ) 1 . When i > n 2 , it indicates that followers have not obtained the food found by discoverers and need to continue foraging in other areas.
During the foraging process of the sparrow population, some sparrows are selected as sentinels to monitor the surrounding environment. When predators appear in the vicinity, sentinels abandon the current food source and approach others to avoid danger. The number of sentinels is typically 10% to 20% of the entire population, and their position is updated by Equation (14):
X i , j t + 1 = { X b e s t t + β | X i , j t X b e s t t | , f i > f g X i , j t + k | X i , j t X w o r s t t | f i f w + ε , f i = f g
where X b e s t represents the best position of the current sparrow population; β is a random value following a normal distribution, used to control the step length of sparrow individuals’ movements; k [ 1 , 1 ] is a random value used to control the direction and distance of sparrow individuals’ movements; f i is the fitness value of the i-th sparrow in the population; f g and f w represent, respectively, the global optimal and worst fitness values of the sparrow population; the constant ε is employed to prevent division by zero. When f i > f g , it indicates that there is a predator in the vicinity. When f i = f g , sparrows move closer to other individuals to evade danger.

3.2. Improved Sparrow Search Algorithm

Targeting the deficiencies of the SSA algorithm, such as poor population diversity and tendency to fall into local optima, this section proposes an improved SSA algorithm with multiple strategies.

3.2.1. Chaotic Mapping to Optimize Sparrow Population Diversity

Research indicates that the initial population distribution of bionic optimization algorithms significantly impacts the optimization outcome. The more uniformly the initial population positions are distributed, the faster the algorithm’s search speed and the better its optimization performance. Using chaotic mapping to optimize the initial positions of the sparrow population can enhance population diversity without altering its randomness.
Among commonly used chaotic models, the Sin chaotic model, with its infinite folding characteristics, exhibits superior chaotic properties compared to the Logistic chaotic model [19]. Therefore, this paper employs the Sin chaotic model to optimize the sparrow search algorithm, as expressed in Equation (15):
{ x n + 1 = sin 2 x n , n = 0 , 1 , , N 1 x n 1 , x n 0

3.2.2. Nonlinear Adaptive Convergence Factor

During the foraging process of sparrows, if the step length of discoverers is too large, it may shorten the time to detect the optimal solution but also risks missing the global optimum. To enlarge the global search capability of the SSA algorithm, discoverers should conduct global exploration in the early iterations with a larger convergence factor to expand the global search range. In the later iterations, a smaller convergence factor is needed to strengthen local exploitation, accelerate convergence, and avoid local optima. Inspired by the Grey Wolf Optimization Algorithm [20], a coefficient A is introduced: when | A | > 1 , the population of grey wolf expands the search range for prey (global search), accelerating convergence; when | A | < 1 , the population shrinks the search range to attack prey (local development), with slower convergence. Thus, coefficient A becomes a key factor, balancing global exploration and local development. However, as seen from Equation (16), the convergence factor α determines the value of A, but α decreases linearly, failing to reflect the complex nonlinear search process. To address this, an inverse incomplete Γ function and a convergence factor conforming to the Beta distribution are introduced to enhance search performance, as shown in Equation (17):
A = 2 a r a
a = a min + a max a min ξ Γ ( ξ , 1 t iter max ) + μ betarnd ( p , q )
In Equation (17), r is a random number in the interval [0, 1]; α is the convergence factor α , with α max and α min being its maximum and minimum values. The inverse incomplete Γ function γ ( ξ , a ) = 0 ξ e x x a 1 d x , where ξ is a random variable set to 0.01, and μ = 0.1 , and b e t a r n d ( p , q ) are random numbers following the Beta distribution, with p   =   1 and q   =   2 .
The improved nonlinear convergence factor behaves similarly to a linear decrease in the early iterations, favoring global exploration. In the later iterations, the convergence factor decreases exponentially, enhancing local exploitation capabilities. Additionally, random numbers conforming to the Beta distribution introduce local perturbations to the nonlinear convergence factor, dynamically varying the search steps of the sparrow algorithm and increasing solution diversity. The improved nonlinear convergence factor effectively balances global exploration and local exploitation, thereby improving the algorithm’s optimization performance. The updated position calculation for discoverers is as follows:
X i , j t + 1 = { AX i , j t exp ( i σ iter max ) , R 2 < ST X i , j t + QL , R 2 ST
Furthermore, the position update for sentinels is modified. When f i = f g , i.e., when sparrows move closer to other individuals to evade danger, if the sparrow is at the current optimal position of the population, it randomly relocates between the current optimal and worst positions. If not, it randomly moves between its current position and the population’s optimal position. The improved position update for sentinels is shown in the equation below:
X i , j t + 1 = { X i , j t + β | X i , j t X b e s t t | , f i > f g X i , j t + β | X w o r s t t X b e s t t | , f i = f g

3.2.3. Adaptive T-Distribution

The t-distribution, also known as Student’s distribution, has a curve shape closely related to its degrees of freedom. Compared with the normal distribution, when the degrees of freedom are small, the curve is flatter. If the curve peak is low, the tails are higher. As the degrees of freedom approach positive infinity, the t-distribution gradually approximates the standard normal distribution. The Gaussian and Cauchy distributions are two special cases of the t-distribution, with the probability density being
p t ( x ) = Γ ( n + 1 2 ) n π Γ ( n + 1 2 ) ( 1 + x 2 n ) n + 1 2
where Γ ( n + 1 2 ) = 0 + x n + 1 2 1 e x d x is the second-kind Euler integral.
To enhance the global search capability of the traditional SSA algorithm and prevent premature convergence, an adaptive t-distribution is introduced to perturb the sparrow positions after the position updates of discoverers, followers, and sentinels. The adaptive t-distribution mutation offers stronger perturbation capabilities than the Cauchy and Gaussian distributions. By perturbing the sparrow positions through adaptive t-distribution mutation, the performance of the sparrow algorithm is effectively improved. The specific position is updated as follows:
X i t + 1 = X i t + X i t t ( iter )
where X i t + 1 represents the perturbed sparrow position, and X i t is the position of sparrow i at the t-th iteration. The equation introduces a random perturbation term X i t t ( iter ) based on X i t , fully utilizing the current position information and setting the degrees of freedom parameter to the iteration count t . This allows the algorithm to possess global exploration capabilities in the early iterations and local exploitation capabilities in the later iterations, combining the merits of the Cauchy and Gaussian distributions in the intermediate iterations. This improves the algorithm’s global exploration and local exploitation capabilities, enabling flexible adjustment of exploration and exploitation capabilities at different stages to better search for the global optimum and avoid local optima.

3.3. Specific Steps of the ISSA Algorithm

The ISSA algorithm steps are as follows:
  • Initialization: set algorithm parameters (population size, iterations, and discoverer/sentinel proportions) and initialize sparrow positions using Equation (5).
  • Fitness evaluation: compute individual fitness values and track the best/worst solutions.
  • Discoverer update: adjust discoverer positions via Equation (8).
  • Follower update: modify follower positions using Equation (11).
  • Sentinel update: randomly select sentinels and update their positions via Equation (3).
  • Adaptive mutation: apply t-distribution mutation (Equation (13)) to the current best solution for exploration.
  • Iteration check: recalculate fitness values and verify termination conditions.
  • Termination: if the maximum iterations are reached, output the optimal solution; otherwise, repeat from Step 2.
The workflow is visualized in Figure 1.
With chaotic initialization, nonlinear adaptive convergence factors, and adaptive t-distribution perturbations, the ISSA significantly enhances global search capabilities and robustness. This optimization capability provides a dynamic parameter adjustment mechanism for the UKF, laying the foundation for improving the stability and accuracy of power system state estimation under multiple disturbances. Based on the above improved sparrow search algorithm, this paper proposes the ISSA-UKF state estimation method.

4. ISSA-UKF Algorithm

The key to the UKF algorithm lies in the UT. The statistical properties of the Sigma points in the UT are controlled by the scaling proportion parameters. By adjusting the scaling proportion parameters, a reasonable distribution of sampling points can be selected to effectively influence the scaling proportion parameters and improve the filtering performance of the UKF algorithm. To find the optimal distribution of sampling points with minimal prediction error, an appropriate fitness function must be established. Therefore, the mean square error between the actual value and the filter output estimate is chosen as the fitness function, expressed as
f k = 1 M k = 1 M ( J k θ ^ k ) 2
where f k represents the mean square error of the k-th actual value and the estimated value; M is the estimation length; ϑ k is the actual value; and θ ^ k is the filter output estimate. When the fitness function value is smaller, the mean square error is smaller, indicating that the ISSA algorithm has found the optimal distribution of sampling points. The algorithm initializes the sampling point distribution parameters and then, through the iterative search process of the ISSA algorithm, generates and adjusts the sampling point distribution parameters with the minimal fitness function value, i.e., the optimal parameters. These parameters are input into the UKF algorithm to enhance its performance. By adaptively updating the sampling point distribution parameters, the UKF algorithm can more accurately estimate system states and improve filtering accuracy. For a general nonlinear discrete dynamic system, the process and measurement models is expressed as in
{ X k = f ( X k 1 ) + W k 1 Z k = h ( X k ) + V k
where X k R m , Z k R m represent the state vector and the measurement vector; f ( · ) and h ( · ) represent the known nonlinear state transition function and measurement function, respectively; W k 1 and V k are uncorrelated zero-mean Gaussian white noise with the covariance matrices Q k 1 and R k , respectively. The implementation process of the algorithm is as follows:
Initialization:
{ X ^ 0 = E [ X 0 ] P 0 = E [ ( X 0 X ^ 0 ) ( X 0 X ^ 0 ) T ]
where X ^ 0 and P 0 are the initial state and the initial error covariance.
Sigma Point Calculation:
The optimal sampling point distribution parameters α obtained through the ISSA algorithm optimization are substituted into the scaling proportion parameter calculation formula:
{ x k 1 ( 0 ) = X ^ k 1 x k 1 ( i ) = X ^ k 1 + [ ( n + λ ) P k 1 ] , i = 1 , 2 , L , n x k 1 ( i ) = X ^ k 1 [ ( n + λ ) P k 1 ] , i = n + 1 , n + 2 , L , 2 n
where n represents the state dimension; λ = α 2 ( n + k ) n is the scaling proportion parameter; and α and k are the tuning parameters, with α typically reflecting the sample point distribution.
State Prediction:
{ x k / k 1 ( i ) = f [ x k 1 ( i ) , k 1 ] , i = 0 , 1 , 2 , L , 2 n X ^ k / k 1 = i = 0 2 n ω i ( m ) x k / k 1 ( i ) P XX = i = 0 2 n ω i ( c ) [ x k / k 1 ( i ) X ^ k / k 1 ] [ x k / k 1 ( i ) X ^ k / k 1 ] T P k / k 1 = P XX + Q k 1
where ω i ( m ) and ω i ( c ) are weights, defined as
{ ω 0 ( m ) = λ n + λ ω 0 ( c ) = λ n + λ + ( 1 α 2 + β ) ω i ( m ) = ω i ( c ) = 1 2 ( n + λ ) , i = 1 , 2 , L , 2 n
with β 0 being the weight coefficient.
Measurement Prediction:
{ z k / k 1 ( i ) = h [ x k / k 1 ( i ) , k ] , i = 0 , 1 , 2 , L , 2 n Z k / k 1 = i = 0 2 n ω i ( m ) z k / k 1 ( i )
Gain Calculation:
{ P ZZ = i = 0 2 n ω i ( c ) [ x k / k 1 ( i ) X ^ k / k 1 ] [ z k / k 1 ( i ) Z ^ k / k 1 ] T P ZZ = i = 0 2 n ω i ( c ) [ z k / k 1 ( i ) Z ^ k / k 1 ] [ z k / k 1 ( i ) Z ^ k / k 1 ] T + R k K k = P XZ P ZZ 1
Filter Update:
{ X ^ k = X ^ k / k 1 + K k ( Z k Z ^ k / k 1 ) P k = P k / k 1 K k P ZZ K k T
Steps 2 to 6 are repeated to complete the UKF algorithm. Unlike the traditional UKF, the ISSA-UKF not only adaptively adjusts the sampling parameters to enhance filtering performance but also improves its responsiveness to observational anomalies and malicious data disturbances through an optimal control parameter search mechanism. Next, through simulation experiments on typical system models, the effectiveness and robustness advantages of the ISSA-UKF in dynamic state estimation will be verified.

5. Experimental Results

5.1. Parameter Settings

To validate the adaptability and robustness of the proposed ISSA-UKF algorithm under various disturbance conditions, two benchmark systems—the WECC 3-machine 9-bus system and the New England 10-machine 39-bus system—are selected for simulation studies in the MATLAB R2024a environment. The experiments are designed to cover three scenarios: normal operation, observational anomalies, and cyber-attacks.
The WECC 3-machine 9-bus system comprises three generators and three load points, with a total load of 315 MW and 115 MVar. The system data and configurations, as well as the inertia constants, are shown in Table 1. This system has been widely used in multiple power system stability studies. The New England 10-machine 39-bus system includes ten generators and 21 load points, with a total load of 6254.2 MW and 1387.1 MVar. Three generators were selected for this study, and the system data and configurations, along with the inertia constants, are provided in Table 2.
To assess the performance of the proposed method, a comparative analysis between the ISSA-UKF and the conventional UKF is conducted on both systems. The accuracy of each method is evaluated by comparing the estimated rotor angle δ and angular velocity ω with their true values. A smaller estimation error indicates a higher estimation accuracy. All experiments were conducted on a standard desktop CPU platform (Intel Core i7-12700H, 16GB RAM) without GPU acceleration. For both the WECC 3-machine 9-bus system and the New England 10-machine 39-bus system, the execution time of a single state estimation cycle using the ISSA-UKF algorithm does not exceed 3 s, meeting the real-time requirements of small- to medium-scale power system models. Since the core optimization process primarily focuses on adaptive adjustment of low-dimensional covariance parameters and does not involve large-scale matrix decomposition or high-dimensional sampling, the algorithm demonstrates favorable computational efficiency and scalability, making it applicable to larger-scale state estimation tasks.

5.2. Normal Measurement Data

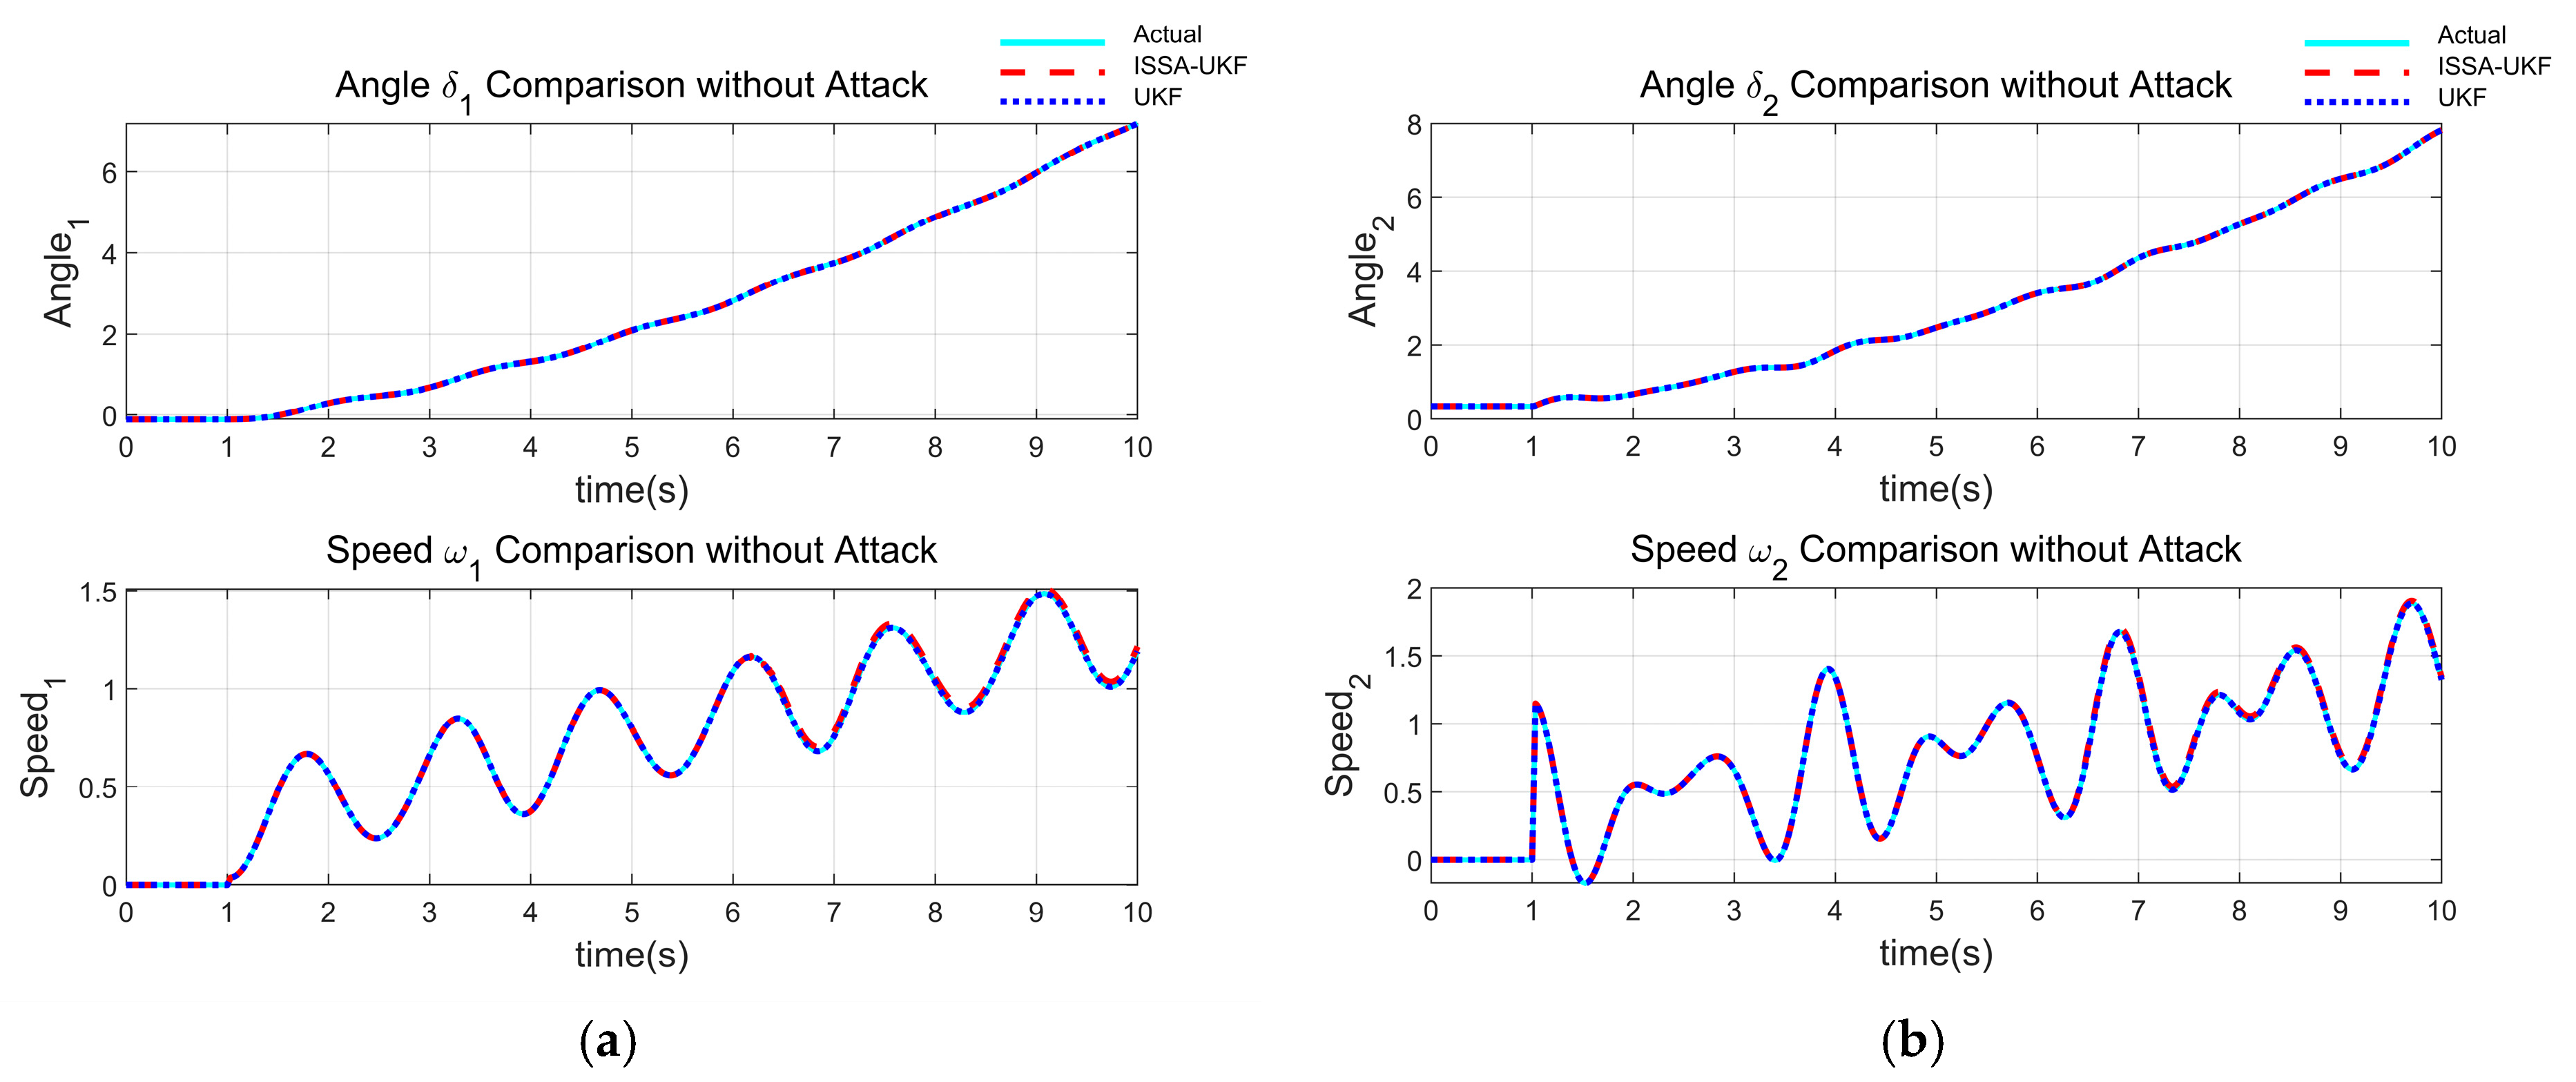
In this experiment, two generators were selected from each of the aforementioned power systems as the study objects, and the same generator configurations were used consistently throughout the subsequent tests. Under the scenario without observational anomalies or cyberattacks, the estimation performance of both the UKF and ISSA-UKF algorithms is compared, as shown in Figure 2. The results indicate that both algorithms are capable of accurately estimating the dynamic states of the power system under normal operating conditions to observation anomalies.

5.3. Observational Anomalies Without Cyberattacks

To simulate observational anomalies caused by factors such as sensor failure, calibration inaccuracy, communication transmission errors, or external environmental interference, Gaussian pulse noise was injected into the measurements of rotor angle and rotor angular velocity at t = 6.2 s. The disturbance model is: z ˜ k = z k + 0.8 r a n d n ( 1 ) . Here, z ˜ k represents the observational anomaly value, and r a n d n ( 1 ) is a standard normal random number. 
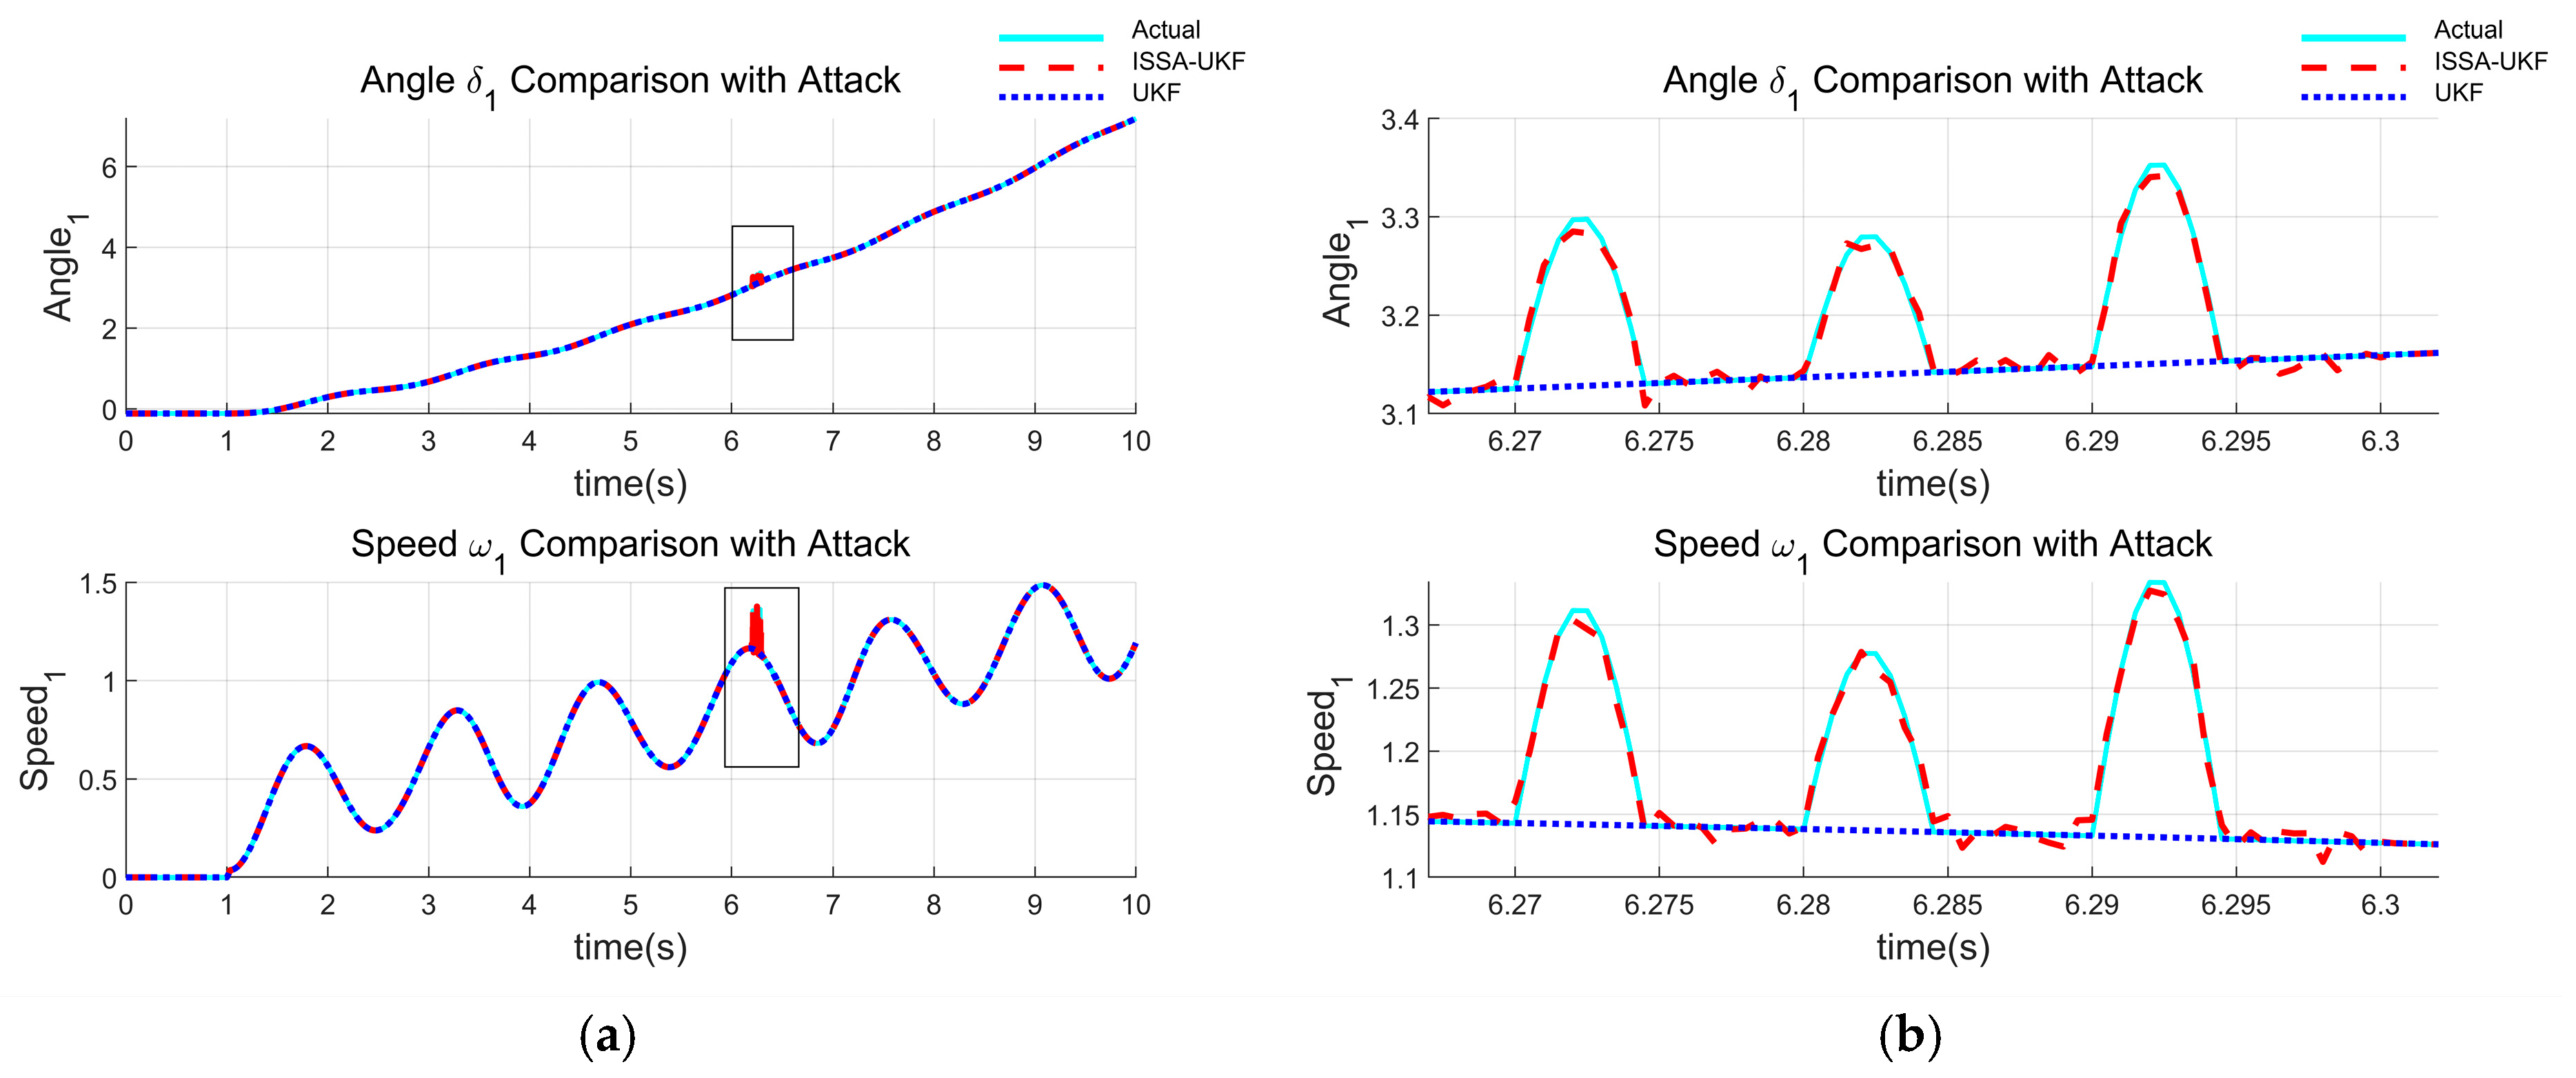
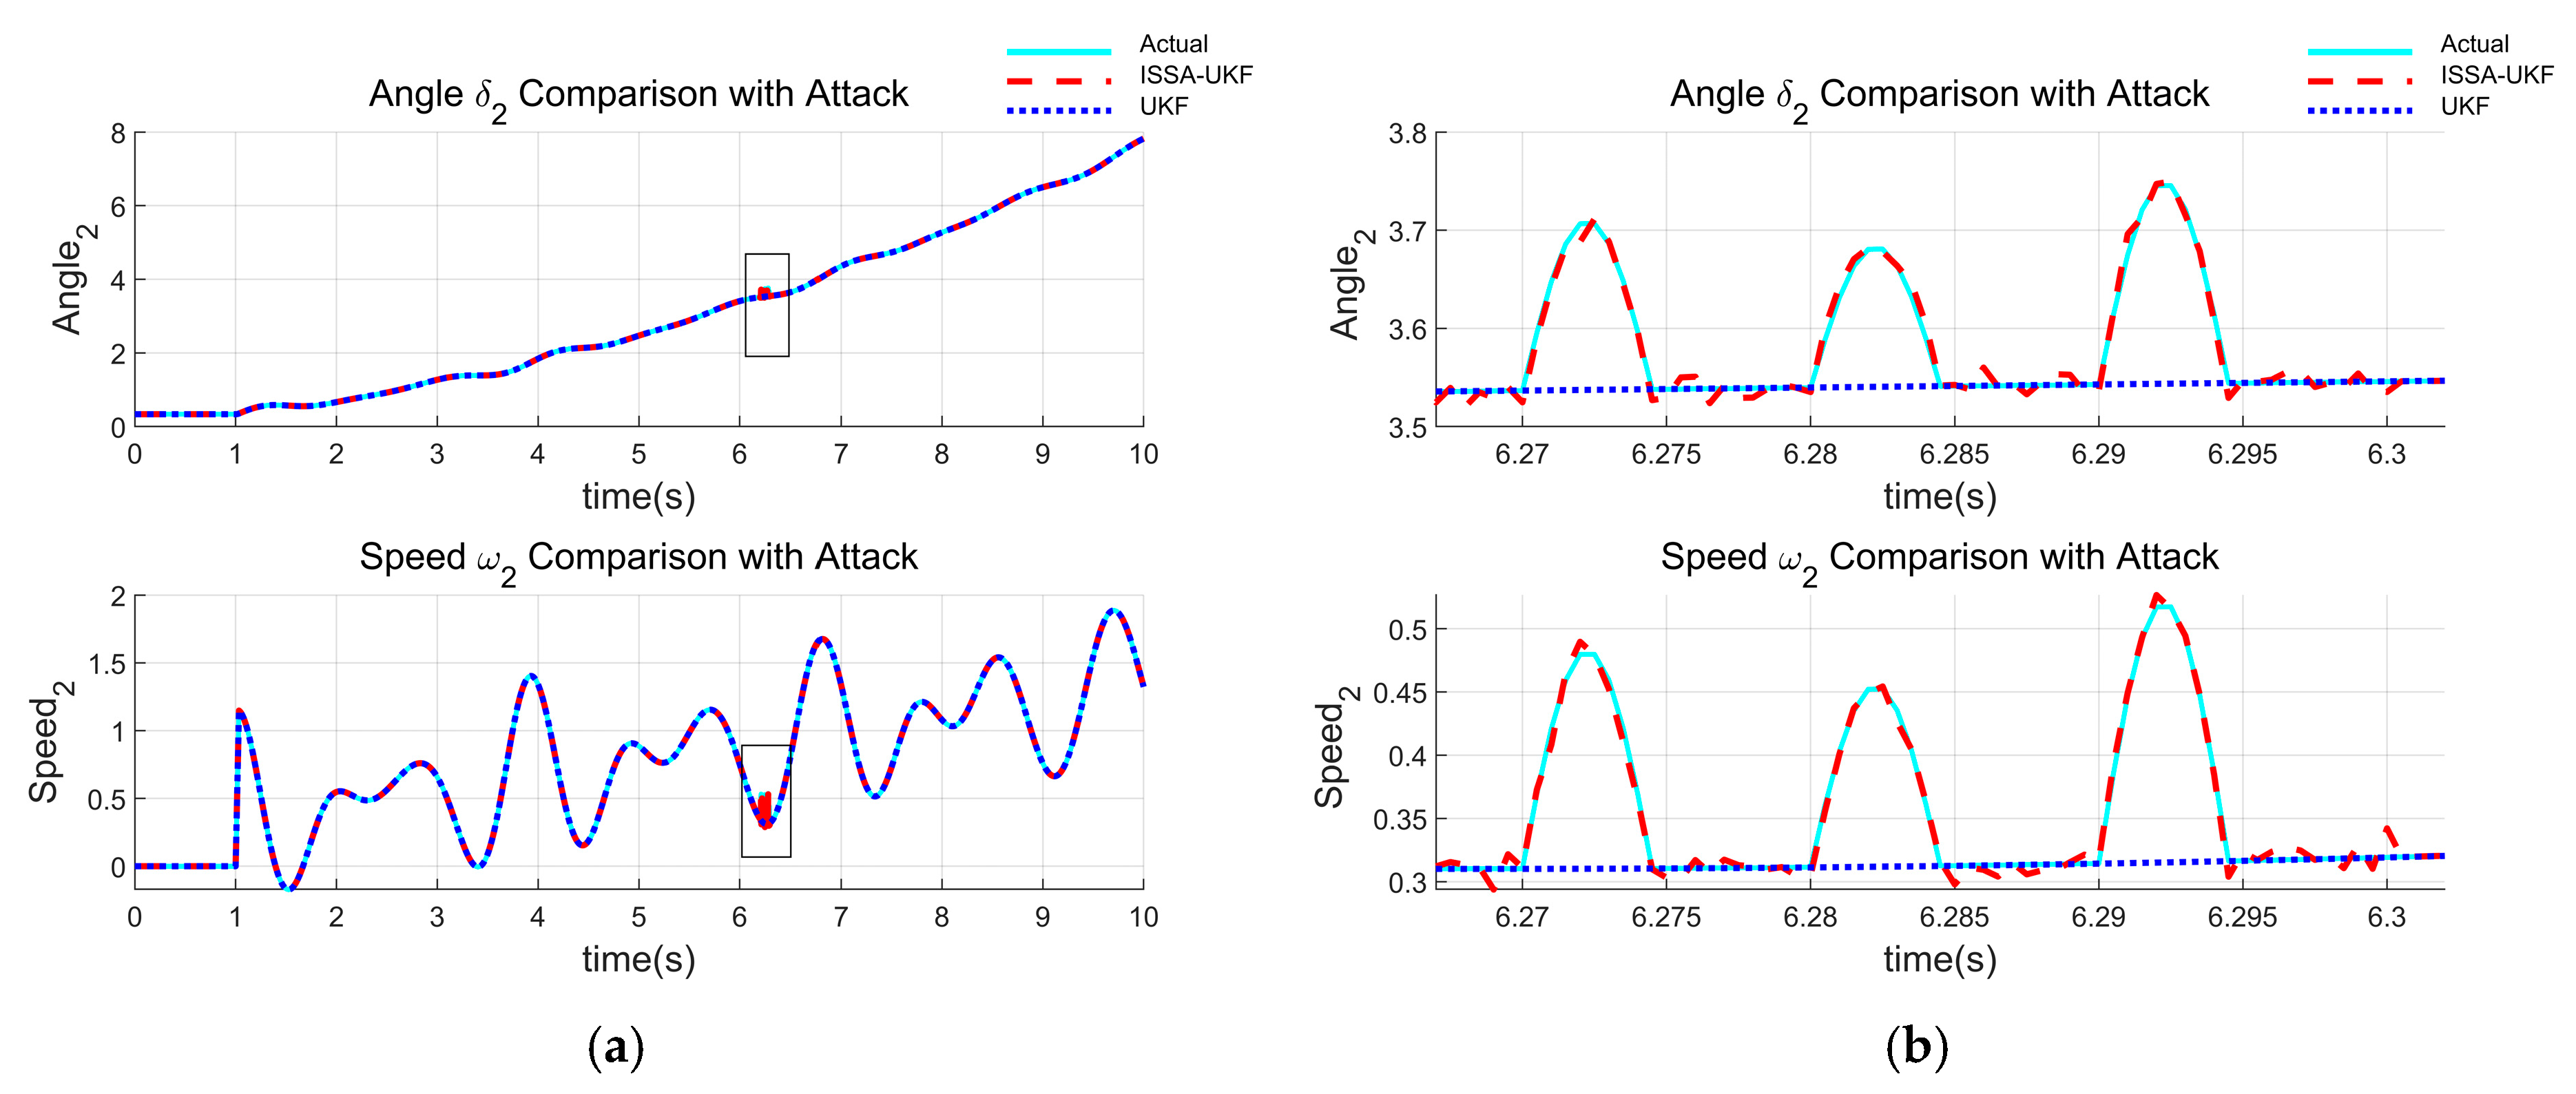
Figure 3 presents the state estimation results for Generator 1 in the WECC 3-machine 9-bus system under observational anomaly conditions, where (a) shows the full view and (b) provides a magnified local view. Similarly, Figure 4 illustrates the corresponding results for Generator 2. As observed, the standard UKF significantly deviates from the true state once anomalies appear and fails to recover promptly, indicating its poor robustness under such disturbances. In contrast, the proposed ISSA-UKF algorithm maintains accurate tracking of the true state, owing to its ability to dynamically adjust the covariance matrices. This demonstrates its superior robustness and adaptability.
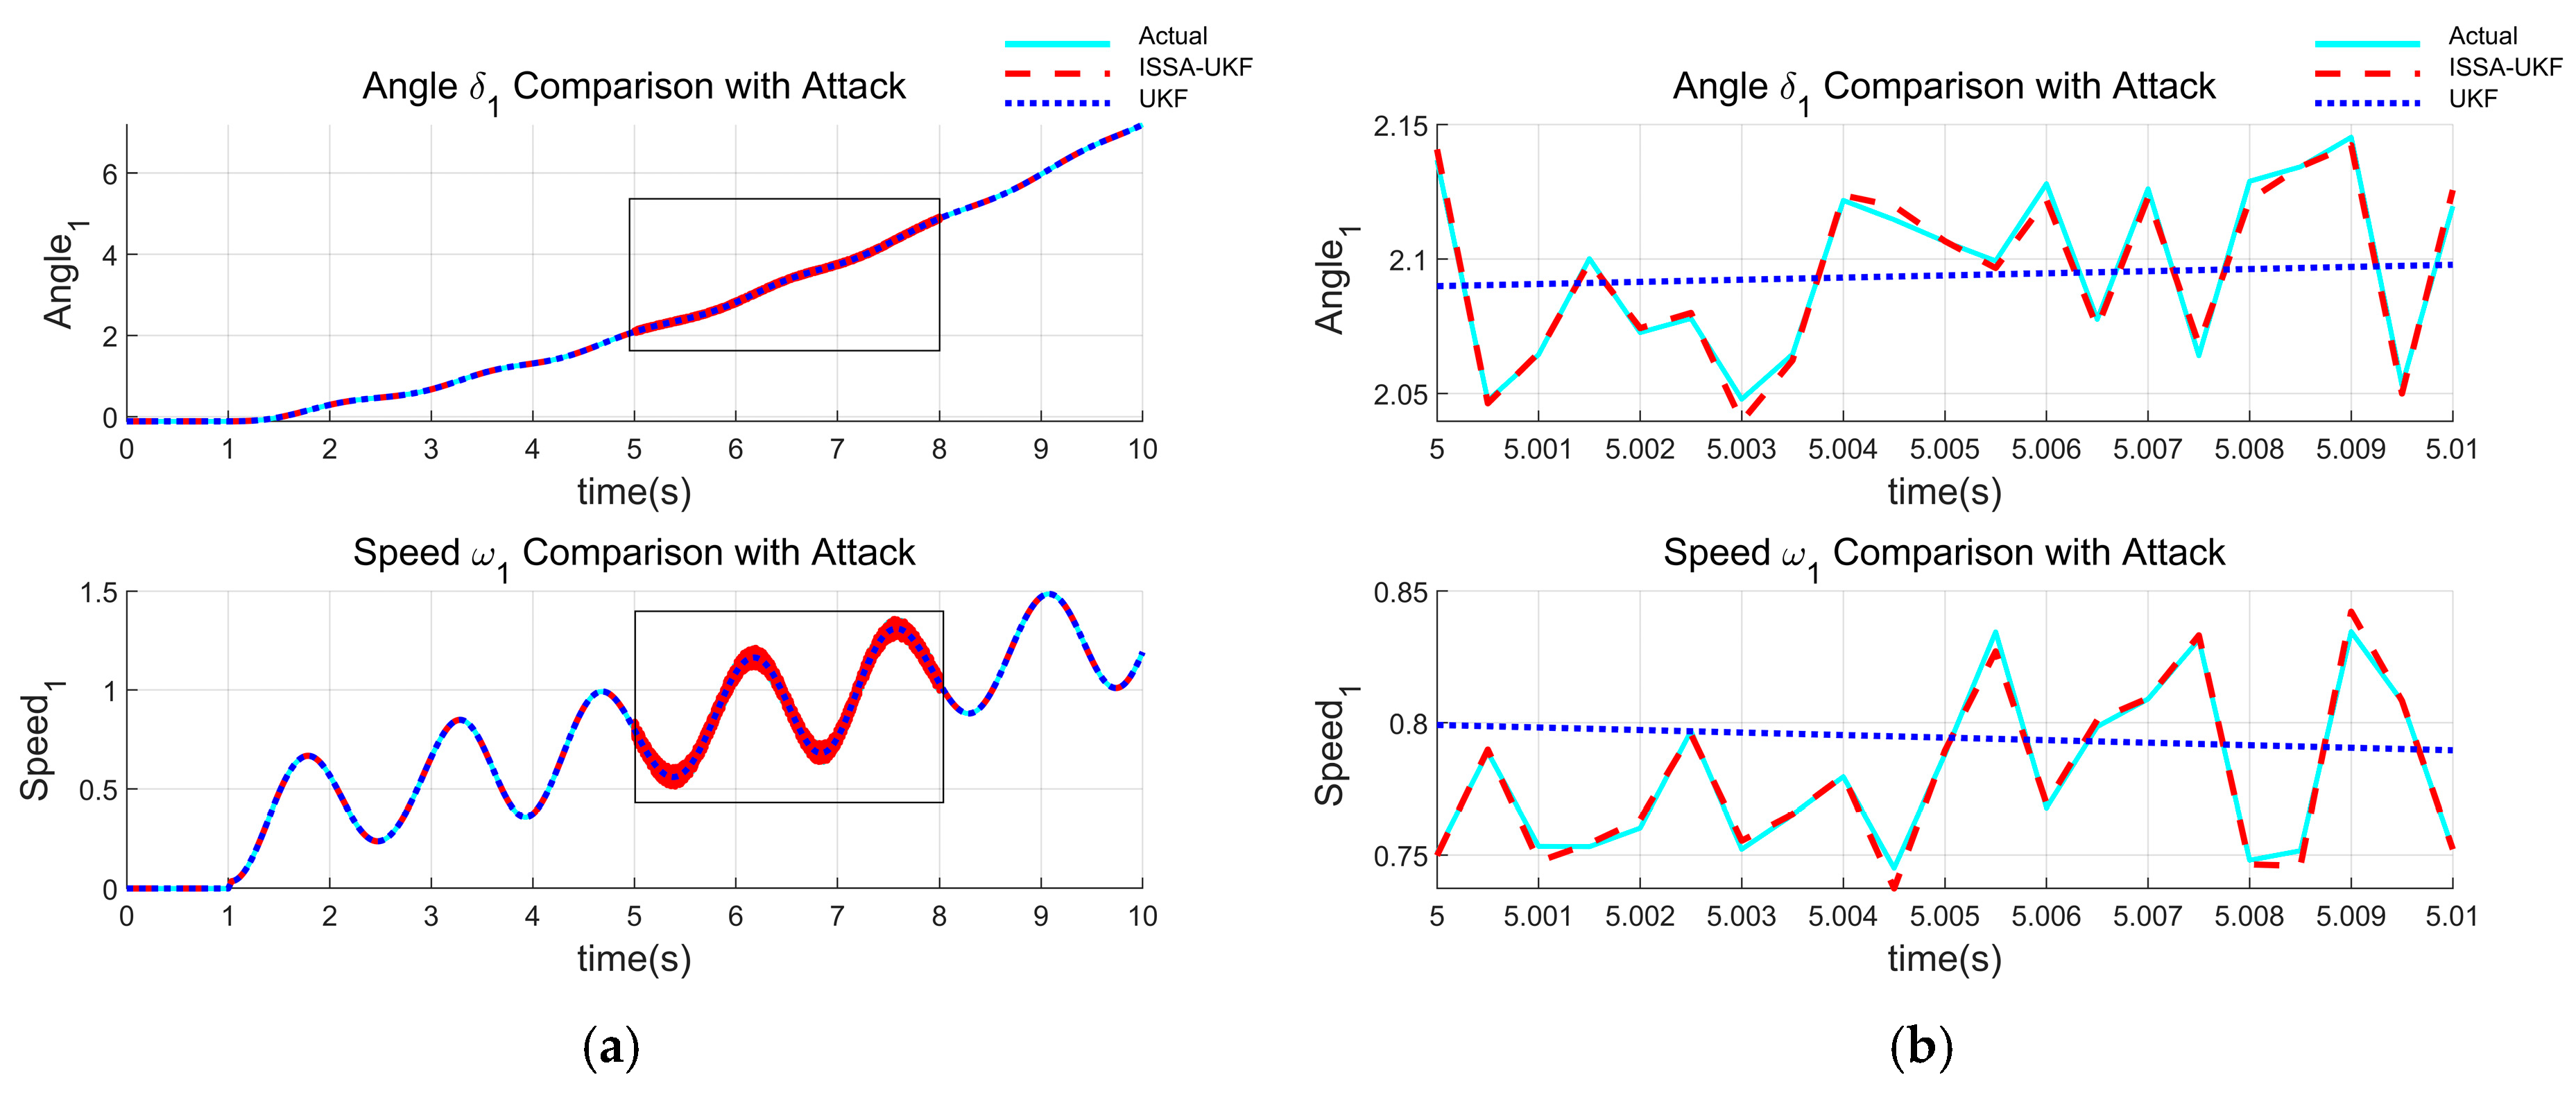
5.4. Cyberattacks

Cyberattacks aim to compromise the estimation accuracy by injecting malicious data into the measurement stream, thereby disturbing the Kalman gain calculation and increasing estimation errors. In the ISSA-UKF framework, such attacks further deteriorate performance by misleading the fitness function used in the ISSA optimizer (as defined in Equation (21)), thus introducing dual-layer disruption. To simulate a cyberattack scenario where measurement values are maliciously tampered, a typical cyberattack was introduced. During the time interval ( t [ 5 , 8 ] s), the measurements used for state estimation (rotor angle and rotor angular velocity) were subjected to the following attack:
{ X i ( t ) = B i x i ( t ) + v i ( t ) + s i , t τ a X i ( t ) = B i x i ( t ) + v i ( t ) + s i + r a n k ( m , n ) , t τ a
where X i ( t ) represents the original system measurements. Random attacks involve injecting disturbances into measurements based on a random distribution, aiming to increase system noise and compromise the accuracy of state estimation, where m is the upper bound, and n is the lower bound of the random attack. To enhance the realism and reproducibility of cyberattack modeling, this paper explicitly defines the amplitude, duration, and injection frequency of the disturbance signals. Specifically, random disturbances with an amplitude of ±5% are injected into the measurement values, corresponding to an upper bound of +0.05 and a lower bound of −0.05, simulating a typical non-destructive false data injection scenario. Disturbances are injected at every sampling interval (0.5 ms), forming a high-frequency random injection pattern. To more effectively disrupt the state estimation process, the attack time window is set during the critical stage of the system’s dynamic response (5–8 s). Although this interval is relatively short compared to the duration of the total simulation, the disturbance is injected at a high frequency (every 0.5 ms), creating an intense and abrupt interference scenario. This configuration is designed to create an extreme interference environment, enabling the comprehensive evaluation of the robustness of various estimation algorithms under adversarial conditions.
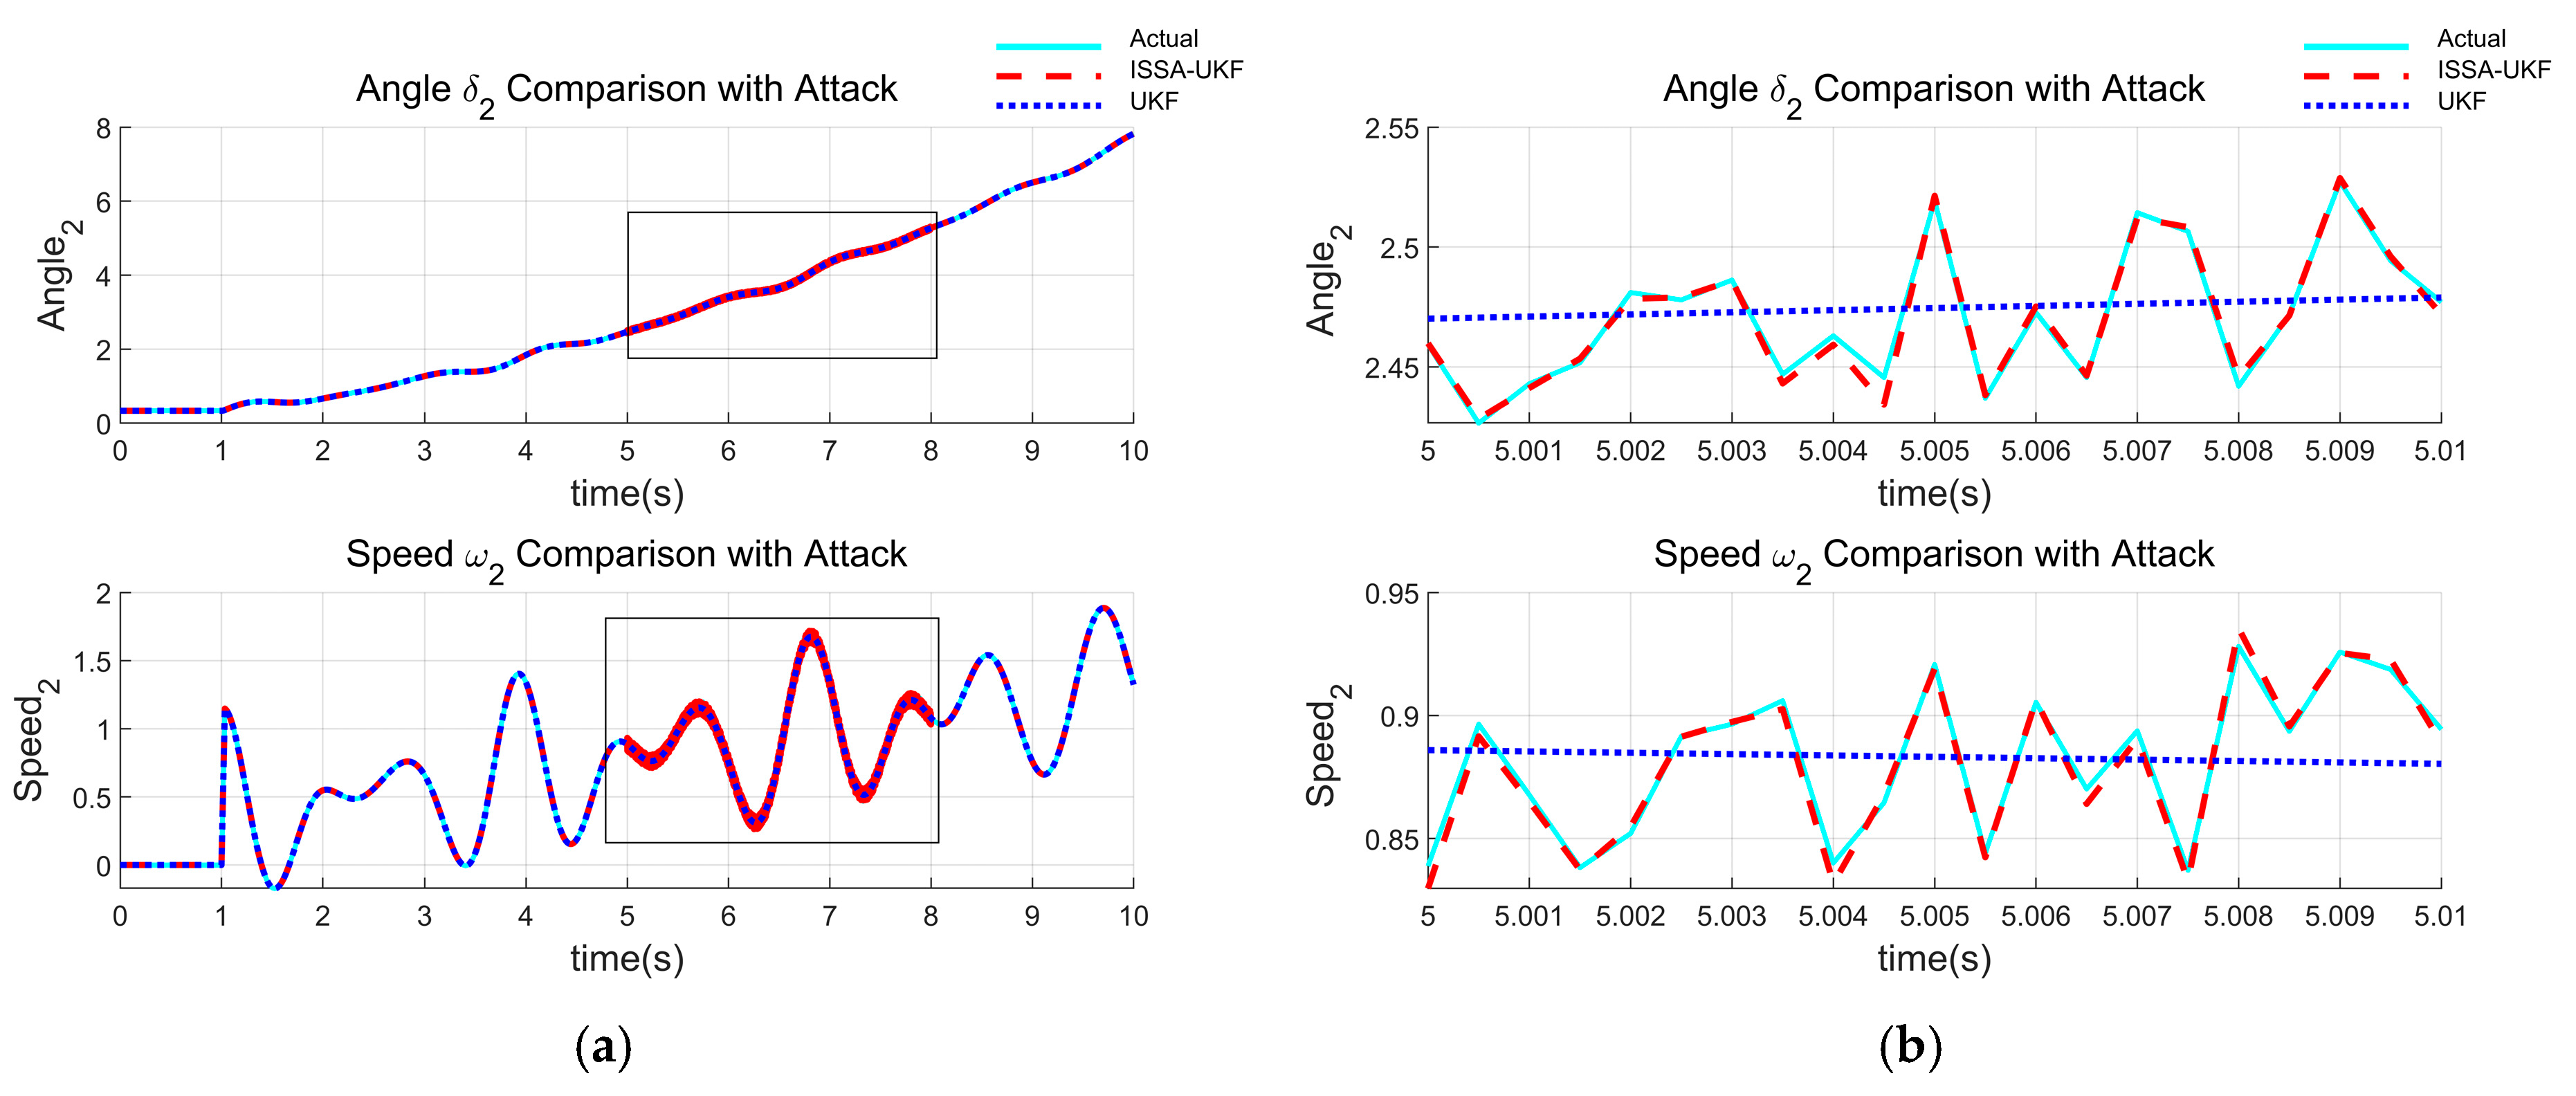
Figure 5 shows the state estimation results under cyberattack conditions for Generator 1, where (a) presents the full view, and (b) illustrates a magnified view during the attack period. Likewise, Figure 6 provides the corresponding results for Generator 2. The standard UKF fails to detect and respond to the attack, resulting in significant deviations and divergence in the estimation. In contrast, the ISSA-UKF maintains accurate estimation trajectories despite the injected false data, demonstrating its enhanced resilience and robustness against cyberattacks.
To further validate the superiority of the proposed ISSA-UKF algorithm in state estimation under cyberattack conditions, this section expands the comparison beyond the standard UKF by including three commonly used estimation methods: the Extended Kalman filter (EKF), the Cubature Kalman filter (CKF), and the robust M-estimation-based unscented Kalman filter (M-UKF). Figure 7 presents the locally magnified estimation results of rotor angle δ and rotor speed ω for Generators 1 and 2 under cyberattack scenarios.
As shown in the figure, EKF exhibits significant fluctuations after the onset of attacks and fails to track the true state accurately. CKF, while offering improved nonlinearity handling, remains highly sensitive to abnormal measurements, resulting in noticeable estimation errors. M-UKF maintains a certain level of robustness in the early phase of the disturbance but shows deviations in the later period. In contrast, the proposed ISSA-UKF algorithm demonstrates the closest tracking performance to the actual values throughout the entire period, with the smallest overall deviation, highlighting its superior robustness and estimation accuracy.
These results indicate that under extreme disturbance conditions such as cyberattacks, ISSA-UKF enhances the system’s state awareness and resilience by adaptively optimizing the covariance matrices and dynamically adjusting sampling parameters. The method not only improves global trend prediction but also effectively suppresses localized errors caused by sudden disturbances, underscoring its potential application value in the secure state estimation of modern power systems.

6. Conclusions

6.1. Research Summary

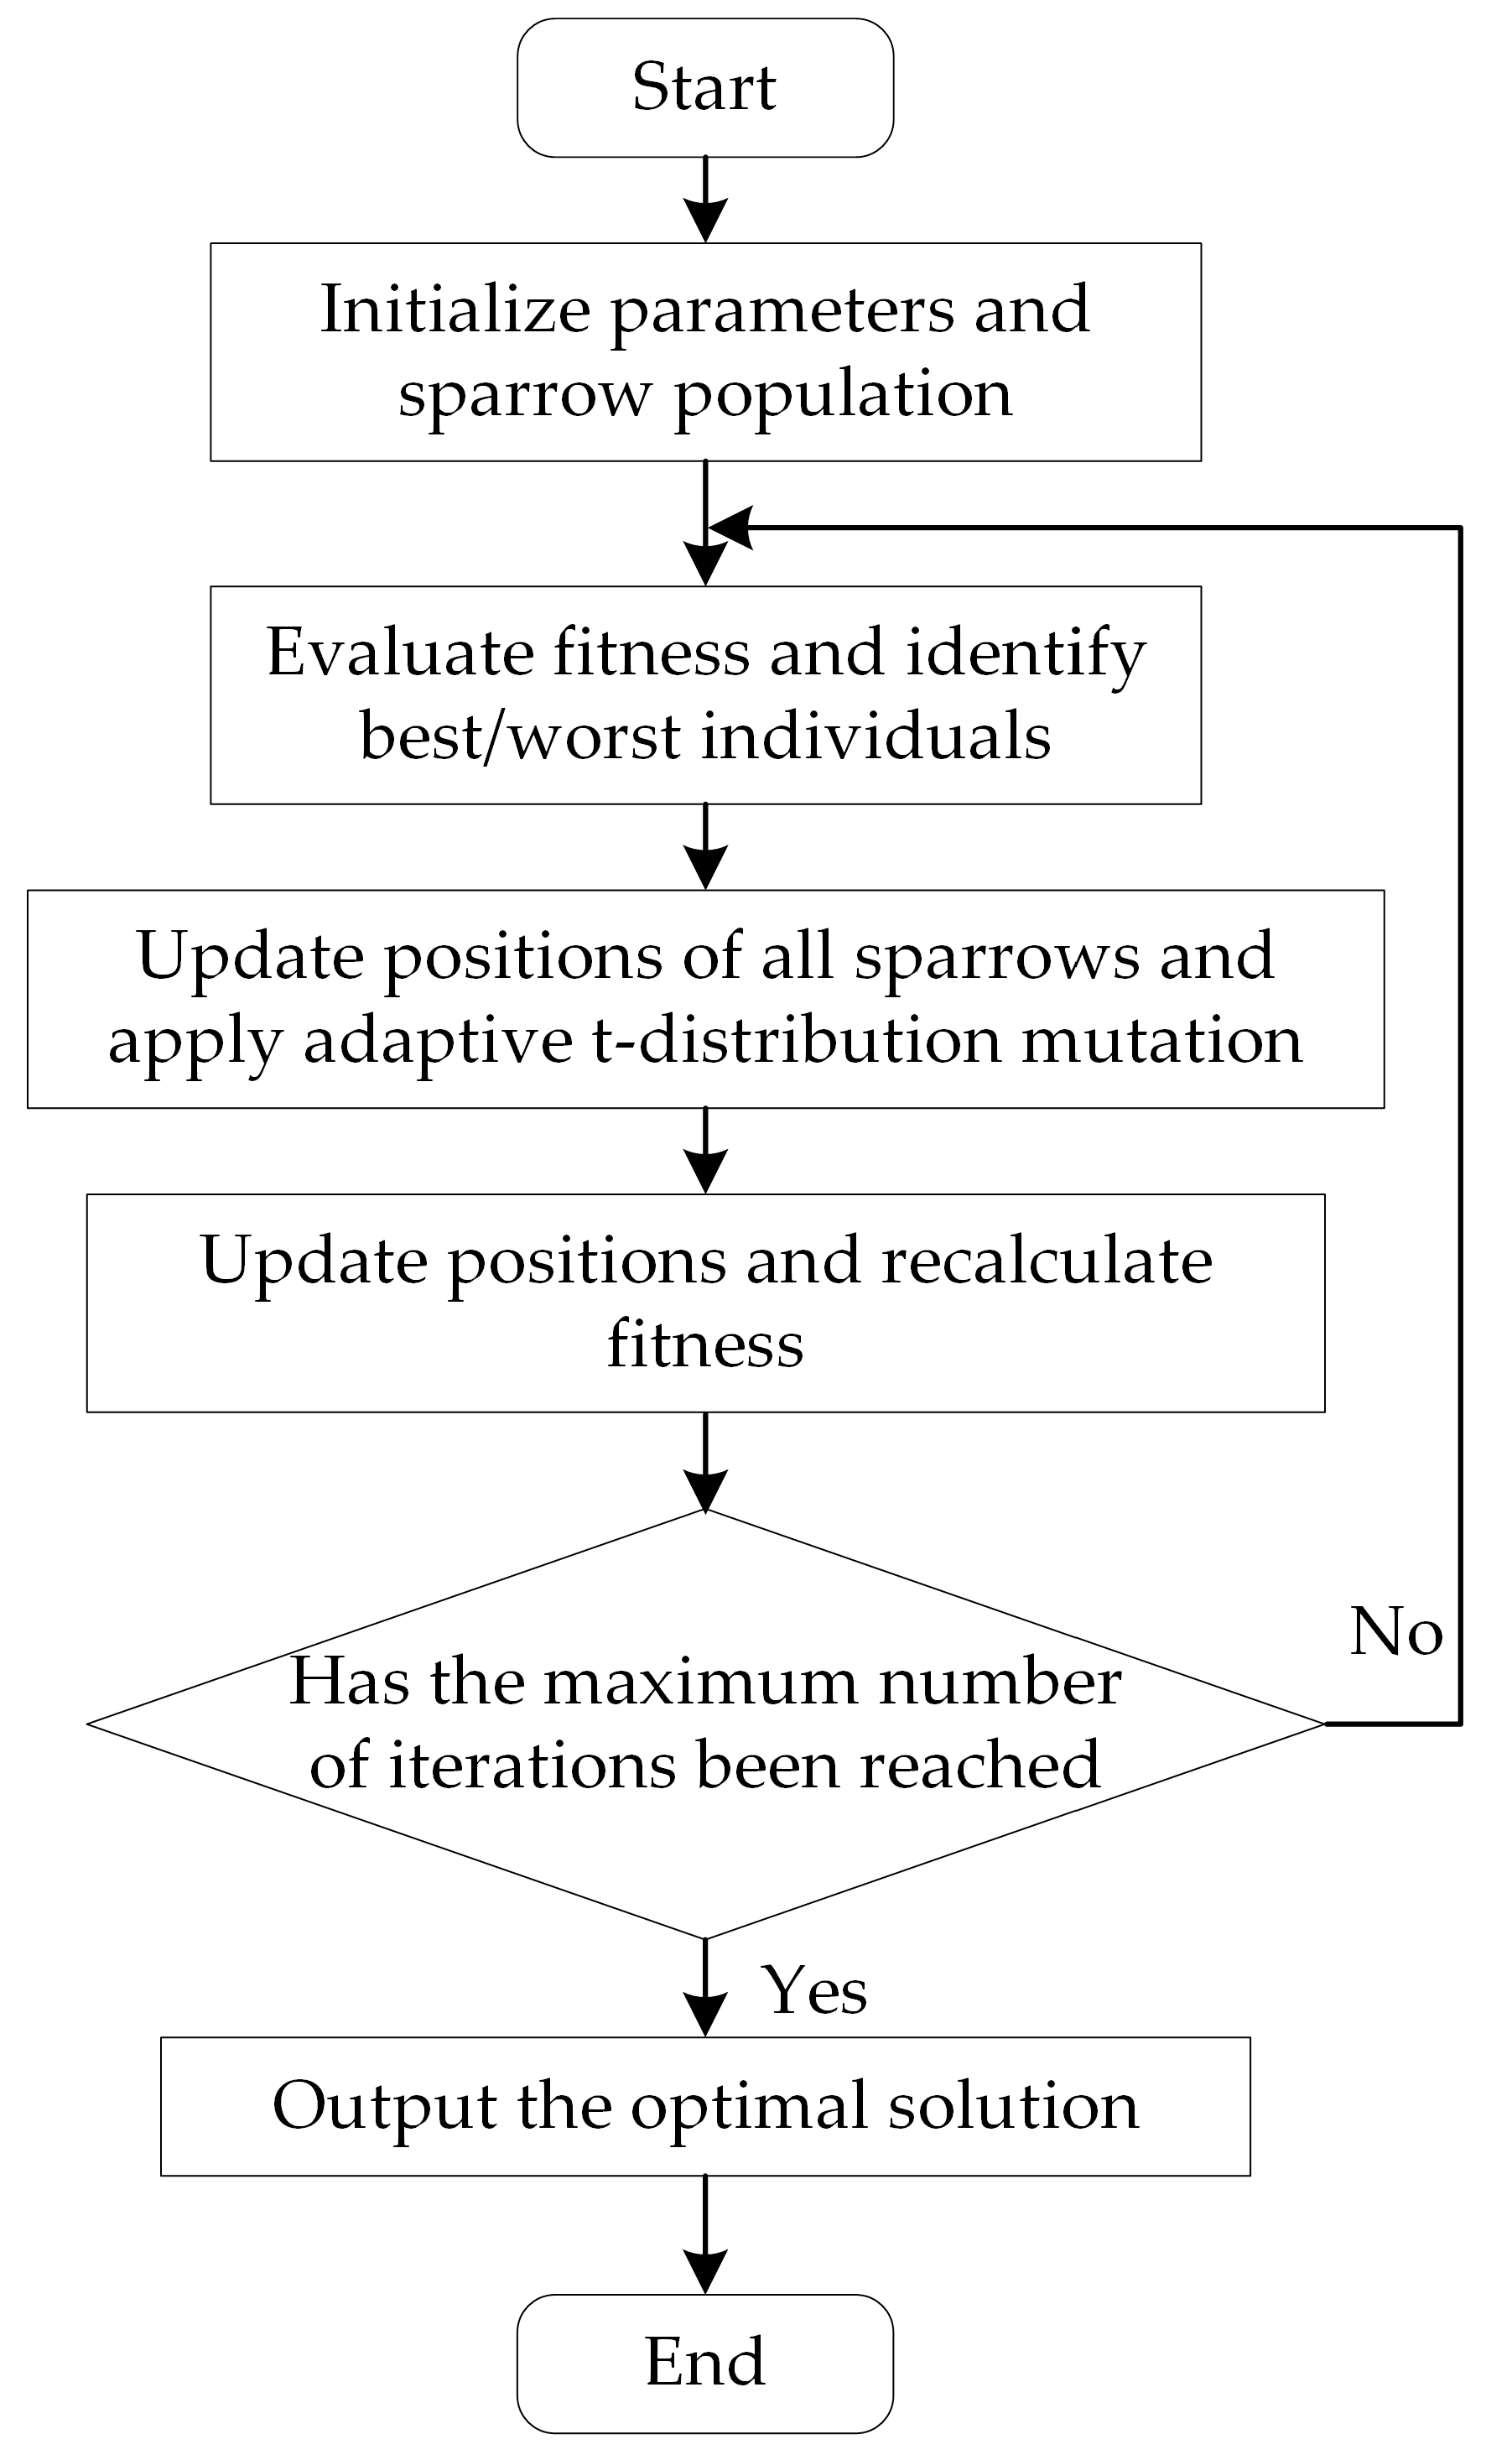
This study addresses the problem of dynamic state estimation in power systems under complex operating conditions and proposes an unscented Kalman filter (UKF) method optimized by an Improved Sparrow Search Algorithm (ISSA-UKF). By incorporating chaotic initialization, a coordinated update mechanism between discoverers and followers, and an adaptive t-distribution mutation operator, the proposed approach retains the global search capability of the Sparrow Search Algorithm while significantly improving convergence speed and solution stability. The optimization strategy allows for the dynamic adjustment of the system and measurement noise covariance matrices in the UKF, enabling a better trade-off between estimation accuracy and computational cost.
The experimental results under three representative disturbance scenarios (normal fluctuations, observational anomalies, and cyberattacks) demonstrate that, compared with the standard UKF, ISSA-UKF achieves higher estimation accuracy and robustness in multi-dimensional state tracking. In particular, it exhibits strong resilience against malicious attacks. Furthermore, comparative analysis with other typical filtering algorithms such as EKF, CKF, and M-UKF further validates the superiority of the proposed method in terms of stability and convergence performance.
From a methodological perspective, the proposed ISSA-UKF offers the following key advantages: (1) The integration of chaotic mapping and adaptive mutation mechanisms effectively avoids premature convergence and enhances search diversity and global coverage. (2) The combination of global evolutionary strategy and UKF-based local estimation enables real-time parameter adjustment and high-precision state tracking. (3) The designed disturbance mechanism demonstrates strong generality and adaptability to nonlinear, high-dimensional state space estimation tasks.
These features ensure that the ISSA-UKF maintains high estimation accuracy and robustness even under extreme conditions such as complex disturbances, unknown inputs, and intentional attacks, thus providing a novel and reliable strategy for the robust perception of power system operational states.

6.2. Limitations and Future Work

Although the effectiveness of the ISSA-UKF has been verified under multiple disturbance scenarios, there remain several directions for future extension. (1) Incorporating more comprehensive error evaluation metrics: The current evaluation focuses on trajectory fitting and robustness. Future research may introduce statistical indicators such as RMSE, MAE, and confidence intervals to enable more systematic and quantitative comparisons of state estimation accuracy across different algorithms. (2) Integrating anomaly detection mechanisms into an end-to-end perception framework: This work focuses on the state estimation methodology and does not address attack detection. Future work could explore embedding anomaly detection modules into the estimation pipeline, enabling an end-to-end robust perception framework that spans from disturbance detection to state reconstruction. (3) Drawing inspiration from interfacial coupling mechanisms to enhance multi-scale modeling accuracy [21]: Recent advances in heterogeneous system modeling have shown that interfacial electric field coupling can enhance system dynamic response. Future research may draw upon such interface engineering strategies—such as those demonstrated in MoS2/TiO2 heterostructures—to improve the adaptability and engineering applicability of estimation methods in multi-scale and high-dimensional systems. (4) Extending to larger-scale systems and hybrid intelligent frameworks: The current validation is based on small- to medium-scale systems. Future work could apply the ISSA-UKF to larger-scale power networks to assess its real-time performance and scalability. Moreover, integrating advanced intelligent optimization techniques such as deep reinforcement learning with the ISSA could further enhance the algorithm’s self-adaptive and online tuning capabilities.

Author Contributions

Conceptualization, Y.X.; investigation, W.W.; methodology, Y.X., W.W., Y.L., X.M., Y.C., and Z.L.; software, Y.L., X.M., Y.C., and Z.L.; supervision, Y.X.; validation, W.W., Y.L., X.M., Y.C., and Z.L.; writing—original draft, Y.X. and W.W.; writing—review and editing, Y.L., X.M., Y.C., and Z.L. All authors have read and agreed to the published version of the manuscript.

Funding

This work was supported by Research on Key Technologies and Devices for Source-Load Coordination and Control in Low-Voltage Distribution Networks Based on Edge Intelligence (project number: 52053024000K).

Data Availability Statement

Data are contained within the article.

Conflicts of Interest

All authors were employed by the company Electric Power Research Institute of State Grid Shanxi Electric Power Company. The authors declare that the research was conducted in the absence of any commercial or financial relationships that could be construed as a potential conflict of interest.

References

  1. Zhu, L.; Wen, W.; Qu, Y.; Shen, F.; Li, J.; Song, Y. Robust Representation Learning for Power System Short–Term Voltage Stability Assessment Under Diverse Data Loss Conditions. IEEE Trans. Neural Netw. Learn. Syst. 2023, 35, 6035–6047. [Google Scholar] [CrossRef] [PubMed]
  2. Moudoud, H.; Khoukhi, L.; Cherkaoui, S. Prediction and detection of FDIA and DDoS attacks in 5G enabled IoT. IEEE Netw. 2020, 35, 194–201. [Google Scholar] [CrossRef]
  3. Zhang, Z.Y.; Deng, R.L.; David, K.Y.; Cheng, P.; Chen, J. Analysis of moving target defense against false data injection attacks on power grid. IEEE Trans. Inf. Forensics Secur. 2022, 15, 2320–2335. [Google Scholar] [CrossRef]
  4. Zhuang, P.; Deng, R.; Liang, H. False Data Injection Attacks Against State Estimation in Multiphase and Unbalanced Smart Distribution Systems. IEEE Trans. Smart Grid 2019, 10, 6000–6013. [Google Scholar] [CrossRef]
  5. Fan, L.; Wehbe, Y. Extended Kalman filtering based real–time dynamic state and parameter estimation using PMU data. Electr. Power Syst. Res. 2013, 103, 168–177. [Google Scholar] [CrossRef]
  6. Madhukar, P.S.; Prasad, L.B. State estimation using extended Kalman filter and unscented Kalman filter. In Proceedings of the International Conference on Emerging Trends in Communication, Control and Computing, Lakshmangarh, India, 21–22 February 2020. [Google Scholar]
  7. Zhang, J.; Zhang, J.; Wu, P. False Data Detection in DC Microgrids Based on Integrated Cubature Kalman Filter. Intell. Power 2024, 52, 87–93. [Google Scholar]
  8. Wu, P.; Zhang, J.; Luo, S.; Song, Y.; Zhang, J.; Wang, Y. A Fusion Adaptive Cubature Kalman Filter Approach for False Data Injection Attack Detection of DC Microgrids. Electronics 2024, 13, 1612. [Google Scholar] [CrossRef]
  9. Liu, Y.; Cheng, L. Relentless false data injection attacks against Kalman–filter–based detection in smart grid. IEEE Trans. Control Netw. Syst. 2022, 9, 1238–1250. [Google Scholar] [CrossRef]
  10. Hu, P.; Gao, W.; Li, Y.; Guo, X.; Hua, F.; Qiao, L. Anomaly detection and state correction in smart grid using ekf and data compensation techniques. IEEE Sens. J. 2024, 24, 12995–13009. [Google Scholar] [CrossRef]
  11. Samer, S.; Song, E.; Niu, D. Robust cubature Kalman filter for moving–target tracking with missing measurement. Sensors 2024, 24, 392. [Google Scholar]
  12. Lu, T.; Zhou, W.; Tong, S. Improved maximum correntropy cubature Kalman and information filters with application to target tracking under non–gaussian noise. Int. J. Adapt. Control Signal Process. 2024, 38, 1199–1221. [Google Scholar] [CrossRef]
  13. Li, Z.; Yang, X.; Li, L. Iterated orthogonal simplex cubature Kalman filter and its application in target tracking. Appl. Sci. 2024, 14, 392. [Google Scholar] [CrossRef]
  14. Han, D.; Qi, H.; Wang, S. Adaptive maximum generalized Gaussian cyclostationarity blind deconvolution for the early fault diagnosis of high-speed train bearings under non-Gaussian noise. Advanced Eng. Inf. 2024, 62, 102731. [Google Scholar] [CrossRef]
  15. Han, D.; Qi, H.; Hou, D. Dynamic detection mechanism model of acoustic emission for high-speed train axle box bearings with local defects. Mech. Syst. Signal Proc. 2025, 235, 112943. [Google Scholar] [CrossRef]
  16. Gao, C.; Sun, J. Dynamic state estimation for power system based on M–UKF algorithm. In Proceedings of the IEEE 4th Conference on Energy Internet and Energy System Integration, Wuhan, China, 30 October–1 November 2020. [Google Scholar]
  17. Zhao, J.; Mili, L. A robust generalized–maximum likelihood unscented Kalman filter for power system dynamic state estimation. IEEE J. Sel. Top. Signal Process. 2018, 12, 578–592. [Google Scholar] [CrossRef]
  18. Xue, J.; Shen, B. A novel swarm intelligence optimization approach: Sparrow search algorithm. Syst. Sci. Control Eng. 2020, 8, 22–34. [Google Scholar] [CrossRef]
  19. Arora, S.; Sharma, M.; Anand, P. A novel chaotic interior search algorithm for global optimization and feature selection. Appl. Artif. Intell. 2020, 34, 292–328. [Google Scholar] [CrossRef]
  20. Mirjalili, S.; Mirjalili, S.M.; Lewis, A. Grey wolf optimizer. Advances Eng. Soft. 2014, 69, 46–61. [Google Scholar] [CrossRef]
  21. Ma, C.; Hou, D.; Jiang, J. Elucidating the synergic effect in nanoscale MoS2/TiO2 heterointerface for Na-ion storage. Advanced Sci. 2022, 9, 2204837. [Google Scholar] [CrossRef]
Figure 1. Flowchart of the ISSA algorithm.
Electronics 14 03059 g001
Figure 2. Estimation results under normal observational conditions: (a) Generator 1; (b) Generator 2.
Electronics 14 03059 g002
Figure 3. Estimation results under observational anomaly conditions (Generator 1): (a) full view; (b) local magnified view.
Electronics 14 03059 g003
Figure 4. Estimation results under observational anomaly conditions (Generator 2): (a) full view; (b) local magnified view.
Electronics 14 03059 g004
Figure 5. Estimation results under cyberattack conditions (Generator 1): (a) full view; (b) local magnified view.
Electronics 14 03059 g005
Figure 6. Estimation results under cyberattack conditions (Generator 2): (a) full view; (b) local magnified view.
Electronics 14 03059 g006
Figure 7. Local estimation results under cyberattack conditions using different algorithms: (a) Generator 1; (b) Generator 2.
Electronics 14 03059 g007
Table 1. WECC 3-machine 9-bus system.
GeneratorH(p.u)D(p.u)X(p.u)
123.640.02250.0608
26.40.006630.1198
33.010.002650.1813
Table 2. New England 10-machine 39-bus system.
Generator D(p.u)X(p.u)
15000.0060
230.30.06970
335.80.05310
Disclaimer/Publisher’s Note: The statements, opinions and data contained in all publications are solely those of the individual author(s) and contributor(s) and not of MDPI and/or the editor(s). MDPI and/or the editor(s) disclaim responsibility for any injury to people or property resulting from any ideas, methods, instructions or products referred to in the content.

