4.1. Training and Test Results
Through the experiment, the MAE (MAPE) curves of the range and depth are shown in
Figure 10. The error of the entire test set is calculated in each epoch, and the MAE is obtained by averaging the final results over the number of samples. Finally, the MAPE is calculated according to the range of the range and depth. It can be seen that after 115 model updates, the model tends to be stable. The final range MAE is 0.029 km and the depth MAE is 0.072 m. Meanwhile, the range MAPE is
and depth MAPE is 0.267%.
A comprehensive error is established for different depths and ranges. For the sake of simplification, the summation in the following equation is dimensionless.
As shown in
Figure 11, in most cases, the combined error is quite low, hovering around 0.04.
Figure 11a visually represents the error as a function of distance and depth, with predominantly low-error regions indicated by the darker shades in the color scale.
Figure 11b further quantifies this, showing that the majority of error values are less than 0.2.
Based on the established simulation environment and the relationship between the receiving range, depth, and interference period derived in
Section 2, the localization results of the traditional algorithm for the target can be obtained by leveraging the interference period. However, due to the small aperture of the towed horizontal array, the traditional algorithm exhibits poor resolution in depth. Therefore, only the difference in depth localization accuracy is compared here. The extraction of the interference period refers to the 2D-FFT extraction method in the paper. After calculation, the error comparison between the traditional algorithm and the neural network algorithm is depicted in
Figure 12. The MAE within 50 km is 10.9 km and MAPE is 35.95%, which is much larger than the results achieved from MoELocNet. Meanwhile, as the range increases, the localization error of the traditional algorithm keeps increasing, while the localization result based on the neural network remains relatively good.
4.2. Comparison Experiments Between Different Network
To rigorously assess the performance of the MoELocNet architecture, we conducted a comparative analysis against ResNext, SwinTransformer, and VisionTransformer. Two key metrics, Mean Absolute Error (MAE) and Mean Absolute Percentage Error (MAPE), were employed to evaluate the localization accuracy for both range (unit: km) and depth (unit: m) tasks, facilitating a comprehensive comparison of model robustness. All models were trained under identical conditions using the same dataset and hyper parameters, ensuring a fair comparison. The test results of different models are shown in
Figure 13. The MoELocNet model has the best performance in both depth and range tasks.
For the MAE metric, which quantifies the average magnitude of absolute deviations between predicted and ground truth values, in the context of range localization (represented by blue bars in
Figure 13a), the MoELocNet achieved the lowest MAE of 0.029 km. When compared to other models, ResNext showed a range MAE of 0.041 km (41.4% higher error); SwinTransformer recorded 0.0545 km (87.9% higher error) and VisionTransformer had 0.034 km (17.2% higher error). In terms of depth localization (represented by orange bars in
Figure 13a), MoELocNet yielded a depth MAE of 0.072 m. SwinTransformer had 0.188 m (161.1% higher error), and VisionTransformer had 0.075 m (4.2% higher error). Statistically, MoeLocNet showcased its superior precision in minimizing absolute errors.
As for the MAPE metric, which normalizes errors to account for scale differences and provides a relative performance measure, for range localization (blue bars in
Figure 13b), MoELocNet achieved a MAPE of 0.297%. ResNext showed 0.5% (68.3% higher error), SwinTransformer had 0.328% (10.4% higher error), and VisionTransformer had 0.3576% (20.4% error). For depth localization (orange bars in
Figure 13b), MoE achieved a MAPE of 0.263%. ResNext showed 0.6% (128.1% higher error), SwinTransformer had 0.29% (10.2% higher error), and VisionTransformer had 0.274% (4.2% higher error). The balanced and low MAPE of MoeLocNet (≤0.3% for both tasks) indicates consistent performance across range and depth scales.
The superiority of MoELocNet can be attributed to its multi-expert architecture. This design allows for the adaptive extraction of interference features from single-frame data. In contrast to ResNet18, which uses simpler residual blocks, and SwinTransformer, which focuses on hierarchical aggregation, MoELocNet leverages specialized experts to resolve complex interference patterns in deep-sea waveguides. This architectural advantage enables MoELocNet to minimize both absolute (MAE) and relative (MAPE) errors, ensuring robust performance across diverse oceanic conditions. Practically, the 0.029 km range error and 0.072 m depth error of MoELocNet meet the precision requirements of deep-sea localization and outperform baseline models in both accuracy and consistency. These results validate the effectiveness of integrating multi-expert learning into residual networks for interference structure extraction, confirming that MoELocNet is the best-performing model in this comparative analysis.
To address the concern raised regarding model interpretability, we further visualize the expert activation patterns within the MoELocNet framework with an expert activation map. The map visually demonstrate the activation intensity of each expert across different interference patterns, revealing which experts are prioritized for specific signal characteristics. By quantifying and visualizing expert contributions, we aim to shed light on the model’s decision-making logic, thereby enhancing trust in its predictions.
The detailed activation patterns are presented in
Figure 14. The categories in the map are defined based on depth and range as follows: depth is divided into ‘Shallow’ (less than 50 m) and ‘Deep’ (50 m or more); range is categorized as ‘Near’ (1 km–15 km), ‘Mid’ (15 km–35 km), and ‘Far’ (35 km–50 km). The map shows the activation strength of each expert (with Expert ID 0, 1, and 2) for different depth–range combinations.
As is depicted in
Figure 14, expert 1 shows consistent yet moderate activation in all scenarios, acting as a complementary specialist when dealing with transitional acoustic conditions. Regarding physical consistency, the patterns of expert selection are in line with underwater acoustic theory. Far-field sources need specialized processing due to their complex multi-path structures and frequency-dependent attenuation, while near-field sources gain advantages from direct path emphasis and early reflection analysis. The fact that expert selection is independent of depth implies that in our acoustic environment, range-dependent effects have a more significant impact than depth-dependent effects.
In terms of real-time interpretability implementation, our training framework includes comprehensive interpretability features. These features consist of real-time monitoring of expert activation during the inference process and systematic logging of expert selection patterns throughout all training epochs. For robustness analysis, the distinct boundaries of expert activation, where the activation strengths of dominant experts exceed 0.8, demonstrate the robustness of decision making. Meanwhile, the moderate activations in transitional scenarios indicate proper handling of uncertainty. This interpretability is of great importance for building operators’ trust in autonomous underwater acoustic localization systems.
The ablation experimental results based on different routers, loss types, and multi-expert models are shown in
Table 4 (where Conv in the table represents Convolutional Stem). We compared the simulation results under different routers, loss types, and with or without the MoE model, respectively. To further validate the efficacy of each component within MoELocNet, we conducted systematic ablation experiments.
Firstly, concerning the impact of the expert architecture, we compare the MoE stem structure with the standard convolutional stem. It is evident that the MoE approach outperforms the convolutional stem. Specifically, the MAE-R is reduced from 0.037 km to 0.029 km, achieving a 21.6% improvement, and the MAE-D is improved from 0.077 m to 0.072 m, with a 6.5% enhancement.
Secondly, we assess the contribution of the multi-task loss. The single-task-loss experiments, including range-only and depth-only experiments, exhibit degraded performance when compared to the multi-task-loss learning. This validates the effectiveness of our joint optimization strategy.
Finally, we analyze the router mode by comparing the learned gating and fixed expert selection. The learned gating consistently demonstrates superior performance over the fixed selection, with MAE-R values of 0.029 km and 0.042 km, respectively.
In summary, these systematic ablation results indicate that the performance improvement is not solely due to the increased model complexity. Instead, it may be attributed to the MoE architecture’s capability to learn specialized representations for different acoustic scenarios.
4.4. SNR
In this section, the influence of the signal-to-noise ratio of the received signal on the output of the model is considered. When the signal-to-noise ratio is low, the received signal is feeble, and the sound intensity interference structure appears vague. The definition of the signal-to-noise ratio (SNR) is given in Equation (
22) and
Figure 16 presents input signals with different signal-to-noise ratios. For the noiseless training set, the trained model is applied to the test sets with different SNRs, where the SNRs range from −10 dB to 50 dB.
As depicted in the figures,
Figure 17a illustrates the Mean Absolute Error (MAE) for range localization against the Signal-to-Noise Ratio (SNR), while
Figure 17b shows the corresponding MAE for depth localization. Evidently, range localization exhibits relatively low sensitivity to SNR variations and performs satisfactorily across all tests. When the SNR exceeds 5 dB, the MAE for range localization gradually diminishes, dropping below 0.15 km once the SNR reaches 20 dB. Conversely, for depth localization, the MAE is notably high at low SNR levels. A sharp decline in the MAE occurs around −5 dB. Once the SNR surpasses 0 dB, the MAE for depth localization stabilizes.
On this basis, model training for the noisy training set is added. During the first 10 epochs of training, noise is added to the training set with random SNR values in the range from −10 dB to 0 dB. Finally, the performance is tested on the test sets with different SNRs. Results are shown in
Figure 17a,b. Compared to the noiseless condition, the Mean Absolute Error (MAE) for both range and depth localization decreases. When the Signal-to-Noise Ratio (SNR) exceeds 20 dB, as the SNR further increases, the MAE in both scenarios remains constant.
4.5. Marine Environmental Adaptability
Despite the model’s favorable performance with simulation data, the simulated towed horizontal array data are overly idealized and fail to account for the real ocean environment, including factors such as sea depth, variations in sound velocity profiles, changes in internal wave environments, and even array tilt effects caused by the ocean environment. Therefore, in this section, the trained model will be used to conduct tests in three distinct environments as illustrated in
Table 5.
Figure 18a depicts the sound speed profiles (SSPs) utilized in different test environments. The SSPs of the Indian Ocean and Munk are both typical deep-sea sound speed profiles, with slight differences in sea depth, while the Gulf SSP represents a typical double-channel axis sound speed. The micro-disturbance in this context is characterized by a mechanical model, which manifests as minor variations in the receiving range and depth for each receiver. These variations can be attributed to vehicle movement or ocean fluctuations. Here, we adopted an array tilt structure as illustrated in
Figure 18b. The aforementioned receiving data are all generated using Bellhop, and parameters that are not explicitly mentioned, such as the seabed parameters, remain consistent with those used in
Table 3.
Figure 19 presents a comparative analysis of target localization outcomes across various oceanic environment tests. Specifically,
Figure 19a–c illustrates the range localization results, while
Figure 19d–f depicts the depth localization results. As observed from the figures, when the SSP types are analogous, the localization results remain relatively accurate, with minor errors in depth localization but consistently high efficiency in range localization. Conversely, when there are substantial variations in the SSP, as exemplified in
Figure 19b,e, the dual-channel axis in the Gulf SSP amplifies the influence of the sound source depth. The acoustic field variations induced by slight changes in the sound source are considerably more pronounced compared to the other two SSPs, and this effect escalates with increasing range. Additionally, as indicated in
Figure 19c,f, slight array disturbances exert minimal impact on the overall localization performance. These findings are further corroborated by the MAE and MAPE results presented in
Table 6.
4.6. Long-Range Localization
After tested by the training sets in the deep-sea shadow zone, the MoELocNet model is used to train and test in a long-range situation. The marine environment used for generating data is shown in
Table 7. Similar to the deep-sea shadow zone test set, the sound speed profile is shown in
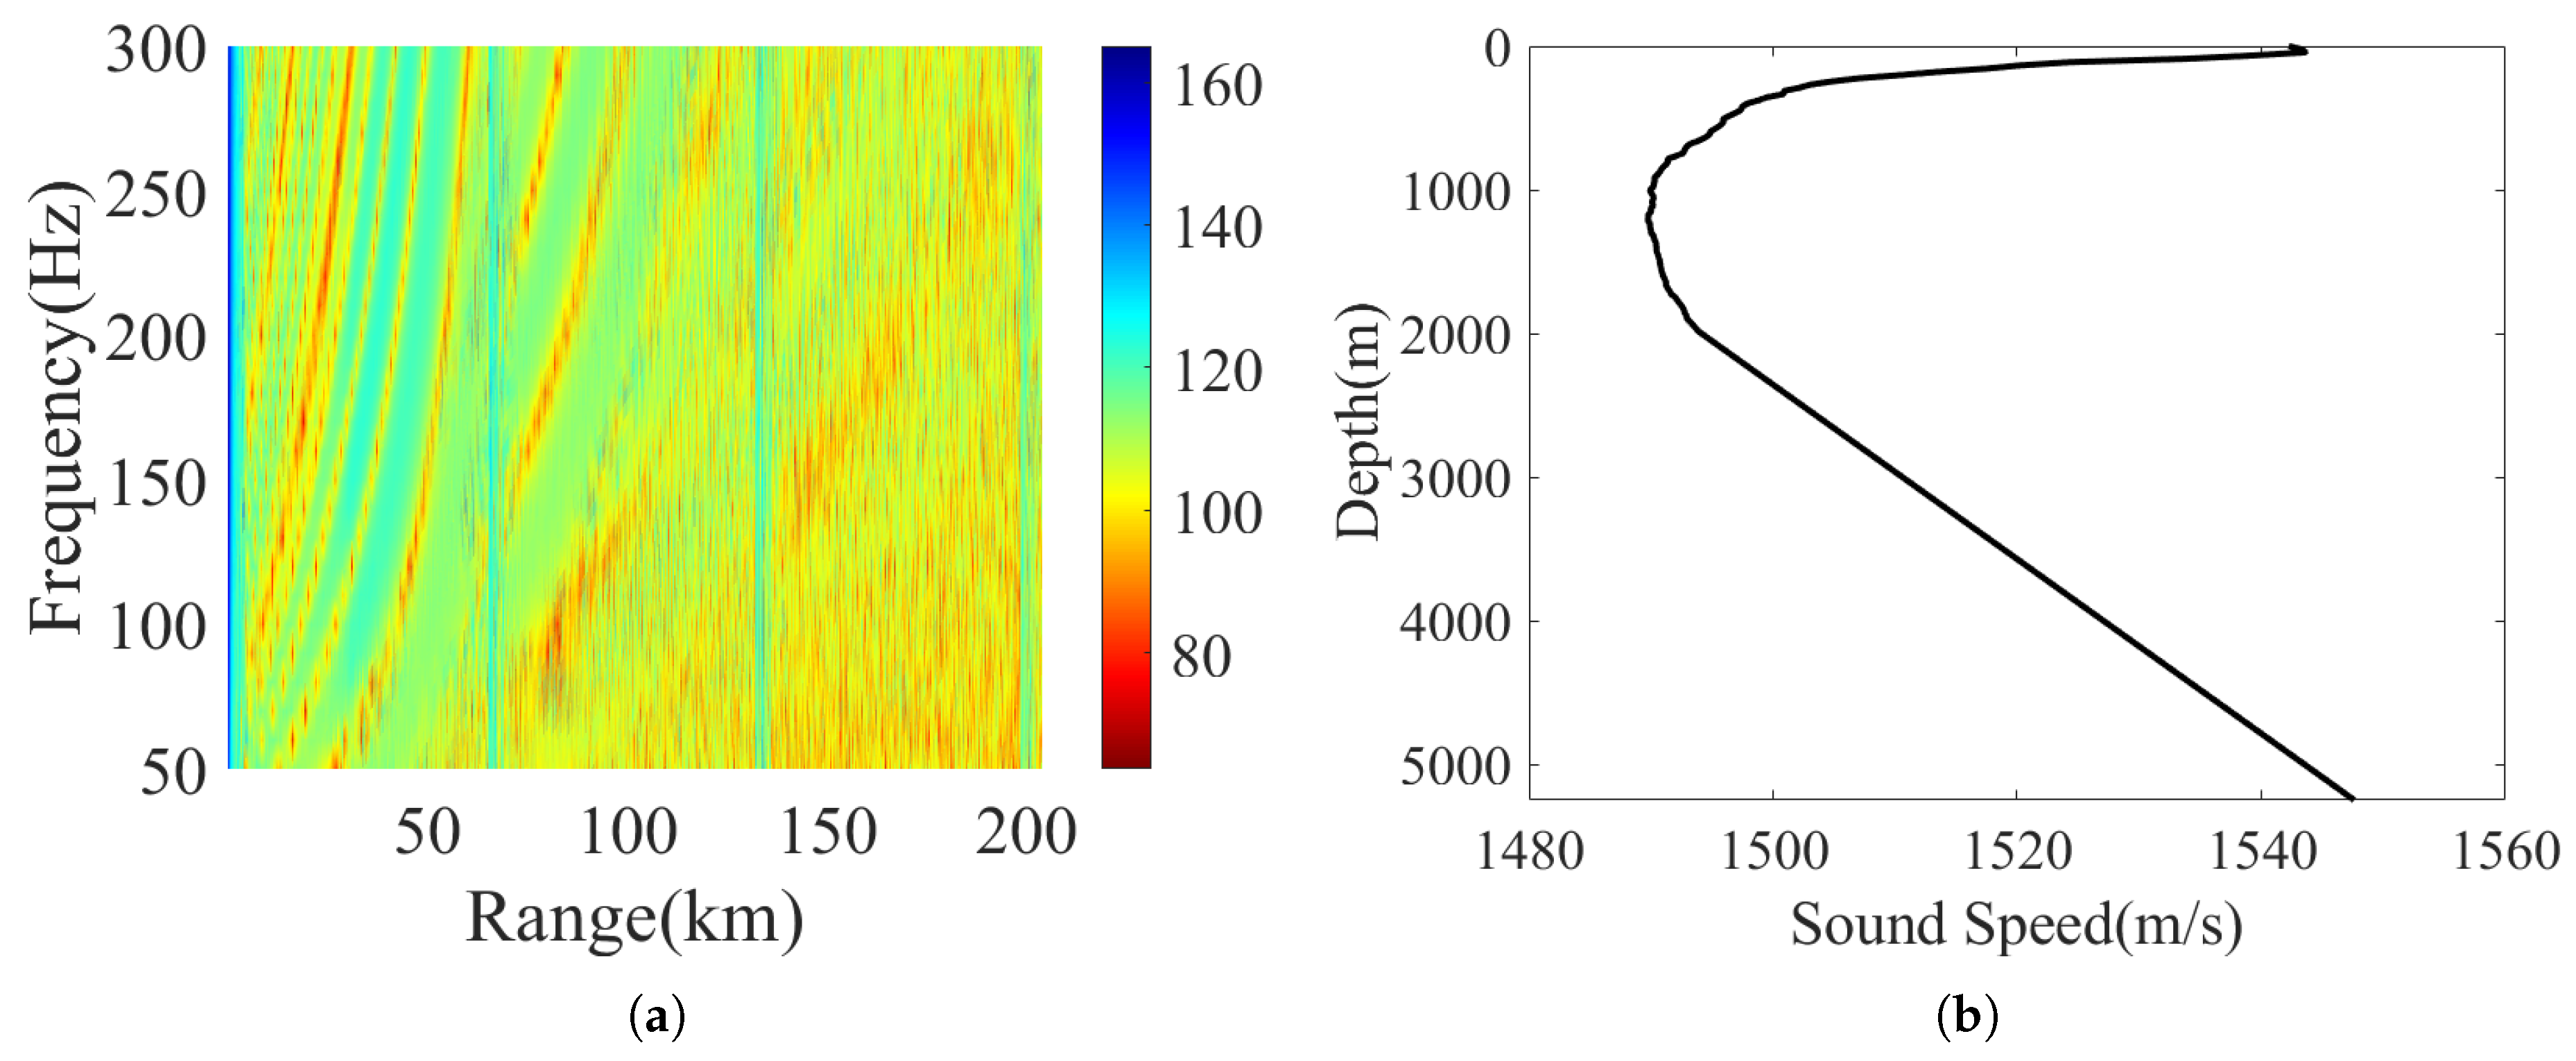
Figure 5b. In the test environment, the sound source depth ranges from 1 m to 200 m with an interval of 0.25 m; the sound source distance ranges from 1 km to 200 km with an interval of 0.2 km. The receiving depth is fixed at 100 m.
Figure 20 shows the two dimensional transmission loss and the division of the sound field region. Within the receiving range of 200 km, there are a total of three convergence zones (with positions, respectively, at 63.8 km, 127.6 km and 191.4 km), three shadow zones, and one direct arrival zone.
As shown in
Figure 21, this model behaves well in this long-range situation. The final range MSE is 0.0609 km and the depth MSE is 0.074 m. Meanwhile, the range MAPE is
and depth MAPE is 0.297%. It can be seen from the figure that the training effect of this network structure as a whole is pretty good.
As shown in
Figure 22, there are obvious bright spots at the convergence zone range (i.e., 63.8 km, 127.6 km, 191.4 km), which means the majority of higher errors occur when the sound source is located at the convergence zone. This is because in this relatively complex region, the sound ray convergence effect is significant. A large number of sound rays interact with each other, making it impossible to obtain the actual interference period or structure. On the other hand, the received signal energy in the convergence zone is quite strong, smoothing out the energy differences across different ranges and frequencies, failing to provide corresponding characteristic quantities. The model performs well in the first and second shadow zone. In the direct arrival zone, the error is still relatively large due to the short range. Through this test, the network structure originally applicable to the deep-sea shadow zone range is extended to different deep-sea areas.


