Article

Constraint-Aware and User-Specific Product Design: A Machine Learning Framework for User-Centered Optimization

Department of Industrial Design, School of Mechanical Engineering and Automation, Northeastern University, Shenyang 110819, China
Electronics 2025, 14(15), 2962; https://doi.org/10.3390/electronics14152962
Submission received: 24 June 2025 / Revised: 19 July 2025 / Accepted: 23 July 2025 / Published: 24 July 2025
(This article belongs to the Special Issue User-Centered Interaction Design: Latest Advances and Prospects)

Abstract

This study presents a data-driven, multi-objective optimization framework for user-centric product form design, integrating affective response modeling with coupled constraint satisfaction. Initially, morphological analysis and aesthetic evaluation are employed to extract critical design elements, while cluster analysis segments users based on preference data. Dominance-based rough set theory is then applied to derive group-specific affective patterns, which are subsequently modeled using Genetic Algorithm-optimized Backpropagation Neural Networks (GA-BPNN). The framework leverages Non-dominated Sorting Genetic Algorithm II (NSGA-II) to generate Pareto-optimal solutions, balancing aesthetic preferences and engineering constraints across user groups. A case study on SUV form design validates the proposed methodology, demonstrating its efficacy in delivering optimal, user-group-targeted design solutions while accommodating individual variability and constraint interdependencies. The results highlight the framework’s potential as a generalizable approach for emotion-aware, constraint-compliant product design.

1. Introduction

In today’s highly competitive marketplace, product differentiation has become increasingly challenging as functionally equivalent offerings proliferate [1,2,3]. This market reality has elevated the importance of affective design—the systematic incorporation of users’ emotional responses into product development—as a critical competitive strategy [4,5,6,7]. Kansei engineering (also termed affective engineering) has emerged as a robust methodology at the intersection of ergonomics and consumer psychology, enabling the quantitative translation of subjective user perceptions and emotional responses into concrete design parameters [8,9,10,11,12]. Building on this foundation, significant research efforts have been devoted to developing optimization frameworks that leverage Kansei principles for enhanced form design [13,14,15,16,17,18], addressing the growing need for emotionally resonant products in homogeneous markets.

1.1. Individual Differences in Users’ Affective Responses

A fundamental challenge in Kansei engineering lies in establishing robust correlations between affective responses and specific design parameters, necessitating comprehensive consumer affect data acquisition. While significant research efforts have focused on developing predictive models of user preferences, the critical issue of inter-user variability in affective responses remains largely unaddressed [19,20]. Current methodologies predominantly employ aggregate-level analysis, effectively targeting a hypothetical ‘average user’—an approach whose limitations have been empirically demonstrated by Diego-Mas and Alcaide-Marzal (2016) [21]. Their work highlights the significant risk of design-user mismatch when individual differences in affective perception are not properly accounted for in the design optimization process.
The phenomenon of individual differences in affective response manifests as significant variations in how users perceive and evaluate design attributes [22]. This inherent subjectivity renders traditional approaches—which employ fixed Kansei lexicons and aggregate response scores across heterogeneous user populations—methodologically inadequate. Recent methodological advances have consequently shifted toward preference-based user segmentation, where clustering algorithms identify homogeneous user groups with similar affective profiles [20,23,24]. This paradigm enables the development of tailored design solutions that account for the spectrum of user preferences rather than targeting a non-representative average.
This study advances a novel user segmentation framework that leverages both personality traits and group commonality to address individual differences in affective response. When users demonstrate statistically significant convergence in product domain evaluations (p < 0.05), we posit homologous Kansei processing mechanisms [9]. Our methodology enables: (1) identification of distinct user cohorts through preference pattern analysis, (2) development of group-specific affective response models, and (3) implementation of differentiated design strategies. This approach offers both theoretical and practical advantages—it not only provides insights into user psychology but also yields substantial cost efficiencies in product development through targeted design optimization. The resulting mathematical models for each user segment facilitate data-driven design decisions while maintaining manufacturing scalability.

1.2. Coupled Constraints for Product Form Optimization Design

A critical observation in affective design reveals significant overlap between aesthetic design elements and engineering constraints [25]. While user preferences often reflect idealized, unbounded material expectations, the pursuit of individual parameter optimization frequently leads to systemic imbalances in the overall design solution [7]. This phenomenon, known as the local optimum paradox, underscores the necessity of constraint-aware design methodologies. The fundamental role of constraints in maintaining design coherence and manufacturability has been extensively documented in the literature [26], particularly in resolving tensions between subjective user preferences and objective engineering requirements.
Previous research has employed Quality Function Deployment (QFD) methodologies to establish optimal engineering target values [27]. Hsiao and Tsai (2005) [15] operationalized this approach by defining 15 form parameters and five key features within validated design configurations, constrained by applicable optimization ranges. Building on this foundation, Jiang et al. [25] formalized three constraint typologies for multi-objective optimization models: (1) design element data types, (2) parameter value ranges, and (3) technical inter-element correlations. Complementary empirical work by Guo et al. [18] derived continuous variable ranges through systematic analysis of 51 product specimens, incorporating both network parameter extraction and manual measurement data. Further constraining the design space, Guo et al. [28] distilled ten critical decision elements from industrial design expertise, establishing a robust framework for multi-objective optimization in product development.
While existing studies have predominantly focused on engineering requirements (Table 1), affective product design fundamentally depends on prior usability considerations [29]. Current practice typically decouples affective and engineering design into discrete phases, resulting in suboptimal customer satisfaction. Compounding this issue, emerging research demonstrates that coupled design elements significantly influence affective responses [28,30]. A critical gap persists in the literature: no unified methodology concurrently addresses (1) design element coupling, (2) usability requirements, and (3) engineering constraints during product development. This study bridges this gap by proposing an integrated framework that simultaneously optimizes affective design, element coupling, and multi-domain requirements. The framework specifically incorporates usability metrics focused on human–product interaction dynamics, anthropometric compatibility, and performance ergonomics—ensuring designs satisfy both emotional and functional imperatives.

1.3. The Current Research

This study presents a multi-objective optimization framework for product form design that simultaneously addresses coupled constraints (e.g., engineering, usability) and user preference heterogeneity. Our key contribution is a data-driven methodology integrating Kansei engineering and dominance-based rough set theory to derive group-specific affective models, which are then optimized under constraints via NSGA-II. The paper is structured as follows: Section 2 reviews foundational concepts in affective engineering and rough set-based decision modeling. Section 3 details our proposed framework, including user clustering, affective response modeling (GA-BPNN), and constrained Pareto optimization. Section 4 validates the approach through an SUV form design case study, demonstrating its efficacy in balancing aesthetic preferences and technical feasibility. Finally, Section 5 discusses implications, limitations, and future research directions.

2. Theoretical Background

2.1. Introduction to the Optimization of Product Form Design

Within the triad of product appearance attributes (form, color, material), form constitutes the most complex and cognitively demanding dimension to quantify. Kansei-driven form design methodology initiates with two critical processes: (1) morphological decomposition of products into constituent design elements (typically implemented through morphological analysis [31]), and (2) affective response characterization using domain-specific Kansei lexicons. These lexicons capture multidimensional perceptual attributes, enabling the establishment of statistically robust correlations between design parameters and elicited emotional responses. The resultant design-affect mapping forms the foundation for data-driven form optimization.
User affective responses to products inherently constitute a multidimensional evaluation space, necessitating multi-objective optimization (MOO) frameworks for comprehensive analysis. Prior research has predominantly simplified these MOO problems through linear weighted aggregation [4,15] or goal programming [32], effectively reducing them to single-objective formulations. However, advances in evolutionary computation, particularly second-generation MOEAs like NSGA-II [33], now enable direct generation of Pareto-optimal solution sets. This paradigm shift empowers designers to (1) preserve the inherent trade-offs between competing affective dimensions, and (2) facilitate preference-driven selection of optimal designs from the Pareto frontier based on stakeholder priorities.

2.2. Introduction to Dominance-Based Rough Sets

Rough set theory [34] is a mathematical tool proposed by Pawlak to characterize incompleteness and uncertainty [16]. As in classical rough sets, an information table is represented by a four-tuple, i.e., S = U , Q , V , f , where U is a finite set of observations; Q = q 1 , q 2 , q m is a finite set of attributes; V q is the domain of the attribute q ; V = V q ; and f : U × Q V , q is a total function such that f ( x , q ) V q for each q Q , x U , called the information function. The commonly used notations and their corresponding meanings are detailed in Table 2.
Let D = d and it makes a partition of U into a finite number of classes C l = C l t , t T , where T = { 1 , , n } . The classes in C l are ordered in ascending sequence of class indices: for all r , s T and r > s , the observations contained in the class C l r are more preferred than those contained in the class C l S . The upward union and the downward union of a class C l t are defined as:
C l t = s t C l s t = 1 , 2 , , n
Let ¯ q be a weak preference relation on U representing the preference on a set of observations with respect to the condition attribute q , then x ¯ q y means “ x is at least as good as y with respect to the condition attribute q ”. For any P C , it is said that x P-dominates y (denoted as x D p y ) if x D p y for all P .
Given P C and x U , the granules of knowledge used in the dominance-based rough sets for the approximation of the unions C l t and C l t are the open sets defined by the dominance cones with respect to x , namely P-dominating set, which means a set of objects dominating x ,
D P + ( x ) = y U : y D p x
and P-dominated set, which means a set of objects dominated by x ,
D P ( x ) = y U : x D p y
Mathematically, the collection of all objects that can be classified into C l t without any ambiguity constitutes the P-lower approximation of C l t , which is denoted by P _ C l t , and the collection of objects that can be possibly classified into C l t constitutes the P-upper approximation of C l t , which is denoted by P ¯ C l t as follows:
P _ C l t = x U : D p + x C l t t = 1 , , n
P ¯ C l t = x U : D p x C l t = x C l t D p + x t = 1 , , n
Analogously, the P-lower approximation and P-upper approximation of C l t can be defined as follows:
P _ C l t = x U : D p x C l t t = 1 , , n
P ¯ C l t = x U : D p + x C l t = x C l t D p x t = 1 , , n
All the objects belonging to both C l t and C l t with some ambiguities constitute the P-boundary of C l t and C l t , denoted as B n p C l t and B n p C l t , respectively:
B n P C l t = P ¯ C l t P _ C l t t = 1 , , n
Taking the ambiguity of partition into consideration, the quality of approximation initiated by criteria from P C is defined by the ratio
γ P C l = U t 2 , , n B n P C l t U = U t 1 , , n 1 B n P C l t U
where ‖ denotes the cardinality of a set (i.e., the total number of objects included in a set). This ratio expresses the proportion of P-correctly classified objects.

3. Proposed Approach

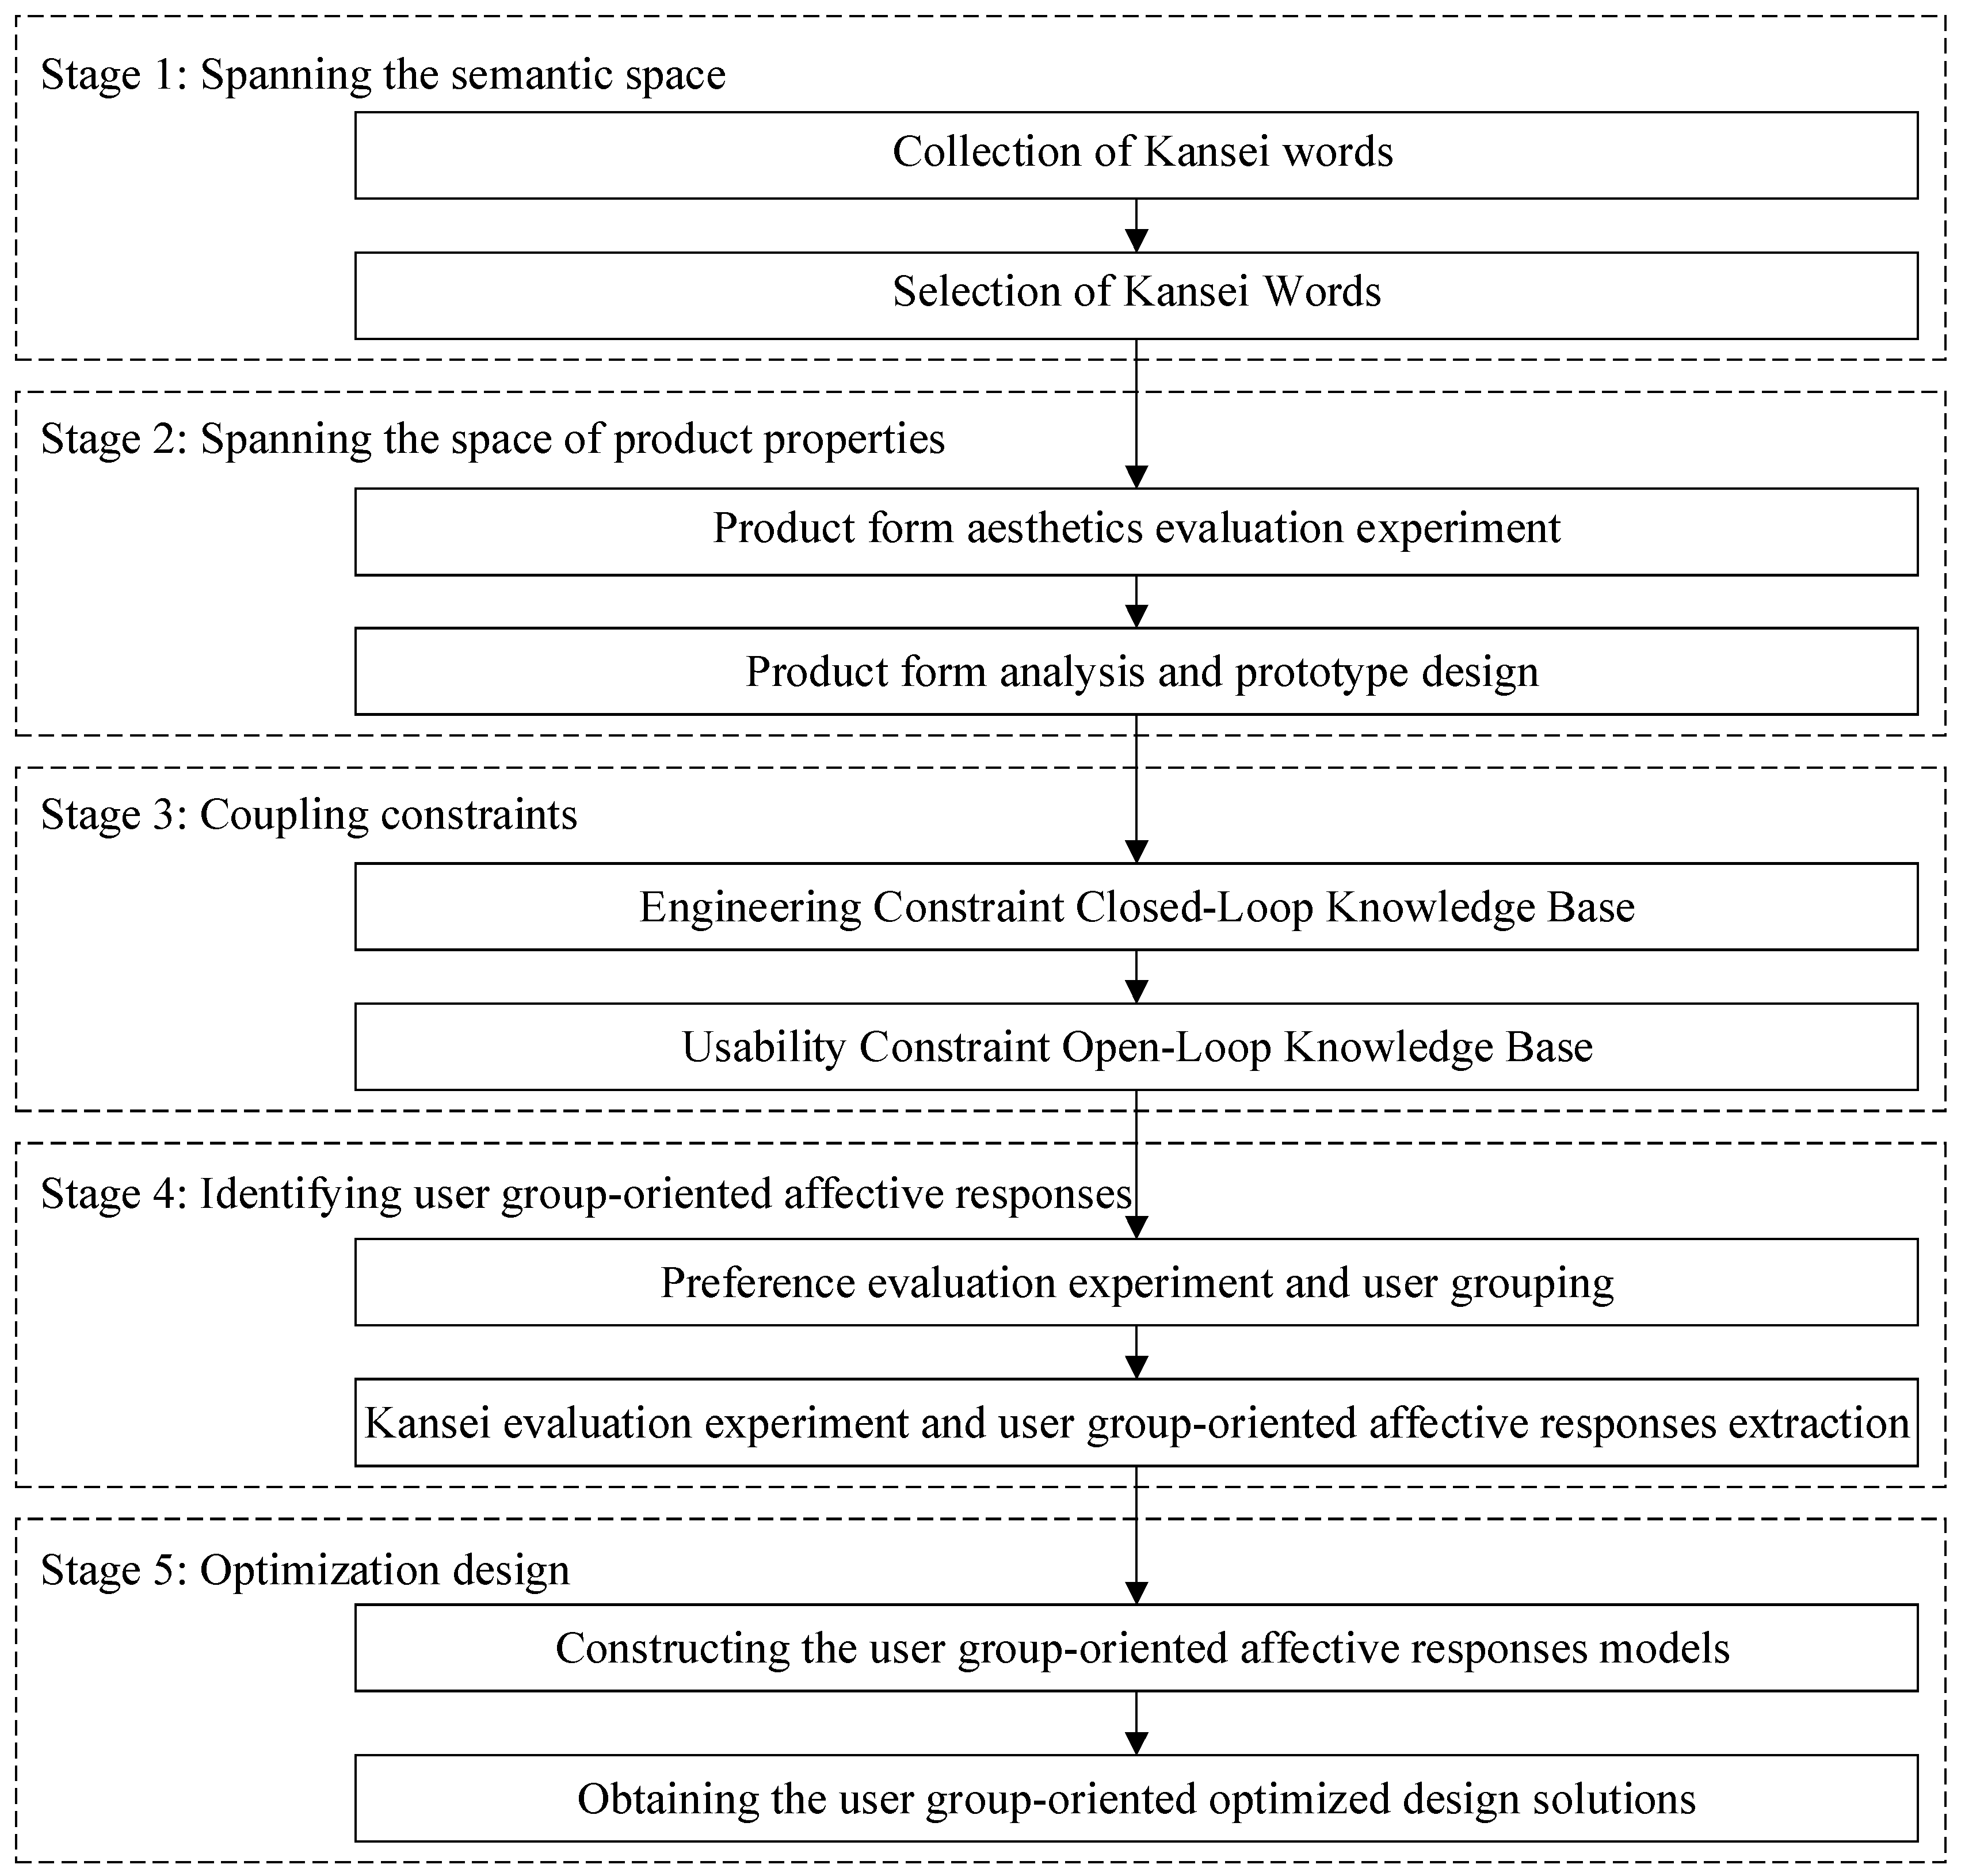
This study presents a systematic framework for product form optimization that simultaneously addresses two critical challenges in affective design: (1) inter-user variability in emotional responses, and (2) coupled constraint satisfaction. As illustrated in Figure 1, our methodology employs a five-stage, domain-agnostic workflow integrating (i) preference-based user segmentation, (ii) constraint-aware design parameterization, (iii) data-driven affective modeling, (iv) multi-objective evolutionary optimization, and (v) solution space refinement. The proposed approach provides designers with a generalizable pipeline for resolving the inherent tension between aesthetic preferences and engineering requirements while accounting for population heterogeneity.

3.1. Spanning the Semantic Space

The Kansei word selection process employs a rigorous three-phase methodology to capture comprehensive affective dimensions. First, an exhaustive lexical compilation ensures complete coverage of relevant adjectives describing the target product domain. Subsequently, domain-specific Kansei image word pairs are systematically constructed through semantic alignment with research objectives. Finally, the affinity diagram technique [35] is applied to consolidate lexical redundancies, yielding a refined set of psychometrically valid descriptors for affective assessment. This structured approach balances linguistic comprehensiveness with methodological parsimony while maintaining construct validity.

3.2. Spanning the Space of Product Properties

Product property space exploration requires systematic selection of domain-representative specimens for aesthetic evaluation. Designers must (1) curate a sufficiently diverse product sample set to capture the full spectrum of Kansei design elements and (2) develop evaluation prototypes that preserve these elemental characteristics. Subsequently, affective response assessment employs structured questionnaires pairing these prototypes with validated Kansei lexicons, enabling quantitative identification of user group-specific emotional profiles. This methodological approach ensures comprehensive coverage of both design variability and perceptual dimensionality within the target product domain.

3.2.1. Product Form Aesthetics Evaluation Experiment

Prior research has predominantly relied on designer intuition or the KJ method [36] to identify representative product forms, which are approaches adopted to minimize participant cognitive load and streamline experimental procedures. However, such experience-dependent methodologies demonstrate limited scalability in consumer-driven markets, often failing to capture nuanced user preferences. To address this limitation, the present study implements a systematic aesthetic evaluation protocol to objectively identify representative form factors. This data-driven approach mitigates the inherent biases and reliability risks associated with expert-dependent form selection processes, while maintaining experimental efficiency through standardized assessment metrics.
This study employs a two-stage expert evaluation protocol to identify representative product forms. First, industrial design specialists conduct systematic aesthetic assessments of preliminary samples using standardized evaluation criteria. The resulting aesthetic metrics then undergo hierarchical cluster analysis with within-groups linkage aggregation and Euclidean distance measurement. Hierarchical clustering was selected primarily due to its ability to generate a nested hierarchy of clusters, which aligns with the inherently hierarchical structure of our dataset wherein objects exhibit natural groupings at multiple scales of granularity [18,28]. This method also avoids the need for predefining the number of clusters, a critical advantage given the ambiguity in the optimal cluster count for our domain-specific data. To ensure both representativeness and innovation diversity, the final product selection integrates quantitative clustering outcomes with expert panel recommendations, prioritizing novel design exemplars within each identified cluster. This hybrid approach balances empirical rigor with professional design judgment, optimizing the selection of form prototypes for subsequent affective response studies.

3.2.2. Product Form Analysis and Prototype Design

Product form decomposition through morphological analysis [18] enables systematic identification of critical Kansei design elements that significantly influence user affective responses. This methodology (1) deconstructs representative products into constituent form parameters, thereby constructing a comprehensive design property space, and (2) employs orthogonal array testing to generate optimized prototype configurations through controlled element coupling. The resulting parametric framework not only isolates dominant perceptual drivers but also facilitates efficient exploration of the combinatorial design space while maintaining statistical validity.

3.3. Coupled Constraints

During product form synthesis, the combinatorial coupling of design elements generates diverse morphological solutions. However, naive aggregation of individually optimized elements often induces constraint conflicts, leading to suboptimal system performance (see Figure 2). To address this, our framework formalizes two constraint classes for affective-driven optimization: (1) static engineering constraints: encoded as immutable design rules within a closed-loop knowledge base, ensuring technical feasibility; (2) dynamic usability constraints: implemented through an adaptive knowledge base that evolves human–product interaction data, prioritizing ergonomic performance and user experience metrics. This dual-constraint architecture mediates between deterministic engineering requirements and emergent usability patterns while preventing combinatorial conflicts during form generation.
This study distinguishes between two fundamental constraint classes governing product form design: engineering constraints and usability constraints. Engineering constraints, derived from structural integrity requirements rather than rigorous computational analysis, primarily ensure non-interference conditions and kinematic compatibility while enforcing compliance with national standards and interchangeability protocols. These constraints form a closed-loop system that guarantees conflict-free component coupling during assembly. Complementing these, usability constraints emerge from human–product interaction requirements, incorporating anthropometric data and ergonomic performance metrics to guide design element integration. Unlike their engineering counterparts, usability constraints constitute an open-loop knowledge framework that dynamically assimilates designer heuristics, evolving fashion trends, and user-specific requirements, thereby enabling continuous adaptation to emerging design paradigms while maintaining functional coherence.

3.4. Identifying User Group-Oriented Affective Responses

This investigation advances a novel framework for identifying user group-specific affective responses, operating within the theoretical continuum bounded by homogeneous ‘average user’ models and fully individualized heterogeneous representations. The proposed methodology accounts for the multidimensional nature of affective perception, where each user segment exhibits a unique amalgamation of psychological idiosyncrasies and shared cognitive patterns. By characterizing these group-wise affective signatures through dominance-based rough set analysis, the approach enables more precise design guidance that transcends conventional one-size-fits-all paradigms while remaining computationally tractable compared to purely personalized models. The resulting affective profiles capture essential perceptual schemata that directly inform product form optimization, effectively bridging the gap between mass production constraints and differentiated user experience requirements.

3.4.1. Preference Evaluation Experiment and User Grouping

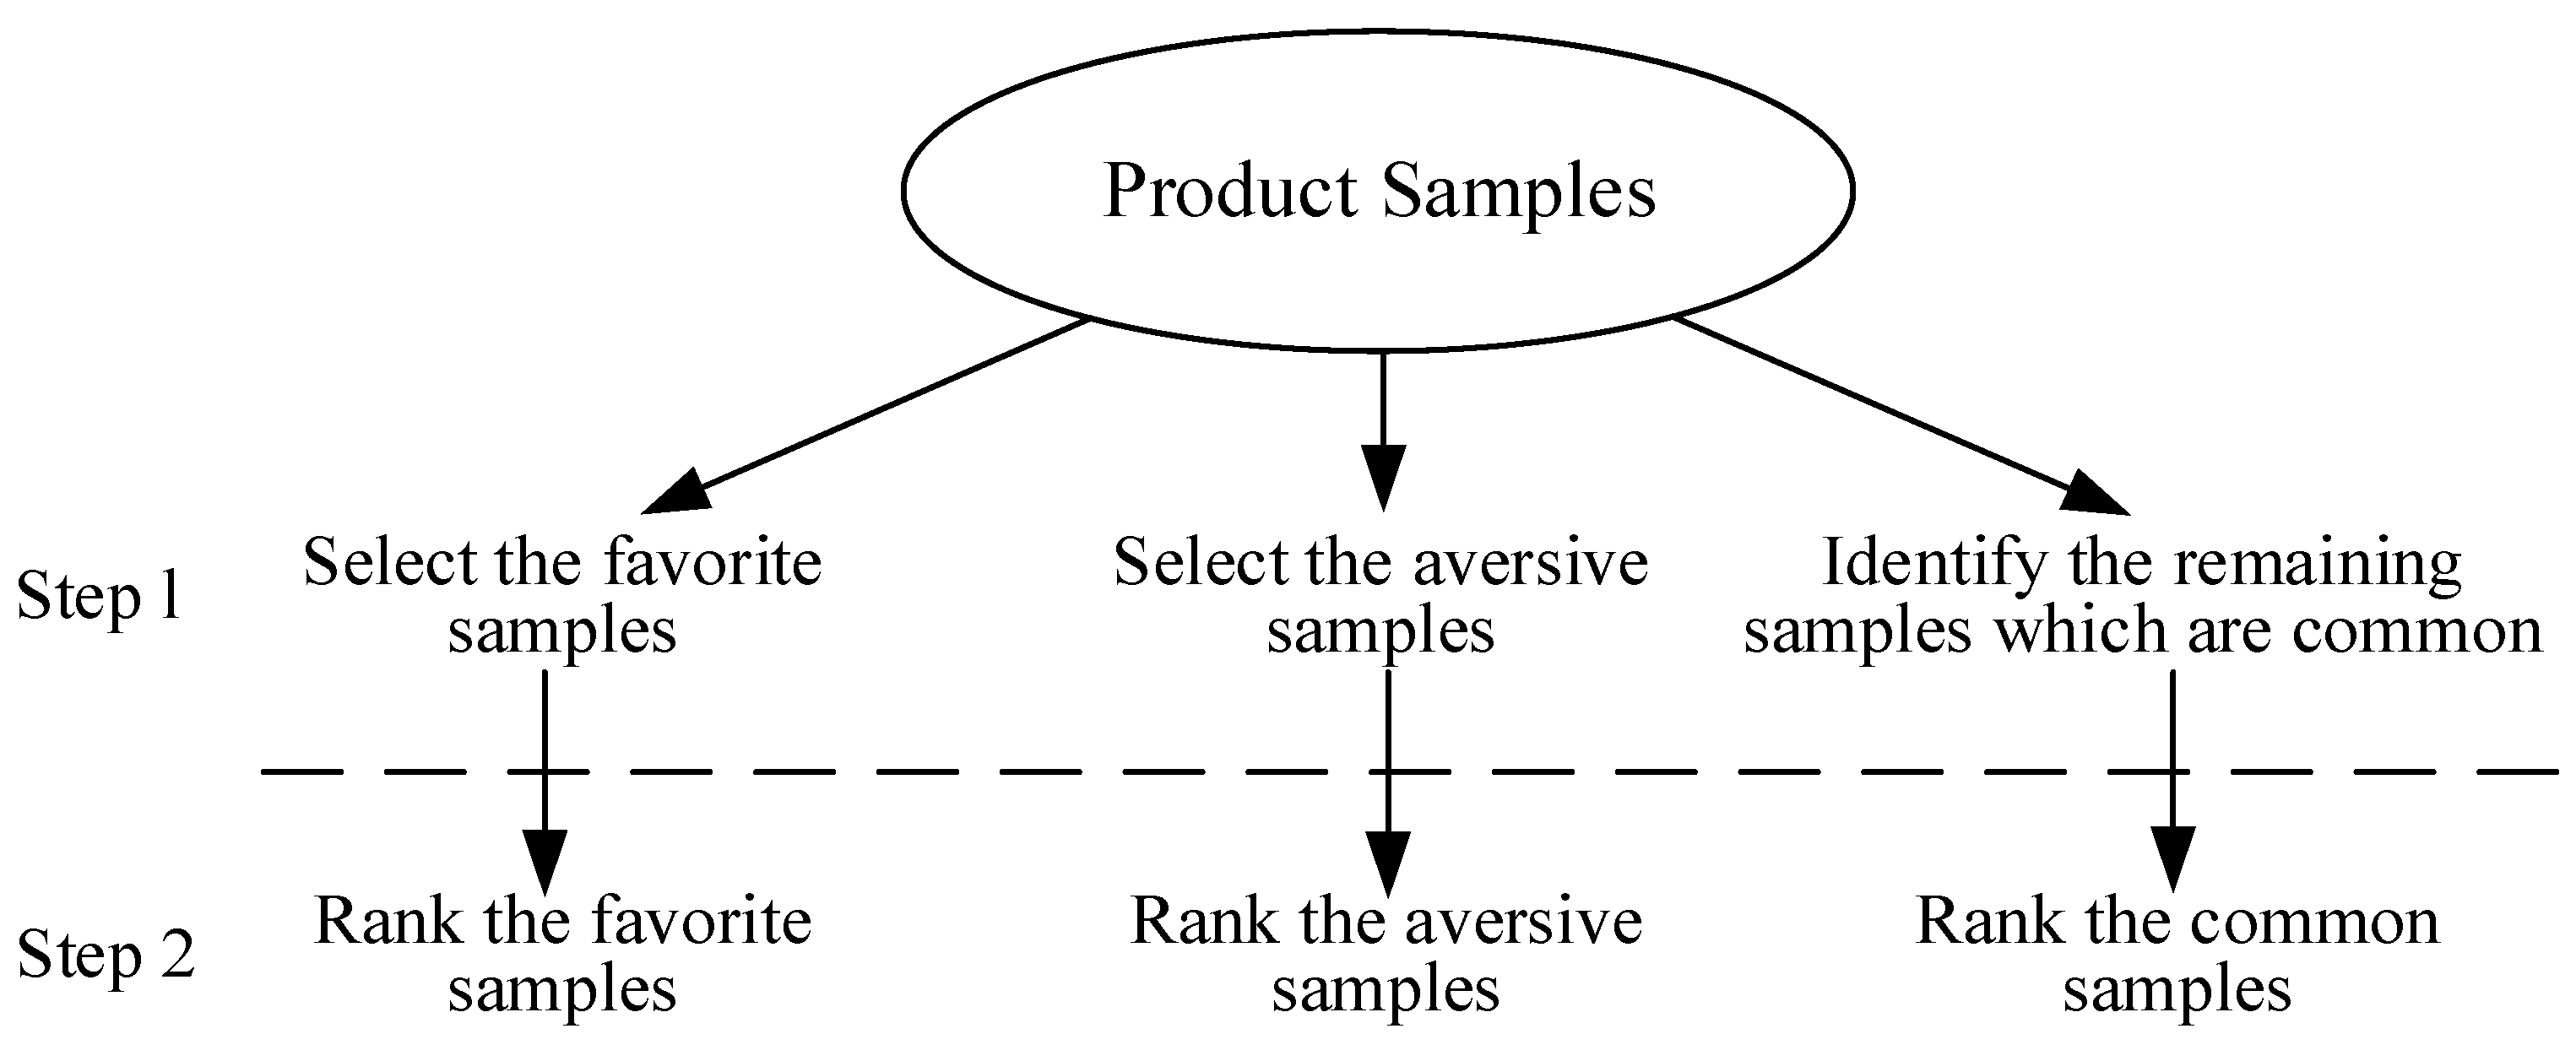
This study employed a two-phase Kansei preference assessment protocol to capture nuanced user responses to product forms. The initial screening phase required participants to categorically sort samples into three distinct affective classifications: ‘favorite’ (visually appealing and ownership desirable at first impression), ‘aversive’ (actively undesirable), and ‘common’ (neutral acceptability without strong preference). This tripartite classification ensured robust preference discrimination prior to granular evaluation. The subsequent ranking phase refined these classifications by establishing continuous preference gradients within each category, transforming categorical judgments into ordinally scaled data. As illustrated in Figure 3, this sequential approach combines the ecological validity of rapid initial impressions with the discriminative power of forced-choice comparative ranking, thereby optimizing both experimental efficiency and psychometric reliability while mitigating cognitive fatigue effects common in extended product evaluation tasks.
The preference data were subjected to hierarchical cluster analysis in SPSS 22.0 using within-groups linkage aggregation and Euclidean distance metrics to classify participants into homogeneous cohorts based on perceptual similarity. The number of clusters were selected by using the dendrogram cut-off point based on Ward’s method, with a linkage threshold set at a normalized distance of 0.6 to balance within-cluster homogeneity and between-cluster separation. Outliers were identified and removed using a z-score threshold of ±3 for preference ratings, affecting less than 2% of the dataset. To ensure robust group construction and enhance affective response prediction accuracy, clustering thresholds were calibrated to meet three critical criteria: (1) demographic and psychographic consistency within clusters, (2) high intra-group concordance in product form preferences, and (3) statistically significant (p < 0.05) inter-group differentiation (one-way ANOVA test). This tripartite validation framework guarantees that resultant user segments exhibit meaningful homogeneity while preserving discriminative power for design optimization purposes.

3.4.2. Kansei Evaluation Experiment and User Group-Oriented Affective Response Extraction

A follow-up Semantic Differential (SD) [37] questionnaire was administered to capture group-specific Kansei evaluation metrics, systematically quantifying affective perceptions across predefined bipolar adjective pairs. The resultant dataset was processed to construct comprehensive Kansei profiles for each user segment, enabling granular analysis of inter-group perceptual differences and intra-group response patterns. This phase transformed qualitative affective responses into empirically measurable design parameters, establishing a robust foundation for data-driven form optimization aligned with distinct user group preferences.
Within the Kansei information matrix, decision attributes (preference scores) are ordinally scaled, with higher values indicating stronger consumer affinity. The ordinal structure of condition attributes (Kansei image ratings) is analytically critical, as deviations from expected dominance relations reveal inconsistencies in perceptual logic [38]. To operationalize this principle, we introduce category score, a derived metric quantifying the monotonic relationship between Kansei word intensity levels and their corresponding preference ranks, enabling systematic identification of attribute value hierarchies while preserving the ordinal integrity of consumer evaluations. The category score is defined as follows:
S c o r e k k C = 1 N D k P
where D K ( P ) is the decision attribute value of an object in which the condition attribute “ k ” takes the category value “ k C ” and N is the total number of such objects in the Kansei information table. Thus, a comparison among the category scores attained can possibly reveal the semantic correlations of the condition and decision parts of the Kansei information table. As a result, the dominance principle can be established.
The quality of approximation γ K and γ K k of partitions, respectively, are calculated by criteria set K and K k based on Equation (11).
Equation (13) is used to calculate the significance of each Kansei feature k .
S I G k = γ K γ K k .
The weights of each k are calculated using normalization processing by
w k = S I G k k K S I G k
In this investigation, we prioritize the identification of high-weight Kansei words specific to each user cohort, recognizing their pronounced influence on user satisfaction metrics. These terms, strategically selected to serve as proxies for the group-specific affective responses, effectively encapsulate the emotional dynamics unique to each user segment, thereby facilitating a nuanced analysis of user engagement within the research framework.

3.5. Optimization Design

This study addresses the inherent multi-objective optimization challenge in affective product design by developing a hybrid machine learning framework that synergistically combines Genetic Algorithm-optimized Backpropagation Neural Networks (GA-BPNN) and Non-dominated Sorting Genetic Algorithm II (NSGA-II). The GA-BPNN architecture leverages evolutionary computation to optimize network initialization parameters [39], enabling robust modeling of the complex nonlinear relationships between Kansei design elements and group-specific affective responses [40,41,42]. The NSGA-II component subsequently explores the design solution space to identify Pareto-optimal configurations that simultaneously satisfy coupled engineering constraints and user group affective requirements. This iterative optimization process continues until convergence criteria are met, ensuring the final design solution achieves optimal balance between emotional appeal and technical feasibility while accommodating heterogeneous user preferences.

4. Case Study

Sport utility vehicles (SUVs) represent a mature product category where conventional design approaches often fail to address evolving user affective needs, necessitating innovative methodologies for form optimization. This study employs SUV design as an empirical validation case, leveraging its complex form characteristics and well-established market segmentation to demonstrate the efficacy of our proposed framework in balancing aesthetic innovation with engineering constraints while capturing heterogeneous user preferences.

4.1. Spanning the Semantic Space

An initial lexicon of 56 bipolar adjective pairs was systematically curated from domain-specific literature, automotive publications, and prior Kansei engineering studies, followed by a rigorous screening process that eliminated lexemes lacking conceptual clarity or relevance to SUV form characteristics, ultimately yielding 23 validated semantic differential pairs for subsequent affective evaluation.
A cohort of thirty industrial design experts (21 males, 9 females; mean age = 25.5 years) with specialized training in affective design methodologies participated in structured interviews employing the affinity diagram technique to consolidate semantically related Kansei terms into conceptually coherent clusters, from which representative bipolar adjective pairs were systematically selected to construct the final semantic differential space (Figure 4), establishing both the dimensional framework for affective evaluation and the foundational criteria for subsequent Kansei assessment protocols. The high-weight Kansei terms per user group (with SIG(k) values) can be seen in Table 3.
The study compiled an initial repository of 96 SUV models, which was subsequently refined through similarity analysis to yield 32 morphologically distinct specimens constituting the final evaluation set (Figure 5). Forty-two industrial design experts (gender-balanced cohort, mean age = 35.2 years) conducted systematic aesthetic assessments using a 7-point Likert scale, following standardized training on core aesthetic principles including symmetry, proportion, and homogeneity [43] to ensure evaluation consistency. The resultant aesthetic indices, derived from aggregated expert ratings (Table 4), served as quantitative benchmarks for subsequent form analysis and optimization.

4.2. Spanning the Space of Product Properties

Morphological decomposition of representative SUV forms yielded ten critical Kansei design parameters: headlight configuration (X1), hub design (X2), body contour geometry (X3), radiator grille pattern (X4), fog light styling (X5), waistline articulation (X6), hood sculpting (X7), and RGB color coordinates (X8–X10). These parameters were systematically combined using an orthogonal array experimental design in SPSS, generating 54 distinct prototype configurations that were virtually assembled in SolidWorks and photorealistically rendered in KeyShot (Figure 6), establishing a controlled yet diverse design space for subsequent affective evaluation while maintaining manufacturing feasibility through proper component coupling.

4.3. Coupled Constraints

This study operationalizes SUV design through two distinct parameter classes: form attributes (X1–X7) as categorical variables encoded as discrete integer values and color coordinates (X8–X10) as continuous real-number variables, with their respective value domains and engineering constraints detailed in Table 5 and Table 6. The color design variables X8 (Red), X9 (Green), and X10 (Blue) are constrained to the standard 8-bit integer range [0,255], corresponding to RGB color space specifications. The constraint framework primarily governs data typing requirements, enforcing type integrity across seven morphological design elements (headlight, hub, body contour, radiator grille, fog lights, waistline, and hood) while accommodating continuous color space parameters in the RGB spectrum, thereby maintaining both design flexibility and manufacturability compliance throughout the optimization process.

4.4. Identifying User Group-Oriented Affective Responses

A cohort of 348 SUV-experienced participants (186 male, 162 female) evaluated the 32 representative product specimens identified in Section 4.2, with their preference data subjected to hierarchical cluster analysis in SPSS to segment the population into three distinct user groups (I–III) based on similarity patterns within the preference score matrix, ensuring statistically validated and demographically balanced cohorts for subsequent affective modeling.
The 32 representative samples were classified into three affective categories—Favorite, Common, and Aversive—based on modal preference rankings within each user group’s evaluation data, enabling concise representation of group-specific preferences through prototypical exemplars for each classification, with complete affective response profiles systematically tabulated in Table 7 to facilitate comparative analysis across user segments.

4.5. Optimization Design

4.5.1. Constructing the User Group-Oriented Affective Response Models

The GA-BPNN framework implements a four-phase optimization pipeline: (1) BPNN architecture configuration, (2) GA-driven weight and threshold optimization, (3) network training, and (4) predictive validation. This study trained separate models for each user cohort using the ten design parameters (X1–X10) from 54 prototypes as input vectors and their corresponding group-specific affective responses as target outputs, thereby establishing nonlinear mappings between form features and perceptual preferences while maintaining computational efficiency through evolutionary parameter initialization.
Research has demonstrated that neural networks with a three-layer architecture can approximate any arbitrary function with arbitrarily high precision [44]. Within such networks, comprising an input layer, a hidden layer, and an output layer, an approximate relationship exists among the number of neurons in the hidden layer (S1), the input layer (R), and the output layer (S2), facilitating the network’s capacity to model complex mappings effectively [18,44]:
S 1 = R + S 2 2
In this investigation, two Kansei words were identified to encapsulate the affective responses of each user group, with ten key Kansei design elements delineated for each group. Consequently, the architecture of the Genetic Algorithm-optimized Backpropagation Neural Network (GA-BPNN), as determined by Equation (15), was configured with a 10-6-2 structure, reflecting the input, hidden, and output layers, respectively. The genetic algorithm, implemented via the GOAT toolbox in MATLAB 2024b, was employed to optimize the BPNN, enabling the derivation of association rules that elucidate the relationships between the key Kansei design elements and the affective responses across the three user groups.
Following previous studies [44], for the genetic algorithm (GA) integrated with the backpropagation neural network (GA-BPNN), we used two-point crossover for recombination, where two random crossover points were selected, and gene segments between these points were exchanged between parent chromosomes to maintain genetic diversity while preserving beneficial allele combinations. Mutation was implemented via uniform mutation, where each gene in the chromosome had an equal probability (set to 0.01) of being randomly replaced with a new value within the predefined search space, preventing premature convergence. The exact steps of GA-BPNN were as follows: (1) initialization: generate a population of 100 chromosomes, each encoding BPNN weights and biases as real-valued genes; (2) fitness evaluation: assess each chromosome by training the BPNN with the encoded parameters and using mean squared error (MSE) on the validation set as the fitness score; (3) selection: apply tournament selection (tournament size = 3) to select parent chromosomes based on fitness; (4) crossover and mutation: perform two-point crossover (crossover rate = 0.8) followed by uniform mutation; (5) elitism: retain the top 5% of chromosomes to preserve optimal solutions; (6) termination: repeat steps 2–5 until 100 generations are completed or MSE converges.
To assess the efficacy of the developed affective response models, the root mean square error (RMSE), mean absolute error (MAE), and determination coefficient (R2) were employed as the metric to evaluate the predictive accuracy of the Kansei image model. The RMSE provides a precise measure of the discrepancy between observed and actual values, thereby serving as a robust indicator of the model’s precision and reliability. MAE will reflect the average absolute deviation, and R2 will indicate the goodness of fit between predictions and actual values.
We used a dataset of 348 user preference samples, split into 70% training (n = 244) and 30% testing (n = 104) sets, with a 5-fold cross-validation process to ensure robustness. The reported RMSE, MAE and R2 values are averages across the five-folds. The values of RMSE, MAE, and R2 for the three user groups, as presented in Table 8, indicate the predictive performance of the models. Consistent with the findings of Tsai and Chou [45], the Genetic Algorithm-optimized Backpropagation Neural Network (GA-BPNN) models demonstrate superior efficacy for affective response prediction compared to standard Backpropagation Neural Network (BPNN) models. Furthermore, the GA-BPNN exhibits a higher degree of concordance between predicted and actual values, underscoring its enhanced predictive accuracy and robustness relative to the BPNN.

4.5.2. Obtaining the User Group-Oriented Optimized Design Solutions

During the derivation of optimal design solutions, a diverse array of product configurations is generated. Leveraging intelligent computational evaluation, configurations that satisfy the coupled constraints of the product are retained, while those exhibiting mutually exclusive characteristics are systematically eliminated, ensuring the selection of optimized forms that align with the design requirements.
The multi-objective optimization model was constructed using the NSGA-II to obtain a non-dominated solution set. Ten design elements were defined as a ten-dimensional set of decision variables D, which could be expressed as Equation (16). The objective function was converted as shown in Equation (17). For three user groups i = 1 , 2 , 3 , f 1 i was the first objective function, f 2 i was the second objective function of affective responses in user group i , and it was required to maximize two optimization objectives at the same time.
D = D 1 , D 2 , D 3 , D 4 , D 5 , D 6 , D 7 , D 8 , D 9 , D 10
M a x f 1 i , f 2 i i = 1 , 2 , 3
The user group-oriented affective response models, developed using the Genetic Algorithm-optimized Backpropagation Neural Network (GA-BPNN), served as the foundation for constructing the fitness function of the NSGA-II-based product form optimization models. By integrating the intersection of usability and engineering constraints as the model’s boundary conditions, the non-dominated solutions for users were systematically optimized, yielding refined product configurations that effectively balance user preferences and technical feasibility.
Following previous studies [39], for NSGA-II, we adopted simulated binary crossover (SBX) to handle real-valued decision variables, with a crossover distribution index of 20, and polynomial mutation (mutation distribution index = 20, mutation rate = 1/number of variables) to introduce small perturbations. The NSGA-II workflow included (1) initialization of a population (size = 100) and evaluation of objectives (e.g., prediction error and model complexity); (2) creation of offspring via selection, SBX, and polynomial mutation; (3) combination of parent and offspring populations, followed by non-dominated sorting and crowding distance calculation; (4) selection of the next generation by retaining individuals with higher ranks and larger crowding distances; and (5) termination after 200 generations.
All experiments were conducted on a workstation equipped with an Intel Core i9-12900K processor (30 cores, 5.2 GHz) (Intel Corporation, Santa Clara, CA, USA), 64 GB DDR4 RAM, and an NVIDIA GeForce RTX 3090 GPU (24 GB VRAM) (Nvidia Corporation, Santa Clara, CA, USA). In MATLAB, the configuration of the NSGA-II parameters was accomplished using the “gaoptimset” function, ensuring precise optimization of the algorithm. SolidWorks 2024 facilitated the creation of three-dimensional models, while KeyShot 2023 was employed for high-fidelity rendering to produce the final optimized product designs. The representative product forms, optimized for the three distinct user groups, are presented in Table 9, showcasing the tailored outcomes of the design process.
In conclusion, a comparative analysis of the three product sets reveals that the optimization of product form design, which integrates coupled constraints and accounts for individual variations, has successfully achieved the intended outcomes, demonstrating enhanced design efficacy and user-centric adaptability.
5. Discussions and Conclusions

Kansei Engineering (KE) represents an ergonomic, consumer-centric methodology that systematically translates subjective user perceptions into quantifiable design parameters, with the proposed framework extending conventional KE theory by incorporating coupled constraint satisfaction and heterogeneous user preference modeling to enable data-driven product form optimization that balances aesthetic appeal with technical feasibility while accommodating individual differences in affective response.
This study first validates the theoretical premise that user perceptual models exist along a continuum between homogeneous ‘average-user’ approximations and fully individualized heterogeneous representations, then advances a novel framework for identifying group-specific affective responses by integrating preference-driven user clustering with dominance-based rough set theory. The methodology captures the multidimensional nature of affective perception, where each user segment exhibits a unique amalgamation of psychological idiosyncrasies and shared cognitive patterns, thereby addressing a critical gap in Kansei engineering’s capacity to reconcile mass customization constraints with individual differences in emotional response.
This investigation enhanced the selection of representative products by incorporating form aesthetics evaluation, thereby ensuring a more rigorous and scientifically grounded approach. During the optimization design process, alongside engineering constraints, usability constraints were introduced to address usability considerations, effectively delineating the coupling of design elements. The optimization strategy employed multi-objective optimization to derive optimal product form designs tailored to user group-oriented affective responses while adhering to coupled constraints. By constructing this robust optimization mechanism, the study successfully addressed the shortcomings of existing Kansei engineering systems, notably their limited design flexibility and adaptability, thus advancing the field with a more responsive and versatile design framework.
This study acknowledges certain limitations that warrant further exploration. Future research could broaden the scope of target user demographics and develop systematic criteria for user segmentation, thereby enhancing the practical utility of the findings through precise user group classification and tailored affective response models. Additionally, while this investigation focused exclusively on product form and color, subsequent studies should incorporate texture and material considerations to provide a more comprehensive analysis of design elements, further enriching the applicability and depth of Kansei engineering research.

Funding

This research received no external funding.

Data Availability Statement

Data is contained within the article.

Conflicts of Interest

The author declares no conflict of interest.

References

  1. Palacios-Ibáñez, A.; Navarro-Martínez, R.; Blasco-Esteban, J.; Contero, M.; Camba, J.D. On the application of extended reality technologies for the evaluation of product characteristics during the initial stages of the product development process. Comput. Ind. 2023, 144, 103780. [Google Scholar] [CrossRef]
  2. Liu, X.; Yang, S. Study on product form design via Kansei engineering and virtual reality. J. Eng. Des. 2022, 33, 412–440. [Google Scholar] [CrossRef]
  3. Tongsubanan, S.; Kasemsarn, K. Developing a design guideline for a user-friendly home energy-saving application that aligns with user-centered design (UCD) principles. Int. J. Hum.—Comput. Interact. 2025, 41, 7424–7446. [Google Scholar] [CrossRef]
  4. Li, Y.; Zhu, L. Optimisation of product form design using fuzzy integral-based Taguchi method. J. Eng. Des. 2017, 28, 480–504. [Google Scholar] [CrossRef]
  5. Han, Y.; Moghaddam, M. Analysis of sentiment expressions for user-centered design. Expert Syst. Appl. 2021, 171, 114604. [Google Scholar] [CrossRef]
  6. Li, Z.; Tian, Z.G.; Wang, J.W.; Wang, W.M.; Huang, G.Q. Dynamic mapping of design elements and affective responses: A machine learning based method for affective design. J. Eng. Des. 2018, 29, 358–380. [Google Scholar] [CrossRef]
  7. Kettwich, C.; Schrank, A.; Oehl, M. Teleoperation of highly automated vehicles in public transport: User-centered design of a human-machine interface for remote-operation and its expert usability evaluation. Multimodal Technol. Interact. 2021, 5, 26. [Google Scholar] [CrossRef]
  8. Guo, F.; Li, F.; Nagamachi, M.; Hu, M.; Li, M. Research on color optimization of tricolor product considering color harmony and users’ emotion. Color Res. Appl. 2020, 45, 156–171. [Google Scholar] [CrossRef]
  9. Heo, I.S.; Putri, A.K.; Kim, B.S.; Kwon, M.S.; Kim, S.H. Analysis of quality standards for industrial collaborative robots based on user-centered design framework. Hum. Factors Ergon. Manuf. Serv. Ind. 2024, 34, 100–117. [Google Scholar] [CrossRef]
  10. Lai, X.; Zhang, S.; Mao, N.; Liu, J.; Chen, Q. Kansei engineering for new energy vehicle exterior design: An internet big data mining approach. Comput. Ind. Eng. 2022, 165, 107913. [Google Scholar] [CrossRef]
  11. Lai, X.; Lin, S.; Zou, J.; Li, M.; Huang, J.; Liu, Z.; Li, D.; Fu, H. Kansei engineering for the intelligent connected vehicle functions: An online and offline data mining approach. Adv. Eng. Inform. 2024, 61, 102467. [Google Scholar] [CrossRef]
  12. Zhang, G.; Yu, M.; Liu, Y.J.; Zhao, G.; Zhang, D.; Zheng, W. SparseDGCNN: Recognizing emotion from multichannel EEG signals. IEEE Trans. Affect. Comput. 2021, 14, 537–548. [Google Scholar] [CrossRef]
  13. Shen, H.C.; Wang, K.C. Affective product form design using fuzzy Kansei engineering and creativity. J. Ambient Intell. Humaniz. Comput. 2016, 7, 875–888. [Google Scholar] [CrossRef]
  14. Kang, X. Biologically inspired product design combining Kansei Engineering and Association Creative Thinking Method. Adv. Eng. Inform. 2024, 62, 102615. [Google Scholar] [CrossRef]
  15. Hsiao, S.W.; Tsai, H.C. Applying a hybrid approach based on fuzzy neural network and genetic algorithm to product form design. Int. J. Ind. Ergon. 2005, 35, 411–428. [Google Scholar] [CrossRef]
  16. Shieh, M.D.; Li, Y.; Yang, C.C. Product Form Design Model Based on Multiobjective Optimization and Multicriteria Decision-Making. Math. Probl. Eng. 2017, 2017, 5187521. [Google Scholar] [CrossRef]
  17. Li, X.; Su, J.; Zhang, Z.; Bai, R. Product innovation concept generation based on deep learning and Kansei engineering. J. Eng. Des. 2021, 32, 559–589. [Google Scholar] [CrossRef]
  18. Guo, F.; Qu, Q.X.; Chen, P.; Ding, Y.; Liu, W.L. Application of evolutionary neural networks on optimization design of mobile phone based on user’s emotional needs. Hum. Factors Ergon. Manuf. Serv. Ind. 2016, 26, 301–315. [Google Scholar] [CrossRef]
  19. Tang, W.Y.; Xiang, Z.R.; Ding, T.C.; Zhao, X.; Zhang, Q.; Zou, R. Research on multi-objective optimisation of product form design based on kansei engineering. J. Eng. Des. 2024, 35, 1023–1048. [Google Scholar] [CrossRef]
  20. Fu, L.; Lei, Y.; Zhu, L.; Lv, J. An evaluation and design method for Ming-style furniture integrating Kansei engineering with particle swarm optimization-support vector regression. Adv. Eng. Inform. 2024, 62, 102822. [Google Scholar] [CrossRef]
  21. Diego-Mas, J.A.; Alcaide-Marzal, J. Single users’ affective responses models for product form design. Int. J. Ind. Ergon. 2016, 53, 102–114. [Google Scholar] [CrossRef]
  22. Dong, Y.; Zhu, R.; Peng, W.; Tian, Q.; Guo, G.; Liu, W. A fuzzy mapping method for Kansei needs interpretation considering the individual Kansei variance. Res. Eng. Des. 2021, 32, 175–187. [Google Scholar] [CrossRef]
  23. Yang, C.; Xu, T.; Ye, J. Applying TRIZ and Kansei engineering to the eco-innovative product design towards waste recycling with latent Dirichlet allocation topic model analysis. Eng. Appl. Artif. Intell. 2024, 133, 107962. [Google Scholar] [CrossRef]
  24. Feng, X.; Du, H.; Ma, J.; Wang, H.; Zhou, L.; Wang, M. Crafting user-centric prompts for UI generations based on Kansei engineering and knowledge graph. Adv. Eng. Inform. 2025, 65, 103217. [Google Scholar] [CrossRef]
  25. Jiang, H.; Kwong, C.K.; Liu, Y.; Ip, W.H. A methodology of integrating affective design with defining engineering specifications for product design. Int. J. Prod. Res. 2015, 53, 2472–2488. [Google Scholar] [CrossRef]
  26. Ali, A.M.; Khamaj, A.; Kang, Z.; Moosa, M.; Alam, M.M. User-centered design (UCD) of time-critical weather alert application. Int. J. Adv. Comput. Sci. Appl. 2023, 14, 797–808. [Google Scholar] [CrossRef]
  27. Li, M.; Dai, Y. Optimization strategies for the modular resource construction of art gallery’s exhibition halls based on kansei engineering. IEEE Access 2024, 12, 27870–27886. [Google Scholar] [CrossRef]
  28. Guo, F.; Qu, Q.X.; Nagamachi, M.; Duffy, V.G. A proposal of the event-related potential method to effectively identify kansei words for assessing product design features in kansei engineering research. Int. J. Ind. Ergon. 2020, 76, 102940. [Google Scholar] [CrossRef]
  29. Heinonen, H.; Virtaluoto, J.; Suomivuori, T.; Forsman, K.; Kangas, T.; Siltanen, S. Minimalism for the win: User-centered design for guidance in industrial maintenance. IEEE Trans. Prof. Commun. 2022, 65, 485–501. [Google Scholar] [CrossRef]
  30. Chang, Y.M.; Chen, C.W. Kansei assessment of the constituent elements and the overall interrelations in car steering wheel design. Int. J. Ind. Ergon. 2016, 56, 97–105. [Google Scholar] [CrossRef]
  31. Lin, Y.C.; Lai, H.H.; Yeh, C.H. Consumer-oriented product form design based on fuzzy logic: A case study of mobile phones. Int. J. Ind. Ergon. 2007, 37, 531–543. [Google Scholar] [CrossRef]
  32. Hong, S.W.; Han, S.H.; Kim, K.J. Optimal balancing of multiple affective satisfaction dimensions: A case study on mobile phones. Int. J. Ind. Ergon. 2008, 38, 272–279. [Google Scholar] [CrossRef]
  33. Verma, S.; Pant, M.; Snasel, V. A comprehensive review on NSGA-II for multi-objective combinatorial optimization problems. IEEE Access 2021, 9, 57757–57791. [Google Scholar] [CrossRef]
  34. Ali, R.; Siddiqi, M.H.; Lee, S. Rough set-based approaches for discretization: A compact review. Artif. Intell. Rev. 2015, 44, 235–263. [Google Scholar] [CrossRef]
  35. Shie, A.J.; Xu, E.M.; Ye, Z.Z.; Ruan, J.Q.; Yang, G.; Lee, C.H. Kansei-oriented and artificial intelligence-driven framework for mutual aid elderly care service optimization. Adv. Eng. Inform. 2025, 67, 103489. [Google Scholar] [CrossRef]
  36. Yang, C.C.; Chang, H.C. Selecting representative affective dimensions using Procrustes analysis: An application to mobile phone design. Appl. Ergon. 2012, 43, 1072–1080. [Google Scholar] [CrossRef]
  37. Osgood, C.E.; Suci, G.J.; Tannenbaum, P.H. The Measurement of Meaning; University Illinois Press: Oxford, UK, 1957. [Google Scholar]
  38. Zhai, L.Y.; Khoo, L.P.; Zhong, Z.W. A rough set based decision support approach to improving consumer affective satisfaction in product design. Int. J. Ind. Ergon. 2009, 39, 295–302. [Google Scholar] [CrossRef]
  39. Zhang, Z.; Gao, D.; Qi, Y.; Cheng, K. Single-objective optimal design of a high-performance wind turbine airfoil family. IEEE Access 2023, 11, 128261–128287. [Google Scholar] [CrossRef]
  40. Lim, C.; Sumarlie, A.C.; Fernando, F.; Haris, D.A. Perancangan Ui/Ux Aplikasi Absensi ‘Jikan’Dengan Metode User Centered Design. Comput. J. Comput. Sci. Inform. Syst. 2021, 5, 16. [Google Scholar] [CrossRef]
  41. Alja, F.M.; Daniati, E.; Ristyawan, A. Perancangan Ui/Ux E-Commerce Menggunakan Metode User Centered Design (Ucd). J. Inf. Syst. Manag. (JOISM) 2024, 6, 93–101. [Google Scholar] [CrossRef]
  42. Jin, H.; Qu, Q.; Munechika, M.; Sano, M.; Kajihara, C.; Duffy, V.G.; Chen, H. Applying intelligent algorithms to automate the identification of error factors. J. Patient Saf. 2021, 17, e918–e928. [Google Scholar] [CrossRef]
  43. Dasmeh, A.; Koleini Mamaghani, N.; Hassani-Abharian, P. Comparison Between Discrete and Analog Semantic Differential Scales Accuracies in Kansei Engineering (Case Study: Reception Chairs). J. Des. Think. 2024, 5, 47–56. [Google Scholar]
  44. Wei, G.; Jin, Y. Human resource management model based on three-layer BP neural network and machine learning. J. Intell. Fuzzy Syst. 2021, 40, 2289–2300. [Google Scholar] [CrossRef]
  45. Tsai, H.C.; Chou, J.R. Automatic design support and image evaluation of two-coloured products using colour association and colour harmony scales and genetic algorithm. Comput.-Aided Des. 2007, 39, 818–828. [Google Scholar] [CrossRef]
Figure 1. Framework of proposed methodology.
Electronics 14 02962 g001
Figure 2. Coupled relationship of product design elements.
Electronics 14 02962 g002
Figure 3. Preference questionnaire structure.
Electronics 14 02962 g003
Figure 4. Affinity diagram of Kansei words.
Electronics 14 02962 g004
Figure 5. Preliminary sample of SUV product.
Electronics 14 02962 g005
Figure 6. Product prototypes.
Electronics 14 02962 g006
Table 1. Related works.
ReferenceAuthorsProblemsSolving Methods
[15]Hsiao and Tsai Design-user mismatch due to overlooking individual affective perceptions Defined 15 form parameters and five key features within validated design configurations, constrained by optimization ranges
[18]Guo et al.Need for precise variable ranges in design optimizationSystematic analysis of 51 product specimens, using network parameter extraction and manual measurement to derive continuous variable ranges
[21]Diego-Mas and Alcaide-Marzal Risk of design-user mismatch from aggregate-level analysis targeting an ‘average user’Empirical demonstration of limitations in aggregate-level analysis, emphasizing individual affective perception differences
[25]Jiang et al.Lack of structured constraints for multi-objective optimizationFormalized three constraint typologies: (1) design element data types, (2) parameter value ranges, and (3) technical inter-element correlations
[28]Guo et al. Limited integration of industrial design expertise in optimization frameworksDistilled ten critical decision elements from expertise to establish a robust multi-objective optimization framework
Table 2. The notations and their meanings.
NotationsMeanings
UUniverse of discourse, a non-empty finite set of objects under study.
QSet of attributes, typically including conditional attributes and decision attributes.
VThe domain of the attribute.
fInformation function, mapping objects to attribute values.
PIndiscernibility relation, an equivalence relation on (U) induced by a subset of attributes.
P⊆CSubset of condition attributes (C).
Underline{P}XLower approximation of set X, the set of objects certainly belonging to (X).
Overline{P}XUpper approximation of set X, the set of objects possibly belonging to (X).
BN_P(X)Boundary region of set (X), representing uncertain objects.
Table 3. The high-weight Kansei terms per user group (with SIG(k) values).
User GroupsExpensiveHeavyIndividualBeautifulEasy to Use
User group I0.0975 0.1587 0.27980.2505 0.2235
User group II0.1283 0.0759 0.15140.39600.2631
User group III0.13450.2589 0.20850.1704 0.2741
Table 4. Product form aesthetics value (mean Likert scores on a 7-point scale).
No.SymmetryProportionHomogeneityNo.SymmetryProportionHomogeneity
14.66 4.21 5.17 174.86 5.07 4.78
24.84 4.06 4.02 185.01 5.16 5.64
35.22 4.16 4.55 195.21 5.69 4.86
45.34 5.66 4.58 205.47 4.26 4.59
54.96 5.57 4.13 214.52 5.46 4.44
65.66 4.80 5.64 224.71 4.24 5.29
74.44 4.55 4.24 234.62 5.04 4.85
84.13 5.12 4.67 245.30 4.60 4.97
94.58 5.33 4.90 255.63 4.61 5.63
104.44 5.22 4.52 264.71 4.97 4.26
114.86 5.65 4.31 274.98 4.85 5.21
125.35 5.34 4.15 285.65 5.40 4.72
134.60 4.92 4.96 294.64 4.48 5.15
144.68 4.39 5.05 304.92 4.30 5.41
155.24 5.56 4.96 314.82 5.69 5.28
164.40 5.52 4.39 325.42 4.84 4.31
Table 5. The form design variables and their levels.
Design VariableL1L2L3
X1HeadlightElectronics 14 02962 i001Electronics 14 02962 i002Electronics 14 02962 i003
X2HubElectronics 14 02962 i004Electronics 14 02962 i005Electronics 14 02962 i006
X3Body contourElectronics 14 02962 i007Electronics 14 02962 i008Electronics 14 02962 i009
X4Radiator grilleElectronics 14 02962 i010Electronics 14 02962 i011Electronics 14 02962 i012
X5Fog lights styleElectronics 14 02962 i013Electronics 14 02962 i014Electronics 14 02962 i015
X6Car waistlineElectronics 14 02962 i016Electronics 14 02962 i017Electronics 14 02962 i018
X7Car hoodElectronics 14 02962 i019Electronics 14 02962 i020Electronics 14 02962 i021
Table 6. The color design variables and their levels.
Design VariableL1L2L3L4L5
X8Color_RElectronics 14 02962 i022Electronics 14 02962 i023Electronics 14 02962 i024Electronics 14 02962 i025Electronics 14 02962 i026
X9Color_GElectronics 14 02962 i027Electronics 14 02962 i028Electronics 14 02962 i029Electronics 14 02962 i030Electronics 14 02962 i031
X10Color_BElectronics 14 02962 i032Electronics 14 02962 i033Electronics 14 02962 i034Electronics 14 02962 i035Electronics 14 02962 i036
Table 7. Product form preference ranking table.
User GroupsFavoriteCommonAversive
User group ISample 3
Electronics 14 02962 i037
Sample 10
Electronics 14 02962 i038
Sample 11
Electronics 14 02962 i039
User group IISample 21
Electronics 14 02962 i040
Sample 22
Electronics 14 02962 i041
Sample 31
Electronics 14 02962 i042
User group IIISample 5
Electronics 14 02962 i043
Sample 9
Electronics 14 02962 i044
Sample 18
Electronics 14 02962 i045
Table 8. RMSE, MAE, and R2 of affective response model in three user groups.
ItemsIndividual–BeautifulBeautiful–DurableDurable–Light
RMSEBPNN0.02570.02060.0216
GA-BPNN0.01420.01090.0096
MAEBPNN0.87251.02140.9357
GA-BPNN0.09870.53970.1980
R2BPNN0.75120.71780.7309
GA-BPNN0.82950.87180.8634
Table 9. Comparison of optimization results in three user groups.
User GroupIndividual–Beautiful Beautiful–DurableDurable–Light
OptimizationElectronics 14 02962 i046Electronics 14 02962 i047Electronics 14 02962 i048
Disclaimer/Publisher’s Note: The statements, opinions and data contained in all publications are solely those of the individual author(s) and contributor(s) and not of MDPI and/or the editor(s). MDPI and/or the editor(s) disclaim responsibility for any injury to people or property resulting from any ideas, methods, instructions or products referred to in the content.