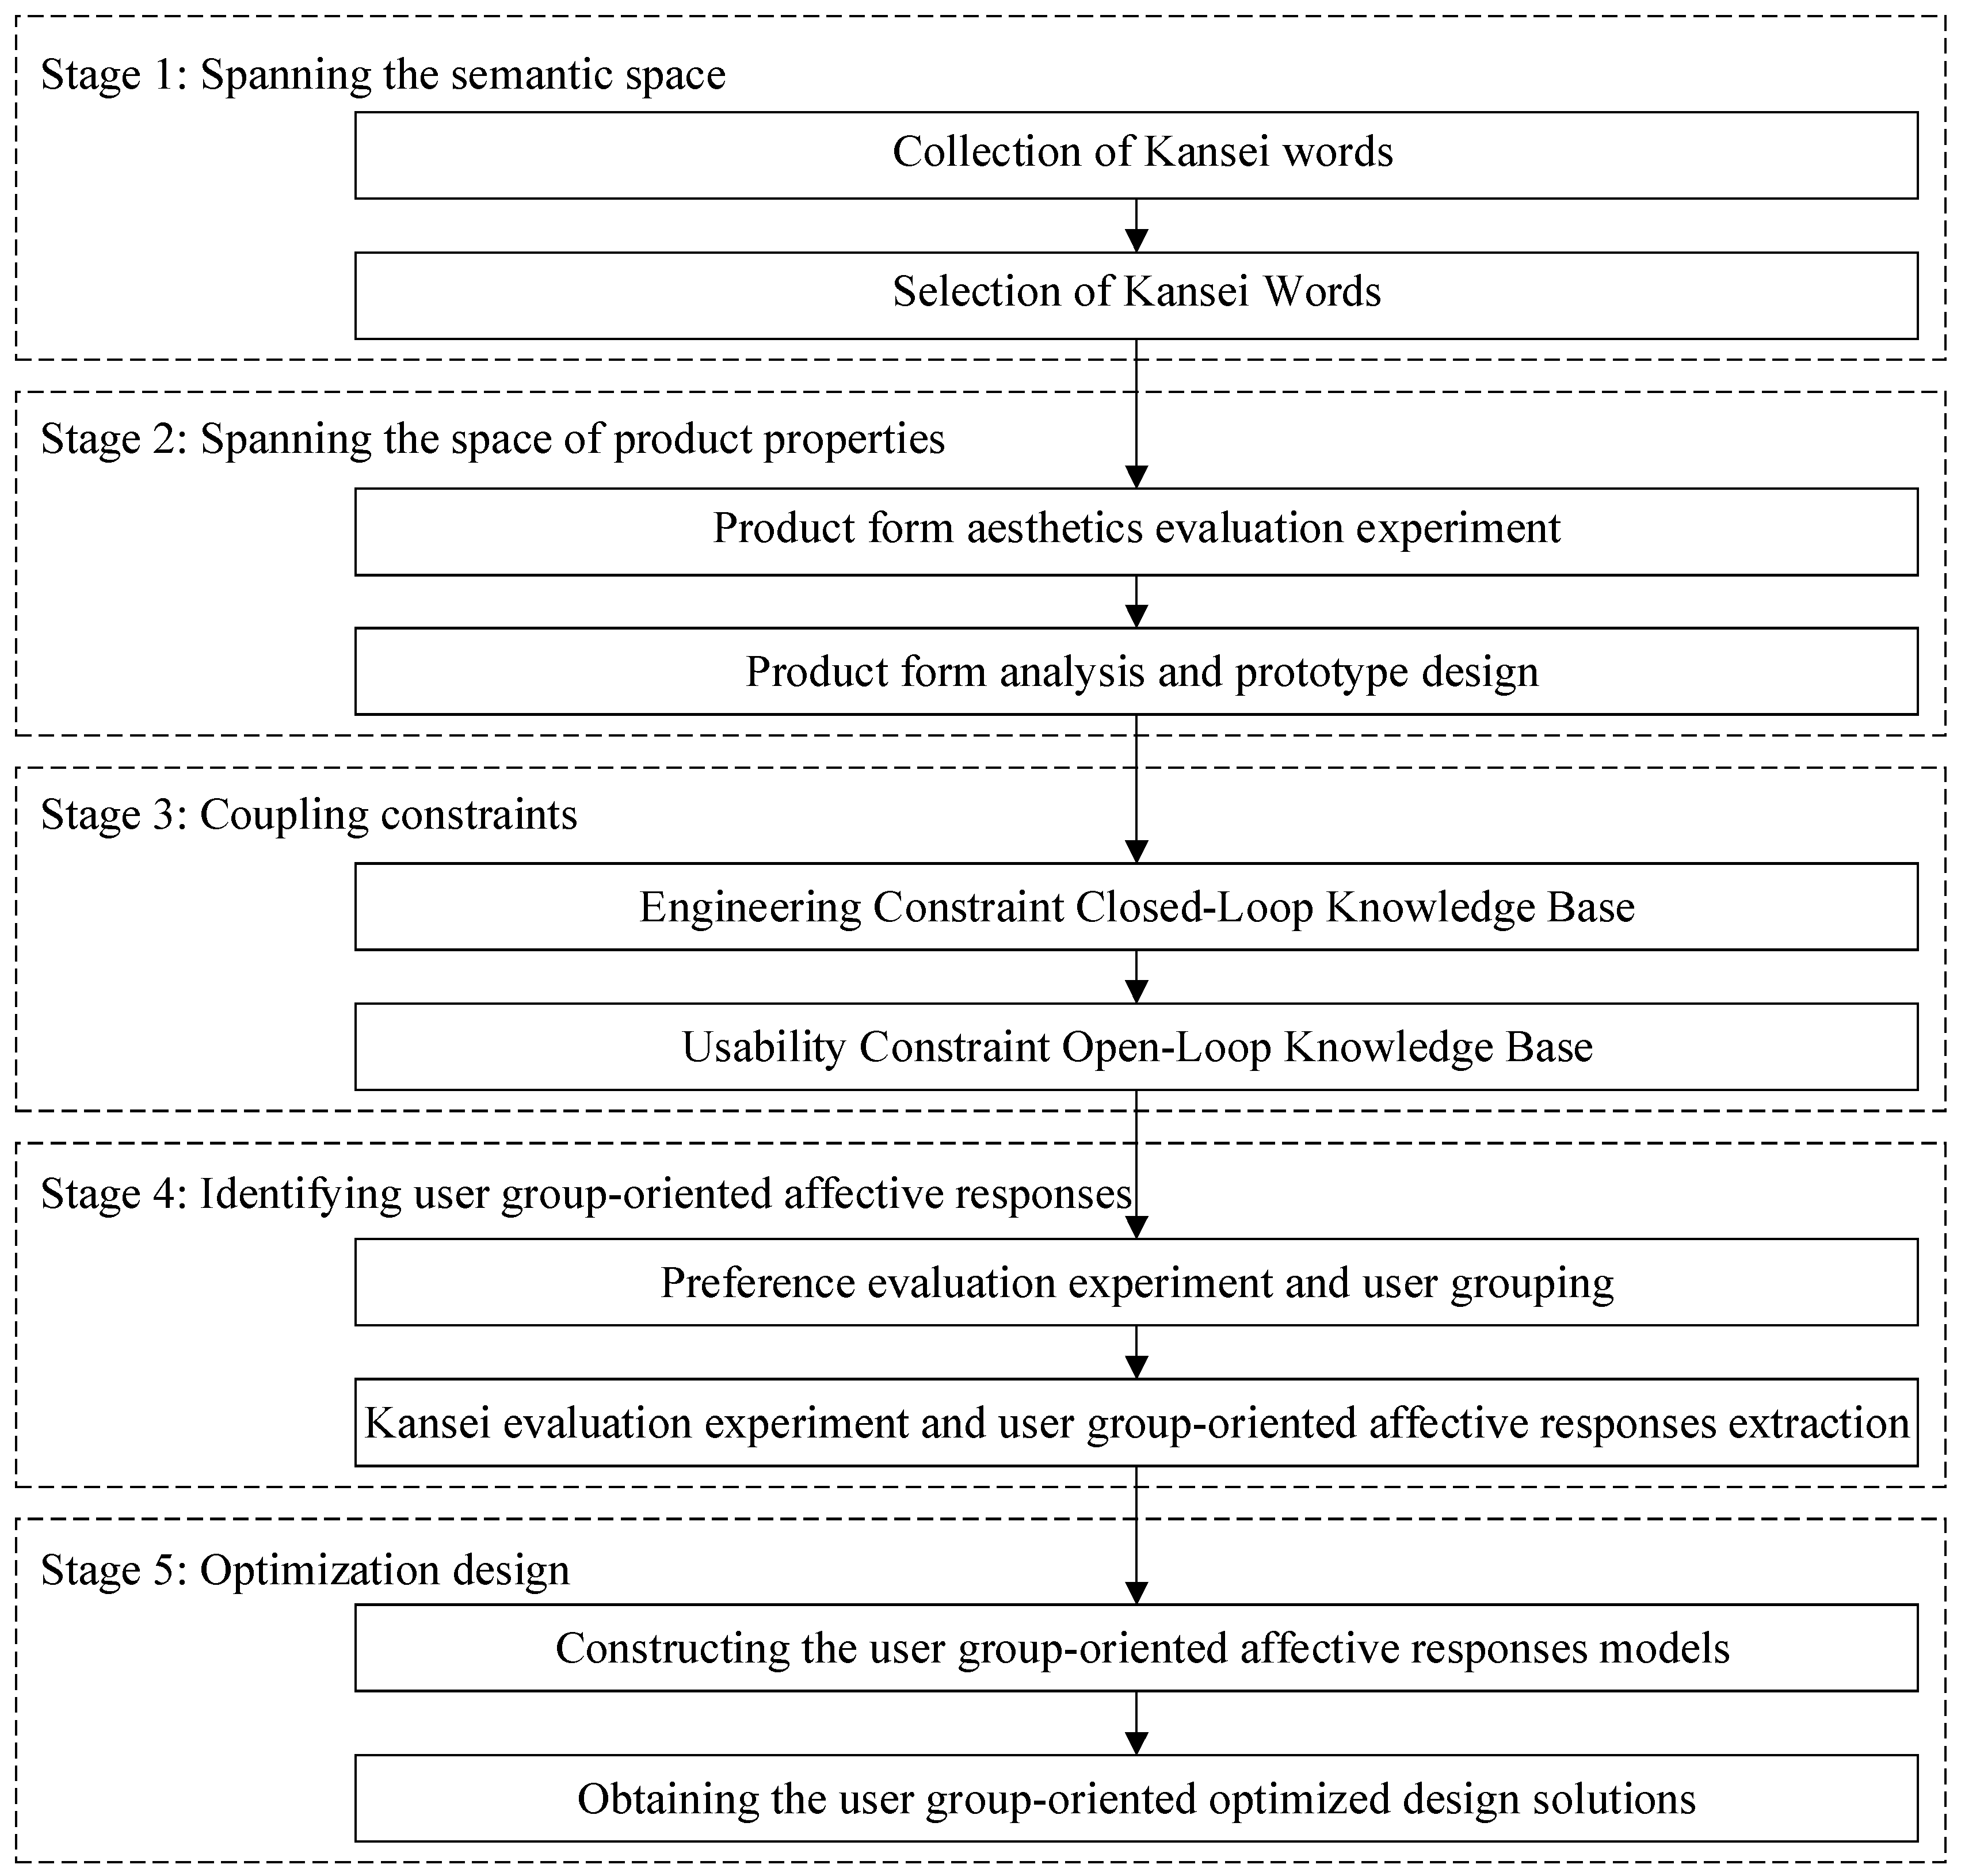
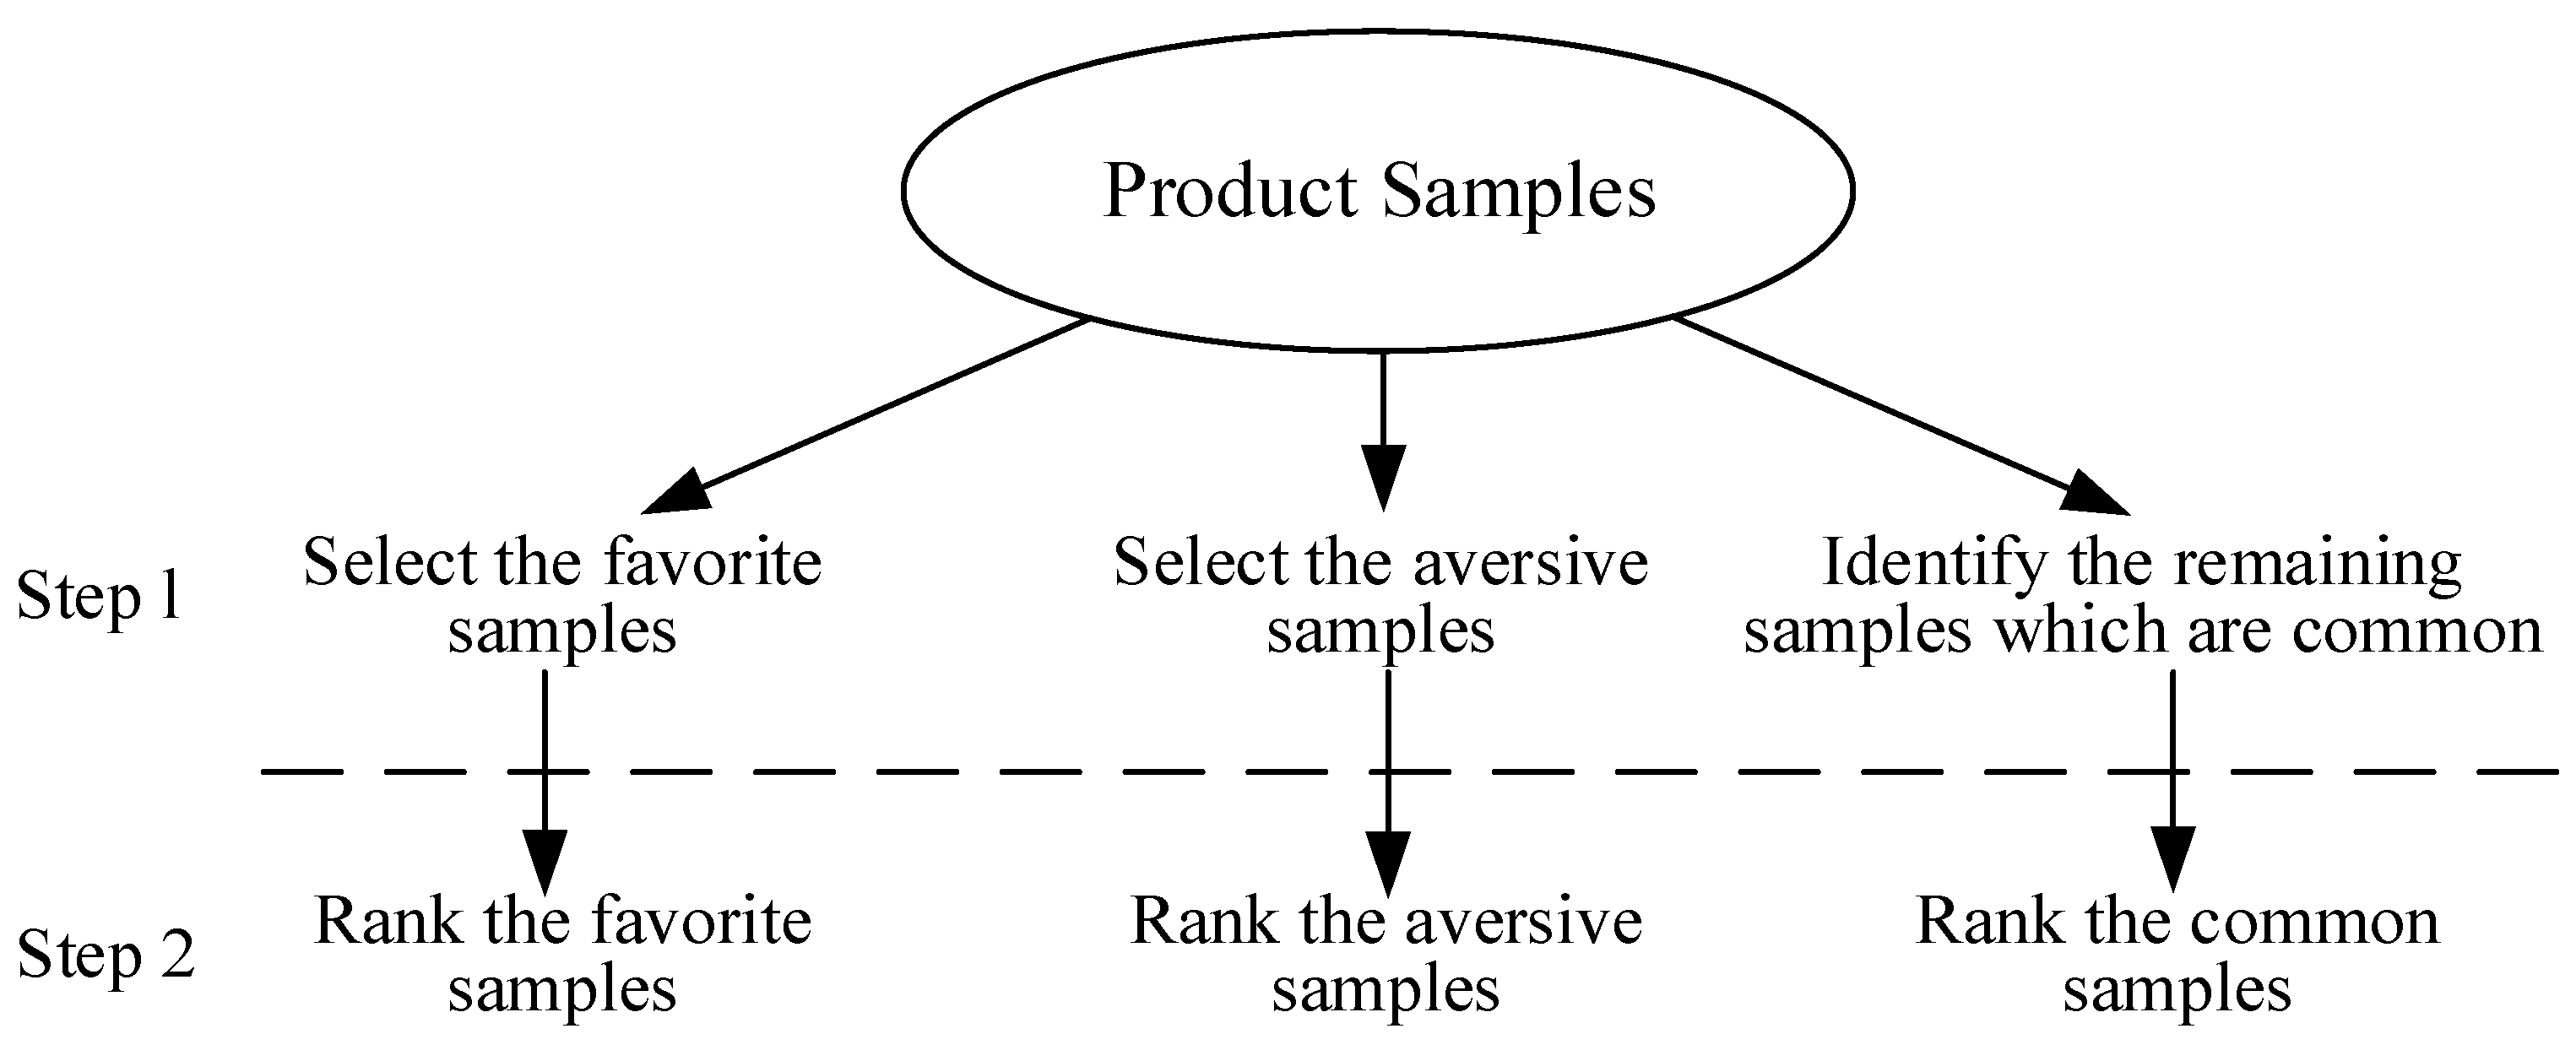
4.5.1. Constructing the User Group-Oriented Affective Response Models
The GA-BPNN framework implements a four-phase optimization pipeline: (1) BPNN architecture configuration, (2) GA-driven weight and threshold optimization, (3) network training, and (4) predictive validation. This study trained separate models for each user cohort using the ten design parameters (X1–X10) from 54 prototypes as input vectors and their corresponding group-specific affective responses as target outputs, thereby establishing nonlinear mappings between form features and perceptual preferences while maintaining computational efficiency through evolutionary parameter initialization.
Research has demonstrated that neural networks with a three-layer architecture can approximate any arbitrary function with arbitrarily high precision [
44]. Within such networks, comprising an input layer, a hidden layer, and an output layer, an approximate relationship exists among the number of neurons in the hidden layer (S1), the input layer (R), and the output layer (S2), facilitating the network’s capacity to model complex mappings effectively [
18,
44]:
In this investigation, two Kansei words were identified to encapsulate the affective responses of each user group, with ten key Kansei design elements delineated for each group. Consequently, the architecture of the Genetic Algorithm-optimized Backpropagation Neural Network (GA-BPNN), as determined by Equation (15), was configured with a 10-6-2 structure, reflecting the input, hidden, and output layers, respectively. The genetic algorithm, implemented via the GOAT toolbox in MATLAB 2024b, was employed to optimize the BPNN, enabling the derivation of association rules that elucidate the relationships between the key Kansei design elements and the affective responses across the three user groups.
Following previous studies [
44], for the genetic algorithm (GA) integrated with the backpropagation neural network (GA-BPNN), we used two-point crossover for recombination, where two random crossover points were selected, and gene segments between these points were exchanged between parent chromosomes to maintain genetic diversity while preserving beneficial allele combinations. Mutation was implemented via uniform mutation, where each gene in the chromosome had an equal probability (set to 0.01) of being randomly replaced with a new value within the predefined search space, preventing premature convergence. The exact steps of GA-BPNN were as follows: (1) initialization: generate a population of 100 chromosomes, each encoding BPNN weights and biases as real-valued genes; (2) fitness evaluation: assess each chromosome by training the BPNN with the encoded parameters and using mean squared error (MSE) on the validation set as the fitness score; (3) selection: apply tournament selection (tournament size = 3) to select parent chromosomes based on fitness; (4) crossover and mutation: perform two-point crossover (crossover rate = 0.8) followed by uniform mutation; (5) elitism: retain the top 5% of chromosomes to preserve optimal solutions; (6) termination: repeat steps 2–5 until 100 generations are completed or MSE converges.
To assess the efficacy of the developed affective response models, the root mean square error (RMSE), mean absolute error (MAE), and determination coefficient (R2) were employed as the metric to evaluate the predictive accuracy of the Kansei image model. The RMSE provides a precise measure of the discrepancy between observed and actual values, thereby serving as a robust indicator of the model’s precision and reliability. MAE will reflect the average absolute deviation, and R2 will indicate the goodness of fit between predictions and actual values.
We used a dataset of 348 user preference samples, split into 70% training (n = 244) and 30% testing (n = 104) sets, with a 5-fold cross-validation process to ensure robustness. The reported RMSE, MAE and R
2 values are averages across the five-folds. The values of RMSE, MAE, and R
2 for the three user groups, as presented in
Table 8, indicate the predictive performance of the models. Consistent with the findings of Tsai and Chou [
45], the Genetic Algorithm-optimized Backpropagation Neural Network (GA-BPNN) models demonstrate superior efficacy for affective response prediction compared to standard Backpropagation Neural Network (BPNN) models. Furthermore, the GA-BPNN exhibits a higher degree of concordance between predicted and actual values, underscoring its enhanced predictive accuracy and robustness relative to the BPNN.
4.5.2. Obtaining the User Group-Oriented Optimized Design Solutions
During the derivation of optimal design solutions, a diverse array of product configurations is generated. Leveraging intelligent computational evaluation, configurations that satisfy the coupled constraints of the product are retained, while those exhibiting mutually exclusive characteristics are systematically eliminated, ensuring the selection of optimized forms that align with the design requirements.
The multi-objective optimization model was constructed using the NSGA-II to obtain a non-dominated solution set. Ten design elements were defined as a ten-dimensional set of decision variables
D, which could be expressed as Equation (16). The objective function was converted as shown in Equation (17). For three user groups
,
was the first objective function,
was the second objective function of affective responses in user group
, and it was required to maximize two optimization objectives at the same time.
The user group-oriented affective response models, developed using the Genetic Algorithm-optimized Backpropagation Neural Network (GA-BPNN), served as the foundation for constructing the fitness function of the NSGA-II-based product form optimization models. By integrating the intersection of usability and engineering constraints as the model’s boundary conditions, the non-dominated solutions for users were systematically optimized, yielding refined product configurations that effectively balance user preferences and technical feasibility.
Following previous studies [
39], for NSGA-II, we adopted simulated binary crossover (SBX) to handle real-valued decision variables, with a crossover distribution index of 20, and polynomial mutation (mutation distribution index = 20, mutation rate = 1/number of variables) to introduce small perturbations. The NSGA-II workflow included (1) initialization of a population (size = 100) and evaluation of objectives (e.g., prediction error and model complexity); (2) creation of offspring via selection, SBX, and polynomial mutation; (3) combination of parent and offspring populations, followed by non-dominated sorting and crowding distance calculation; (4) selection of the next generation by retaining individuals with higher ranks and larger crowding distances; and (5) termination after 200 generations.
All experiments were conducted on a workstation equipped with an Intel Core i9-12900K processor (30 cores, 5.2 GHz) (Intel Corporation, Santa Clara, CA, USA), 64 GB DDR4 RAM, and an NVIDIA GeForce RTX 3090 GPU (24 GB VRAM) (Nvidia Corporation, Santa Clara, CA, USA). In MATLAB, the configuration of the NSGA-II parameters was accomplished using the “gaoptimset” function, ensuring precise optimization of the algorithm. SolidWorks 2024 facilitated the creation of three-dimensional models, while KeyShot 2023 was employed for high-fidelity rendering to produce the final optimized product designs. The representative product forms, optimized for the three distinct user groups, are presented in
Table 9, showcasing the tailored outcomes of the design process.
In conclusion, a comparative analysis of the three product sets reveals that the optimization of product form design, which integrates coupled constraints and accounts for individual variations, has successfully achieved the intended outcomes, demonstrating enhanced design efficacy and user-centric adaptability.


