Article

TSE-APT: An APT Attack-Detection Method Based on Time-Series and Ensemble-Learning Models

College of Computer Science, Beijing Information Science and Technology University, Beijing 102206, China
*
Author to whom correspondence should be addressed.
Electronics 2025, 14(15), 2924; https://doi.org/10.3390/electronics14152924
Submission received: 24 June 2025 / Revised: 16 July 2025 / Accepted: 17 July 2025 / Published: 22 July 2025
(This article belongs to the Special Issue AI in Cybersecurity, 2nd Edition)

Abstract

Advanced Persistent Threat (APT) attacks pose a serious challenge to traditional detection methods. These methods often suffer from high false-alarm rates and limited accuracy due to the multi-stage and covert nature of APT attacks. In this paper, we propose TSE-APT, a time-series ensemble model that addresses these two limitations. It combines multiple machine-learning models, such as Random Forest (RF), Multi-Layer Perceptron (MLP), and Bidirectional Long Short-Term Memory Network (BiLSTM) models, to dynamically capture correlations between multiple stages of the attack process based on time-series features. It discovers hidden features through the integration of multiple machine-learning models to significantly improve the accuracy and robustness of APT detection. First, we extract a collection of dynamic time-series features such as traffic mean, flow duration, and flag frequency. We fuse them with static contextual features, including the port service matrix and protocol type distribution, to effectively capture the multi-stage behaviors of APT attacks. Then, we utilize an ensemble-learning model with a dynamic weight-allocation mechanism using a self-attention network to adaptively adjust the sub-model contribution. The experiments showed that using time-series feature fusion significantly enhanced the detection performance. The RF, MLP, and BiLSTM models achieved 96.7% accuracy, considerably enhancing recall and the false positive rate. The adaptive mechanism optimizes the model’s performance and reduces false-alarm rates. This study provides an analytical method for APT attack detection, considering both temporal dynamics and context static characteristics, and provides new ideas for security protection in complex networks.

1. Introduction

Advanced Persistent Threat attacks have become the preferred attack of various hacker organizations and criminal groups due to their covert, targeted, and long-term nature. Unlike traditional network attacks like DDoS or XSS, APT attacks focus on “precise strikes and long-term infiltration” [1,2]. These attacks usually target high-value targets such as government agencies and the Internet of Things (IoT) [3]. To achieve data theft or system destruction, attackers use attack patterns, such as social engineering or zero-day vulnerabilities, with a multi-stage and multi-dimensional attack chain [4].
APT poses significant risks and is difficult to detect. Current detection methods can be divided into three categories [5,6]: (1) methods based on machine learning (e.g., Support Vector Machine (SVM) [7], Multi-Layer Perceptron (MLP) [8], etc.), which rely on experts’ experience to perform manual feature extraction on network traffic or system logs. The review study by Chen et al. [4] discussed the feasibility of using machine learning in the field of traffic monitoring. It laid a foundation for the follow-up: multi-feature traffic detection. Ghafir et al. [9] improved schemes such as the MLAPT system that strikes a balance between accuracy and efficiency by introducing a blacklisting mechanism. However, they struggled with generalizing to new attacks due to the size of the blocklist and real-time data-processing limitations. Although this method has the advantages of strong interpretability and low deployment cost, it has natural limitations in context-related modeling of APT multi-phase attacks. Therefore, researchers have tried to use the deep learning method to correlate features across the attack chain.
(2) Provenance graph-based methods (e.g., Graph Neural Networks [10], LSTM [11], etc.), which build causal graphs from system logs to capture the relationships between processes, files, and network activities. Provenance graphs preserve the time and context of a system’s behavior, allowing for the detection of the multi-stage and stealthy nature of APT attacks. For example, Hossain et al. [12] used causality tracking and provenance graphs to construct a model. They created a dependency graph from audit logs, which allowed for faster and real-time monitoring. Ren et al. [13] constructed a knowledge graph of APT attacks by combining deep learning with specialized knowledge. This work can dynamically adjust defense strategies. Compared with other methods, the advantage of provenance graph-based methods lies in their ability to capture the context and causal relationships of system activities, which is especially useful for modeling multi-stage APT attacks. However, these methods have a strong dependence on complete and high-quality audit logs. As a result, provenance-based models may struggle with inaccurate results when the log data are noisy or incomplete. In recent years, with the rise of Transformers, their powerful sequence construction capabilities and temporal analysis have contributed to improving APT detection.
(3) Transformer-based methods, which inherit the time-series modeling capability of Transformer [14], and rely on pre-training and few-shot learning. It can comprehensively model and analyze attacks. For example, LogShield [15] uses a Transformer model to analyze event sequences from system logs, capturing context and temporal information to detect multi-stage and low-frequency APT attacks. In addition, at the end of 2024, a paper introducing TBDetector was published [16]. It first turns system logs into causal graphs and feature sequences, uses Transformer to learn context features, and finally detects APT attacks by calculating anomaly scores. These models demonstrated strong performance on benchmark datasets and were effective at modeling complex multi-stage attack chains. However, due to large parameter sizes and the lack of interpretability of the black-box decision logic, these methods are often difficult to deploy in detection scenarios, especially when computational resources are limited or where interpretability is essential.
APT attacks have a complex, multi-stage, and dynamic nature. As discussed above, the existing approaches, including machine-learning-based, provenance graph-based, and Transformer-based methods, have certain advantages. From our point of view, accurately identifying key features, especially those resulting from APT attacks’ dynamic behavior, remains essential for detecting multi-stage APT attacks. The combination of static and dynamic features can offer a more complete view of attack processes. Although the traditional approaches with provenance graphs and Transformer can automatically capture the complex patterns and relationships in the data, they often suffer from high false-alarm rates and lack interpretability. Therefore, we argue that combining both static and dynamic features and integrating multiple models can better capture the contextual patterns of APT attacks while maintaining efficiency and interpretability.
In this paper, we address the challenge of detecting APT attacks by integrating time-series feature extraction with ensemble-learning methods. By analyzing traffic packets, we identified distinct temporal characteristics that differentiate malicious traffic from normal traffic. Considering the complexity and dynamics of APT attacks, we argue that deep learning might ignore the key dynamic characteristics. The selected features in this study effectively capture the evolving nature of these attacks. By combining static and dynamic time-series characteristics, our approach enhances the ability to capture the multi-stage and covert characteristics of APT attacks. To enhance the detection accuracy, we employ an ensemble-learning method that combines machine learning with deep learning, further augmented by a self-attention mechanism. This approach enables more accurately classification of malicious traffic, reduces false positives, and offers a more effective solution for APT attack detection.
The main contributions of this work are as follows:
  • The accuracy of the proposed TSE-APT method in the CIC-IDS2018 dataset was 97.32%, and the false positive rate was 0.69, outperforming the baseline model.
  • Combining dynamic time-series features with static flow data improves detection accuracy by over 2% and recall by approximately 3% compared to using static features alone.
  • Propose a dynamic weight strategy for sub-model allocation. It effectively improves the F1 score by approximately 2% and recall by over 3% identifying new attacks more accurately.
The paper is organized as follows: related work is described in Section 2; Section 3 presents the APT traffic detection method combining time-series with ensemble-learning models; Section 4 shows the analysis of the experimental results; and Section 5 concludes the paper.

2. Related Works

2.1. Temporal Feature

Temporal features are pivotal in modeling the multi-stage nature of APT attacks [17]. Traditional static features often fail to capture the dynamic evolution of an attack, particularly in long-period attacks. For instance, Benabderrahmane et al. [18] proposed leveraging rule mining for APT attack detection, tracing early detectable events, employing an unsupervised approach, and using causation to explain anomalies. However, static characteristics offer limited insight into unknown attacks and zero-day vulnerabilities. To address it, Niu et al. [19] integrated time sequence features and correlation analysis to identify unknown attacks accurately and promptly. Wang et al. [20] developed spatial and temporal attention to identify unknown attacks using joint learning features, significantly enhancing detection accuracy. While both studies emphasize the importance of time-series features, they fall short in fully the combination of dynamic time-series with static features for multi-stage APT attacks modeling. In contrast, we combine time-series features with static features to enhance attack detection across various stages, making it more suitable for the complex and multi-stage nature of APT attacks.
Time-series features play a crucial role in APT attacks in the Internet of Things (IoT) environment. The large scale and diversity of IoT devices add complexity and concealment to these attacks. Wang et al. [21] proposed a method that uses multiple deep learning algorithms and integrates DT to simulate attack scenarios. They then conducted simulation experiments. This method effectively improves the accuracy of inspection. Yu et al. [22] focused on analyzing communication timing features between devices, combined with deep learning models. Their method effectively identifies APT attack behaviors and provides real-time responses.
Detection based on the life cycle of APT attacks effectively extracts and integrates the characteristics of various stages. APT attacks usually involve multiple stages [23], each characterized by distinct behavioral traits. Combining detection methods with the attack life cycle helps identify and respond to attacks more effectively. For instance, Ghafir et al. [24] utilized Hidden Markov Models to analyze the correlations between attack techniques and alerts, drawing conclusions based on different attack life cycles. To better target the life cycle of attacks, Bodström et al. [25] developed multiple deep learning layers to evaluate attack mechanisms based on the life cycle process. However, the study did not assess the model’s effectiveness or its algorithms. Similarly, while Ramaki et al. [26] introduced the CAPTAIN detection model using the community detection activities, the effectiveness of the detection method still needs to be verified. Compared to these studies, the features we have extracted demonstrate greater efficacy in addressing different stages of the attack life cycle. For example, during the penetration stage, the extracted time-series features show pronounced variations, which can be used to detect anomalies and better locate attack points. Make it more effective in identifying and responding to APT attacks throughout their entire lifecycle.

2.2. Ensemble Learning

Ensemble learning has gained popularity for achieving superior results by integrating multiple models [27]. Saini et al. [28] employed deep learning and machine-learning models to classify APT attacks. Enhance generalization ability by analyzing network traffic, host logs, etc., and integrating multiple base models. This approach boosts detection accuracy while minimizing false positives and omissions. Arefin et al. [29] aggregated predictions from various models, selecting the one with the highest probability, thereby demonstrating the algorithm’s effectiveness. Our method further improves accuracy by combining dynamic weight adjustment and a self-attention mechanism, allowing the model to better focus on important features and reduce computational load.
The integrated learning algorithm should also account for efficiency across various usage environments. Li et al. [30] analyzed different attack modes using multiple datasets and applied adversarial training to integrate a deep neural network. Experimental results demonstrate that this method effectively improves robustness and enhances network defense. However, hybrid detection frameworks face challenges associated with simultaneously training multiple models, which introduces accountability concerns. This results in high computational resources and long response times, necessitating a careful balance of accuracy and efficiency in real-world applications.

2.3. Attention Mechanisms

Attention mechanisms have been extensively utilized in traffic-based threat detection. Unlike traditional models that treat all input features uniformly, attention-based models dynamically assign different weights to different inputs, helping to highlight key indicators of APT attacks. For instance, Choi, S. [31] introduced a multi-attention mechanism network that integrates temporal and feature attention, enhancing detection accuracy and interpretability. Similarly, Su, Tongtong, et al. [32] combined attention with convolutional layers to extract both local and global features, resulting in improved detection accuracy across datasets.
In Jiao et al. [33], attention mechanisms are used to analyze the current system load, which effectively reduces false positives by focusing on more important data. This demonstrates the ability of attention to identify and highlight key information. In our approach, we integrate self-attention into the ensemble model to further enhance feature discrimination, allowing the model to allocate attention to key parts and suppress noise.
The existing detection methods fail to accurately capture the behavior of APT attacks due to their multi-phase and covert nature. While APT attacks often exhibit time characteristics that researchers can identify, regardless of how the attack evolves or what kind of anti-detection technology is employed, few studies address the issues of multi-stage and covert attacks to accurately identify the traffic fluctuation trends caused by APT attacks. To address this gap, this paper introduces a method combining time-series features with static features and using ensemble-learning models.

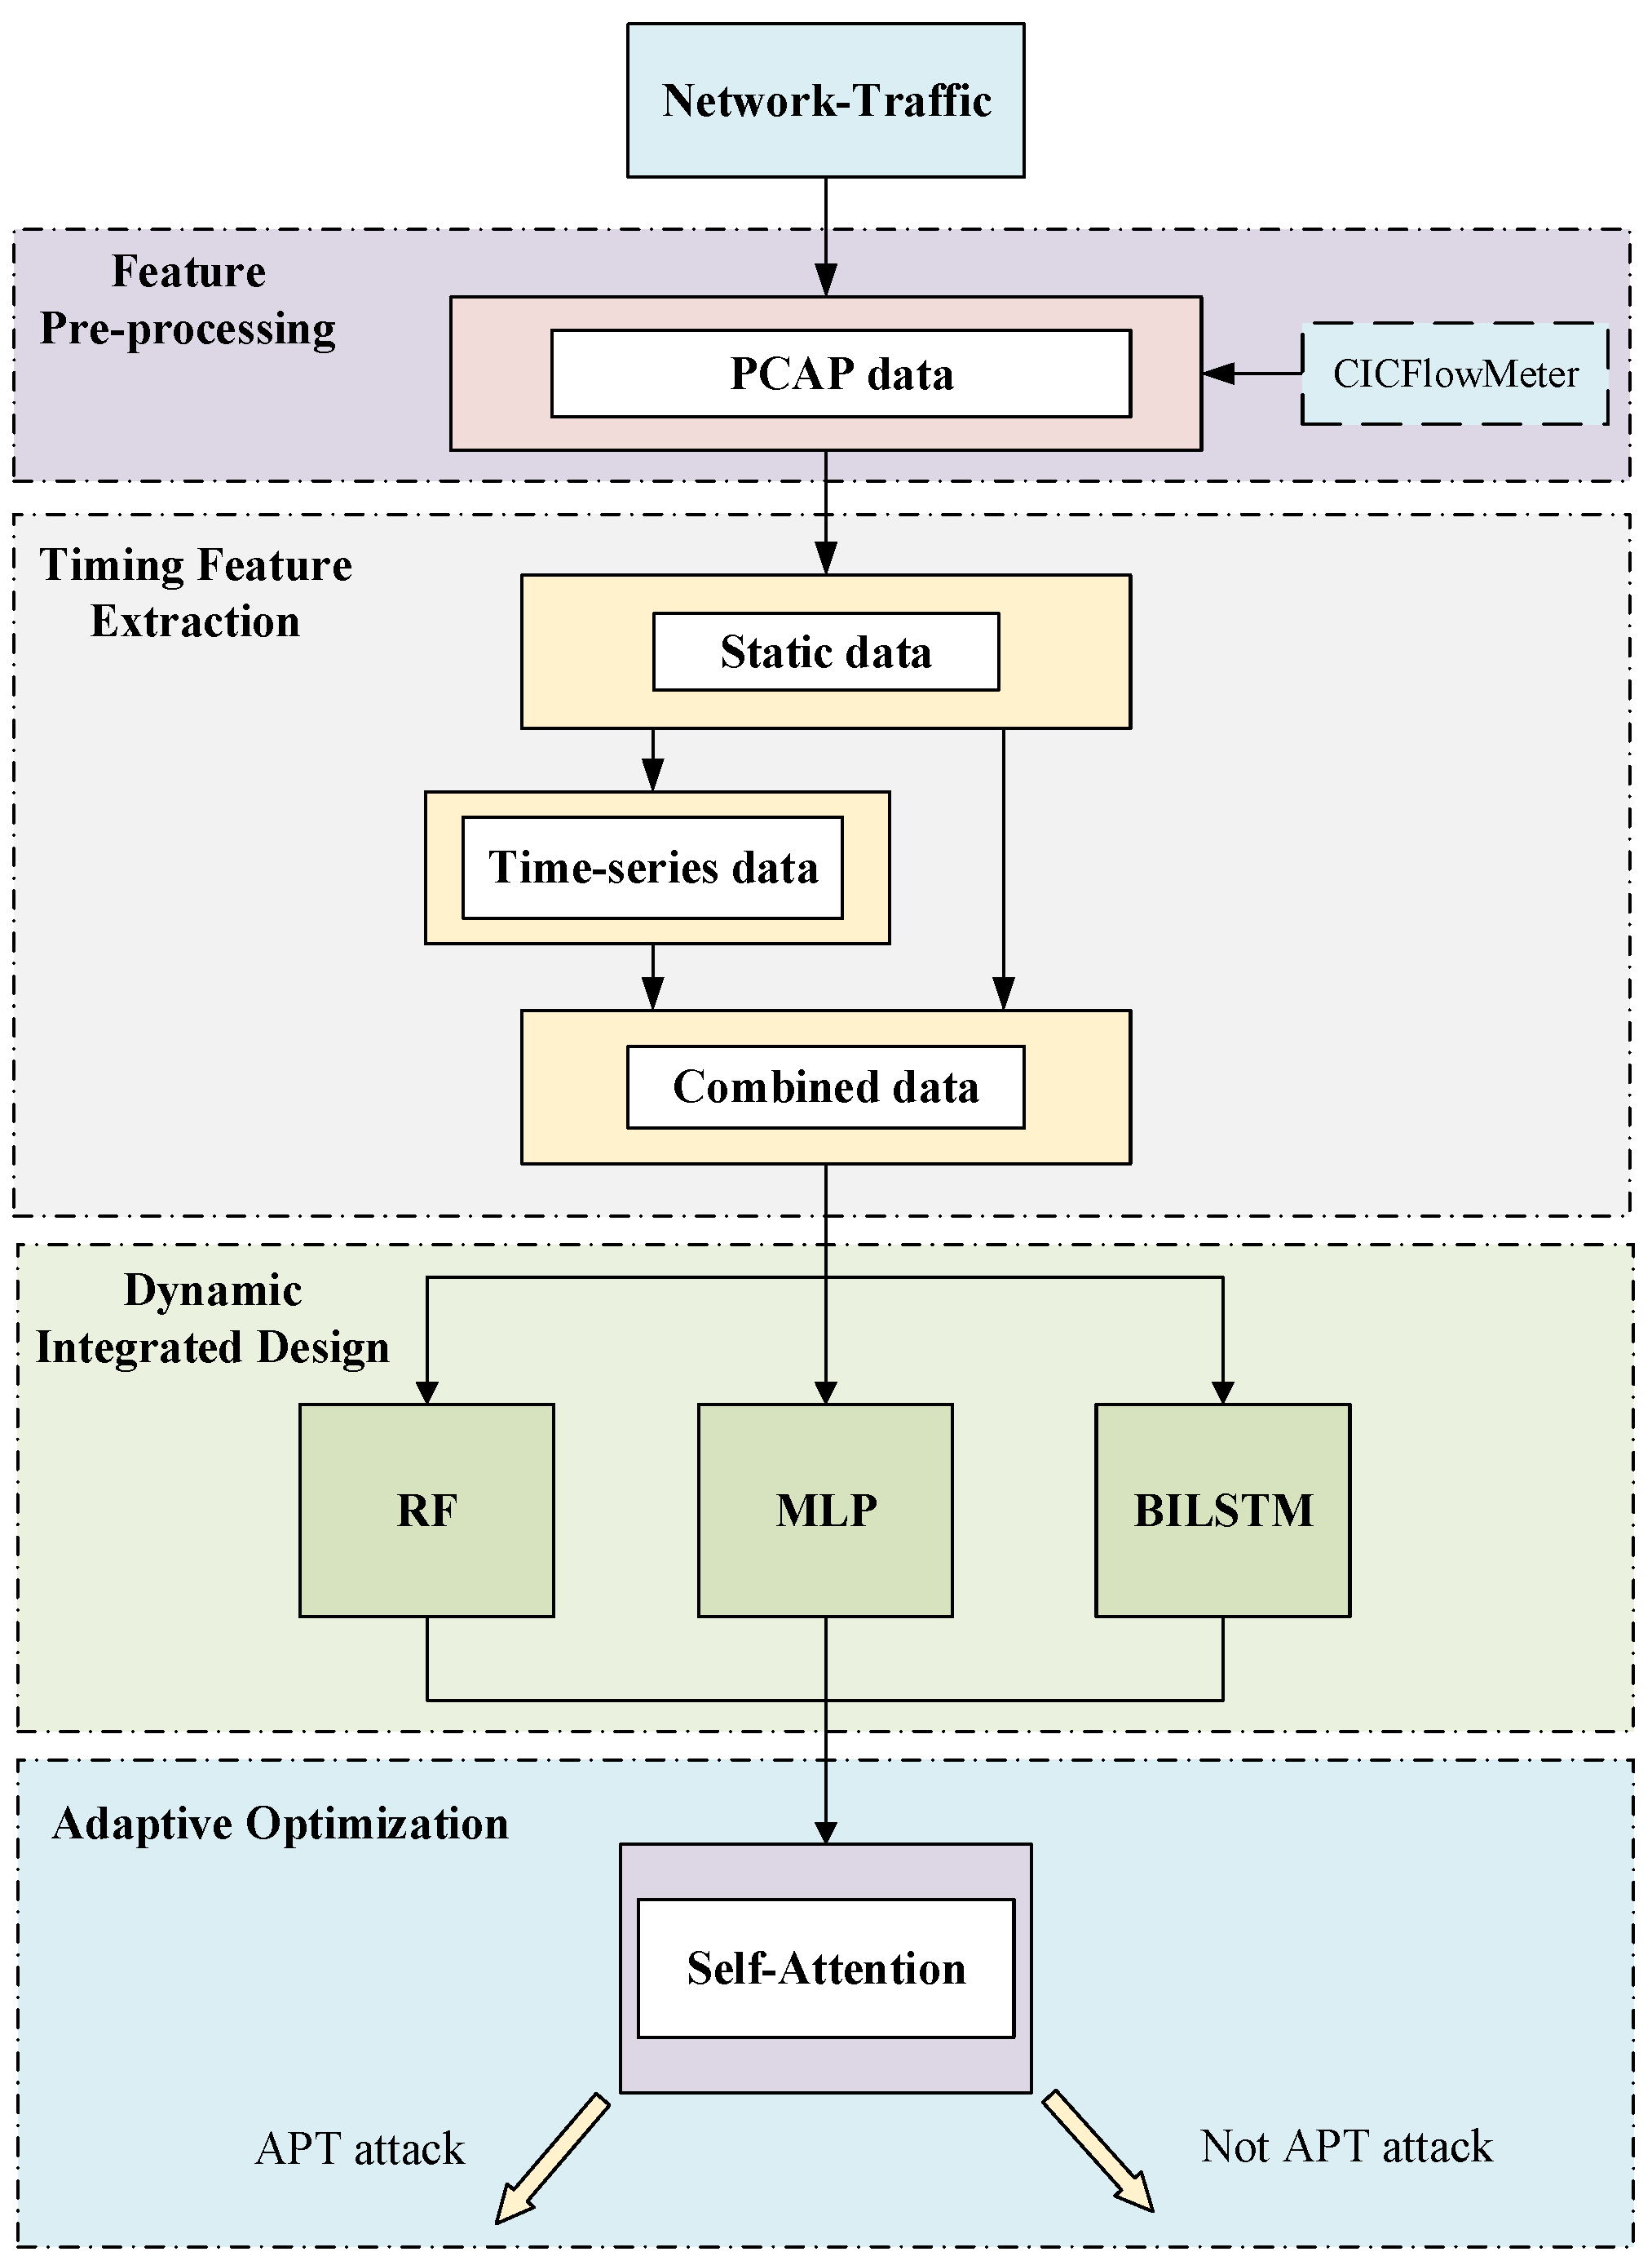
3. Materials and Methods

The TSE-APT detects malicious traffic and classifies various types of attacks. Our detection approach comprises four modules: data preprocessing, temporal feature extraction, dynamic integration design, and adaptive optimization. The system architecture is shown in Figure 1.
Feature Preprocessing: Convert the collected .pcap data into a .csv file format, ensuring each data point is accurately labeled with its respective characteristics.
Temporal Feature Extraction: The collected static feature data are analyzed to drive and compute dynamic features. These static and dynamic features are integrated and standardized to create the feature set of the whole flow, ready for model training and detection.
Dynamic Integration Design: This module applies the technical principle of ensemble learning. Initially, the RF, MLP, and BiLSTM are trained. Subsequently, the trained models are integrated into the ensemble-learning module for training and prediction to enhance the accuracy and precision of detection.
Adaptive Optimization: This model employs a dynamic weight allocation mechanism to optimize the integrated design framework. By leveraging a self-attention network to adjust the sub-model contributions, it enhances robustness and adaptability across different application areas.

3.1. Feature Preprocessing

The raw dataset in the paper’s experiment originates from the open benchmark data set CIC-IDS2018 in the field of cybersecurity. This dataset includes a range of attack types, including DDoS, brute-force cracking, SQL injection, botnets, and other APT-related threats [34]. The data are stored in .pcap files format. To facilitate the subsequent modules, such as time-series feature extraction and ensemble learning, the module incorporates the following steps:
The initial step involves analyzing and extracting flow features. In this study, the CICFlowMeter is utilized to extract the 79-dimensional features from the original .pcap file [35]. These features are tailored for APT detection, including basic flow features (e.g., source port, destination port, source IP, destination IP, protocol type, etc.) and refined flow features (e.g., field length, transmission time, flow information, etc.).
The second step involves further classifying the stream’s features. In this study, we categorize the features based on their timestamps and protocol ports. The data are reorganized into a sequence of sliding windows with a fixed window length of 15 min and a sliding step length of 1 min. Next, the Label column is adjusted; any malicious attacks in the window will be marked as positive.
The third step involves organization the overall static feature data. First, we process the missing value, including the zero-value filling and deletion strategies (e.g., more than 80% of a feature is missing). Next, redundant or invalid features are removed. Finally, the features are standardized in format, including standardized timestamps, label encoding of protocols.
After these steps, the static feature data are normalized. Laying the foundation for the efficient computation and deep integration analysis of time-series features.

3.2. Temporal Feature Extraction

3.2.1. Packer Arrival Interval (IAT, Fwd IAT, Bwd IAT)

IAT refers to the time interval between consecutive packets in the network. Fwd and Bwd denote the two directions, representing the network server and client. During an APT attack, the attacker may generate low-frequency, intermittent malicious traffic, serving as a critical indicator for detecting such attacks.
Calculation: for consecutive Xi and Xi+1, their IAT can be derived by calculating their timestamps:
I A T = T i + 1 T i
Ti+1 and Ti are timestamps of packet i and packet i+1, respectively. Similarly, Fwd IAT and Bwd IAT are calculated.
A comparison of their IAT distributions highlights the differences in IAT characteristics between normal traffic and attack traffic.
Figure 2 illustrates the distribution of IAT for benign and XSS traffic samples. As shown in the figure, benign traffic exhibits significantly larger and more stable IAT values, reflecting regular and continuous communication behavior. In contrast, XSS traffic demonstrates notably lower and more variable IAT values, indicating frequent and bursty packet transmissions. This pattern is not limited to XSS attacks; similar IAT behavior has been observed in other APT scenarios, such as data exfiltration or stealthy remote access sessions. Therefore, IAT serves as a strong and generalizable indicator of abnormal timing patterns across different attack types.

3.2.2. Flow Rate Change Within the Sliding Window (FRC)

APT attacks often cause notable fluctuations in network traffic as they unfold. Consequently, traffic change reflects the change in packet transmission rate, serving as a critical time-series feature for detecting APT attacks. It helps capture the behavior of attackers within the network.
Calculation:
F R C = X t + 1 X t Δ t
where Xt represents the flow rate (Flow Byte/s) at moment t, Δt is the time interval set to 1 min.
Figure 3 illustrates the distribution of FRC values for benign and DoS traffic samples. As shown in the figure, benign traffic exhibits consistently low and stable FRC values, indicating smooth and regular network usage with minimal fluctuations in traffic rate over time. In contrast, DoS traffic exhibits significantly higher and more dynamic FRC values, indicating sudden and intense flow rate changes characteristic of burst attacks. This pattern aligns with the nature of DoS attacks, which typically generate large volumes of traffic in a short period. The distinct separation between these patterns demonstrates that FRC effectively captures traffic anomalies and distinguishes malicious behavior from normal activity.

3.2.3. Flow Variance of the Flow Within the Window (FV)

The variance of the traffic indicates the extent of its traffic fluctuates over a period. APT attacks can trigger higher traffic fluctuations. By analyzing traffic variance, we could identify sudden changes in traffic patterns.
Calculation:
F V = 1 n i = 1 n X i μ 2
where Xi is the flow data (Flow Byte/s) during the period, µ is the mean value of the flow during the period, and n is the number of samples during the period.
Figure 4 illustrates the distribution of FV values for benign and DoS traffic samples. Benign traffic maintains low FV values, typically below 10, indicating steady and predictable communication with minimal variation in traffic volume. In contrast, DoS traffic exhibits significantly higher FV values ranging from over 1000 to nearly 10,000, highlighting drastic and unstable changes in flow behavior. These higher variance values reflect the bursty nature of such attacks, where traffic surges occur in short bursts, causing dramatic changes in the overall traffic pattern. The clear separation between the curves validates FV as a reliable feature for identifying abnormal network behavior, particularly in detecting DoS attacks characterized by erratic and high-volume traffic patterns.

3.2.4. Flow Variance of the Flow Within the Window (F2)

APT attacks often employ specific flag bit patterns to obscure the traits of malicious traffic. The frequency characteristics of flag bits, such as SYN, ACK, and FIN, indicate how often these flags appear in the attack traffic. By analyzing variations in flag bits, the attacker’s behavior and strategy can be more effectively revealed.
Calculation:
F 2 = Count Δ t
Flag Count refers to the frequency with which a specified flag bit (e.g., FIN, ACK, etc.) appears, and Δt is the time interval for that traffic packet.
Figure 5 illustrates the distribution of F2 values for benign and Bot traffic samples. As the figure shows, benign traffic maintains consistently low F2 values primarily ranging from 0.01 and 1indicating normal and balanced usage of TCP flags such as SYN, ACK, and FIN during regular communication. In contrast, Bot traffic exhibits sharply elevated and highly oscillating F2 values, ranging from over 100 to nearly 1500. This pattern reveals excessive or repetitive use of specific flag bits, which often reflects automated, scripted communication typical of botnet behavior. Such abnormal frequency likely reflects attempts by the attacker to manipulate TCP flag behavior to avoid detection or to control botnet communication. The sharp contrast between the two curves confirms that F2 is an effective feature for capturing low-level protocol anomalies and distinguishing botnet-based malicious activity from legitimate traffic.
After integrating static features with time-series features, the feature space dimension has increased significantly. While this dimension can provide rich knowledge, it raises computational complexity, particularly with large-scale traffic data in real-world scenarios. This leads to reduced training and reasoning ability and may cause model overfitting. To address these challenges, this paper standardizes the data.
Each dimension is treated as follows:
X n e w = x μ S t d X
where x is the original data, µ is the mean of the data, Std(X) is the standard deviation of the data, and Xnew is the post-standardized data.
The feature dimension expands significantly when static data are combined with the four temporal features mentioned earlier. Standardization enhances the ability to recognize abnormal phases. During the virus latency and data theft phase of an APT attack, there will be a large number of traffic changes. Analyzing these changes allows for effective stage differentiation and helps reduce the false-alarm rate. Moreover, integrating these features facilitates the detecting of hidden or disguised attack patterns, commonly employed in APT. The ability to identify subtle variations in network traffic, such as attack patterns masked within normal behavior, plays a crucial role in uncovering malicious activities. Lastly, data standardization accelerates convergence speed and improves accuracy, enabling the model to quickly capture traffic anomalies.

3.3. Ensemble-Learning Module Design

The dynamic integration is designed to merge multiple sub-models for APT attack detection. It adjusts the contribution of different models based on real-time environmental changes, especially when dealing with complex attack strategies and long-term attack cycles, enhancing the accuracy and robustness of detection results.
This paper divides the integrated learning module into three parts:

3.3.1. Sub-Model Training

RF [36], MLP, and BiLSTM [37] serve as base models. Each model is independently trained, leveraging its unique characteristics and advantages. Classification detection tasks are conducted on the datasets, and the preliminary test results are generated.
RF is a collection of decision trees adept at handling high-dimensional structured data and extracting critical features. Consequently, datasets with an unbalanced distribution or a large number of features can be effectively processed. In intrusion detection, RF efficiently identifies each characteristic attribute for selection and detection.
To enhance the speed and efficacy of the RF model, mutual information is first utilized to eliminate irrelevant features prior to training. This step reduces computation and improves model stability. Following feature selection, a grid search strategy is employed to optimize the parameters of the RF model, such as the number of trees and maximum tree depth. This approach ensures an optimal balance between model complexity and generalization performance. The overall configurations of RF parameters are shown in Section 4.1.3.
MLP is a fully connected feedforward neural network capable of learning abstract representations from data. It effectively preserves global attention within datasets and works well with standardized digital network traffic features. Additionally, MLP can effectively learn features of network traffic and intrusion detection.
We employ a residual MLP architecture, where each hidden layer block includes a skip connection, allowing the input to bypass the transformation and be directly added to the output. This design addresses vanishing gradient issues and facilitates deeper network training. Additionally, each block utilizes Dropout to reduce overfitting and Layer Normalization to stabilize the learning process. Lastly, we replace the traditional ReLU activation with the GELU function, which ensures smoother gradient flow and has demonstrated superior performance compared to ReLU in modern deep learning models. These enhancements collectively improve the model’s ability to learn complex patterns in network traffic and contribute to more robust APT attack detection. The overall configurations of residual MLP parameters are shown in Section 4.1.3.
BiLSTM captures temporal characteristics by learning the dependencies both before and after the data, making it particularly effective for analyzing network traffic. The context within the time window can uncover critical insights into the attack phase. It is particularly suitable for identifying APT’s common invisibility and time-dependent behavior patterns.
We utilized a hybrid BiLSTM-CNN architecture to effectively model both global temporal dependencies and local traffic patterns. The BiLSTM captures long-range contextual information from the input sequence, while the subsequent CNN layer focuses on extracting localized, bursty behaviors commonly found in multi-stage APT attacks. An adaptive max pooling layer is utilized to summarize the sequence into a compact representation for final classification. This integrated design enhances robustness against noise and enhances detection of subtle, stage-based attack traces. The detailed configurations of BiLSTM-CNN parameters are shown in Section 4.1.3.
The framework benefits from complementary advantages by integrating three models: RF ensures interpretability and robustness for static features, MLP captures abstract representation, and BiLSTM captures time dependence in network traffic. This diversity enhances detection accuracy and reduces the false-alarm rate.

3.3.2. Self-Attention Mechanism

During the integration phase, a self-attention network assigns weights to the model’s output. The attention mechanism automatically adjusts each model’s weight according to real-time network traffic.
The self-attention mechanism algorithm is delineated in Algorithm 1. Given the dimension X, the prediction P[m] of each model, and the number of attention heads H, the output of Algorithm 1 will be the probability that malicious traffic is predicted. First, converting a single traffic feature to Query, Key, and Value. Using multi-head self-attention to capture the correlation between different semantic spaces, obtaining a global context representation C. Subsequently, extract a confidence vector γ from the process where the FC layer receives the probability vector P from sub-models. Then it applies a linear transformation to project P into a higher-dimensional embedding. This transformation enables the model to learn a latent representation of the relative confidence or consistency among base model predictions. After combining the two, they are sent to the weight generator, which outputs the normalized weight ω. This weight is used to measure the relative reliability of the three base models on the current sample. The final prediction Y is obtained by weighted summation of P[m] and ω.
Algorithm 1 Self-attention mechanism
Input: Dimension X, prediction P[1], P[2], P[3], number of attention heads H
Output: final malicious-probability Y
1.Q←WQ·X/* Query vector */
2.K←WK·X/* Key vector*/
3.V←WV·X/* Value vector*/
4.for h in H do
5.   α h = softmax Q h K h d
6.   C h = α h V h
7.end for
8.C←concat(C1 … CH)
9.γ←FC (P)/*self-confidence*/
10.Ĉ←C ⨁ γ/*concatenation*/
11.ω←Softmax( FCw(Ĉ))/*weight-generator*/
12. Y = m = 1 M ω m P [ m ]
When detecting current traffic, it assigns greater weights to more accurate data, thereby enhancing the accuracy of ensemble learning.

3.3.3. Meta-Model Further Optimization

The meta-model integrates the outputs of the sub-models and employs the XGBoost algorithm to make a weighted combination for the final prediction [38].
XGBoost, based on Gradient Boosted Decision Tree (GBDT), incorporates functions such as regularization, pruning, and parallelization to efficiently capture complex nonlinear features while minimizing costs. It serves as a base learner in network traffic detection, isolating different behaviors and distinguishing normal traffic from attack traffic, achieving high accuracy for APT attack-detection tasks [39].
In our ensemble architecture, the self-attention mechanism adaptively assigns weights to the base model’s predictions based on input features and confidence scores. These weighted predictions are then fed into an XGBoost classifier, acting as a meta-learner to make the final decision. Together, attention and XGBoost operate in a cascaded manner: the attention mechanism enhances the reliability of base model outputs, while XGBoost captures nonlinear interactions to improve final classification accuracy.

4. Experimental Analysis

4.1. Experimental Configuration

4.1.1. Experimental Environment

This paper conducted all experiments on a computer configured with Intel i5-13500HX, 16 GB RAM (Intel Corporation, Santa Clara, CA, USA), and NVIDIA RTX 4060 graphics card (Nvidia Corporation, Santa Clara, CA, USA). The deep learning model uses PyTorch version 2.1.1, and the machine-learning part uses Scikit-learn and the XGBoost library. The operating system is Windows 11, and the Python version is 3.11.
To present the evaluation results, five representative metrics were utilized, namely “accuracy”, “precision”, “recall”, “F1 score”, and “false-positive rate” (also known as false positive rate). The definitions of these five metrics are shown in Table 1. Specifically, a true positive (i.e., “TP”) indicates that a malicious attack was successfully detected; A true negative (i.e., “TN”) indicates that the method under study successfully detected benign activity. On the other hand, if a malicious attack is incorrectly detected as benign process activity (i.e., false negatives, or “FN”), or if benign process activity is classified as malicious (i.e., false positives, or “FP”), the classification result is considered false. Additionally, the F1 score, widely used to evaluate test accuracy. Represents the harmonic average of precision and recall, with an optimal value of 1.

4.1.2. Experimental Data

This paper utilizes 5,000,000 traffic data points from 10 traffic files within the CIC-IDS2018 dataset, comprising 2,830,000 malicious traffic instances and 2,170,000 normal traffic instances. The dataset is divided into a training set (80%), a validation set (10%), and a test set (10%). We ensure that the sample distribution in each set is as balanced as possible to avoid bias between the training and test sets. Cross-validation is applied to all data to enhance the model’s generalization ability. The distribution of the experimental data is shown in Table 2.

4.1.3. Classification of Experiments

To ensure the reproducibility of our experiments and fair comparison across models, we summarize the key hyperparameters and their corresponding search spaces for each model used in this study, including RF, MLP, BiLSTM, XGBoost, and the self-attention mechanism. As shown in Table 3. The selected values, derived either from prior literature or via grid search optimization, were applied consistently throughout all experiments.

4.1.4. Model Training Process

This section discusses the training process and evaluation results of the RF, MLP, and BiLSTM models. All models are trained using both static and time-series features. To ensure a fair comparison, we used the optimal hyperparameter configuration detailed in Section 4.1.3.
To comprehensively evaluate model performance, we reported ROC curves, precision–recall curves, and confusion matrices for each model. These metrics enable visualization of classification capabilities from diverse perspectives.
Figure 6 presents the evaluation results of the three models. All models demonstrate high AUC values and exhibit strong classification performance, effectively distinguishing between benign and malicious traffic. In particular, the confusion matrix shows a clear diagonal advantage, indicating high accuracy.

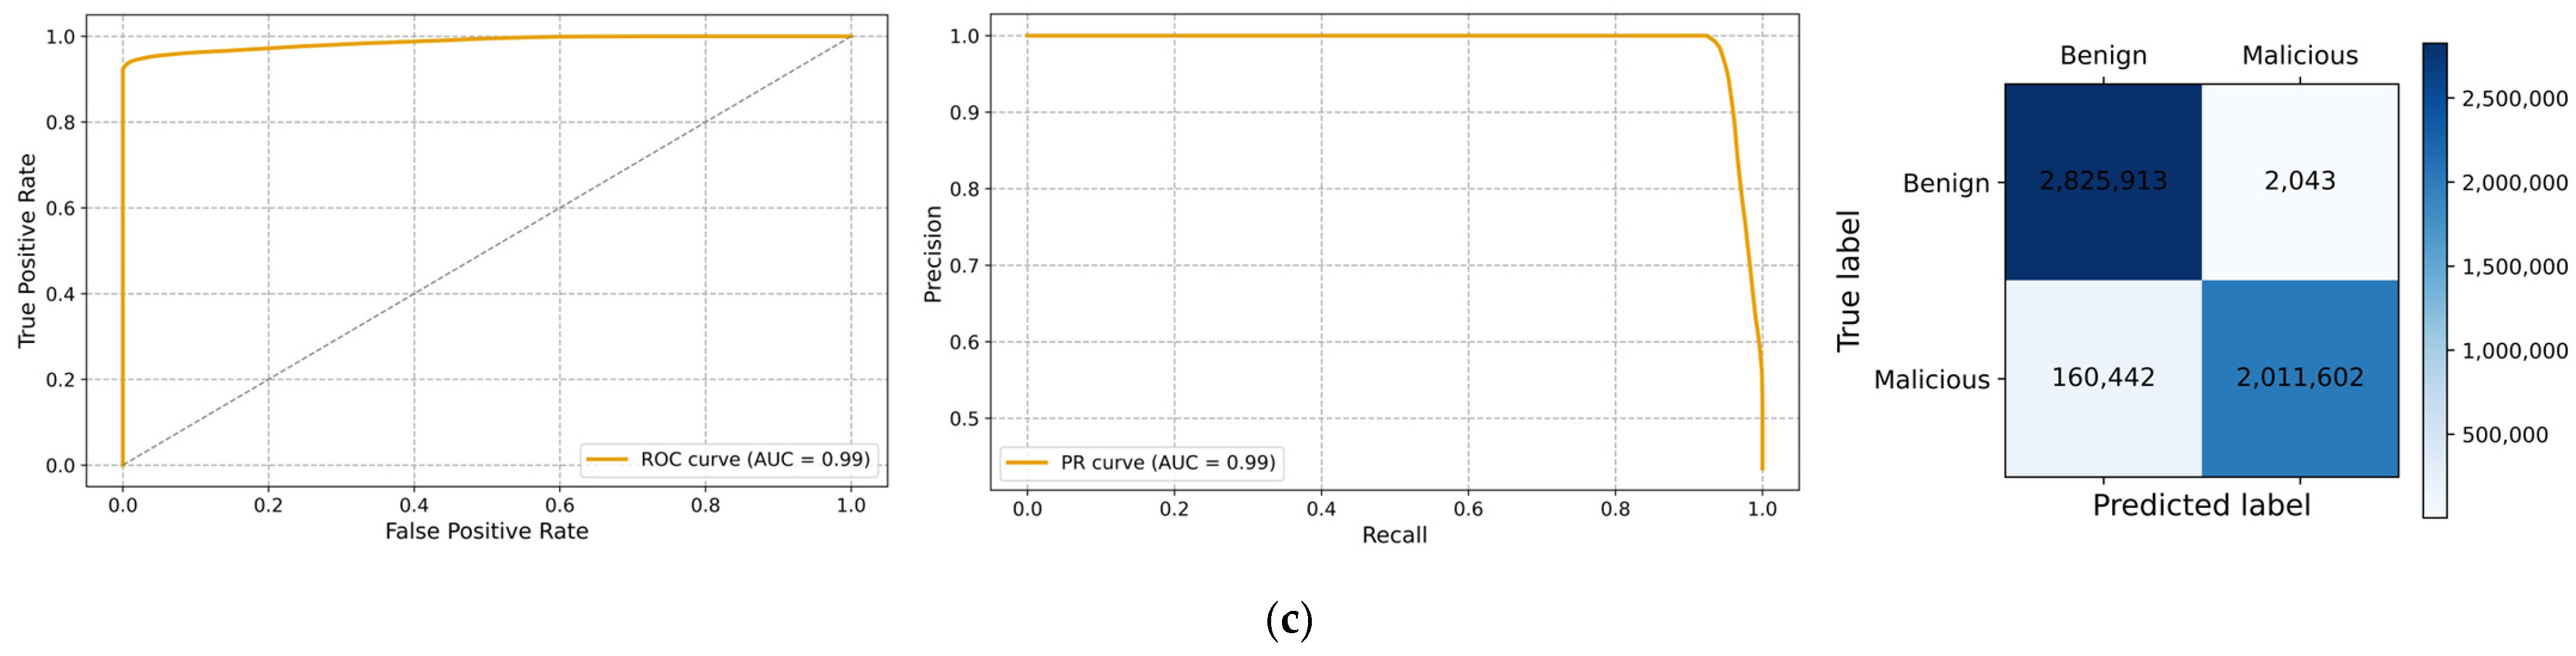
4.2. Performance Evaluation

4.2.1. Introducing Time-Series Detection Efficiency

Table 4 presents the experimental results of incorporating new temporal features for detecting network traffic-based APT attacks, with three models trained simultaneously. As demonstrated in Table 4, the introduction of temporal features significantly improves the overall metrics of all three algorithms. Compared to static features, the accuracy, precision, recall, F1 score, and false positive rate show significantly improvements, particularly in accuracy and recall. This indicates that temporal features make APT attack traffic characteristics more apparent, helping identify the low-frequency behaviors while reducing false positives and omissions.
In model selection, utilizing the time-series dataset significantly enhances the comprehensive indicators across all three models. BiLSTM effectively captures long-term dependencies, whereas RF and MLP exhibit a limited ability to identify continuous patterns. Consequently, BiLSTM performs better than other models in terms of accuracy, F1 score, and false positive rate.
To ensure that the observed performance improvements were not attributed to random variation, we performed McNemar tests on three models, as presented in Table 5. The results of all pairwise comparisons (RF vs. MLP, RF vs. BiLSTM, MLP vs. BiLSTM) yielded statistically significant p-values (p < 0.001), suggesting that the observed performance gains were robust and not accidental. It is concluded that the combination of temporal features can not only enhance model performance but also yield consistent and significant improvements across different model architectures.

4.2.2. Ensemble-Learning Model Detection Efficiency

Table 6 presents a comparison of optimization results for the APT attack-detection model, which is based on ensemble learning (integration of logistic regression, XGBoost, and self-attention mechanism) with the performance of the individual baseline model. The experimental findings indicate that the ensemble-learning model significantly performs better than the single baseline model in several metrics. The XGBoost and the self-attention mechanism outperform BiLSTM, the highest-performing individual baseline model in all evaluated metrics.
Table 6 illustrates that the self-attention mechanism outperforms the other two algorithms in terms of accuracy, recall, and F1 score. The self-attention mechanism enhances the ability to sense long-term attack patterns. As a result, it boosts both detection accuracy and recall, while strengthening feature discrimination against attacks.

4.2.3. Ablation Studies on the Method Components

In this section, we evaluate the impact of incorporating additional components into our method, specifically time-series features and the self-attention mechanism. The results of the ablation experiments are shown in Table 7.
Excluding the self-attention mechanism leads to a notable performance decline. With the F1-score dropping from 97.51% to 96.36%, and recall decreasing to 94.56%. The self-attention mechanism enables the model to dynamically focus on the most relevant features, and its removal can compromise the ability to detect complex attack patterns.
Furthermore, removing the ensemble-learning structure results in a slight decline in performance, with accuracy dropping to 96.78% and recall decreasing to 94.06%. This highlights that integrating multiple models enables the system to benefit from different types of feature learning, thereby enhancing its robustness.
When the time-series features are removed, the model’s accuracy drops to 94.50%, while recall decreases to 91.61%, indicating the critical role of temporal dynamics in identifying APT behaviors. Without these sequential features, the model struggles to capture temporal dependencies across flows, leading to reduced detection performance.

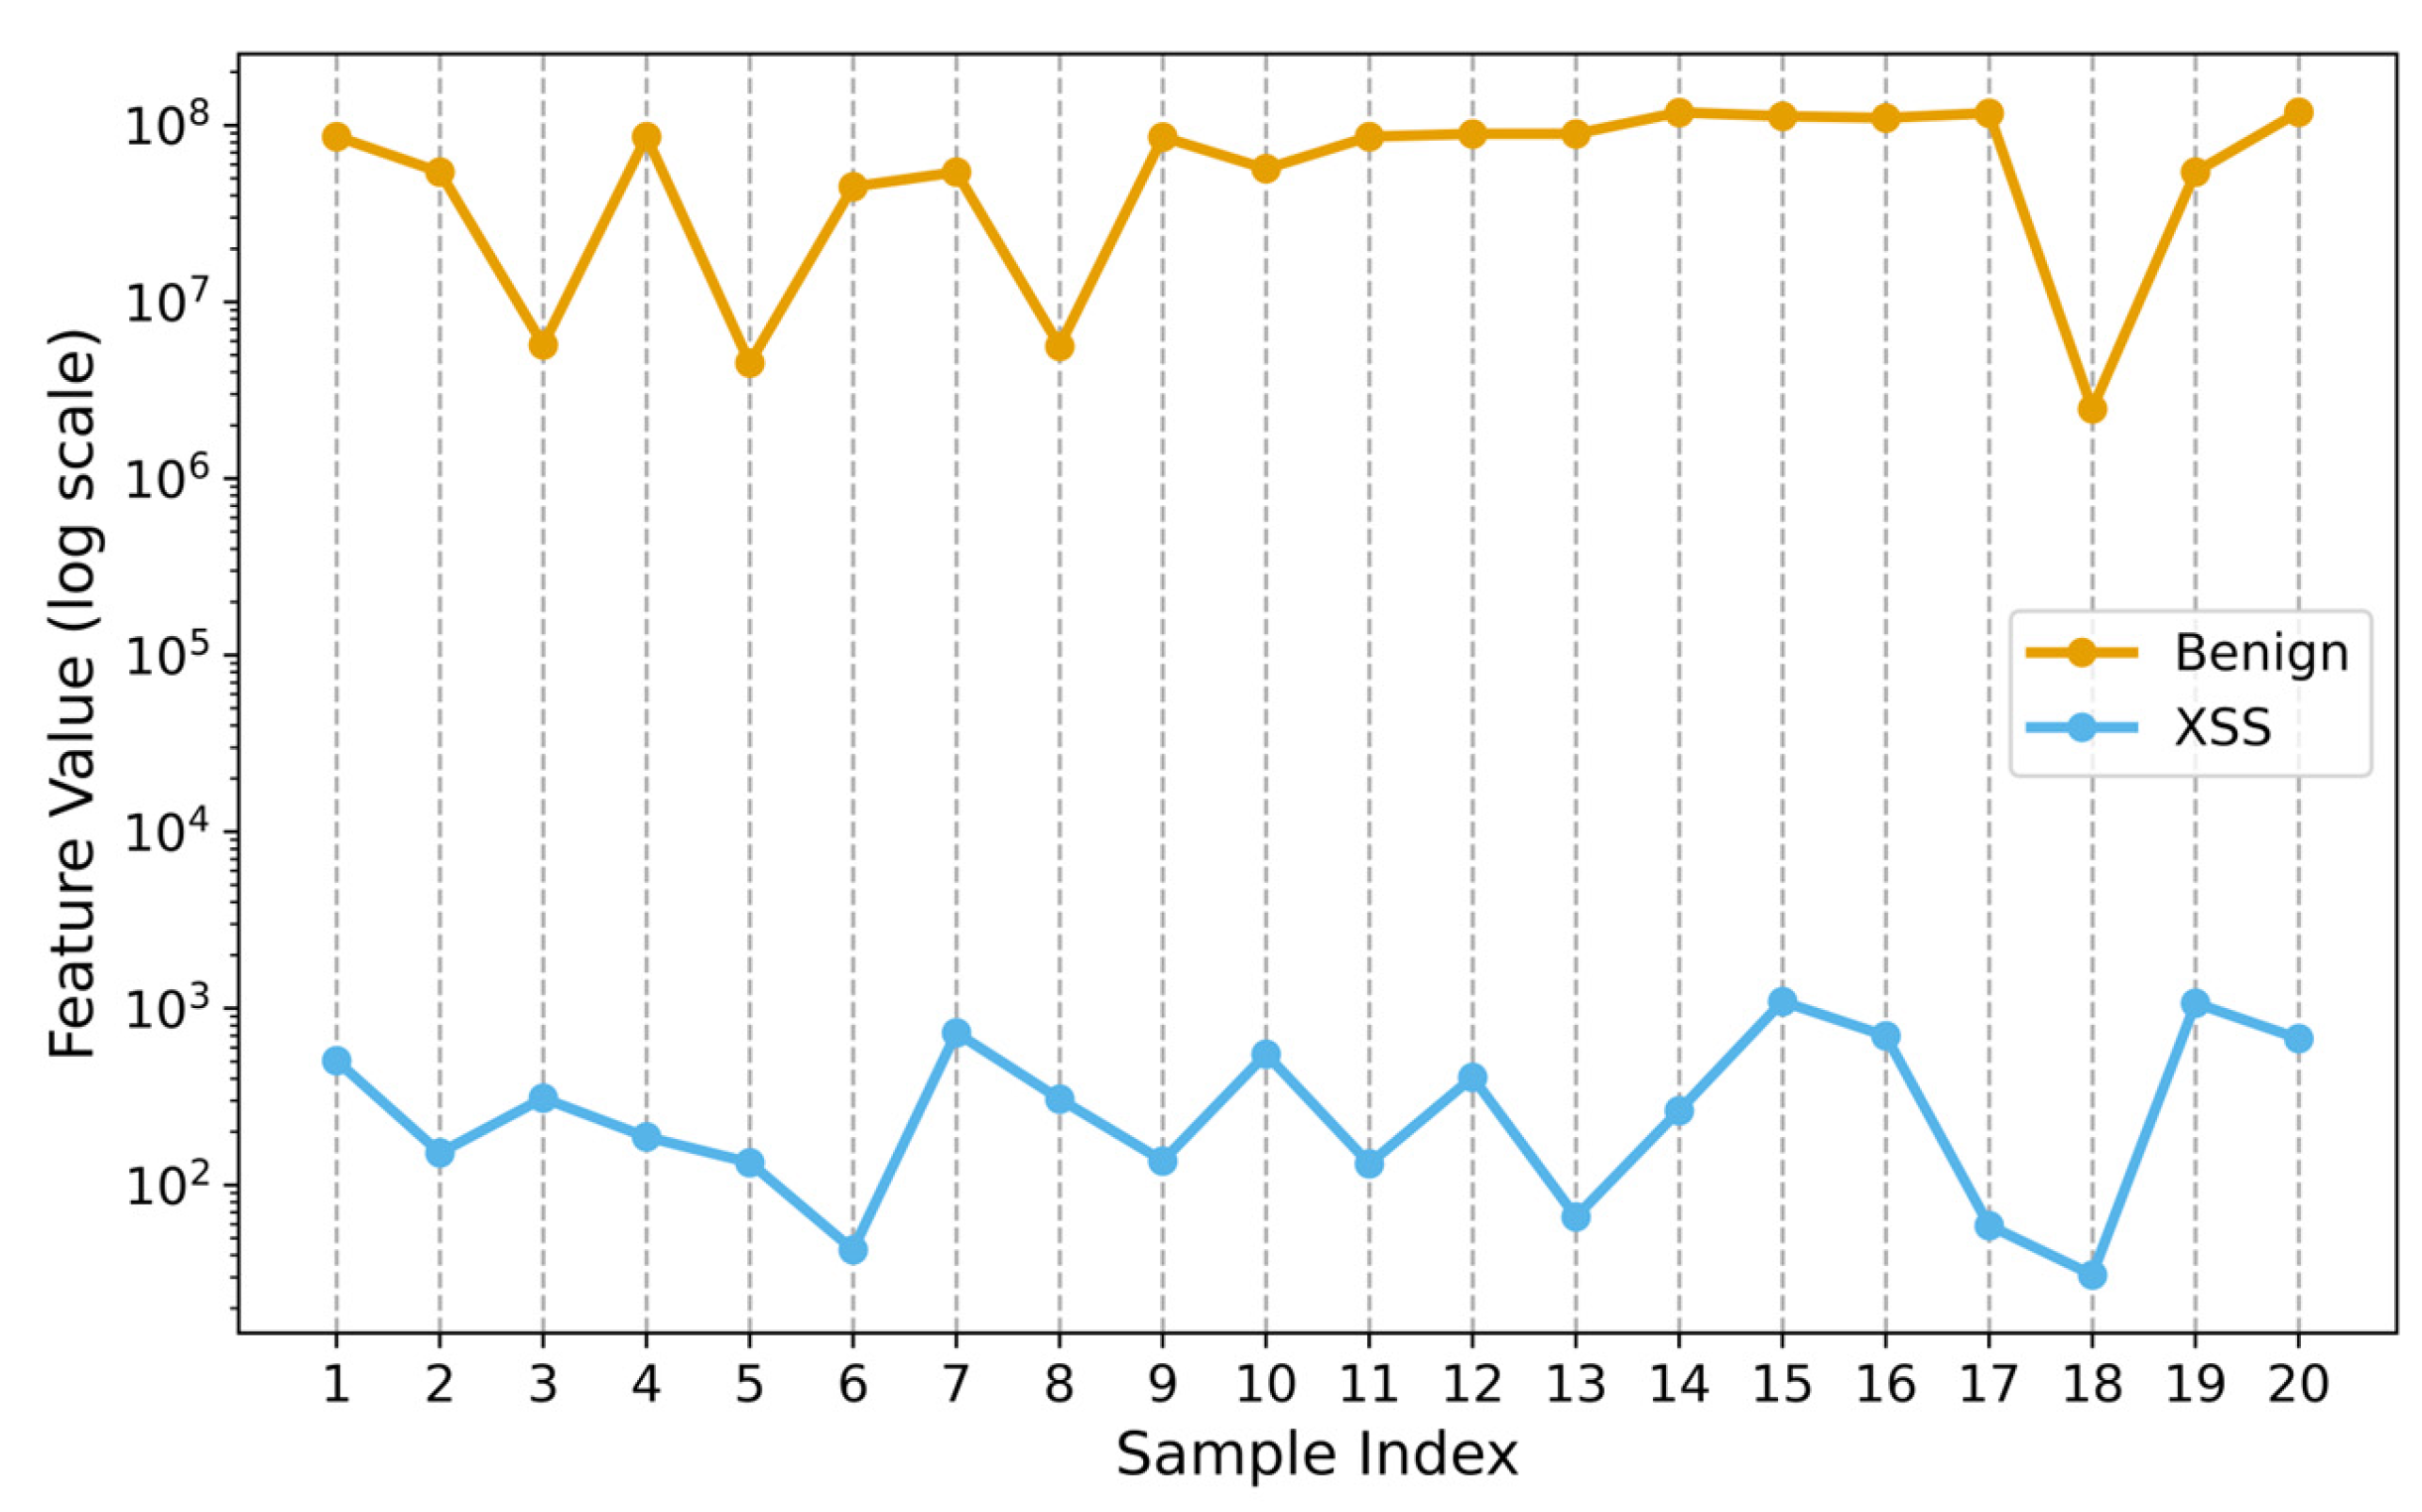
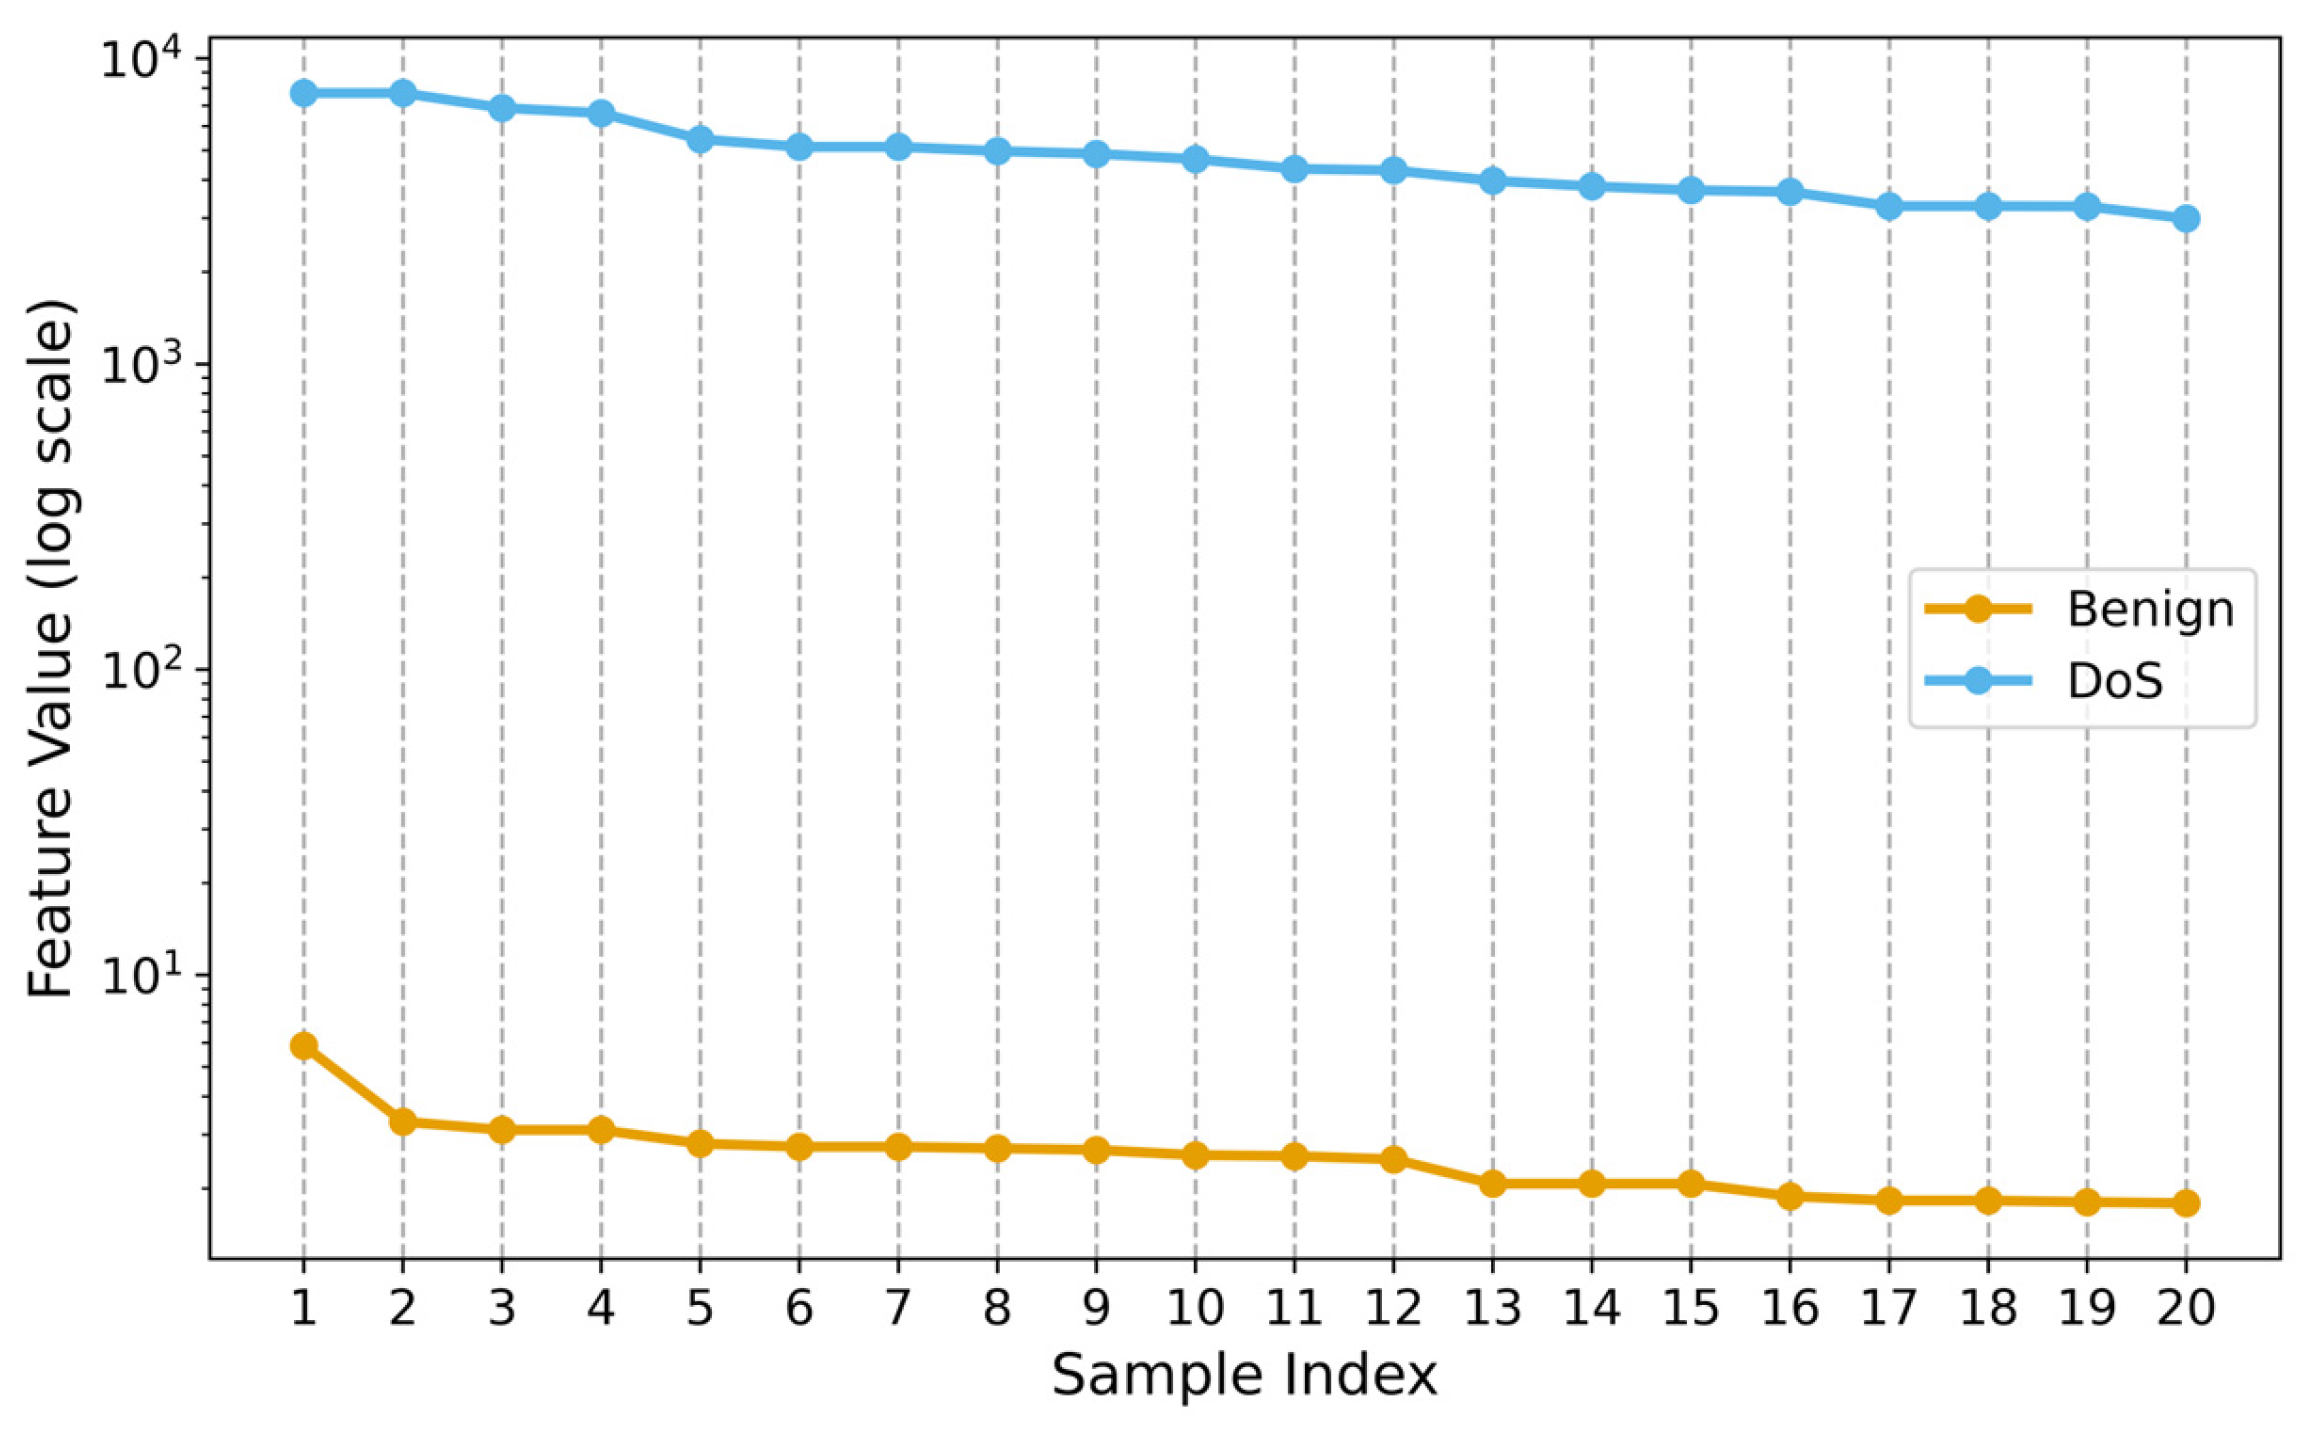
4.2.4. Feature Importance Analysis

To gain deeper insight into the model’s predictive process, we utilized SHAP to evaluate the impact of each feature.
As shown in Figure 7, features like FRC and FV exhibit relatively high average SHAP values, indicating their critical role in identifying APT traffic. These features reflect flow-level behavior patterns, effectively highlighting anomalies in transmission consistency and variability.
In addition, Fwd Seg Size Min, Fwd Pkt Len Max, and Pkt Size Avg also appear among the top contributors. They describe the size and distribution of the packet, which play a crucial role in network traffic interaction.
Finally, this SHAP-based analysis confirms our method and offers valid evidence supporting the integration of static and temporal features.

4.2.5. Comparison of Different Classification Methods

We compared our method with other approaches utilizing time-series or ensemble learning to detect APT attacks. The results shown in Table 8 demonstrate that our method is highly accurate in APT attack detection.

4.2.6. Overhead Analysis

Ensemble-learning models have been effectively deployed in numerous applications, including machine translation and object recognition. However, their computational and storage demand limit their use on high-end platforms. To address this, we evaluate TES-APT’s overhead in terms of run-time memory usage and inference latency.
All experiments were conducted on a workstation with an Intel i7 processor, 32 GB RAM, and an NVIDIA RTX 4060 GPU. The complete training process, including all three base models and the ensemble module, took approximately 840 s on the CIC-IDS2018 dataset. On average, each base model was trained independently in about 411 s. While the total training time is not minimal, it is acceptable considering the dataset’s size and the model’s high accuracy and F1-score. We will continue to achieve reliable real-time monitoring of system traffic in the future.
During inference, classifying a single flow or flow sequence requires only 1–2 milliseconds, with GPU memory usage consistently under 2.2 GB, ensuring the system is lightweight enough for practical deployment. Compared to lighter models, our method offers a better balance between detection effectiveness and resource efficiency, making it suitable for real-world APT detection tasks where accuracy is critical.

5. Discussion

5.1. Justification of the Dataset for APT Detection

In this paper, the CIC-IDS2018 dataset is used instead of the APT attack dataset as follows:
In contrast to an APT attack, characterized by its long-term, multi-stage attack designed to evade detection, the CIC-IDS2018 dataset captures all attacks that are short-lived and easier to detect. First, our primary goal is to analyze the wide range of network behaviors in the CIC-IDS2018 dataset, such as lateral movement and port scanning, which are also integral components in APT attacks and employed by adversaries. Additionally, the CIC-IDS2018 dataset comprises benign and malicious traffic generated from real-world applications, offering a rich feature set suitable for feature extraction and training learning to recognize complex attack behavior patterns. Finally, we also recognize that the detection of APT requires the evaluation of datasets that simulate long-term stealth behavior across stages. As part of our ongoing and future research, we intend to leverage APT-focused datasets such as DARPA TC or DARPA datasets to more thoroughly validate the model’s ability to deal with multi-stage persistent threats.

5.2. Discussion of Data-Processing

5.2.1. Design of Time Windows and Step Sizes

The 15-min sliding window was chosen because APT attacks are typically more covert and long-lasting, with different attack phases unlikely to occur simultaneously within a short timeframe. Therefore, a longer window, like 15 min, helps capture the context and maintain the time-based relationship between various attack actions.
The 1-min step size enhances the temporal resolution of the detection, allowing the model to catch earlier anomalous patterns during the sliding process and capture the beginning of the attack without omission.

5.2.2. The Dataset Seems to Be Unbalanced

Since the CIC-IDS2018 dataset contains about 2.83 million instances of attack traffic and about 2.17 million instances of normal traffic, this may cause an imbalance in the model prediction.
First, we use Stratified Split to ensure that the ratio of samples across the training, test, and validation sets is maintained. In addition, we monitor F1 scores and FPR in real time to prevent manipulative tricks. For the RF model, we also set the balance settings to the dataset. It can be concluded that the probability of prediction imbalance becomes minimal after the dataset is balanced.

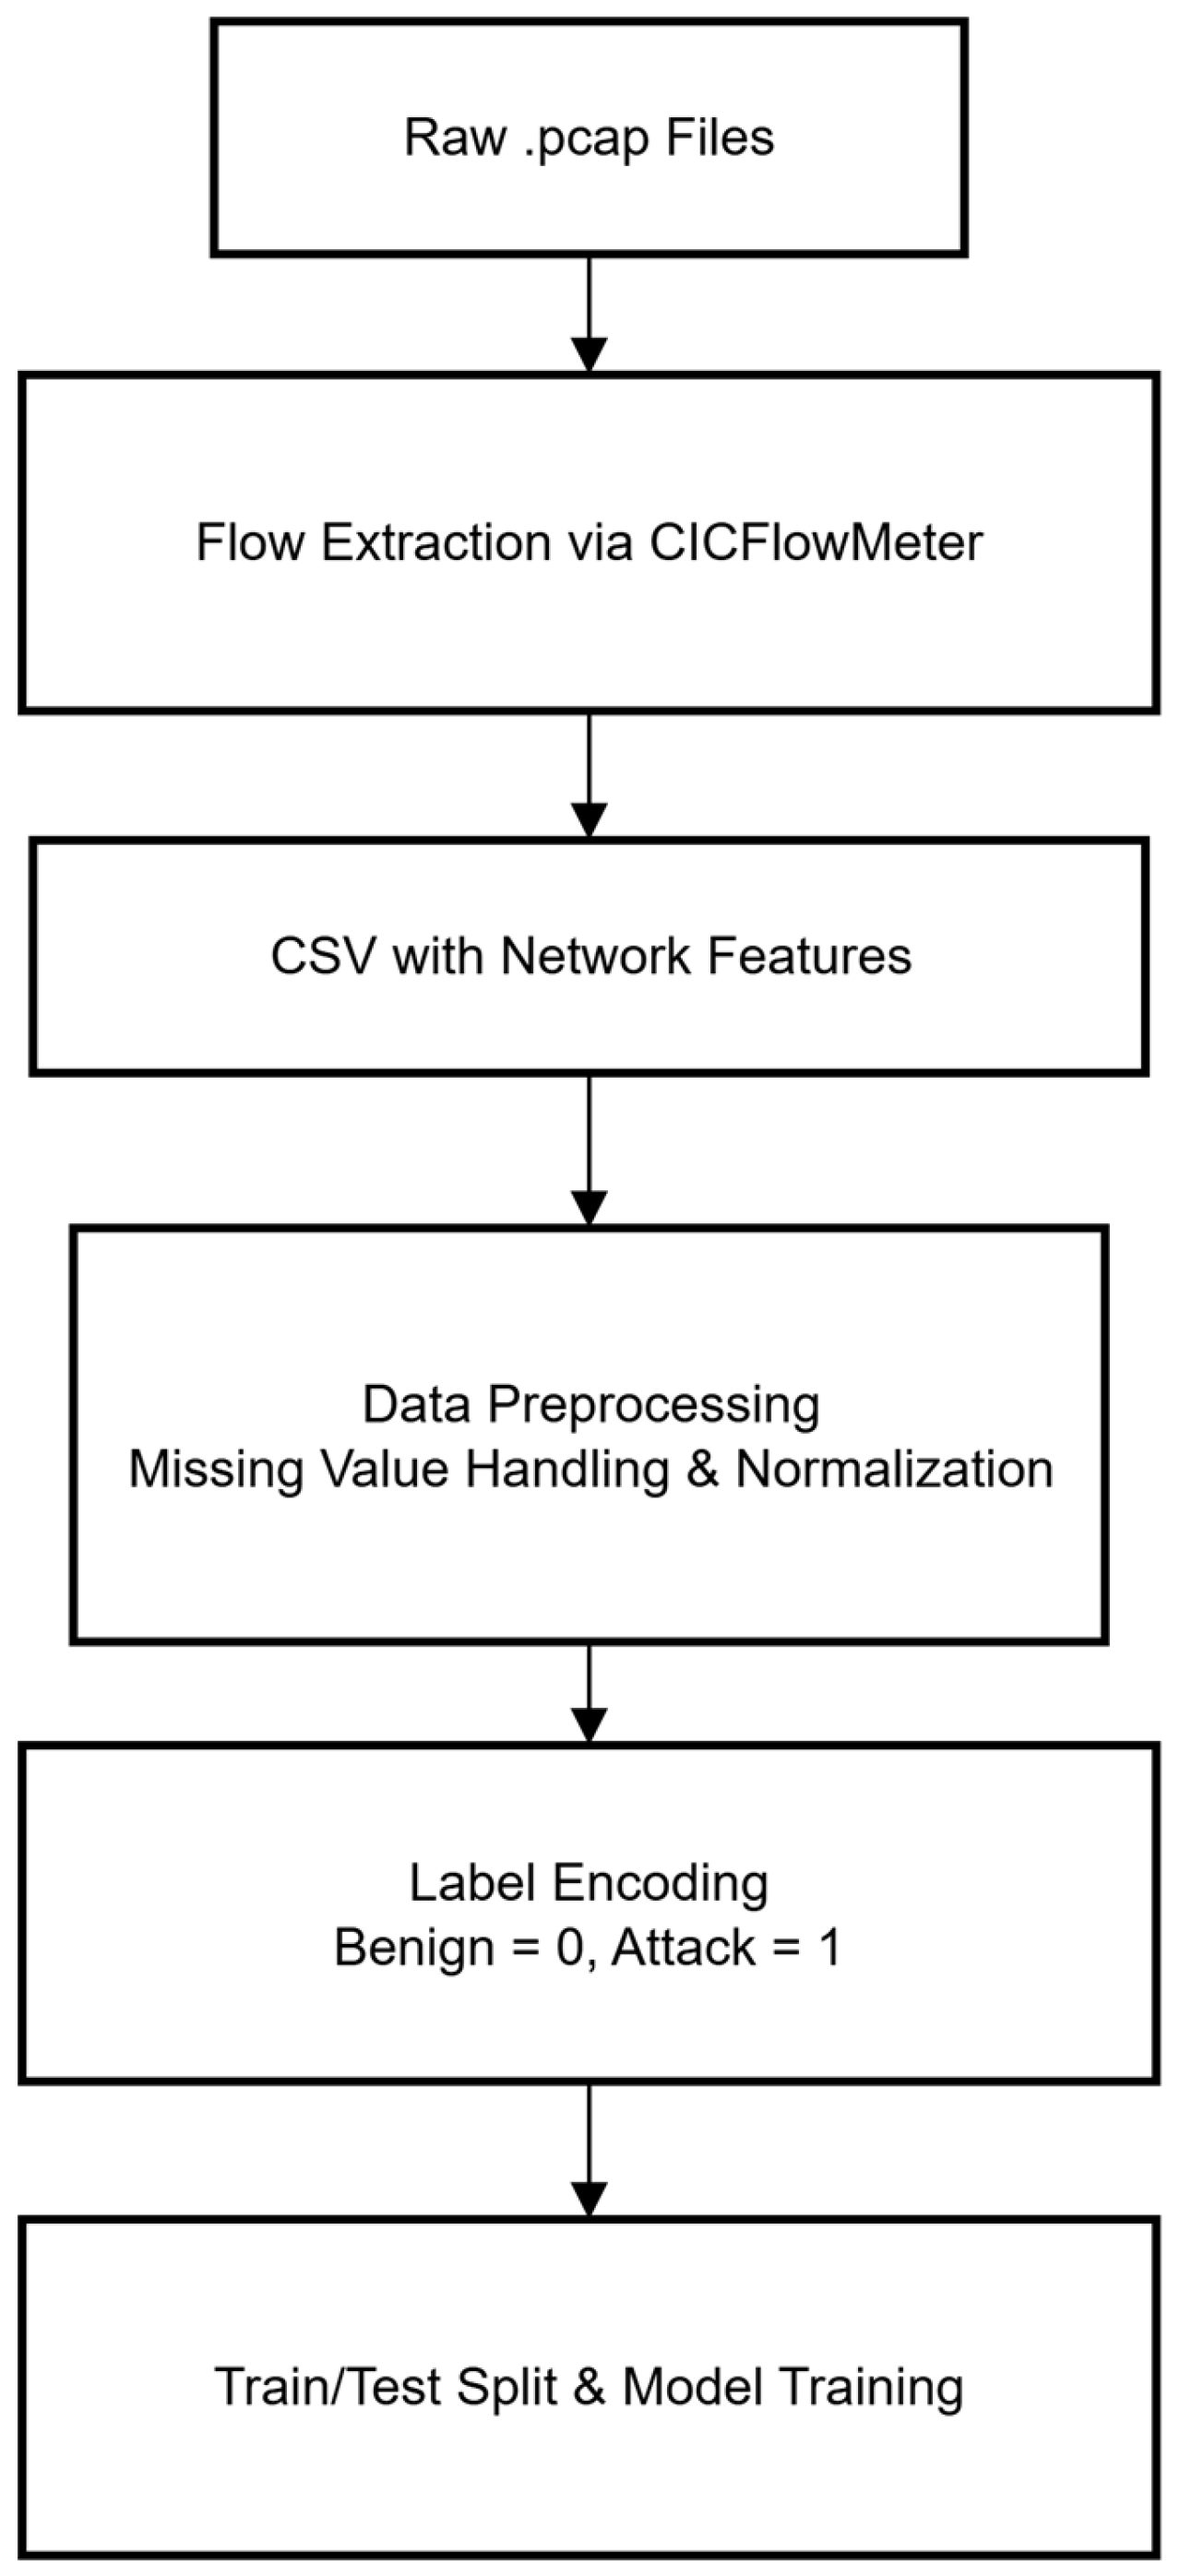
5.2.3. Flowchart Description

Figure 8 shows the steps involved in processing data characteristics. The process begins with the .pcap file containing network traffic data, using CICFlowMeter V4.0 to process traffic statistics, and export them in CSV format for subsequent training and evaluation. The generated CSV file undergoes data preprocessing, including imputing missing values and normalizing features to ensure consistency and stability of downstream learning tasks. Next, the traffic labels are converted to binary values: 0 for benign and 1 for attack to facilitate supervised learning. Hierarchical sampling is used to divide the dataset into a training set and a test set to maintain the original class distribution. Finally, the processed data are utilized for training and evaluation with machine-learning models, including RF, MLP, and BiLSTM.

5.3. Discussion with the Rest of the Models

In this study, we selected representative classical models, RF, MLP, and BiLSTM, as baseline methods and integrated them using a self-attention-based ensemble strategy. These models demonstrate stable performance and computational efficiency on network attack data. In future work, we plan to incorporate and compare with advanced architectures such as Transformer-based and GNN-based models, which show promise in modeling temporal and structural dependencies in traffic data.

6. Conclusions

In this study, we propose the TSE-APT method, leveraging the attention mechanism to address the problem of detecting APT attacks. Traditional static feature-based detection methods struggle to counter APT attacks due to their covert, multi-stage nature. To overcome issues such as the fragmentation of attack features caused by temporal factors and difficulty in detecting new attack methods. We extract a collection of dynamic time-series features such as traffic mean, flow duration, and flag frequency. These features are integrated with static contextual features, such as the port service matrix and protocol type distribution. Furthermore, we design a dynamic weight allocation mechanism utilizing self-attentive networks to adaptively adjust the contribution of sub-models, thereby enhancing the detection performance of the model.
Experimental results show that the TSE-APT excels in detecting APT attacks. The accuracy of the model is significantly improved by fusing time-series features. Meanwhile, the recall and accuracy of three baseline models, RF, MLP, and BiLSTM, are significantly enhanced, demonstrating the value of time-series features in optimizing detection performance. The adaptive mechanism plays a critical role in reducing the false-alarm rate, which improves the model’s practicality and reliability. Additionally, it also helps identify the malware category more accurately and offers training time and spatial convergence advantages. By analyzing temporal dynamic and contextual static features, this study introduces a novel approach to APT attack detection, providing both theoretical insights and practical foundations for advancing future security research.
In the future, we envision the TES-APT framework as a modular detection engine integrated into intrusion detection systems or monitoring systems. Analyzing incoming traffic over time can enable APT attack protection in various environments. Moreover, to enhance the effectiveness of APT attack detection in this scheme, we will continue to improve the experiments. First, we aim to incorporate more APT datasets for detection to validate the effectiveness of this method in more realistic situations. Second, we will further optimize the module’s performance and efficiency, striving to achieve real-time traffic analysis and processing, and apply it to practical environments as soon as possible. Finally, with the rise of Transformer models and multimodal learning, we can combine these advanced technologies with ensemble-learning and self-attention mechanisms to elevate the performance of time-series prediction.

Author Contributions

Conceptualization, M.C.; Methodology, M.C. and G.X.; Investigation, M.C.; Software, M.C., Q.Y., Z.M., and H.Z.; Data curation, M.C.; Writing—original draft, M.C. and G.X.; Funding acquisition, G.X.; Project administration. Q.Y.; Data curation, Z.M.; Validation, H.Z. All authors have read and agreed to the published version of the manuscript.

Funding

This research was supported by the R&D Program of Beijing Municipal Education Commission (No. KM202311232014); the Classification Development Program—Practical Innovation Projects in the College of Computer Science at Beijing Information Science and Technology University (No. 5112523401), and the XingGuang Program of Beijing Information Science and Technology University (No. XG2025ZD20).

Data Availability Statement

Data are contained within the article.

Conflicts of Interest

The authors declare no conflict of interest. The funders had no role in the design of the study; in the collection, analysis, or interpretation of data; in the writing of the manuscript; or in the decision to publish the results.

References

  1. Wang, Z.; He, X.; Yi, X.; Li, Z.; Cao, X.; Yin, T.; Li, S.; Fu, A.; Zhang, Y. Survey of attack and detection based on the full life cycle of APT. J. Commun./Tongxin Xuebao 2024, 45, 106. [Google Scholar]
  2. Wang, H.; Cui, B.; Yuan, Q.; Shi, R.; Huang, M. A review of deep learning based malware detection techniques. Neurocomputing 2024, 598, 128010. [Google Scholar] [CrossRef]
  3. Li, S.; Zhang, Q.; Wu, X.; Han, W.; Tian, Z.; Yu, S. Attribution classification method of APT malware in IoT using machine learning techniques. Secur. Commun. Netw. 2021, 2021, 9396141. [Google Scholar] [CrossRef]
  4. Chen, Z.; Liu, J.; Shen, Y.; Simsek, M.; Kantarci, B.; Mouftah, H.T.; Djukic, P. Machine learning-enabled iot security: Open issues and challenges under advanced persistent threats. ACM Comput. Surv. 2022, 55, 105. [Google Scholar] [CrossRef]
  5. Mönch, S.; Roth, H. Real-time APT detection technologies: A literature review. In Proceedings of the 2023 IEEE International Conference on Cyber Security and Resilience (CSR), Venice, Italy, 31 July–2 August 2023. [Google Scholar]
  6. Alshamrani, A.; Myneni, S.; Chowdhary, A.; Huang, D. A survey on advanced persistent threats: Techniques, solutions, challenges, and research opportunities. IEEE Commun. Surv. Tutor. 2019, 21, 1851–1877. [Google Scholar] [CrossRef]
  7. Cortes, C.; Vapnik, V. Support-vector networks. Mach. Learn. 1995, 20, 273–297. [Google Scholar] [CrossRef]
  8. Rosenblatt, F. The perceptron: A probabilistic model for information storage and organization in the brain. Psychol. Rev. 1958, 65, 386. [Google Scholar] [CrossRef] [PubMed]
  9. Ghafir, I.; Hammoudeh, M.; Prenosil, V.; Han, L.; Hegarty, R.; Rabie, K.; Aparicio-Navarro, F.J. Detection of advanced persistent threat using machine-learning correlation analysis. Future Gener. Comput. Syst. 2018, 89, 349–359. [Google Scholar] [CrossRef]
  10. Tan, Y.; Huang, W.; You, Y.; Su, S.; Lu, H. Recognizing BGP Communities Based on Graph Neural Network. IEEE Netw. 2024, 38, 282–288. [Google Scholar] [CrossRef]
  11. Hochreiter, S.; Schmidhuber, J. Long short-term memory. Neural Comput. 1997, 9, 1735–1780. [Google Scholar] [CrossRef]
  12. Hossain, M.N.; Milajerdi, S.M.; Wang, J.; Eshete, B.; Gjomemo, R.; Sekar, R.; Stoller, S.; Venkatakrishnan, V.N. SLEUTH: Real-time attack scenario reconstruction from COTS audit data. In Proceedings of the 26th USENIX Security Symposium (USENIX Security 17), Vancouver, BC, Canada, 16–18 August 2017. [Google Scholar]
  13. Ren, Y.; Xiao, Y.; Zhou, Y.; Zhang, Z.; Tian, Z. CSKG4APT: A cybersecurity knowledge graph for advanced persistent threat organization attribution. IEEE Trans. Knowl. Data Eng. 2022, 35, 5695–5709. [Google Scholar] [CrossRef]
  14. Vaswani, A.; Shazeer, N.; Parmar, N.; Uszkoreit, J.; Jones, L.; Gomez, A.N.; Kaiser, Ł.; Polosukhin, I. Attention is all you need. Adv. Neural Inf. Process. Syst. 2017, 30, 6000–6010. [Google Scholar]
  15. Afnan, S.; Sadia, M.; Iqbal, S.; Iqbal, A. LogShield: A Transformer-based APT Detection System Leveraging Self-Attention. arXiv 2023, arXiv:2311.05733. [Google Scholar]
  16. Wang, N.; Wen, X.; Zhang, D.; Zhao, X.; Ma, J.; Luo, M.; Nie, S.; Wu, S.; Liu, J. Tbdetector: Transformer-based detector for advanced persistent threats with provenance graph. arXiv 2023, arXiv:2304.02838. [Google Scholar]
  17. Stojanović, B.; Hofer-Schmitz, K.; Kleb, U. APT datasets and attack modeling for automated detection methods: A review. Comput. Secur. 2020, 92, 101734. [Google Scholar] [CrossRef]
  18. Benabderrahmane, S.; Berrada, G.; Cheney, J.; Valtchev, P. A rule mining-based advanced persistent threats detection system. arXiv 2021, arXiv:2105.10053. [Google Scholar] [CrossRef]
  19. Niu, W.; Zhou, J.; Zhao, Y.; Zhang, X.; Peng, Y.; Huang, C. Uncovering APT malware traffic using deep learning combined with time sequence and association analysis. Comput. Secur. 2022, 120, 102809. [Google Scholar] [CrossRef]
  20. Wang, H.; Mumtaz, S.; Li, H.; Liu, J.; Yang, F. An identification strategy for unknown attack through the joint learning of space–time features. Future Gener. Comput. Syst. 2021, 117, 145–154. [Google Scholar] [CrossRef]
  21. Wang, H.; Di, X.; Wang, Y.; Ren, B.; Gao, G.; Deng, J. An intelligent digital twin method based on spatio-temporal feature fusion for IoT attack behavior identification. IEEE J. Sel. Areas Commun. 2023, 41, 3561–3572. [Google Scholar] [CrossRef]
  22. Yu, K.; Tan, L.; Mumtaz, S.; Al-Rubaye, S.; Al-Dulaimi, A.; Bashir, A.K.; Khan, F.A. Securing critical infrastructures: Deep-learning-based threat detection in IIoT. IEEE Commun. Mag. 2021, 59, 76–82. [Google Scholar] [CrossRef]
  23. Quintero-Bonilla, S.; Martín del Rey, A. A new proposal on the advanced persistent threat: A survey. Appl. Sci. 2020, 10, 3874. [Google Scholar] [CrossRef]
  24. Ghafir, I.; Kyriakopoulos, K.G.; Lambotharan, S.; Aparicio-Navarro, F.J.; Assadhan, B.; Binsalleeh, H.; Diab, D.M. Hidden Markov models and alert correlations for the prediction of advanced persistent threats. IEEE Access 2019, 7, 99508–99520. [Google Scholar] [CrossRef]
  25. Bodström, T.; Hämäläinen, T. A novel deep learning stack for APT detection. Appl. Sci. 2019, 9, 1055. [Google Scholar] [CrossRef]
  26. Ramaki, A.A.; Ghaemi-Bafghi, A.; Rasoolzadegan, A. Captain: Community-based advanced persistent threat analysis in it networks. Int. J. Crit. Infrastruct. Prot. 2023, 42, 100620. [Google Scholar] [CrossRef]
  27. Baradaran, R.; Amirkhani, H. Ensemble learning-based approach for improving generalization capability of machine reading comprehension systems. Neurocomputing 2021, 466, 229–242. [Google Scholar] [CrossRef]
  28. Saini, N.; Kasaragod, V.B.; Prakasha, K.; Das, A.K. A hybrid ensemble machine learning model for detecting APT attacks based on network behavior anomaly detection. Concurr. Comput. Pract. Exp. 2023, 35, e7865. [Google Scholar] [CrossRef]
  29. Arefin, S.; Chowdhury, M.; Parvez, R.; Ahmed, T.; Abrar, A.S.; Sumaiya, F. Understanding APT detection using Machine learning algorithms: Is superior accuracy a thing? In Proceedings of the 2024 IEEE International Conference on Electro Information Technology (eIT), Eau Claire, WI, USA, 30 May–1 June 2024. [Google Scholar]
  30. Li, D.; Li, Q. Adversarial deep ensemble: Evasion attacks and defenses for malware detection. IEEE Trans. Inf. Forensics Secur. 2020, 15, 3886–3900. [Google Scholar] [CrossRef]
  31. Choi, S. Malicious powershell detection using attention against adversarial attacks. Electronics 2020, 9, 1817. [Google Scholar] [CrossRef]
  32. Su, T.; Sun, H.; Zhu, J.; Wang, S.; Li, Y. BAT: Deep learning methods on network intrusion detection using NSL-KDD dataset. IEEE Access 2020, 8, 29575–29585. [Google Scholar] [CrossRef]
  33. Jiao, R.; Wang, S.; Zhang, T.; Lu, H.; He, H.; Gupta, B.B. Adaptive feature selection and construction for day-ahead load forecasting use deep learning method. IEEE Trans. Netw. Serv. Manag. 2021, 18, 4019–4029. [Google Scholar] [CrossRef]
  34. Sharafaldin, I.; Lashkari, A.H.; Ghorbani, A.A. Toward generating a new intrusion detection dataset and intrusion traffic characterization. ICISSp 2018, 1, 108–116. [Google Scholar]
  35. Lashkari, A.H.; Gil, G.D.; Mamun, M.S.I.; Ghorbani, A.A. Characterization of tor traffic using time based features. In International Conference on Information Systems Security and Privacy; SciTePress: Setúbal, Portugal, 2017. [Google Scholar]
  36. Breiman, L. Random forests. Mach. Learn. 2001, 45, 5–32. [Google Scholar] [CrossRef]
  37. Zhou, P.; Shi, W.; Tian, J.; Qi, Z.; Li, B.; Hao, H.; Xu, B. Attention-based bidirectional long short-term memory networks for relation classification. In Proceedings of the 54th Annual Meeting of the Association for Computational Linguistics, Berlin, Germany, 7–12 August 2016; Volume 2: Short papers. [Google Scholar]
  38. Gu, Z.; Hu, W.; Zhang, C.; Lu, H.; Yin, L.; Wang, L. Gradient Shielding: Towards Understanding Vulnerability of Deep Neural Networks. IEEE Trans. Netw. Sci. Eng. 2020, 8, 921–932. [Google Scholar] [CrossRef]
  39. Chen, T.; Guestrin, C. Xgboost: A scalable tree boosting system. In Proceedings of the 22nd ACM SIGKDD International Conference on Knowledge Discovery and Data Mining, San Francisco, CA, USA, 13–17 August 2016. [Google Scholar]
  40. Lu, J.; Chen, K.; Zhuo, Z.; Zhang, X. A temporal correlation and traffic analysis approach for APT attacks detection. Clust. Comput. 2019, 22, 7347–7358. [Google Scholar] [CrossRef]
  41. Xuan, C.D.; Duong, D.; Dau, H.X. A multi-layer approach for advanced persistent threat detection using machine learning based on network traffic. J. Intell. Fuzzy Syst. 2021, 40, 11311–11329. [Google Scholar] [CrossRef]
  42. Charan, P.S.; Shukla, S.K.; Anand, P.M. Detecting word based DGA domains using ensemble models. In Proceedings of the Cryptology and Network Security: 19th International Conference, CANS 2020, Vienna, Austria, 14–16 December 2020; Proceedings 19; Springer: Cham, Switzerland, 2020. [Google Scholar]
Figure 1. Workflow of the APT attack-detection method based on time-series and ensemble learning.
Electronics 14 02924 g001
Figure 2. IAT feature comparison between benign and XSS samples.
Electronics 14 02924 g002
Figure 3. FRC feature comparison between benign and DoS samples.
Electronics 14 02924 g003
Figure 4. FV feature comparison between benign and DoS samples.
Electronics 14 02924 g004
Figure 5. F2 feature comparison between benign and Bot samples.
Electronics 14 02924 g005
Figure 6. ROC curves, precision–recall curves, and confusion matrices for each (a) RF’s ROC curve, precision–recall curve, and confusion matrix, (b) MLP’s ROC curve, precision–recall curve, and confusion matrix, (c) BiLSTM’s ROC curve, precision–recall curve, and confusion matrix.
Electronics 14 02924 g006aElectronics 14 02924 g006b
Figure 7. The SHAP value in the top 20.
Electronics 14 02924 g007
Figure 8. The flowchart of data-processing.
Electronics 14 02924 g008
Table 1. Evaluation metrics.
MetricsFormula
Accuracy(TP + TN)/(TP + FP + FN + TN)
PrecisionTP/(TP + FP)
RecallFN/(TP + FN)
F1 Score2 × ((precision×recall)/(precision + recall))
False Positive RateFP/(FP + TN)
Table 2. Statistical data.
TypeSizeMalware TypePacket Num
Malware traffic961 MB152,172,044
normal traffic1.2 GB02,827,956
Table 3. Summary of hyperparameters search space with the selected one.
ModelHyperparametersSearch SpaceSelected
RFNumber of Trees[10, 50, 100]50
RFRandom State[0, 42, 100]42
MLPHidden Layers[2, 3, 4, 5]4
MLPActivation Function[ReLU, GELU, Tanh]GELU
MLPDropout Rate[0.1, 0.2, 0.3, 0.5]0.3
BiLSTMHidden Size[64, 128, 256]128
BiLSTMLayers[1, 2]1
BiLSTMCNN Kernel Size[3, 5, 7]3
BiLSTMCNN Channels[64, 128, 256]128
BiLSTMDropout[0.1, 0.3, 0.5]0.3
BiLSTMSequence Length[4, 6, 8]6
XGBoostBooster[gbtree, gblinear]gbtree
XGBoostMax Depth[3, 6, 10]6
XGBoostSubsample[0.6, 0.8, 1.0]0.8
XGBoostColsample_bytree[0.6, 0.8, 1.0]0.8
XGBoostNumber of Trees[50, 100, 150]100
Self-AttentionAttention Heads[2, 4, 8]4
Self-AttentionQ/K/V Dimensions[32, 64, 128]64
Self-AttentionFeedforward Dimension[128, 256, 512]256
Table 4. Experimental results of timing feature detection.
AlgorithmParameterAccuracy
(%)
Precision
(%)
Recall
(%)
F1
(%)
FPR
(%)
RFTree = 50Static94.4595.8891.8195.822.12
Tree = 50Combined96.2398.4294.1196.201.17
MLPUnite = 4Static94.8097.3291.2896.200.49
Unite = 4Combined96.3398.2093.4596.190.58
BiLSTMHidden = 64Static94.5096.2991.6195.891.26
Hidden = 64Combined96.7898.9394.0696.250.77
Table 5. The McNemar test of each model.
PreparationMcNemar’s Statisticp-Value
RF vs. MLP29,610.04<0.001
RF vs. BiLSTM29,152.00<0.001
MLP vs. BiLSTM658.44<0.001
Table 6. Results of ensemble-learning experiments.
AlgorithmParameterAccuracy
(%)
Precision
(%)
Recall
(%)
F1
(%)
FPR
(%)
LogicalC = 1.096.5599.0993.9295.900.66
XGBoostgbtree96.9299.3494.5696.360.67
Self-attentionHidden = 12897.3299.2696.2397.510.69
Table 7. Ablation studies on the method components.
ModificationAccuracy
(%)
Precision
(%)
Recall
(%)
F1
(%)
FPR
(%)
Full model (TES-APT)97.3299.2696.2397.510.69
- Self-attention96.9299.3494.5696.360.67
- Ensemble learning96.7898.9394.0696.250.77
- Time-series features94.5096.2991.6195.891.61
Table 8. Comparison with other similar works.
WorksAcc (%)Method
Lu et al. [40]97.00Time-series
Niu et al. [19]93.21Time-series
Xuan et al. [41] 96.70Ensemble Learning
Charan et al. [42]95.03Ensemble Learning
TSE-APT97.32Time-series+ Ensemble Learning
Disclaimer/Publisher’s Note: The statements, opinions and data contained in all publications are solely those of the individual author(s) and contributor(s) and not of MDPI and/or the editor(s). MDPI and/or the editor(s) disclaim responsibility for any injury to people or property resulting from any ideas, methods, instructions or products referred to in the content.

