Abstract
Emerging digital technologies are transforming how consumers participate in financial markets, yet their benefits depend critically on the speed, reliability, and transparency of the underlying platforms. Online stock trading platforms must maintain high efficiency underload to ensure a good user experience. This paper presents performance analysis under various load conditions based on the containerized stock exchange system. A comprehensive data logging pipeline was implemented, capturing metrics such as API response times, database query times, and resource utilization. We analyze the collected data to identify performance patterns, using both statistical analysis and machine learning techniques. Preliminary analysis reveals correlations between application processing time and database load, as well as the impact of user behavior on system performance. Association rule mining is applied to uncover relationships among performance metrics, and multiple classification algorithms are evaluated for their ability to predict user activity class patterns from system metrics. The insights from this work can guide optimizations in similar distributed web applications to improve scalability and reliability under a heavy load. By framing performance not merely as a technical property but as a determinant of financial decision-making and well-being, the study contributes actionable insights for designers of consumer-facing fintech services seeking to meet sustainable development goals through trustworthy, resilient digital infrastructure.
1. Introduction
Digital trading platforms sit at the intersection of fast-moving capital markets and everyday consumer finance. Their ability to sustain low-level response times during periods of extreme load is partly a back-office concern. Latency spikes and service interruptions erode trust, alter risk perceptions, and may ultimately reshape spending and investment behavior. Understanding this sociotechnical nexus is, therefore, essential both for platform operators [] and for the clients []. The primary goal of this study is to develop and rigorously evaluate an end-to-end methodology that links low-level performance metrics to user-centric behavioral categories within a containerized stock-trading platform. In doing so, we offer actionable recommendations for the designers of latency-sensitive fintech services.
Modern web-based trading applications have to handle large numbers of concurrent users and transactions without performance degradation. Load testing and performance monitoring are critical to ensure such systems remain scalable and responsive. In this work, we develop a simulated stock exchange application and subject it to load tests in a controlled environment. The application is containerized and consists of a web backend, a database, and asynchronous task workers. By generating synthetic user activity and collecting detailed logs of system performance, we aim to identify bottlenecks and understand how different factors (such as the number of users or request frequency) affect throughput and latency.
Performance testing frameworks like Locust are commonly used to simulate user behavior and measure response times in web systems. We leverage Locust to generate a realistic workload against our stock trading API. Similar approaches have been employed in prior studies of containerized environments [,,]. For example, Sergeev et al. used stress testing on Docker containers to evaluate system behavior under resource constraints []. Our approach extends this idea to a complex application, with a focus on both application-level metrics (API endpoints and transaction processing times) as well as system-level metrics (CPU and memory usage).
This paper makes the following contributions: (1) we design a data collection scheme that logs both application performance metrics and system resource usage in a unified manner; (2) we conduct extensive load tests by varying key parameters (user counts in class, request rates, etc.) to evaluate their impact on the system; (3) we apply data mining techniques to the log data, including association rule mining to uncover hidden correlations and classification algorithms to distinguish user behavior patterns; (4) we suggest and discuss future enhancements that leverage graph databases, deep learning, and large language models to further improve performance analysis and prediction. The remainder of the paper is organized as follows. Section 2 provides an overview of the system architecture and the data flow in the application, including the database design and workload generation. Section 3 describes the performance data logging methodology and the experimental setup for stress tests. Section 4 presents the analysis of the collected data and key results, including basic observations, association rule mining outcomes, and classification. Section 5 outlines potential future work for data analysis beyond the current scope. Finally, Section 6 concludes the paper with a summary of findings and implications.
2. Related Works
Modern distributed applications in finance and trading are increasingly built using containerized microservices to ensure scalability and resilience. Although specific studies on containerized stock trading platforms are limited, the broader literature on containerized systems provides relevant insights. For example, Baresi et al. present a comprehensive evaluation of multiple container engines and highlight significant performance differences across container runtimes []. Sobieraj and Kotyński investigate Docker performance on different host operating systems, finding that additional virtualization layers (e.g., on Windows or macOS hosts) can introduce notable overhead compared to native Linux deployments []. These works underscore the importance of efficient containerization for high-performance applications, a consideration directly applicable to financial trading services seeking low latency and high throughput operation in cloud environments.
Another critical aspect of such systems is rigorous load testing and performance evaluation. A range of frameworks exist for this purpose, from classic tools like Apache JMeter to more recent ones like Locust and Gatling. Recent research emphasizes the use of these tools in containerized and microservice contexts. Mohan and Nandi [] developed a custom load testing setup using Locust to study a microservice-based application under varying scales. Their framework was capable of generating over 2000 requests per second per container to stress the system. This demonstrates the viability of Locust for heavy-load scenarios, offering a Python-based, distributed approach to simulate users, which complements the traditional JMeter approach. Camilli et al. integrated such load generation tools into an automated performance analysis pipeline, combining stress testing with model learning to evaluate microservice behavior under different configurations []. Their work illustrates how modern load testing frameworks may be orchestrated not only to measure performance but also to inform performance models and scalability plans.
In microservice architectures (including those for trading applications), asynchronous task handling is a common pattern to maintain responsiveness. Production systems built with frameworks like Django REST often employ background worker queues (e.g., Celery with a Redis broker) to offload non-critical or heavy tasks from request–response threads. This design aligns with best practices in scalability: the web frontend handles immediate API calls, while computationally intensive tasks run in parallel, thus improving throughput and user experience. While the academic literature on specific implementations (such as Celery in Django) is scarce, the pattern is supported by numerous case studies and system designs. The general consensus in recent studies is that using message brokers and worker microservices improves performance under load by preventing bottlenecks in the main service. For instance, Camilli et al.’s testing infrastructure separates workload generation and processing, which is analogous to how a real system would separate web services from worker services to handle background processing []. Such architectural choices are crucial for a stock trading platform that must process trades and updates in real time without degrading the user-facing service.
Also, modern web systems often leverage comprehensive logging and data analysis frameworks to ensure reliability under heavy usage. For instance, the CAWAL framework was suggested as a unified on-premise solution to monitor large-scale web portals and detect anomalies in user behavior by combining detailed session/page view logs with specialized analytics []. Such frameworks may uncover subtle usage patterns and security issues that elude third-party tracking tools [,,]. In the domain of IoT, researchers have emulated complex smart city infrastructures in containerized testbeds to evaluate performance. Gaffurini et al. [,] containerized a full LoRaWAN network to simulate urban Internet-of-Things conditions, enabling end-to-end evaluation of network delays and reliability under realistic loads. Their work highlights the importance of holistic, scenario-based testing in distributed environments. Scalable architectures for big data have also been examined: for example, Encinas Quille et al. designed an open-data portal architecture for atmospheric science, addressing challenges in big data publication and real-time data access []. These studies underscore the need for robust data collection and analysis pipelines in systems that, like our stock trading platform, must handle high volumes of data and operational complexity.
System logs are a rich source of information for performance analysis and optimization. A recent survey by Ma et al. [] provides a broad overview of automated log parsing techniques and how extracted log features are utilized for system analysis. The survey shows a trend toward structuring log data to facilitate machine learning tasks, which aligns with our approach of collecting detailed, structured metrics. Real-time processing of logs and events is another active area of research. Avornicului et al. [] presented a modular platform for real-time event extraction that combines scalable natural language processing with data mining. Their platform demonstrates that timely extraction and processing of log events (such as error messages or user actions) can support rapid incident response and decision-making in complex systems. This real-time aspect complements our focus on offline analysis by indicating how findings could eventually feed into real-time monitoring tools.
Machine learning techniques have also been increasingly applied to analyze and enhance system performance. In the context of performance monitoring and analysis, researchers have explored both predictive modeling and anomaly detection. Nobre et al. [] investigate a supervised learning approach for detecting performance anomalies in microservice-based systems using a multi-layer perceptron classifier. Their study shows high accuracy in identifying abnormal service behaviors by training on labeled performance metrics, suggesting that ML models can preemptively flag performance issues. Other work has focused on predicting system behavior: Camilli et al. [] combine automated load testing with probabilistic model learning to derive performance models for microservices. By employing statistical inference (Bayesian learning) on the data collected from systematic stress tests, they were able to forecast how changes in configuration or load would impact response times and resource utilization.
Beyond predictive modeling, data mining methods have been widely applied to usage logs and system datasets to discover patterns and make informed decisions [,]. Association rule mining, for example, has been used to analyze user behavior and system states. Li et al. [] apply web log mining to optimize the classic Apriori algorithm in a sports information management system. They significantly reduced execution time for extracting frequent patterns from user interaction data by preprocessing web logs and refining Apriori [,]. Alternative algorithms can further improve efficiency: a comparative study by Bhargavi et al. [] evaluated the Pincer Search method for association rule mining on consumer purchase data. They found that Pincer Search was able to discover frequent itemsets more effectively in certain scenarios than standard Apriori, highlighting potential benefits for mining performance-related patterns in large log datasets. In addition to pattern mining, predictive analytics on operational data is increasingly important []. Azeroual et al. [] present an intelligent decision-making framework that integrates machine learning models with sentiment analysis on social data. While their case study focused on Twitter data, the framework exemplifies how predictive models can be built on data streams to inform decisions—an approach analogous to predicting user load or system slowdowns from log metrics. Likewise, Nacheva et al. [] developed a data mining model to classify academic publications on digital workplaces. By training on features extracted from research papers, they achieved automated classification to aid knowledge discovery. This showcases the versatility of classification techniques (clustering content by topic), which is conceptually similar to classifying user sessions or user classes []. Finally, as data mining is applied to user and system data [,], fairness and bias needed to be considered. Wang et al. [] address this with an advanced algorithm for discrimination prevention in data mining. Their method adjusts learned models to mitigate biases in decision outcomes. Although bias mitigation is outside the scope of our performance study, it is an important aspect of modern analytics frameworks to ensure that any user behavior predictions drawn from logs do not inadvertently reinforce unfair patterns.
Detecting threats (in other words specific behaviors) is currently a major challenge because identifying, for example, anomalies in log data or user behavior is a complex process. Traditional methods, based mainly on rules, are inflexible and insufficiently robust []. However, modeling user behavior is crucial. Therefore, this work proposes a novel approach based on classification for detecting user behavior through identified behavior patterns. The obtained results show moderate effectiveness but in some cases show high reliability of the model in recognition, which supports the integrity and trust in real-time systems.
3. System Overview
3.1. Architecture and Components
The stock trading system was built as a containerized application composed of several services: a web application (REST API server), a PostgreSQL database for persistent storage, a Redis message broker, and Celery worker processes for asynchronous tasks. User interactions with the system occur through a RESTful API (implemented using Django REST Framework) exposing endpoints for user authentication and trading actions. The choice of PostgreSQL as the primary data store ensures reliable storage of all trading data (users, orders, transactions, etc.), while Redis is employed as a lightweight in-memory broker to facilitate communication between the web application and background workers. This architectural overview forms the foundation for the empirical work that follows in which we test how well the system fulfills the above objectives under a variety of realistic load patterns.
Figure 1 illustrates the high-level system architecture. The web application handles incoming HTTP requests (e.g., placing a buy/sell order) and synchronously interacts with the PostgreSQL database for immediate data reads/writes (Appendix A—stock application). For operations that can be handled asynchronously (such as processing the matching of buy and sell orders or periodic updates of stock prices), the application pushes tasks to Celery. Celery workers, listening on specific queues defined for different task types, consume these jobs from Redis and execute them in the background. This design allows resource-intensive or periodic jobs to run without blocking the main request-response cycle of the API, thereby improving throughput and user-perceived response times.
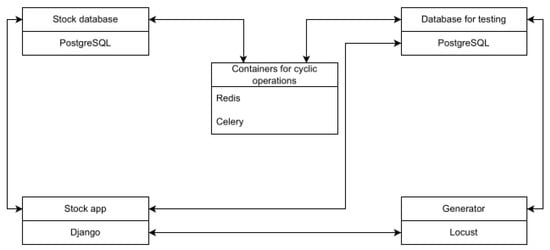
Figure 1.
Containerized architecture of the stock exchange system, including the Django web application (port 8000), PostgreSQL database (port 5432), Redis broker (port 6379), and Celery worker. An Nginx proxy (port 80) routes external traffic to the web application.
To simulate real user behavior at scale, we used Locust as a load generator. Locust spawns multiple simulated users that perform sequences of actions against the API endpoints. Each simulated user may log in, place orders, query market data, etc., following predefined user scenarios. The load generator can ramp up the number of active users over time, enabling testing the system under gradually increasing load. Django REST Framework’s token-based authentication is used, so each simulated user obtains an auth token upon login and includes it in subsequent requests.
3.2. Data Model for Trading Simulation
The trading simulation maintains a relational data model to represent users, their holdings, and orders. The schema of the PostgreSQL database includes tables for users, financial accounts, companies, stock holdings, orders, and transactions. The key tables in the schema are as follows:
- CustomUser—stores account and profile information for each user.
- Company—stores information about companies whose stocks can be traded.
- StockRate—records the current price (exchange rate) of each company’s stock.
- Stock—represents the shares owned by users (which user holds how many shares of which company).
- BuyOffer and SellOffer—represent pending buy and sell orders placed by users, including quantity and price.
- Transaction—records completed transactions (matches between buy and sell offers), including the traded quantity, price, buyer, and seller.
- BalanceUpdate—logs changes in a user’s cash balance (e.g., adding funds or the results of trades).
Each order placed by a user (a BuyOffer or SellOffer) is stored in tables. A background task periodically matches compatible buy and sell offers to execute trades. When a trade is executed, a new Transaction record is created, the corresponding offers are removed from the order queue, and the Stock holdings and user balances are updated accordingly (recorded via BalanceUpdate entries). The database schema ensures referential integrity between these tables (for instance, each Stock is linked to a CustomUser and a Company, and each Offer is linked to the user who placed it and the target company, etc.).
3.3. User Classes and Workload Patterns
The system distinguishes between in different user behavior profiles (classes) to better simulate a realistic load []. In our tests, we defined three classes of simulated users (Table 1).

Table 1.
User classes in the simulation and their behavior characteristics (Appendix C—operation diagram).
As summarized in Table 1, ActiveUser generates the most intensive workload by performing the full range of actions (querying lists of companies, retrieving stock rates, and frequently creating buy or sell offers). ReadOnlyUser generates a lighter load, focusing on GET requests to view information and never creating or modifying data. AnalyticalUser extends the active user behavior by including additional requests for historical or analytical data. All user types first go through a registration and login process. After authentication, the behavior diverges according to class. The mix of these user classes in a test may significantly affect system performance as each class stresses different parts of the application (write-heavy vs. read-heavy vs. CPU-intensive analytical tasks). By varying the proportion of these classes, we observe how the system handles different usage patterns.
3.4. Background Task Scheduling with Celery
Many operations in the trading system are handled asynchronously to improve throughput. The Celery task queue is configured with multiple named queues, each serving a distinct category of tasks (Table 1). In our configuration, five queues are defined in the following application settings:
- default—the fallback queue for any task not assigned to a specific queue.
- transactions—handles the execution of matching buy and sell offers into completed transactions.
- balance_updates—responsible for updating user account balances (e.g., crediting or debiting funds after trades).
- stock_rates—updates stock prices (e.g., simulating periodic market price changes for each company).
- expire_offers—checks for and marks expired buy/sell offers (offers older than a certain time) and updates their status.
By segregating tasks into queues, each Celery worker process is dedicated to a specific type of task, reducing contention and allowing more predictable scaling. For example, if transaction processing is the heaviest task, multiple workers can be allocated to the transactions queue, while lighter tasks might share a single worker. Furthermore, this separation prevents a backlog in one category from blocking execution of unrelated tasks on the same worker.
During operation, the Django web application produces Celery tasks whenever appropriate. For instance, when a new order is placed via the API, the app immediately enqueues a task on the transactions queue to attempt to match and execute trades. Similarly, periodic tasks (such as updating stock rates or expiring offers) are scheduled via or implemented as looping tasks in the appropriate queues (using timing parameters configured as described in Section 4.2). The use of Celery and Redis thus enables the application to handle time-sensitive background logic concurrently with user-driven requests.
4. Performance Data Collection and Experiment Setup
4.1. Logging of Performance Metrics
A key part of our framework (Appendix A—stock application) is a dedicated performance monitoring component that records detailed metrics during each test run [,]. We set up a separate PostgreSQL database to store this information in order not to pollute the main application database with operational metrics. The performance database captures four main aspects of the system’s runtime behavior:
- CPU Log (table cpu) —records system resource utilization metrics, specifically CPU and memory usage over time. Each entry includes a timestamp, the percentage of CPU used, memory usage in MB, and an identifier of the container or component (e.g., web server, Celery worker, and database) from which the measurement was taken. A dedicated monitoring process (running in its own container) samples these metrics at regular intervals.
- Transaction Log (table tradelog)—captures metrics related to the processing of trading transactions (Figure 2). For each cycle of matching buy/sell offers, we log the time taken by the application logic and the time spent in database operations (these two components sum up to the total transaction processing time). We also record the number of buy and sell offers processed in that transaction cycle and which companies’ stocks were involved.
- Market API Log (table marketlog)—stores information about API requests served by the trading application. Each log entry includes the endpoint URL and HTTP method of the request, along with its processing time broken down into application time and database time. Only successful requests that return data are logged (to avoid skew from authentication failures or bad requests).
- Traffic Log (table trafficlog)—contains records of each request as observed from the load generator’s perspective. For every API call that Locust users make, the response time as seen by the client (including network latency) is recorded, along with a unique request identifier. We generate a UUID on each client request and pass it as a header; the server attaches this ID to the corresponding server-side log (in marketlog). This makes it possible to join the client-perceived times with server-side times for the same request. The traffic log entries are collected by Locust (via its event hooks) and written in real time to the performance database, using Locust’s event to trigger a logging function in our test code.
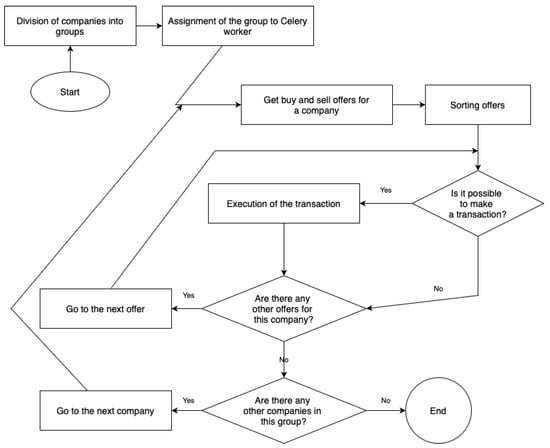
Figure 2.
Transaction scheme.
Table 2 summarizes the role of each performance log table. By combining these logs, we gain a comprehensive view: the cpu table reveals how system resource usage correlates with application events; marketlog and trafficlog together show how request latency evolves and which portion of it is server processing vs. network/other sources of overhead; tradelog details the efficiency of background trade matching processes. All logs are timestamped, allowing us to correlate events across tables and reconstruct the timeline of system behavior during each test run.

Table 2.
Performance logging database tables and their contents.
4.2. Experimental Setup and Parameters
We conducted a series of load tests to evaluate the performance of the system (all experiments were carried out in a PIONIER cloud environment (https://cloud.pionier.net.pl/ accessed on 1 June 2025)) under different scenarios. Each test lasted 1 h of simulated time. At the start of a test, new users were spawned gradually (we used a ramp-up rate of 1 user per second) to avoid an instant surge that could overwhelm the system during initialization.
Certain background task frequencies were kept constant in all tests (based on []):
- Stock price updates were performed every 15 s for each company. This interval was found to have negligible impact on other parts of the system because price updates are simple operations (updating one field per company).
- User balance refresh tasks (crediting small periodic gains, etc.) ran every 5 s. This is a frequent operation but remains lightweight.
- Expiration of stale orders was done every 60 s.
The primary variables we manipulated across different tests were as follows (based on []):
- The number of users of each class—We denote by A the count of ActiveUsers, the count of ReadOnly (non-active) users, and the count of AnalyticalUsers (active with analysis). In some tests, we varied the total number of users (with a fixed ratio of types), while in others we changed the mix of user types for a fixed total.
- Time between transactions ()—This is the delay between successive trade-matching cycles executed by the Celery worker. Increasing this interval means trades are processed less frequently (allowing more orders to queue up). We experimented with different values to see how batching trades versus real-time processing affects performance.
- Time between user requests ()—This parameter controls the think-time or delay between consecutive actions by the same simulated user. A smaller means users continuously send requests to the system, whereas a larger gives each user some idle time between actions, emulating more human-like pacing.
- The number of transaction worker containers ()—In some scenarios, we scaled the number of Celery worker processes dedicated to transaction processing. This allowed us to test the effect of horizontal scaling of the backend processing on overall throughput and latency.
We designed 20 initial test scenarios, grouped as follows:
- Group G1—Tests 1–4, varying the number of users () while keeping other factors constant.
- Group G2—Tests 5–8, varying the inter-request time (i.e., user activity rate).
- Group G3—Tests 9–12, varying the transaction interval .
- Group G4—Tests 13–16, varying the number of transaction worker containers .
- Group G5—Tests 17–20, varying the composition of user classes (different distributions of A, , and for a fixed total user count).
Each group isolates the impact of one factor (Table 3). For example, in G1, we might have Test 1 with 50 total users (mostly Active) and Test 2 with 100 users, up to Test 4 with 200 users, to observe nonlinear scaling effects or saturation points. In G4, we might run the same workload on one Celery worker vs. two vs. four to see how well the system parallelizes the transaction processing.

Table 3.
Description of the tests performed.
We used a combination of Python (3.10.18) libraries to process the resulting log data (Appendix A—results numbered 1–20). In particular, Pandas (2.3.0) was used for parsing the raw CSV log exports and computing summary statistics and Matplotlib (3.10.3) for plotting performance metrics over time to visually inspect trends. Preliminary data analysis was performed in Jupyter notebooks to interactively explore the relationships between variables. Additionally, we leveraged scikit-learn (1.6.1) for implementing classification algorithms and evaluation metrics and MLxtend (0.21.0) for applying association rule mining to the dataset. The use of these libraries (Pandas for data wrangling [], Matplotlib for visualization [], scikit-learn for machine learning [], and MLxtend for association rules) provided a robust environment for analyzing complex system performance data.
5. Results and Analysis
5.1. Preliminary Performance Analysis
First, basic analysis of the log data was conducted to derive high-level performance indicators from each test. Key metrics examined include the following:
- Average API response time per endpoint—For each REST endpoint (e.g., login, place order, and list offers), we computed the mean response time over the duration of a test. This helps identify which types of operations are the slowest under load and how they vary with different test conditions.
- Average transaction processing time per cycle—Using the tradelog, we calculated the mean time to complete a batch of transactions (matching and executing all possible trades in one sweep). We compared this across tests to see how factors like user count or request rate influence the efficiency of the trading engine.
- Response time over test duration—We plotted the timeline of response times (from trafficlog) throughout each hour-long test. This reveals whether system performance degrades over time (e.g., due to resource exhaustion or accumulating data) or remains steady.
- Transaction throughput over time—Similarly, using tradelog, we examined how many transactions were executed in each cycle and how that changed over the course of the test.
- CPU utilization—We looked at CPU usage for each container (application server, database, and workers) over time. This indicates which component was the bottleneck in each scenario.
- Memory usage—Memory consumption patterns (especially for the database container vs. application) were also analyzed.
Using the combined log data, we identified clear correlations between system resource utilization and application performance. For example, in one high-load scenario (with 20 concurrent simulated users), periods of elevated CPU usage coincided with noticeable increases in API response times. Specifically, when the average response time for certain market data requests rose to around 0.8–1.0 s, the CPU utilization recorded in the cpu log was at its peak. Conversely, during intervals where response times were lower (under 0.5 s), the CPU usage level dropped significantly. This indicates that CPU saturation was a primary contributing factor to the slower responses observed under heavy load. The logging framework also facilitated the detection of other potential bottlenecks; for instance, by examining tradeLog entries, we observed that transactions involving a large number of simultaneous buy/sell offers incurred longer database query times, suggesting that database write contention was impacting throughput.
From these analyses, we derived initial observations that guided deeper investigation. One general finding was that the average API response time varied significantly by endpoint. Write-heavy endpoints (such as creating an offer or registering a user) were an order of magnitude slower than read-only endpoints under the same load, as expected. This gap widened in tests with more concurrent users, highlighting that database writes were a performance-limiting factor.
Examining the average transaction time per cycle, we found that it remained fairly constant in some tests but increased in others. In tests where (time between transaction cycles) was very short, the system struggled to finish processing one batch of trades before the next batch was triggered, causing overlap and queuing. This resulted in longer average processing times per batch. Conversely, with a moderate , each cycle had ample time to complete, and the average time per cycle was lower, though at the cost of a slightly increased end-to-end delay for any given trade to execute.
The response time timelines showed that in scenarios with high constant load, the median response time tended to drift upward after about 30 min, suggesting that system performance was degrading. However, in tests with fewer users or lower request rates, the response times stabilized after an initial warm-up, indicating that the system can reach a steady state.
Resource utilization data provided further insight. For example, in tests from Group G1 (increasing users), CPU usage on the application server container rose linearly with the number of users and approached 100% at the highest user count, whereas the database CPU usage remained moderate (50%). This suggested the bottleneck was in application logic, not raw database throughput, when scaling user concurrency. In contrast, in Group G3 (varying ), when transactions were processed too frequently, the database CPU spiked during those operations, indicating that the database became the bottleneck during intensive write bursts. These observations pointed out which subsystem to optimize for different conditions.
Another important observation was the effect of user behavior mix (Group G5 tests). When a higher proportion of AnalyticalUsers ( class) was present, we saw periodic CPU spikes on the application server corresponding to their market analysis activity. These scenarios also showed slightly elevated response times for all users, implying that the heavy computations by AnalyticalUsers can impact the experience of others (due to shared resources like CPU and possibly database locks if analytical queries were complex).
These preliminary findings highlight the interplay between application-tier processing and database operations. They motivated a more rigorous analysis to quantify relationships between metrics and to classify scenarios, which we describe next.
5.2. Association Rule Mining on Performance Data
To uncover hidden patterns and co-occurring conditions in the performance dataset, we applied Association Rule Mining (ARM) using the MLxtend library. We discretized certain continuous metrics into categorical bins (e.g., labeling a response time or CPU usage as “high” or “low” relative to a threshold) so that we could treat each test outcome as a basket of boolean attributes. For instance, an observation from a particular timeframe might include attributes like {HighCPU(AppServer)=True, HighDBTime=True, HighResponseTime=True, HighCPU(DB)=False, …}. We then mined for rules of the form X ⇒ Y (with X, Y being sets of such attributes) that satisfy minimum support and confidence criteria.
We considered an association rule interesting if its support was (the rule applies to more than 30% of observations), confidence (when condition X occurs, Y follows in over 80% of those cases), and lift (the rule is significantly better than random chance). Using these thresholds, we extracted rules from the dataset of all test scenarios combined.
Across multiple tests (specifically tests 1, 3, 4, 8, 9, and 10), we consistently found a strong pair of rules (appearing with minor variations in each):
- Rule 1: If application processing time is high, then database query time is high.
- Rule 2: If database query time is high, then application processing time is high.
In other words, these rules suggest a bidirectional association between high application-level latency and high database latency. Both rules had high support (often around 0.35–0.40) and confidence > 0.8 in those tests, with lift well above 1.2, indicating a strong correlation rather than a coincidence. Intuitively, this makes sense: whenever the application experiences a slowdown, it is usually because it is waiting on the database (thus, database time is high), and conversely, when the database operations take a long time, the overall request handling time at the application level is high as well. These two metrics go hand in hand, reflecting a coupling of application logic and database performance. It was noted that the confidence was slightly higher for the rule where high application time is the antecedent leading to high DB time (compared to the inverse). This implies that, while most slow requests involve slow queries, there could be some cases of slow queries that do not always translate to high total app time.
In tests outside of those six, the same basic relationship held, but the rules did not always meet the strict support threshold because in some scenarios either the application or the database was rarely under high load so the “high-high” condition was less frequent. Test 18 (one of the scenarios with all three user classes active in significant numbers) yielded a richer set of rules that satisfied our criteria. In Test 18, we found multiple rules involving CPU usage of different containers:
- Many rules indicated that high CPU usage in the database container and high CPU usage in the application container tended to occur together.
- Some rules also tied the above to high database time as a consequence or antecedent.
Specifically, the top rules in Test 18 could be summarized as clusters of conditions: (High CPU in DB, High CPU in App) ⇒ (High DB Time) and variations thereof, as well as (High DB Time, High CPU in App) ⇒ (High CPU in DB). All of these had identical support around 0.34 and high confidence (often ).
However, these rules in Test 18 also tended to form loops (i.e., each condition implies the other in various combinations), indicating mutual dependencies rather than a clear one-directional insight. In fact, because high load conditions all occur together, the association mining essentially found that “everything is high” implies “everything is high”. While this confirms consistency (when the system is heavily loaded, all metrics show it), it does not provide a novel actionable insight beyond identifying that state.
In summary, the association rule analysis highlighted the tight coupling between different performance metrics. The most important takeaway is the strong link between application-level processing time and database time, suggesting that any performance tuning should consider those two parts jointly. These findings helped inform where to focus further analysis, such as investigating specific endpoints or queries that contribute to those high-latency situations.
5.3. User Classification via Machine Learning
Another analysis avenue was to see if we could classify the type of user (Active vs. ReadOnly vs. Analytical) based on the performance data their actions generate. This is essentially a multi-class classification problem where each “instance” could be a series of metrics observed for a single user or a single user-session. The motivation for this is two-fold: (1) to explore whether the performance metrics carry a signature of user behavior (for example, an AnalyticalUser might cause higher CPU usage bursts that can be detected), and (2) to potentially enable real-time adaptation where the system could detect an incoming user’s pattern and adjust resources or scheduling.
To obtain training data for this, we conducted an additional set of tests (Appendix A—results numbered 21–28) where in each test all three user classes were present simultaneously. Each of these tests was based on one of the earlier scenarios, but instead of having only one or two user types, we combined all three (Table 4). For example, Test 22 corresponded to the conditions of Test 4 (which had certain high-load parameters) but included a mix of Active, ReadOnly, and Analytical users. By doing this for a range of scenarios, we built a dataset where each user action or each user session could be labeled with its known user class.

Table 4.
Description of additional tests performed.
We explored a variety of classification algorithms using scikit-learn and XGBoost, focusing on both simple and more complex models (Table 5—Algorithm 1 provides step-by-step pseudocode for the implemented classification pipeline):

Table 5.
Structural hyper-parameters of the classifiers.
- Tree-based models: Decision Tree, Random Forest, ExtraTreesClassifier, ExtraTreeClassifier, and XGBoost (Extreme Gradient Boosting []).
- Instance-based models: k-Nearest Neighbors, Radius Neighbors, and Nearest Centroid.
- Linear models: LinearSVC (linear Support Vector Classifier), Linear Discriminant Analysis (LDA), and Quadratic Discriminant Analysis (QDA).
- Neural networks: MLPClassifier (Multi-layer Perceptron).
- Probabilistic models: Gaussian Naive Bayes and Bernoulli Naive Bayes.
| Algorithm 1 Classification pipeline used in this study. |
|
The 10-fold cross-validation results confirm the earlier findings.
5.3.1. Research Employing Classifiers
Classification is one of the core tasks in machine learning. It consists of assigning objects to labels drawn from a predefined set of classes on the basis of their features. In other words, the algorithm seeks to recognize patterns in the data that subsequently allow the membership of an object in one of the established categories to be determined. In a typical classification problem, an algorithm is trained on a dataset containing examples provided with correct labels. From these annotated examples, the model learns which properties (features) distinguish individual classes, enabling it to classify previously unseen, unlabeled objects. Assessing the quality of a classification model is a critical phase in building machine-learning systems. A variety of metrics is used to obtain a comprehensive view of an algorithm’s effectiveness. Most of these measures can be calculated in two ways: macro-averaging and micro-averaging.
- Macro-averagingassigns equal weight to every class and is appropriate when we wish to evaluate the model’s performance for each class individually, regardless of class frequency.
- Micro-averaging is more useful when overall performance is of primary interest, particularly for imbalanced datasets.
Accuracy is the proportion of correctly classified samples in the entire test set. Although it is the most intuitive metric, it could be misleading for imbalanced data, where certain classes are represented far more frequently than others. In such cases, a model may achieve high accuracy simply by predicting the dominant class, even though it handles minority classes poorly. Accuracy (1) is computed as
where
- N—the number of classes;
- —true positives for class i;
- —true negatives for class i;
- —false positives for class i;
- —false negatives for class i.
Precision is the ratio of correctly classified samples of a given class to all samples that the model assigned to that class. High precision indicates that the model seldom assigns the class incorrectly, which is crucial in applications where misclassification has serious consequences.
Macro (2) and micro (3)-precision are calculated, respectively, as
The symbols are as in Equation (1).
Recall (also called sensitivity) is the ratio of correctly classified samples of a given class to all samples that truly belong to that class. High recall means that the model successfully identifies virtually all instances of the class, which is essential in applications where missing a positive instance is costly (e.g., fraud detection).
The notation is the same as above. For macro calculations, Formula (4) is used, while for microcalculations, Formula (5) is used.
The F1 score is the harmonic mean of precision and recall, balancing the two metrics. It is particularly helpful for imbalanced datasets because a high F1 score indicates that both precision and recall are high.
Marko is calculated according to Formula (6) and micro according to (8). is calculated according to Formula (7).
The confusion matrix visualizes classification results by showing the numbers of correct and incorrect predictions, enabling a more detailed analysis of model behavior. For a binary problem, matrix (9) takes the form
where
- —true positives;
- —true negatives;
- —false positives;
- —false negatives.
In the system under study, classification was used to predict which user class issued an API request.
In total, 14 classifiers were tested, primarily with default hyperparameters (Appendix B). Model performance was evaluated on a hold-out test set, with the best classification accuracy achieved for test case 22. Approximately half of the tested models performed well out of the box. Specifically, the top seven models—XGBoost, ExtraTreesClassifier, DecisionTreeClassifier, KNeighborsClassifier, RandomForestClassifier, LinearSVC, and MLPClassifier—achieved over 65% accuracy without any hyperparameter tuning. In contrast, simpler models such as Naive Bayes variants and linear discriminant analysis classifiers performed only slightly better than random guessing across the three target classes.
Among the better-performing models, the MLPClassifier (multi-layer perceptron) achieved the highest accuracy in most test scenarios, sometimes above 70%. Test 22 (which was a high-load scenario with mixed users) was noted as yielding the best overall classification results (Table 6). We believe this is because in extreme scenarios, the difference in behavior between user classes is magnified: e.g., AnalyticalUsers stand out due to causing noticeable performance hiccups with their analysis step, whereas in lighter scenarios their impact might be too subtle to distinguish from noise.

Table 6.
User class classification accuracy using selected algorithms.
5.3.2. The Confusion Matrices
We then examined confusion matrices of the best models to see where misclassifications were happening.
The confusion matrix for test No. 22 (all classifiers) is presented (Figure 3, Figure 4, Figure 5, Figure 6, Figure 7, Figure 8 and Figure 9).
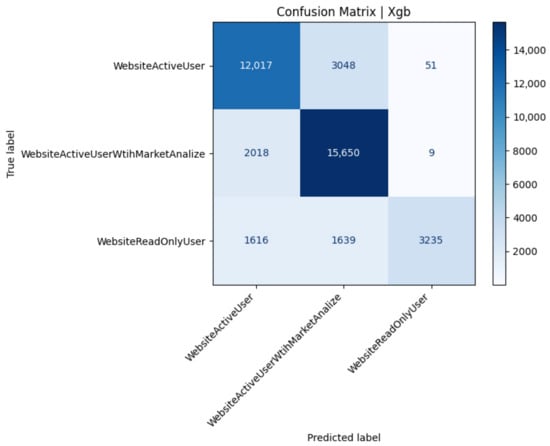
Figure 3.
Confusion matrix of the XGBoost model (Test 22).
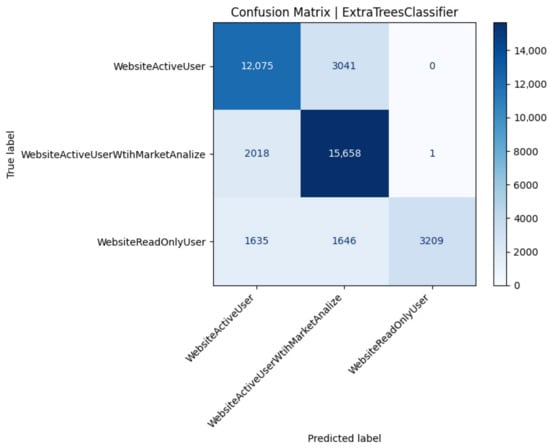
Figure 4.
Confusion matrix of the ExtraTrees model (Test 22).
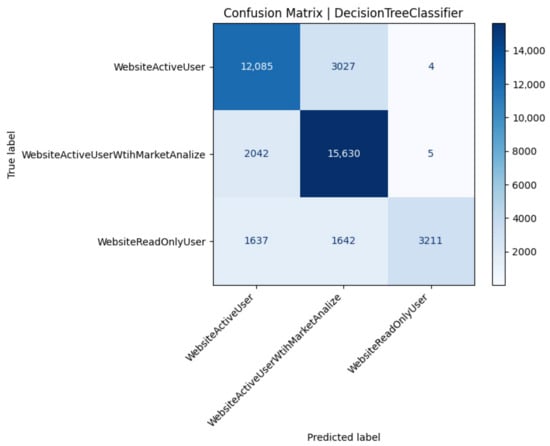
Figure 5.
Confusion matrix of the Decision Tree model (Test 22).
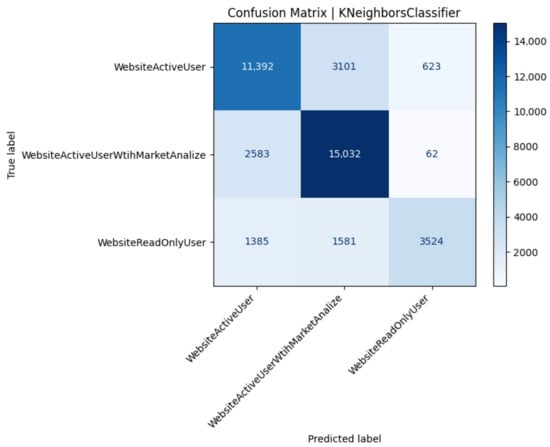
Figure 6.
Confusion matrix of the k-NN model (Test 22).
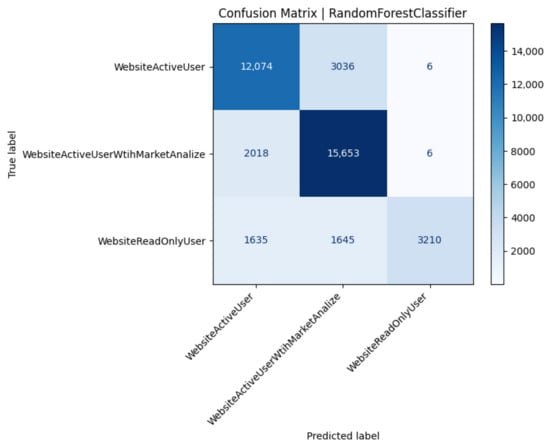
Figure 7.
Confusion matrix of the Random Forest model (Test 22).
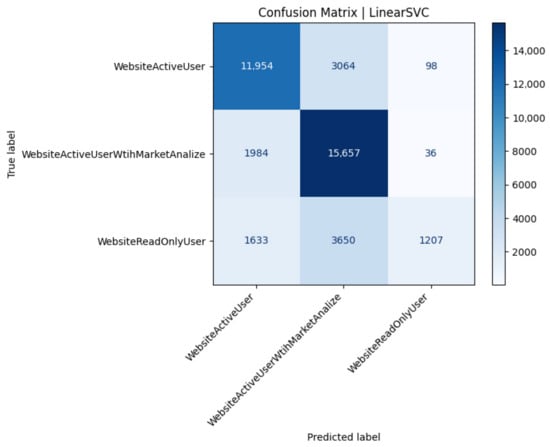
Figure 8.
Confusion matrix of the linear SVC model (Test 22).
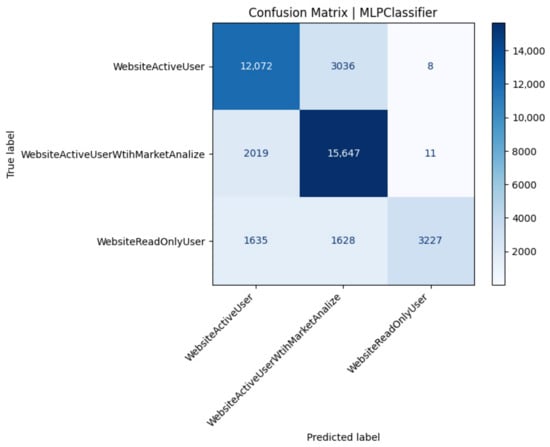
Figure 9.
Confusion matrix of the MLP model (Test 22).
The XGBoost model achieves balanced precision across the two dominant classes (0 and 1) yet suffers a marked recall drop for class 2 (Figure 3). While 79% overall accuracy and a macro-averaged of 0.76 confirm robust generalization, the recall for class 2 indicates that roughly half of minority-class instances are still mis-labeled as majority categories. The very high precision (0.98) for class 2 suggests that when the model does assign the minority label, it is almost always correct, but its decision threshold remains conservative. In operational terms, this implies that infrequent yet important analytical-user traffic will often be mistaken for active-trader behavior, whereas spurious minority detections are rare. Mitigation strategies include oversampling class 2 during training, cost-sensitive loss weighting, or adjusting the decision threshold to trade a modest decrease in precision for a substantial recall gain. Overall, XGBoost offers the highest minority-class specificity among the evaluated models while keeping majority-class performance stable (Table 7).

Table 7.
Performance metrics for the XGBoost classifier (Test 22).
ExtraTrees mirrors XGBoost’s macro-level performance but reveals sharper class-0 separation, evidenced by a three-point recall gain (Figure 4). Perfect precision for class 2 reflects a hard boundary learned by the ensemble. Yet, as with XGBoost, recall remains just below 0.50, highlighting an intrinsic bias toward majority behavior under severe class imbalance. The marginally higher macro precision (0.85) owes to zero false-positive errors for class 2, achieved at the cost of missed detections. Given its shorter training time and competitive accuracy, ExtraTrees is an attractive low-variance baseline (Table 8).

Table 8.
Performance metrics for the ExtraTrees classifier (Test 22).
The single Decision Tree reaches identical headline accuracy to the ensemble methods yet exposes greater variance in minority predictions: its perfect precision for class 2 derives from a single deep node capturing very few true positives (Figure 5). Such brittle splits explain the identical recall deficit (0.49) but also hint at interpretability gains: path inspection shows that analytical users are chiefly identified by extreme CPU-time features. Pruning depth to smooth rare-class leaves improves generalization but lowers class-0 recall, underscoring a trade-off between interpretability and stability (Table 9).

Table 9.
Performance metrics for the Decision Tree classifier (Test 22).
A lazy classifier such as k-NN trades parameter simplicity for elevated minority recall (0.54, +5 pp vs. XGBoost) at the expense of aggregate accuracy and latency (Figure 6). The Euclidean metric over raw feature space is sensitive to local density variations, mildly favoring class 2 instances clustered in high-CPU regions. Nevertheless, class-0 precision drops, signaling overlap between passive and active users in request timing features (Table 10).

Table 10.
Performance metrics for the k-Nearest-Neighbors classifier (Test 22).
Random Forest replicates ExtraTrees’ pattern, confirming that majority-class entropy dominates split selection even when bootstrap resampling injects variance (Figure 7). Minority precision remains perfect, but a 0.49 recall echoes ensemble bias (Table 11).

Table 11.
Performance metrics for the Random Forest classifier (Test 22).
Linear SVC maximizes class-1 recall but collapses minority sensitivity (0.19), illustrating the limitations of a single global hyper-plane in a non-linearly separable space (Figure 8). Nevertheless, the model’s 0.73 accuracy and low computational footprint recommend it as a swift baseline for high-throughput monitoring scenarios where coarse class differentiation suffices (Table 12).

Table 12.
Performance metrics for the linear SVC classifier (Test 22).
The MLP attains ensemble-level accuracy while recovering a sliver of minority recall (0.50) through non-linear hidden-layer feature extraction (Figure 9). Class 2 precision (0.99) indicates minimal false-alarm risk (Table 13).

Table 13.
Performance metrics for the MLP classifier (Test 22).
A common trend was difficulty in distinguishing ActiveUser vs. AnalyticalUser classes from the performance data alone. The confusion matrix showed many ActiveUsers misclassified as Analytical and vice versa. This makes sense as both classes perform frequent trading actions. The main difference is the AnalyticalUser’s additional CPU-heavy queries, but if the system is robust, those extra queries might not always leave a big fingerprint. In contrast, the ReadOnlyUser class () was easier to identify (since they generate no database writes and relatively consistent, lower CPU usage). However, because our dataset had far fewer ReadOnly users compared to Active (i.e., class imbalance with being the smallest class), some models tended to misclassify ReadOnly users as one of the active classes. This is a known issue in classification when one class is under-represented: the classifier may learn to bias towards the more frequent classes to improve overall accuracy at the expense of the rare class. Indeed, we observed that many ReadOnly () instances were wrongly predicted as Active (A) by the MLP model. The model favored the larger classes (A or ) in ambiguous cases, as expected in an imbalanced setting.
These findings suggest that while there is some signal in the performance data to indicate user type, achieving high precision for all classes would require further work. Techniques like hyperparameter tuning (to adjust model complexity or decision thresholds) or resampling (to balance the training data) could improve classification of the minority class . Despite these issues, the classification exercise proved that automated identification of user behavior from system metrics is feasible to some extent. The MLP and tree-based models picked up on features like frequency of write operations (DB time proportion) and patterns of CPU spikes to differentiate classes.
Overall, this analysis demonstrates a potential feedback mechanism: by identifying user classes in real time from performance metrics, the system could dynamically adjust resources or scheduling (for example, allocate more CPU to handle AnalyticalUsers’ expensive operations, or cache more aggressively for ReadOnlyUsers, since they do repetitive reads).
6. Future Work
The analysis and testing we conducted open up several avenues for further development. In this section, we outline three major directions for future work: (1) graph-based data analysis using a graph database and analytics framework; (2) application of deep learning models for performance prediction and anomaly detection; and (3) integration of a Large Language Model to enhance real-time user classification and prediction. These ideas build upon the data and insights gathered, aiming to deepen the understanding of system behavior and improve the system’s adaptability to load.
6.1. Graph-Based Analysis with Neo4j
One promising extension is to transform the performance and trading data into a graph representation to leverage graph analytics. By storing the data in a graph database like Neo4j, we can more naturally model relationships and sequences that are not as obvious in relational tables. Relationships (edges) could represent temporal order (“event A happened before event B”), causality, or correlation (“transaction node connected to the user nodes who participated”; “request node connected to the transaction it triggered”).
6.2. Deep Learning for Performance Prediction and Anomaly Detection
Another area of future work is the application of deep learning techniques to the rich dataset of performance metrics. Many of our data streams are time series (CPU usage over time, response time over time, etc.). Recurrent Neural Networks, particularly architectures like Long Short-Term Memory (LSTM) or Gated Recurrent Unit (GRU), are well suited for learning from sequential data. The market API log data (marketlog) can be aggregated into features per test or per user (like average response time). We are interested in identifying when the system behaves abnormally (performance outliers). Autoencoder networks can be used to detect anomalies by learning a compressed representation of “normal” behavior and then flagging instances that reconstruct poorly (i.e., fall outside the learned manifold).
6.3. Integration of a Large Language Model (LLM)
Given the recent advances in large language models, we plan to integrate an LLM into the system to enhance real-time analysis and decision-making. Specifically, we are considering deploying an instance of the LLaMAmodel (a family of foundation language models by Meta AI) as part of the application ecosystem. The idea is that the LLM can analyze sequences of user actions and system events in a flexible, context-aware manner, potentially improving upon fixed machine learning models for tasks like user classification and behavior prediction.
7. Conclusions
In this paper, we presented a comprehensive examination of a simulated stock trading application under load, covering everything from system architecture and data collection to advanced analysis techniques. We deployed a containerized environment combining Django, PostgreSQL, Redis, and Celery and used Locust to generate realistic user behaviors. A dedicated performance logging setup captured detailed runtime metrics, enabling us to study the system’s behavior in depth.
Through systematic load testing, we identified how various factors impact performance. Our results showed a clear interplay between application processing and database operations: under a high load, these components become tightly coupled, often slowing down in tandem. By mining association rules from the data, we confirmed strong correlations (such as the linkage of high application latency and high DB latency) and the presence of concurrent bottlenecks when the system is pushed to its limits. Using machine learning classification, we demonstrated that it is feasible to automatically categorize user activity patterns from operational data, which can inform dynamic scaling or personalized performance tuning.
By combining traditional performance engineering with data mining and modern AI techniques, our approach provides a blueprint for analyzing complex web applications under stress. The lessons learned here can guide engineers in optimizing similar systems; for instance, focusing on query optimization and caching to address the app/DB coupling, or using classification of usage patterns to inform capacity planning. The integration of new technologies like graph analytics and LLMs, as outlined in our future work, can further transform performance management into a proactive and intelligent process.
Author Contributions
Conceptualization, T.R.; Methodology, M.C.; Software, T.R. and J.D.; Validation, T.R. and M.C.; Formal analysis, T.R.; Investigation, J.D.; Resources, J.D.; Writing—original draft, T.R.; Writing—review & editing, T.R., J.D. and M.C.; Project administration, T.R. All authors have read and agreed to the published version of the manuscript.
Funding
The research leading to these results has received funding from the commissioned task entitled “VIA CARPATIA Universities of Technology Network named after the President of the Republic of Poland Lech Kaczyński”, under the special purpose grant from the Minister of Science, contract No. MEiN/2022/DPI/2578 action entitled “In the neighborhood—inter-university research internships and study visits”.
Data Availability Statement
The original contributions presented in this study are included in the article. Further inquiries can be directed to the corresponding author.
Conflicts of Interest
The authors declare no conflicts of interest.
Appendix A
Stock application project (https://github.com/jasiekdrabek/stockProject (accessed on 1 June 2025)). Experimental results (https://github.com/trak2025zzz/stockResults (accessed on 1 June 2025)).
Appendix B
Description of Jupyter Notebooks (https://github.com/trak2025zz/stockAnalysis2 (accessed on 1 June 2025)):
- prepareData.ipynb—responsible for initial preprocessing. It loads data from a database dump file, converts it to CSV format, sorts it, merges transaction logs with traffic logs, extracts resource usage data for individual containers, determines transaction time intervals, and combines all processed data into a single output file.
- dataAnalysis.ipynb—a Jupyter notebook that performs basic data analysis. It compares API response times for different endpoints, analyzes changes in response time and transaction duration during the tests, and investigates resource usage (CPU and RAM).
- associationRules.ipynb—a script that uses the association rule mining algorithm to find frequently co-occurring patterns in the data. Before applying the algorithm, the data are transformed into binary form based on average thresholds.
- classification.ipynb—a script that applies various classification algorithms (XGBoost, Decision Trees, k-Nearest Neighbors, Random Forest, and MLP) to predict user classes based on performance test data. It compares the effectiveness of these algorithms and analyzes the resulting confusion matrices.
Appendix C
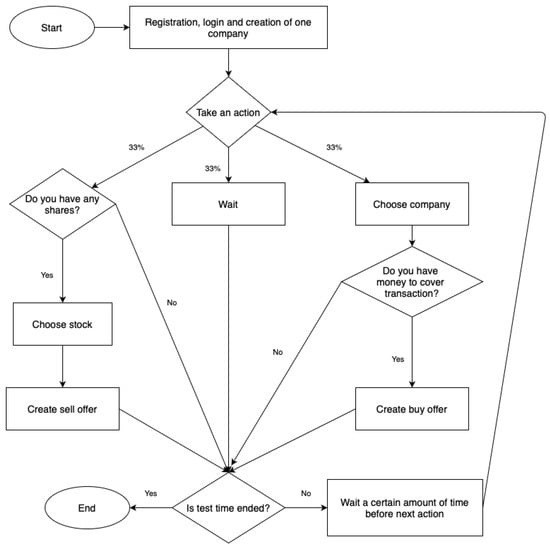
Figure A1.
Active user behavior pattern.
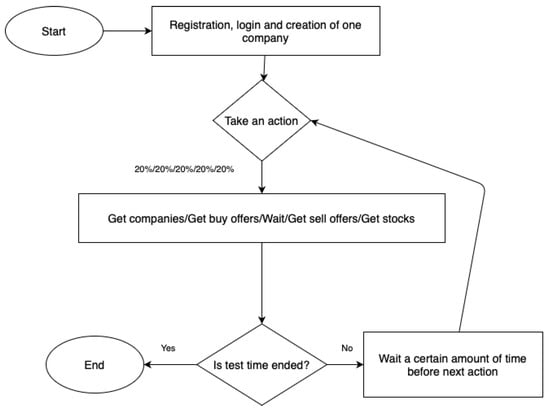
Figure A2.
Read-only user behavior pattern.
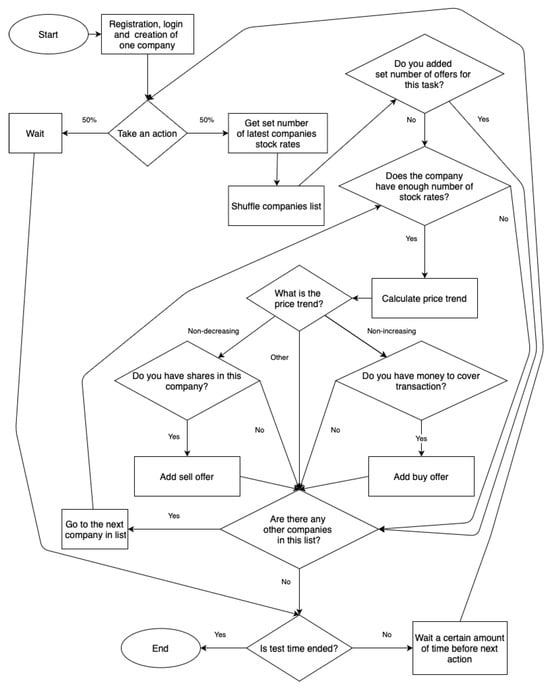
Figure A3.
Analytical user behavior pattern.
References
- Wojszczyk, R.; Mrzygłód, Ł.; Dvořák, J. Improving Performance in Concurrent Programs by Switching from Relational to NoSQL Perspectives. In Lecture Notes in Networks and Systems; Springer: Cham, Switzerland, 2025; Volume 1198 LNNS, pp. 95–103. [Google Scholar] [CrossRef]
- Ząbkowski, T.; Gajowniczek, K.; Matejko, G.; Brożyna, J.; Mentel, G.; Charytanowicz, M.; Jarnicka, J.; Olwert, A.; Radziszewska, W.; Verstraete, J. Cluster-Based Approach to Estimate Demand in the Polish Power System Using Commercial Customers’ Data. Energies 2023, 16, 8070. [Google Scholar] [CrossRef]
- Yu, H.E.; Huang, W. Building a Virtual HPC Cluster with Auto Scaling by the Docker. arXiv 2015, arXiv:1509.08231. [Google Scholar]
- Ermakov, A.; Vasyukov, A. Testing Docker Performance for HPC Applications. arXiv 2017, arXiv:1704.05592. [Google Scholar]
- Felter, W.; Ferreira, A.; Rajamony, R.; Rubio, J. An updated performance comparison of virtual machines and Linux containers. In Proceedings of the 2015 IEEE International Symposium on Performance Analysis of Systems and Software (ISPASS), Philadelphia, PA, USA, 29–31 March 2015; pp. 171–172. [Google Scholar] [CrossRef]
- Sergeev, A.; Rezedinova, E.; Khakhina, A. Stress testing of Docker containers running on a Windows operating system. J. Phys. Conf. Ser. 2022, 2339, 012010. [Google Scholar] [CrossRef]
- Baresi, L.; Quattrocchi, G.; Rasi, N. A qualitative and quantitative analysis of container engines. J. Syst. Softw. 2024, 210, 111965. [Google Scholar] [CrossRef]
- Sobieraj, M.; Kotyński, D. Docker Performance Evaluation across Operating Systems. Appl. Sci. 2024, 14, 6672. [Google Scholar] [CrossRef]
- Mohan, M.S.; Nandi, S. Scale and Load Testing of Micro-Service. Int. Res. J. Eng. Technol. 2022, 9, 2629–2632. [Google Scholar]
- Camilli, M.; Janes, A.; Russo, B. Automated test-based learning and verification of performance models for microservices systems. J. Syst. Softw. 2022, 187, 111225. [Google Scholar] [CrossRef]
- Canay, Ö.; Kocabíçak, Ü. Predictive modeling and anomaly detection in large-scale web portals through the CAWAL framework. Knowl.-Based Syst. 2024, 306, 112710. [Google Scholar] [CrossRef]
- Ma, J.; Liu, Y.; Wan, H.; Sun, G. Automatic Parsing and Utilization of System Log Features in Log Analysis: A Survey. Appl. Sci. 2023, 13, 4930. [Google Scholar] [CrossRef]
- Encinas Quille, R.V.; Valencia de Almeida, F.; Ohara, M.Y.; Pizzigatti Corrêa, P.L.; Gomes de Freitas, L.; Alves-Souza, S.N.; Rady de Almeida, J., Jr.; Davis, M.; Prakash, G. Architecture of a Data Portal for Publishing and Delivering Open Data for Atmospheric Measurement. Int. J. Environ. Res. Public Health 2023, 20, 5374. [Google Scholar] [CrossRef]
- Gaffurini, M.; Flammini, A.; Ferrari, P.; Carvalho, D.F.; Godoy, E.P.; Sisinni, E. End-to-End Emulation of LoRaWAN Architecture and Infrastructure in Complex Smart City Scenarios Exploiting Containers. Sensors 2024, 24, 2024. [Google Scholar] [CrossRef] [PubMed]
- Avornicului, M.C.; Bresfelean, V.P.; Popa, S.C.; Forman, N.; Comes, C.A. Designing a Prototype Platform for Real-Time Event Extraction: A Scalable NLP and Data Mining Approach. Electronics 2024, 13, 4938. [Google Scholar] [CrossRef]
- Nobre, J.; Pires, E.J.S.; Reis, A. Anomaly Detection in Microservice-Based Systems. Appl. Sci. 2023, 13, 7891. [Google Scholar] [CrossRef]
- Chen, G.; Jiang, Y. Application of Data Mining Technology in the Teaching Quality Monitoring of Ideological and Political Courses in Colleges. In Proceedings of the 2024 3rd International Conference on Artificial Intelligence and Education, Xiamen, China, 22–24 November 2024; pp. 477–481. [Google Scholar] [CrossRef]
- Monte Sousa, F.; Callou, G. Analysis of evolutionary multi-objective algorithms for data center electrical systems. Computing 2025, 107, 65. [Google Scholar] [CrossRef]
- Li, T.; Liu, F.; Chen, X.; Ma, C. Web log mining techniques to optimize Apriori association rule algorithm in sports data information management. Sci. Rep. 2024, 14, 24099. [Google Scholar] [CrossRef] [PubMed]
- Bhargavi, M.; Sinha, A.; Desai, J.R.; Garg, N.; Bhatnagar, Y.; Mishra, P. Comparative Study of Consumer Purchasing and Decision Pattern Analysis using Pincer Search Based Data Mining Method. In Proceedings of the 2022 13th International Conference on Computing Communication and Networking Technologies (ICCCNT), Virtual, 3–5 October 2022. [Google Scholar] [CrossRef]
- Patel, T.; Iyer, S.S. SiaDNN: Siamese Deep Neural Network for Anomaly Detection in User Behavior. Knowl.-Based Syst. 2025, 324, 113769. [Google Scholar] [CrossRef]
- Azeroual, O.; Nacheva, R.; Nikiforova, A.; Störl, U.; Fraisse, A. Predictive Analytics intelligent decision-making framework and testing it through sentiment analysis on Twitter data. In Proceedings of the 24th International Conference on Computer Systems and Technologies (CompSysTech 2023), Ruse, Bulgaria, 16–17 June 2023; pp. 42–53. [Google Scholar] [CrossRef]
- Nacheva, R.; Czaplewski, M.; Petrov, P. Data mining model for scientific research classification: The case of digital workplace accessibility. Decision 2024, 51, 3–16. [Google Scholar] [CrossRef]
- Sterniczuk, B.; Charytanowicz, M. An Ensemble Transfer Learning Model for Brain Tumors Classification using Convolutional Neural Networks. Adv. Sci. Technol. Res. J. 2024, 18, 204–216. [Google Scholar] [CrossRef] [PubMed]
- Rak, T.; Żyła, R. Using Data Mining Techniques for Detecting Dependencies in the Outcoming Data of a Web-Based System. Appl. Sci. 2022, 12, 6115. [Google Scholar] [CrossRef]
- Borowiec, M.; Rak, T. Advanced Examination of User Behavior Recognition via Log Dataset Analysis of Web Applications Using Data Mining Techniques. Electronics 2023, 12, 4408. [Google Scholar] [CrossRef]
- Wang, S.; Ren, J.; Fang, H.; Pan, J.; Hu, X.; Zhao, T. An advanced algorithm for discrimination prevention in data mining. In Proceedings of the 2022 IEEE Conference on Telecommunications, Optics and Computer Science (TOCS), Dalian, China, 11–12 December 2022; pp. 1443–1447. [Google Scholar] [CrossRef]
- Rak, T. Performance Evaluation of an API Stock Exchange Web System on Cloud Docker Containers. Appl. Sci. 2023, 13, 9896. [Google Scholar] [CrossRef]
- McKinney, W. Data Structures for Statistical Computing in Python. In Proceedings of the 9th Python in Science Conference, Austin, TX, USA, 28 June–3 July 2010. [Google Scholar]
- Hunter, J.D. Matplotlib: A 2D Graphics Environment. Comput. Sci. Eng. 2007, 9, 90–95. [Google Scholar] [CrossRef]
- Pedregosa, F.; Varoquaux, G.; Gramfort, A.; Michel, V.; Thirion, B.; Grisel, O.; Blondel, M.; Prettenhofer, P.; Weiss, R.; Dubourg, V.; et al. Scikit-learn: Machine Learning in Python. J. Mach. Learn. Res. 2011, 12, 2825–2830. [Google Scholar]
- Chen, T.; Guestrin, C. XGBoost: A Scalable Tree Boosting System. In Proceedings of the 22nd ACM SIGKDD International Conference on Knowledge Discovery and Data Mining, San Francisco, CA, USA, 13–17 August 2016. [Google Scholar]
Disclaimer/Publisher’s Note: The statements, opinions and data contained in all publications are solely those of the individual author(s) and contributor(s) and not of MDPI and/or the editor(s). MDPI and/or the editor(s) disclaim responsibility for any injury to people or property resulting from any ideas, methods, instructions or products referred to in the content. |
© 2025 by the authors. Licensee MDPI, Basel, Switzerland. This article is an open access article distributed under the terms and conditions of the Creative Commons Attribution (CC BY) license (https://creativecommons.org/licenses/by/4.0/).