1. Introduction
Recently, there has been a substantial increase in skin cancers [
1], which can be divided into two groups, namely non-melanoma and melanoma. Melanoma is a type of malignant skin cancer that begins in melanocytes. These are responsible for producing melanin, the pigment that gives the skin its natural color [
2].
Skin analysis is currently a complex task as it is the largest organ in the human body, acting as a protective barrier against the environment, which contains bacteria or viruses. Skin cells are constantly renewed by cellular regeneration, where old cells die and are replaced by new cells, originating from the division of other cells. This process can be affected by external or internal factors, causing mutations in the Deoxyribonucleic Acid (DNA) of the cells. These mutations can cause the life cycle of the cells to become uncontrolled and continue to multiply uncontrollably. These cells are called cancer cells [
3,
4].
Furthermore, the clinical challenges associated with early detection of skin cancer are multifaceted and significantly impact patient outcomes. Visual examination by dermatologists, while considered the gold standard, is highly dependent on clinical expertise and experience. Furthermore, the global shortage of dermatologists creates barriers to timely diagnosis. In many regions, the dermatologist-to-population ratio is critically low, with some areas having less than 1 dermatologist per 100,000 inhabitants, even in developed countries such as Canada [
5]. Thus, access to specialized diagnostics can involve high costs and/or prolonged waiting times, during which potentially malignant lesions may progress to advanced stages where treatment options become limited and survival rates decrease.
The complexity of differential diagnosis presents another critical challenge, as benign lesions can closely mimic malignant lesions, leading to both false positives that cause unnecessary anxiety and procedures, and false negatives that delay critical treatment. Additionally, the anatomical location of lesions in areas that are difficult for patients to self-examine, such as the back, scalp, and between digits, further complicates early detection efforts. There is also the case of lesions in locations the patient might not feel comfortable showing to the clinicians. These clinical realities indicate the need for accessible, reliable screening tools that can assist both healthcare providers and patients in identifying suspicious lesions at earlier stages.
This work postulates that by providing open tools that help detect lesions and alert users to consult a specialist, such tools will facilitate the detection of cancer at an early stage. In this context, the convergence between artificial intelligence, specifically Convolutional Neural Networks (CNNs), and mobile technology emerges as a solution to democratize access to screening tools.
It is also important to note that access to specialized diagnostics can involve high costs and/or long waiting time. Thus, there is a need to develop an open-source application that can be used on mobile devices (smartphones) to evaluate and analyze skin lesions, making the process accessible to the general population. Therefore, the assumption is that by incorporating artificial intelligence (AI) into the application, it will be possible to identify skin cancer early, helping to flag skin lesions and democratizing access to affordable diagnostic technologies.
The proposed solution consists of a multiplatform application that establishes communication with a server, where the image is sent to be analyzed and classified by the model, allowing the classification of skin lesions. The model implemented on the server was selected after a series of tests, and it was the one that presented the greatest accuracy among all the models trained and evaluated.
Specifically, the model was trained to be able to classify seven different types of skin lesions, with a solution based on transfer learning. In this case, a CNN architecture was developed, pre-trained on a large set of general image data, and then additional layers were added for the specific task of classifying skin lesions. This approach allows taking advantage of the general pattern recognition knowledge of the pre-trained network to identify unique characteristics of different types of lesions.
This work aims to perform an evaluation of common CNN models for classifying skin lesions, selecting the model with the best performance to be implemented in the developed client–server architecture. In this case, the client will capture images of skin lesions using a mobile device, and these will be transmitted to a server that will be responsible for processing the image, using the CNN selected to classify the lesion. The server will return the lesion classifications and corresponding probabilities for each one to the mobile device. However, the goal of this work is to compare the performance among the different examined architectures and not to attain the best possible performance with a single model, as this would require tuning the model structure (according to
https://paperswithcode.com/sota/lesion-classification-on-ham10000 (accessed on 22 June 2025) it was reported that Lan et al. [
6] achieved the best performance on the HAM10000 dataset, using a capsule network, with an accuracy of 96.49%, and the subsequent better-performing models employed custom-tuned architecture), while in this work, we chose to use the same macrostructure, changing only the transfer learning model that performs the feature extraction.
The main contributions and novelties of this work are threefold:
First, it presents a benchmark evaluation of 38 deep neural network architectures spanning ten standard CNN families (ConvNeXt, DenseNet, EfficientNet, Inception, InceptionResNet, MobileNet, NASNet, ResNet, VGG, and Xception) for skin lesion classification on the HAM10000 dataset with seven diagnostic classes. This comparative analysis provides insights into the relative performance of state-of-the-art architectures for dermatological image classification.
Second, a cross-database validation was conducted by evaluating the best-performing model on the International Skin Imaging Collaboration (ISIC) 2019 test dataset, demonstrating the generalizability and robustness of the developed approach across different data distributions. This cross-database evaluation addresses a gap in the existing literature where models are typically validated only on a single dataset.
Third, a practical, multiplatform mobile application was implemented in Flutter with a client–server architecture, where the optimized CNN model runs on the server to provide real-time skin lesion classification. This implementation links research and practical deployment, offering an accessible tool for early skin cancer screening that could possibly be adopted by healthcare providers and patients alike for initial screening and priority assessment.
2. Related Work
Numerous studies focus on classifying skin lesions using deep neural networks, and the most relevant contributions of the examined works are summarized.
Mahbod et al. [
7] used pre-trained models, specifically AlexNet, VGG16, and ResNet18, for feature extraction, followed by classification using a support vector machine. The proposed classification was evaluated with 150 images, achieving 83.83% accuracy for melanoma and 97.55% for keratosis.
Similarly, Hekler et al. [
8] used a ResNet50 model and explored the benefits of combining AI with human intervention in the classification of skin cancers. A total of 11,444 images, divided into five categories, were used. A CNN was trained to classify the lesions. Subsequently, 112 dermatologists from 13 German university hospitals and the CNN independently classified a set of 300 lesions. The decisions of both were combined and achieved an accuracy of 82.95%, outperforming the CNN by 81.59%. These results indicate that collaboration between experts and AI can improve the classification of skin lesions.
The work of Amal Al-Rasheed et al. [
9] proposes a method for the classification of various types of skin cancer, using pre-trained models, namely VGG16, ResNet50, and ResNet101. To mitigate the class imbalance in the training dataset, the authors applied data augmentation techniques, such as image transformations, and the generation of realistic dermoscopic images. The pre-trained models were fine-tuned and trained, with VGG16, ResNet50, and ResNet101 achieving an accuracy of 92%, 92% and 92.25%, respectively. The results suggest that a combination of transfer learning models, together with data augmentation techniques, can improve the performance in classifying skin lesions.
Soenksen et al. [
10] also used CNNs to identify skin lesions, including those captured by mobile phone cameras. The system analyzes images of large areas of the skin and detects potentially malignant lesions. This system was trained with 38,283 lesions, and it achieved an accuracy comparable to that of dermatologists. The system demonstrated an agreement of 82.96%, on at least one of the three main lesions, with the experts who evaluated and validated the results.
In the work of Danilo Barros Mendes and Nilton Correia da Silva [
11], a classification of skin lesions was performed using a classification model for 12 types of lesions. The model was a ResNet-152 architecture, trained with 3797 images that were augmented through position, scale, and illumination transformations, obtaining an Area Under the Receiver Operating Characteristic Curve (AUC) of 96% for melanoma and 91% for basal cell carcinoma.
Kartikeya Agarwal and Tismeet Singh [
12] also classified skin lesions using CNNs, but on a dataset from the ISIC (International Skin Imaging Collaboration) repository, consisting of 2947 images divided into benign and malignant. The images were resized, and data augmentation techniques were applied, dividing the dataset into 2900 images for training and 350 for testing. Several models were trained (DenseNet, XceptionNet, ResNet, and MobileNet), obtaining an accuracy of 86.65% in classifying the images.
In the work carried out by Mst Shapna Akter et al. [
13], multiple CNN models were examined. Specifically, six transfer learning models (ResNet50, VGG16, DenseNet, MobileNet, InceptionV3, and Xception) were applied to the HAM10000 dataset [
14]. The models were trained, obtaining accuracies of 90% for InceptionV3, 88% for Xception and DenseNet, 87% for MobileNet, 82% for ResNet50 and 77% for CNN and VGG16. Additionally, they developed models that combined different architectures, but presented performances of 78%.
In the work of Daniel Alonso Villanueva Nunez and Yongmin Li [
15], DenseNet121, VGG16 with batch normalization, and ResNet50 were used for the diagnosis of skin lesions. The models were trained to classify benign and malignant lesions using the HAM10000 dataset. The best model found was ResNet50, which obtained a recall for actinic keratosis lesions of 69%, 93% for basal cell carcinoma lesions, and 76% for melanoma lesions. When the model was adjusted for binary classification, ResNet50 achieved a sensitivity of 92.35%, but VGG16 achieved a sensitivity of 95.40%.
With the advancement of technology, smartphones have become more accessible, allowing them to be used in the development of medical applications. In the work carried out by Ahmed et al. [
16], an application was developed for iOS. This application allowed lesions to be evaluated using a CNN model called MobileNetV2. A total of 48,373 images were used to train the model, which classified lesions as benign or malignant with an accuracy of 91.33%.
In the work of Oztel et al. [
17], an application was developed for the Android operating system with the purpose of distinguishing monkeypox lesions from other lesions. Different pre-trained networks were used, and the networks with the best results and adaptation to mobile applications were chosen. The ResNet18 network achieved an accuracy of 74.27% and transformed into TensorFlow Lite format to be used in the Android application.
Another application developed for Android was presented by Francese et al. [
18]. This application classifies lesions as melanoma or “non-melanoma” in real time. Because the dataset they used was not balanced, the accuracy of the model was 78.8%. The work took into account the asymmetry of the lesion, the border or segmentation of the lesion, the colors of the lesion, the diameter, and the evolution of the lesion. Additionally, RGB (Red, Green, Blue) and HSV (Hue, Saturation, Value) image formats were used.
Another solution for mobile applications was proposed by Hameed et al. [
19], using a cloud architecture, in which the trained model is placed on a server, and the smartphone application sends the image to be analyzed on the server. The model was developed using a Convolutional Neural Network called SqueezeNet, which was trained and tested on 1856 images. This solution had a classification accuracy of 97.21% for four categories: healthy skin, acne, eczema, and psoriasis.
It is therefore clear that the most prevailing approach is to use transfer learning with CNN-based models. It was also observed that using data augmentation methods can lead to better performance. Lastly, the use of mobile applications was shown to be an effective way to provide an interface between the user and the model. However, most works are based on small datasets, have examined a small number of CNN architectures, and have not made the complete solution open-source. Thus, these will be the focus of this work, which examines 38 common CNN architectures, with and without attention mechanisms, on a large dataset, and makes all solutions suitable for mobile and open-source use.
3. Materials and Methods
This work uses CNNs for image classification, taking advantage of transfer learning to train and improve the performance of the models. Furthermore, to address data imbalance, image transformations were performed, only on the training data, to increase the number of samples to be processed by the model, balancing the dataset and verifying that differences in lighting, rotation, and image quality affect the performance of the models.
3.1. Proposed Solution
The architecture proposed for the mobile application was a client–server architecture. The client sends the image to the server, which receives it, processes it, and applies the selected classification model, returning the result to the client. The advantages identified using the architecture with a server are as follows:
Greater processing power, as the server can run more complex and accurate models without the hardware limitations of mobile devices;
Model updates are simplified, since the model can be updated on the server without the need to update the application;
Lower resource consumption on the mobile device, as model processing takes place on the server.
However, the disadvantages identified in this architecture are as follows:
Requires internet access to process images and classify lesions;
Higher latency in predictions;
Infrastructure and server maintenance costs;
Need to ensure privacy for data sent to the server and responses to the client.
The proposed application shares architectural similarities with prior works, particularly Francese et al. [
18], who also adopted a client–server model. This is dissimilar to the approach of Oztel et al. [
17], which relies on fully local, on-device deployment. This approach was initially explored with a similar local deployment strategy. However, a considerable degradation in model accuracy was observed due to the quantization required for conversion to TensorFlow Lite, alongside substantial increases in application size (from a few megabytes to several hundred megabytes). Furthermore, local execution requires end users to have relatively high-end mobile devices, which limits accessibility. In contrast, the proposed system was designed with cross-platform flexibility in mind. Thus, Flutter was used to ensure that the client-side application can be easily adapted for multiple environments, including mobile, web, and desktop, without significant redevelopment efforts, while the server side can remain the same. While the architectural paradigm is a standard client–server solution, this work emphasizes maximizing deployment versatility and accessibility, while preserving model performance, and distinguishes, to the best of the authors’ knowledge, the proposed system from prior work on skin lesion analysis.
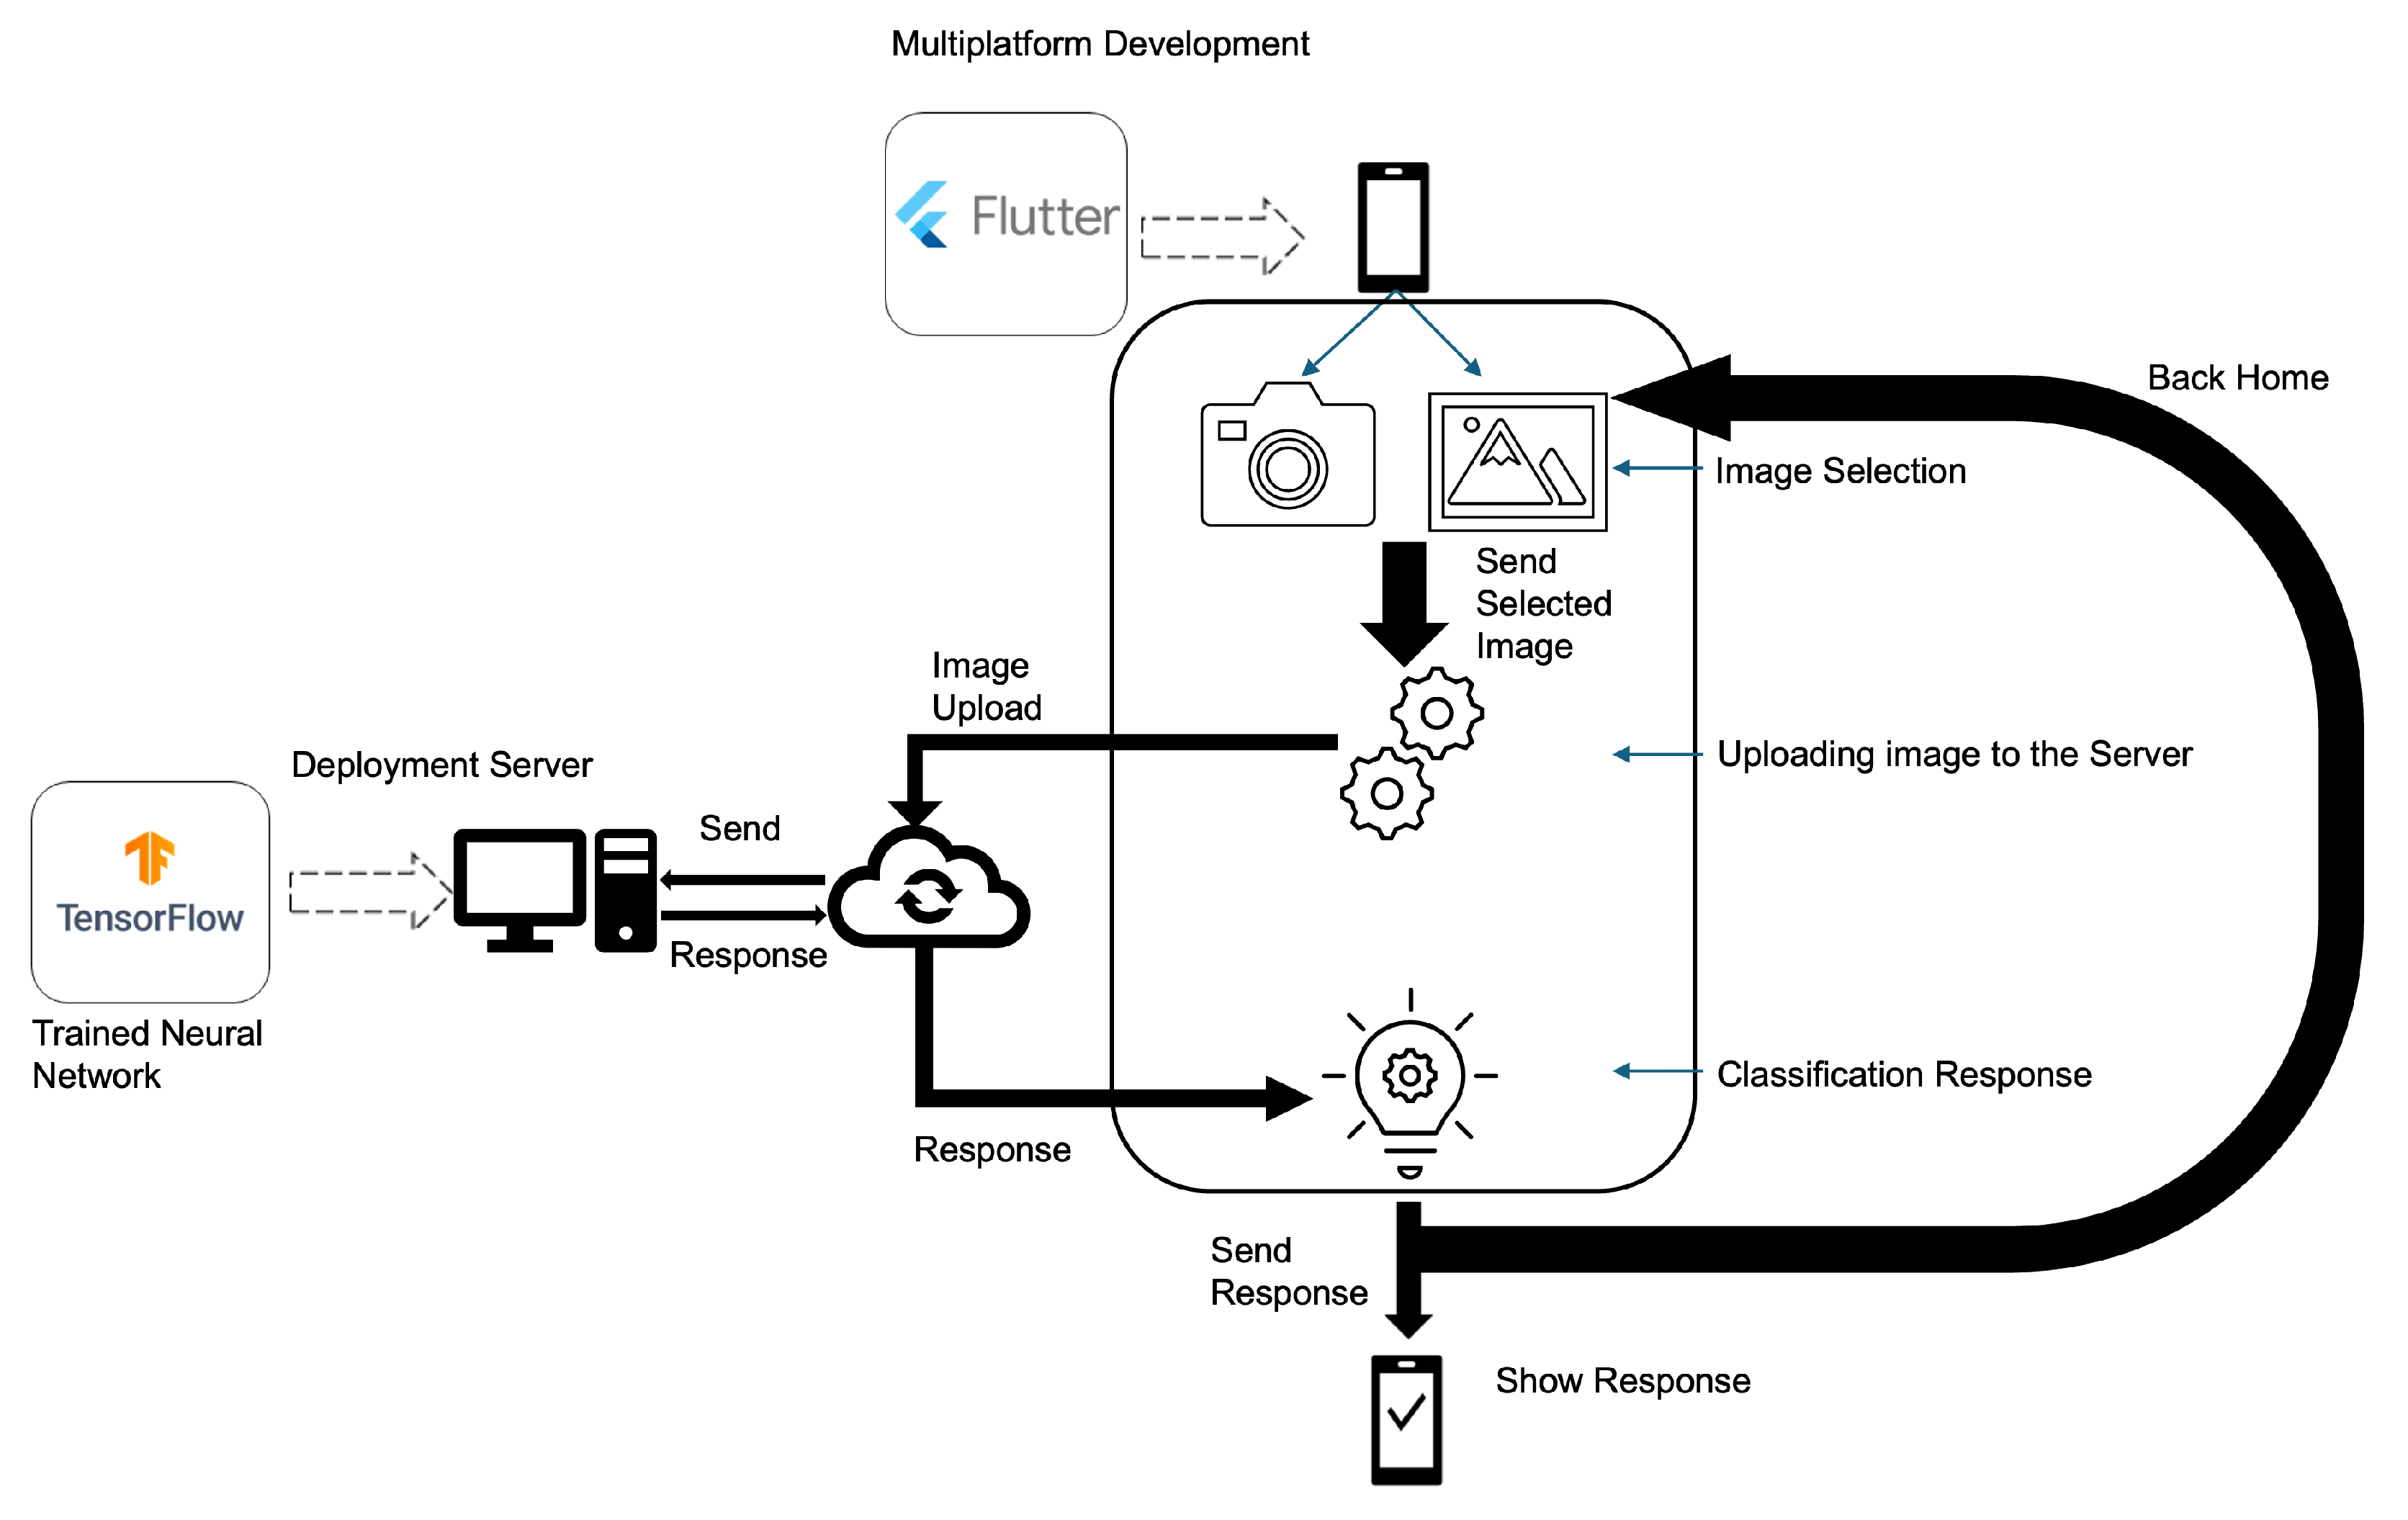
In
Figure 1, the proposed solution for the multiplatform classification process is presented. The image is obtained on a smartphone and is sent to a server that processes the image by applying the selected classification model and returning the result to the mobile device.
To ensure security in data transmission between the client and the server, encryption was used between the mobile device and the server. The encryption used was the AES (Advanced Encryption Standard) algorithm, which is a specification for data encryption established by the US National Institute of Standards and Technology (NIST) in 2001 [
20]. Due to it being a standard and having many implementations, tools and support libraries, AES-256 was used with a 2048-bit key. Additionally, the server is configured with an SSL certificate for secure connections between devices.
The request made to the server will present a response if the token sent to the server matches what is established therein. The developed mobile solution was implemented in Flutter, as it is open-source and allows the creation of applications that run on different operating systems and in a web environment [
21,
22].
In practical deployment scenarios, especially in environments with limited bandwidth or high network latency, it is important to minimize the payload size and optimize the server response time to ensure a smooth user experience. The developed solution was implemented in a standard server (with a graphics processing unit) and can be adapted to use lightweight communication protocols and image compression to reduce transmission time between the mobile device and the server. Additionally, although the server can be benchmarked under simulated high-load conditions in a production environment to evaluate its throughput and ability to handle concurrent requests without significant degradation in response time, in the context of this work, it was employed solely as a proof of concept.
Regarding post-classification image handling, all user-submitted images are processed exclusively in-memory and are not stored persistently on the server. As soon as the image is analyzed by the model and a classification result is produced, the image is immediately discarded. No caching or logging of the original image data occurs at any point in the processing pipeline. This design choice was made to uphold strong privacy guarantees and to ensure compliance with the General Data Protection Regulation (GDPR).
3.2. Examined Dataset
A systematic review was conducted by T. Debelee [
23], with a summary of openly accessible datasets. Among the included datasets, HAM10000 [
14] was selected to develop the models to classify skin lesions. This dataset was selected as the primary dataset for this study as it provides a standardized classification framework that represents clinically relevant diagnostic categories commonly encountered in dermatological practice, providing sufficient sample diversity to support the comparative evaluation of the 38 examined models (across the ten CNN families), which constitutes the primary contribution of this work. The choice of HAM10000 is further validated by its adoption in multiple studies, enabling direct performance comparisons with them under equivalent experimental conditions. The lesions identified in the HAM10000 data repository are classified into the seven categories indicated in
Figure 2, specifically [
24]:
Actinic keratoses (akiec): Types of squamous cell carcinoma, non-invasive, and can be treated locally without surgery;
Basal cell carcinoma (bcc): A type of epithelial skin cancer that rarely spreads, but if left untreated, can be lethal;
Benign keratosis-like lesions (bkl): These are benign lesions similar to keratosis;
Dermatofibroma (df): Skin lesions that are benign growths or that result from an inflammatory response to minor trauma;
Melanocytic nevi (nv): Benign neoplasms of melanocytes and appear in a variety of shapes and sizes; from a dermoscopic point of view, the variants can differ dramatically;
Vascular lesions (vasc): These angiomas can be benign or malignant;
Melanoma (mel): Melanoma is a cancerous tumor that develops from melanocytes and can take many different forms. If detected early, it can be treated with a basic surgical procedure.
In the dataset, there is a large imbalance in the number of samples per class, as indicated in
Table 1 that shows the number of images for each lesion in the complete dataset (indicated as Original) [
14].
Figure 2.
Types of lesions from the HAM10000 image set [
14]: (
A) actinic keratoses, (
B) basal cell carcinoma, (
C) benign keratosis-like, (
D) dermatofibroma, (
E) melanocytic nevi, (
F) vascular lesion, (
G) melanoma.
Figure 2.
Types of lesions from the HAM10000 image set [
14]: (
A) actinic keratoses, (
B) basal cell carcinoma, (
C) benign keratosis-like, (
D) dermatofibroma, (
E) melanocytic nevi, (
F) vascular lesion, (
G) melanoma.
The dataset was initially separated into three groups (with each image belonging only to one group), specifically, training, validation, and testing datasets. The training dataset received 70% of the samples, and the remaining 30% were divided into the validation and test datasets in equal parts.
To balance the training data, transformations on the images were performed, increasing the number of samples. This process is usually called data augmentation [
25] and, from the vast number of possible transformations, it was decided to use only those that are most likely to occur in cell phone cameras, specifically, changing the brightness, rotating by 45°, zooming, and mirroring the image horizontally and vertically, as indicated in
Figure 3.
The total number of available images after data augmentation was performed on the training data is indicated in
Table 1. However, in the original dataset, the nv lesion has enough images to perform training; for this reason, no transformations were performed on this class. A comparison of the distribution of the classes before and after the augmentation is also presented in
Figure 4.
The test and validation datasets had a lower set of images, but no transformations were performed on them to ensure that the performance metrics to be obtained were correct. The total number of images in these datasets is also shown in
Table 1.
3.3. Implemented Models
All examined models used transfer learning, by freezing the layers of the base model and removing the top part of the original model and keeping only the feature generation part. Although complete retraining of the model could yield better performance, such an approach could compromise the comparative nature of this study, as different architectures would benefit unequally from full fine-tuning, making it impossible to isolate the inherent architectural advantages. The standardized transfer learning approach ensures fair comparison across all 38 examined architectures by maintaining consistent training conditions and focusing the evaluation on the feature extraction capabilities of each base model rather than optimization-specific improvements.
The examined architectures for feature extraction were selected to cover the standard CNN architecture for image classification, with and without an attention mechanism. The examined architectures were ConvNeXt [
26], DenseNet [
27], EfficientNet [
28], Inception [
29], InceptionResNet [
30], MobileNet [
31], NASNet [
32], ResNet [
33], VGG [
34], and Xception [
35]. In more detail, the 38 examined models are indicated in
Table 2. The original image shape was
(three color channels).
The number of layers in the model was determined using a TensorFlow function that enumerates all individual layers within the architecture. It is important to note that the number of parameters may differ from the original pre-trained model (as the final top layers were excluded).
Furthermore, Gaussian noise of 0.05 was used to add noise to the input values through a layer introduced between the input layer and the first layer of the feature extraction model. This was conducted to achieve a regularizing effect and reduce overfitting [
36]. The classification component received the output of the feature extraction model, applied batch normalization, flattened it, and applied dropout to further regularize the model. Then, a dense layer was fed with 256 neurons with Rectified Linear Unit (ReLu) activation, followed again by dropout and, lastly, a dense layer with seven neurons (one per class) with softmax activation. For all cases, the dropout used was 24%. Therefore, the macro-architecture was the same for all models and used an input layer, then a Gaussian noise layer, then the transfer learning model (without the final classification components), then batch normalization, followed by flatten, dropout, dense, dropout, and dense layers. Thus, the implemented macro-model is shown in
Figure A2, following the style presented by Chen et al. [
37], using ConvNeXtXLarge as an example in the transfer learning part.
L2 regularization was also applied in order to reduce the risk of overfitting and ensure more stable performance in the datasets [
38]. This approach is useful when developing models that have a large number of parameters, especially if the parameters have high weights [
39]. Specifically, L2 neutralizes especially high coefficients by reducing all coefficient values while minimizing the fit with the training data. The models were allowed to train up to 200 epochs, but the early stopping mechanism, with a patience of 20, ended the training of all models before this limit (preventing overfitting and reducing unnecessary computation). Only the best-performing model was saved.
The model was trained using the Adam optimizer with an initial learning rate of 0.0001. A learning rate schedule was also used, monitoring the validation accuracy. The learning rate was reduced by a factor of 0.2 if no improvement was observed over 10 epochs, with a cooldown period of 5 epochs and a minimum learning rate of 0.000001. The batch size was set to 64.
4. Results
To analyze the model performance, this work considered standard performance metrics for multi-class problems (in this case, seven classes with image analysis and transfer learning [
40]). Specifically, the results obtained for each implemented architecture were analyzed, using standard metrics, namely, macro accuracy (ACC Macro), overall accuracy (Overall ACC), F1 Macro, and the Matthews correlation coefficient (MCC).
These specific metrics were selected due to the multi-class nature and substantial class imbalance present in the dataset. Overall ACC provides a general performance overview but can be misleading in imbalanced scenarios as it may be dominated by the majority classes. Therefore, ACC Macro was included to ensure equal weighting of all classes regardless of their frequency, providing a more balanced assessment across all classes. The F1 Macro score complements this approach by harmonically averaging precision and recall for each class before taking the mean, thus accounting for both false positives and false negatives while maintaining class balance considerations. Then, the MCC was incorporated as it is particularly robust for imbalanced datasets, providing a single metric that considers true and false positives and negatives across all classes.
In addition to these standard classification metrics, this study also evaluates model performance using Top-k ACC Macro metrics, specifically Top-1, Top-2, and Top-3 accuracy. Top-k accuracy measures whether the correct class label appears among the k highest-probability predictions made by the model. Top-1 accuracy is equivalent to the standard Overall ACC mentioned above, representing the percentage of instances where the model’s highest-confidence prediction is correct. Top-2 accuracy expands this criterion to include cases where the correct label appears in either the first or second highest-probability predictions, while Top-3 accuracy considers the top three predictions. These metrics are particularly relevant in multi-class scenarios as they provide insight into the model’s confidence distribution and its ability to rank the correct class highly, even when it may not be the top prediction. Thus, Top-k metrics are especially relevant for this work as multiple classes are similar and it is likely that the model might confuse them.
4.1. Feature Extraction Model Evaluation
The performance of all examined architectures on the test dataset is presented in
Figure 5 and, in more detail, in
Table A1. It is clear that the ConvNeXtXLarge model demonstrated superior performance across all evaluation metrics, achieving the highest values in ACC Macro (96.46%), F1 Macro (76.15%), Overall MCC (75.81%), and Overall ACC (87.62%).
Analyzing
Table A1 in more detail, some notable performance patterns are observed across different model families. Specifically, the ConvNeXt family consistently achieved the highest performance metrics, with ConvNeXtXLarge leading in all four metrics. The EfficientNet models also performed well, particularly the EfficientNetB0, EfficientNetB1, and EfficientNetV2_B2 variants. In contrast, models such as InceptionResNetV2, InceptionV3, and NASNetLarge showed relatively lower performance, especially in the F1 Macro metric, suggesting a poorer balance between precision and recall for these architectures. The ResNet models demonstrated moderate performance, with ResNet50 achieving the best results among that family. Among the more lightweight models, the EfficientNet family generally outperformed MobileNet and MobileNetV2 variants.
The superior performance of the ConvNeXt family, particularly ConvNeXtXLarge, can be attributed to its advanced architecture that combines the strengths of CNNs with transformer-inspired design elements (it can even surpass transformer-based models such as Swin transformer [
26]), allowing for better feature extraction from the used databases, which have complex images of dermatological images with varied lesion morphologies. It is also likely that the model’s larger parameter count enables it to capture more subtle visual patterns that allow distinguishing between similar-appearing skin lesions. EfficientNet models likely performed well due to their compound scaling method that optimally balances network depth, width, and resolution according to available computational resources, making them particularly suitable for this problem, as detail preservation is needed. The relatively poor performance of Inception-based architectures suggests that their Inception modules, while effective for general object recognition, may not optimally capture the subtle textural and color variations characteristic of dermatological lesions. The moderate performance of ResNet models aligns with expectations as it is similar to the results reported in other works although in dissimilar context [
28], but their relatively simpler architecture compared to ConvNeXt lacks the specialized pattern recognition capabilities needed for fine-grained skin lesion classification.
Another relevant analysis is the efficiency of the examined models, calculated by the ratio of Overall ACC to total parameter count.
Figure A1 presents a scatter plot of this analysis. Based on this efficiency metric, the models rank from highest to lowest efficiency in the following order: VGG16; VGG19; DenseNet121; MobileNet; EfficientNetB0; EfficientNetV2_B0; NASNetMobile; ConvNeXtTiny; MobileNetV2; EfficientNetB1; EfficientNetV2_B1; InceptionV3; DenseNet169; EfficientNetV2_B2; EfficientNetB2; DenseNet201; ResNet50; ResNet50V2; EfficientNetV2_S; InceptionResNetV2; ResNet101; EfficientNetB3; EfficientNetV2_B3; ConvNeXtSmall; ResNet152; ResNet101V2; ResNet152V2; ConvNeXtBase; EfficientNetV2_M; Xception; EfficientNetB4; EfficientNetV2_L; ConvNeXtLarge; EfficientNetB5; ConvNeXtXLarge; NASNetLarge; EfficientNetB6; EfficientNetB7.
This ranking reveals that simpler architectures like VGG and lightweight models such as MobileNet achieve the best accuracy-to-parameter ratios, while the larger models demonstrate lower parameter efficiency despite achieving the best performance. Particularly ConvNeXtXLarge exhibits one of the worst parameter efficiency scores yet provides the best performance, suggesting that larger models follow a pattern of diminishing returns, where performance gains come at the cost of increasingly inefficient parameter utilization. This trend indicates that while scaling up model size can improve accuracy, the marginal benefit per additional parameter decreases substantially, potentially approaching a performance plateau where further parameter increases yield minimal performance improvements.
4.2. Best Model Evaluation
The best-performing model was further examined to better understand its performance per class. Thus, the number of correctly classified images in the test dataset, using ConvNeXtXLarge as feature extractor, is indicated in
Table A2. The confusion matrix of this analysis is presented in
Figure 6. Examining these classification results reveals distinct patterns in the model’s performance across different lesion types. The easiest classes to classify were nv with a 95.83% hit rate, followed by bcc, and both bkl and vasc. In contrast, the model struggled more with df, akiec and mel, which showed moderate but still challenging classification rates.
Regarding Top-k, Overall ACC, Top-1, Top-2, and Top-3 were 87%, 96%, and 99%, respectively. These results indicate that the model demonstrates strong performance with improvements as k increases. The jump from 87% (Top-1) to 96% (Top-2) accuracy suggests that in many cases where the model’s primary prediction was incorrect, the correct class was the second-highest probability predictions. This improvement indicates that the model often places the correct class as its second choice when it fails to rank it first. The further improvement to 99% at Top-3 demonstrates that nearly all correct classifications fall within the model’s top three predictions. This pattern indicates good class discrimination capabilities, with the model successfully capturing the correct class within its highest-confidence predictions in 99% of cases, leaving only 1% representing the most challenging instances in the dataset.
Regarding the performance disparities between classes, these can likely be explained by several factors. The superior performance on nv is possibly due to its substantial representation in the training dataset, providing the model with diverse examples to learn from. Additionally, nv typically presents with more consistent and distinctive patterns compared to other lesions. bcc and vasc often exhibit characteristic features that make them visually distinctive. Conversely, the poor performance on df can likely be attributed to its underrepresentation in the dataset (especially considering that it was mostly confused with nv, the most prevalent class) and its variable clinical presentation, as it may lack consistently distinctive features, complicating classification even for experienced dermatologists.
The moderate performance on mel is particularly concerning from a clinical perspective, as this is the most dangerous skin cancer category, but it is notoriously challenging to classify due to its variable appearance and tendency to mimic benign lesions (it was again mostly confused with nv likely for the same reason as indicated before). The similar difficulty with akiec may be due to its often subtle presentation and resemblance to normal skin variations or benign keratoses. These results indicate how class imbalance in the training data, coupled with the inherent visual similarity between certain dermatological conditions, creates substantial challenges for automated classification systems.
To further validate the best-performing model, a cross-database validation was conducted using the ISIC 2019 test dataset [
41,
42], using only data for the same seven classes of HAM10000. The number of samples for akiek, bcc, bkl, df, mel, nv, and vasc was, respectively, 374, 975, 660, 91, 1327, 2495, and 104, totaling 6020 samples. The attained confusion matrix is presented in
Figure 7, where the Top-k Overall Acc for Top-1, Top-2, and Top-3 was, respectively, 56%, 74%, and 86%.
The cross-database validation results reveal a performance drop compared to the original test set, with Top-1 decreasing. This decline is expected and indicative of domain shift challenges when applying models trained on one dataset to another with different imaging conditions, patient populations, or data acquisition protocols. However, the model maintains its ability to improve with increased k values, showing an 18% improvement from Top-1 to Top-2 (56% to 74%) and a further 12% gain to Top-3 (86%). This pattern suggests that while the model struggles with confident primary predictions in the cross-database setting, it retains ranking capabilities, with the correct class frequently appearing among the top three predictions. The 86% Top-3 accuracy demonstrates that the model’s learned representations maintain generalizability across datasets, though the reduced Top-1 performance highlights the importance of domain adaptation techniques for real-world deployment across different clinical settings.
Further analysis of the confusion matrices reveals that the performance drop was primarily caused by the degradation in akiec classification. The model predominantly misclassified akiec as bkl (204 cases) and nv (100 cases), suggesting that the visual characteristics of akiec lesions in the ISIC 2019 dataset might differ substantially from those used for training the model. Other classes showed more moderate performance drops, with df and vasc maintaining relatively stable performance despite the domain shift.
4.3. Comparison with the State of the Art
Table 3 presents a comparison of the models and metrics achieved in this study and the results from the state of the art. It is difficult to perform a direct comparison between the works, as different sample sizes and numbers of classes were used. It is also important to note that comparing models across studies is inherently prone to bias. For instance, some studies directly use dermoscopic images, while others apply image-enhancing techniques that influence model performance. Additionally, class definitions and grouping criteria can differ, which impacts the difficulty of the classification task. Thus, comparisons in
Table 3 should be interpreted as indicative rather than definitive. Nonetheless, an initial analysis can be performed, and it is notable that the developed work is aligned with state-of-the-art performance despite using a larger dataset and more classes.
Specifically, the studies examined in
Table 3 demonstrate considerable heterogeneity in classification complexity, ranging from binary classification tasks to multi-class problems with up to twelve distinct categories. Binary classification approaches, such as those employed by Ech-Cherif et al. [
16] (benign vs. malignant) and Francese et al. [
18] (melanoma vs. non-melanoma), inherently present less complex decision boundaries compared to multi-class scenarios. Ech-Cherif et al. achieved 91.33% accuracy using MobileNetV2 for binary classification, while Francese et al. reported 78.8% accuracy for melanoma detection. These results, while seemingly comparable to the present work’s 87.62% accuracy, must be contextualized within the significantly reduced classification complexity of binary tasks.
In contrast, studies addressing multi-class classification problems more closely approximate the complexity of the present work. Akter et al. [
13] examined the same dataset as used in this work and reported an accuracy of 90% with InceptionV3. However, it is not clear how the model was trained or if augmentation was used. Thus, this comparison would require consideration of dataset preprocessing, augmentation strategies, and validation methodologies. Similarly, Al-Rasheed et al. [
9] reported accuracies ranging from 87.7% to 90.0% when using a single model or an ensemble of models, aligning with the attained performance of this work. Nunez and Li [
15] also reported an accuracy of 90%, though it is not clear how this metric was calculated as no test data was specified.
It is important to note that the dataset scale variations across studies substantially impact the validity of performance comparisons. The present work utilizes a dataset with over 10,000 images, whose training images then passed through an augmentation process, representing one of the larger-scale studies in the comparison. In contrast, several works employed substantially smaller datasets; for example, Mahbod et al. [
7] used 150 images for validation (without specifying the test data), while Soenksen et al. [
10] employed a dataset with 38,283 lesions. The substantial difference in dataset scale introduces questions regarding model generalizability and robustness, as larger datasets typically provide a more comprehensive representation of lesion variability, potentially leading to more robust models, although they may also present increased classification challenges due to greater intra-class variation.
The architectural choices across studies reveal performance patterns that provide context for the present work’s results. Multiple studies demonstrate the effectiveness of ResNet architectures (the most commonly used architecture in the examined works): Hekler et al. [
8] achieved 82.95% accuracy with ResNet50 combined with human intervention, while Mendes and Silva [
11] reported AUC values of 96% for melanoma and 91% for basal cell carcinoma using ResNet152. These results suggest that ResNet architectures maintain competitive performance for dermatological classification tasks.
Other commonly used architectures, such as the EfficientNet family, are not extensively represented in the comparison studies, but still demonstrate considerable performance in the present work. Furthermore, the absence of ConvNeXt architectures in previous comparative studies highlights the novelty of applying these architectural designs. The 87.62% accuracy achieved with this architecture for seven-class classification represents competitive performance, particularly considering the dataset scale. The diversity of evaluation metrics employed across studies also complicates direct performance assessment. While accuracy serves as a common metric, its interpretation varies depending on dataset balance and classification complexity.
4.4. Smartphone Application
The application, as a proof of concept, provides an option on the screen that allows the classification of the image. After selecting the image, a button with the “Classify Image” option is available, which communicates with the server, encrypting the selected image. Upon capturing or selecting an image, the user initiates the classification request. The backend server, which hosts the ConvNeXtXLarge model (identified as the best-performing model), processes the image and returns the predicted class probabilities for each of the seven lesion categories. These probabilities are visualized on the device using a bar graph, providing an intuitive representation of the model’s confidence levels. This output format allows non-specialist users to easily understand the examination outcome.
Figure 8a shows the interface with an example of an image to be classified. The classification result is presented in a bar graph with the corresponding classification for each type of lesion, as shown in
Figure 8b.
The simplified design approach adopted for this proof of concept was intentionally chosen to prioritize accessibility and usability, particularly for non-technical users and older adults. Such was achieved presenting only the essential elements, the clean and minimalistic interface reduces cognitive load, enabling users to concentrate on the core functionality without becoming overwhelmed. This consideration is especially relevant for elderly users, who may have limited experience with digital technologies. It is also important to note the interface choices with large buttons, minimal text, and simplified visual feedback. As a proof of concept, the primary objective is to demonstrate the core functionality of skin lesion classification by providing the general public with an accessible tool for the preliminary evaluation of skin lesions.
As a result, the proposed approach aims to support early-stage detection, democratize access and contribute to making dermatological evaluation more inclusive and widely available to the general population. Therefore, in addition to its role as a functional demonstrator, the proposed smartphone application represents a prototype for possible real-world clinical support tool aimed at the early detection of dermatological anomalies.
5. Conclusions
In recent years, there has been a substantial increase in skin cancers, and providing open tools that assist in detecting lesions can facilitate the detection in the early stages, democratizing access to a screening tool and making the process accessible to the general population.
This work contributes by performing CNN family architectural evaluation for skin lesion classification, providing a benchmarking of 38 deep neural network architectures across ten CNN families. The ConvNeXtXLarge model achieved the best performance with 87.63% Overall ACC (on the used HAM10000 test set) and this performance falls within the range of the examined HAM10000-based studies (74–92%), demonstrating the practical viability of applying transfer learning on standard CNN models for dermatological image classification. The systematic evaluation represents, to the authors’ knowledge, the most extensive comparative study in this domain. While achieving state-of-the-art performance was not the primary objective (the focus being on comparative benchmarking under standardized architectural conditions rather than models), the results demonstrate competitive classification capability. Analysis of the accuracy-to-parameter ratio revealed that ConvNeXtXLarge, despite achieving the highest performance, exhibited one of the lowest efficiency ratios, indicating diminishing returns with increased model complexity. This suggests that performance gains from larger architectures come at the cost of substantially reduced parameter efficiency, potentially approaching performance plateaus where additional parameters yield minimal improvements. A mobile-based implementation was also developed, as proof of concept, to allow a user-friendly experience when accessing injury classification.
The cross-database validation using the ISIC 2019 test dataset demonstrated model generalizability despite expected performance degradation due to domain shift. The ConvNeXtXLarge model achieved Top-1, Top-2, and Top-3 accuracies of 56%, 74%, and 86%, respectively. While Top-1 accuracy declined compared to the HAM10000 test set, the substantial improvement with increased k values (18% gain from Top-1 to Top-2, 12% from Top-2 to Top-3) indicates preserved ranking capabilities. Performance degradation was primarily attributed to akiec classification challenges, with frequent misclassifications as bkl (204 cases) and nv (100 cases), suggesting dataset-specific visual characteristic variations. The 86% Top-3 accuracy demonstrates that the model learned representations across different imaging conditions and acquisition protocols, while highlighting the importance of domain adaptation for cross-clinical deployment.
This work is focused on the use of CNN-based models. Nevertheless, transformer-based models could also provide good performance and are, therefore, indicated as a future work, suggesting that they be examined in a systematic way, with multiple transformer architectures. It is also recommended to examine larger datasets and to validate the mobile application, especially with usability tests. Furthermore, there is a need to examine the effect of each augmentation in the model performance to assess which augmentations are more relevant. A future work will also focus on validating the usability of the developed application, here used as a proof of concept to illustrate the feasibility of integrating the proposed models into an application.
It is also needed to develop a standardized evaluation protocols to enable more meaningful cross-study comparisons. Specifically, this comparative analysis acknowledges several limitations that constrain definitive performance ranking. The heterogeneity in experimental protocols, dataset preprocessing approaches, and evaluation methodologies across studies prevents direct statistical comparison. Additionally, the temporal distribution of studies introduces technological advancement biases, with more recent architectures (such as ConvNeXt) potentially benefiting from accumulated knowledge and improved training methodologies.


