Abstract
In order to accurately grasp the operational state of DC protection devices in converter stations, a DC protection device state assessment method based on the variable weight theory and correlation degree analysis is proposed. Constructing condition assessment indicators for DC protection device of converter stations containing overhaul in-formation, operation information and defect information, when the actual value of the indicator exceeds the specified range of values, the DC protection device is directly judged to be in ‘alarm’ status; when the actual value of the indicator is within the specified range of values, Analytic Hierarchy Process (AHP) and variable weight theory are combined to adjust variable weights of assessment indicators in real time. At the same time, the correlation between the indicators and each state level is calculated, and the correlation of the indicators and their corresponding weights are weighted and summed to obtain the comprehensive correlation of each state level of the DC protection device, and the correlation of each state level of the DC protection device is calculated, using the principle of maximum correlation, the DC protection device status is obtained. Example analyses show that the method is simple and easy to implement and can accurately assess the operational state of the DC protection device in converter stations.
1. Introduction
The reverse distribution of energy resources and load centers, a consequence of China’s natural resource endowment, makes AC/DC interconnection of the national power grid and large-scale power transmission between regional power grids an inevitable choice for the development of China’s power grid [1]. In hybrid AC/DC power grids with large-scale new energy integration, converter stations undertake the role of AC/DC power conversion. These stations contain numerous DC equipment, each configured with corresponding protection devices. Maloperation or failure to operate of these protection devices can have a significant impact on the DC power transmission system. Therefore, accurately assessing the operational status of DC protection devices in converter stations is of great significance for ensuring the safe and reliable operation of the DC power transmission system.
For the status assessment of protection devices, it is crucial to scientifically and rationally establish a status assessment indicator system and to determine the weights of these indicators using scientific evaluation methods [2,3,4]. With the microprocessor-based development of protection devices and the deployment of various types of sensors, the operational status monitoring of these devices has become more comprehensive and detailed; consequently, the variety of assessment indicators and the volume of data generated have also increased. As the primary step in evaluating equipment operating status, constructing a status evaluation index system that conforms to the actual operating status of the current equipment will directly affect the accuracy of the evaluation results [5]. Prior literature [6,7] considered the conditions of “Cloud, Big Data, IoT, Mobile, and Intelligence” and constructed a strategic indicator set for relay protection equipment including multi-dimensional indicators such as reliability, safety, maintainability, supportability, testability, and overall equipment effectiveness; Prior literature [8] proposed evaluating the operating status of relay protection devices from four aspects: action, fast tripping, defects, and responsibility; Prior literature [9] proposed assessing the status of protection devices from three aspects: time performance, steady-state performance, and electrical performance.
The aforementioned construction of status evaluation index systems for protection equipment mostly targets AC protection equipment, and a set of operating status evaluation index systems that meet application requirements for DC protection devices has not yet been established.
In the field of power systems, numerous scholars have already researched the status evaluation of secondary equipment, with methods based on the cloud model [10,11] and fuzzy comprehensive evaluation [12,13,14] being relatively common for their assessment. Both of the above methods are based on fuzzy operators to perform weighted calculations of the membership degrees and weights of indicators at the same level. Starting from the lowest level indicators and calculating upwards level by level, this process achieves the conversion of indicator level membership degrees to target level membership degrees, thereby obtaining the protective equipment status assessment results. Based on the determined state assessment indicators for secondary equipment, assigning appropriate weights to each indicator is key to evaluating their operating status. Prior literature [15,16] used a combination weighting method to calculate the assessment indicator weights. However, there are still shortcomings in the process of obtaining secondary equipment weights; the indicator weights calculated by the combination weighting are fixed weights, which do not change with the variation in the actual values of the assessment indicators [17].
Based on this, this paper proposes a state assessment method for converter station DC protection devices based on variable weight theory and correlation degree analysis. A state assessment index system for converter station DC protection devices is constructed, including maintenance information, operation information, and defect information. When the actual value of a single index or multiple indexes of a DC protection device exceeds the specified range of the index, the state of the DC protection device is directly judged as “alarm”; when the actual values of the indexes are all within the specified range, the variable weight theory is used on the basis of the analytic hierarchy process to achieve real-time correction of the weights of each state assessment index. At the same time, a correlation degree function for converter station DC protection device state assessment indexes is constructed to calculate the correlation degree between the state assessment indexes and each state level, and the state of the DC protection device is obtained using the maximum correlation degree principle. The effectiveness of the proposed method is verified through practical examples.
2. Construction of Status Assessment Indicators for Converter Station DC Protection Devices
2.1. Establishment of Assessment Indicators for DC Protection Devices
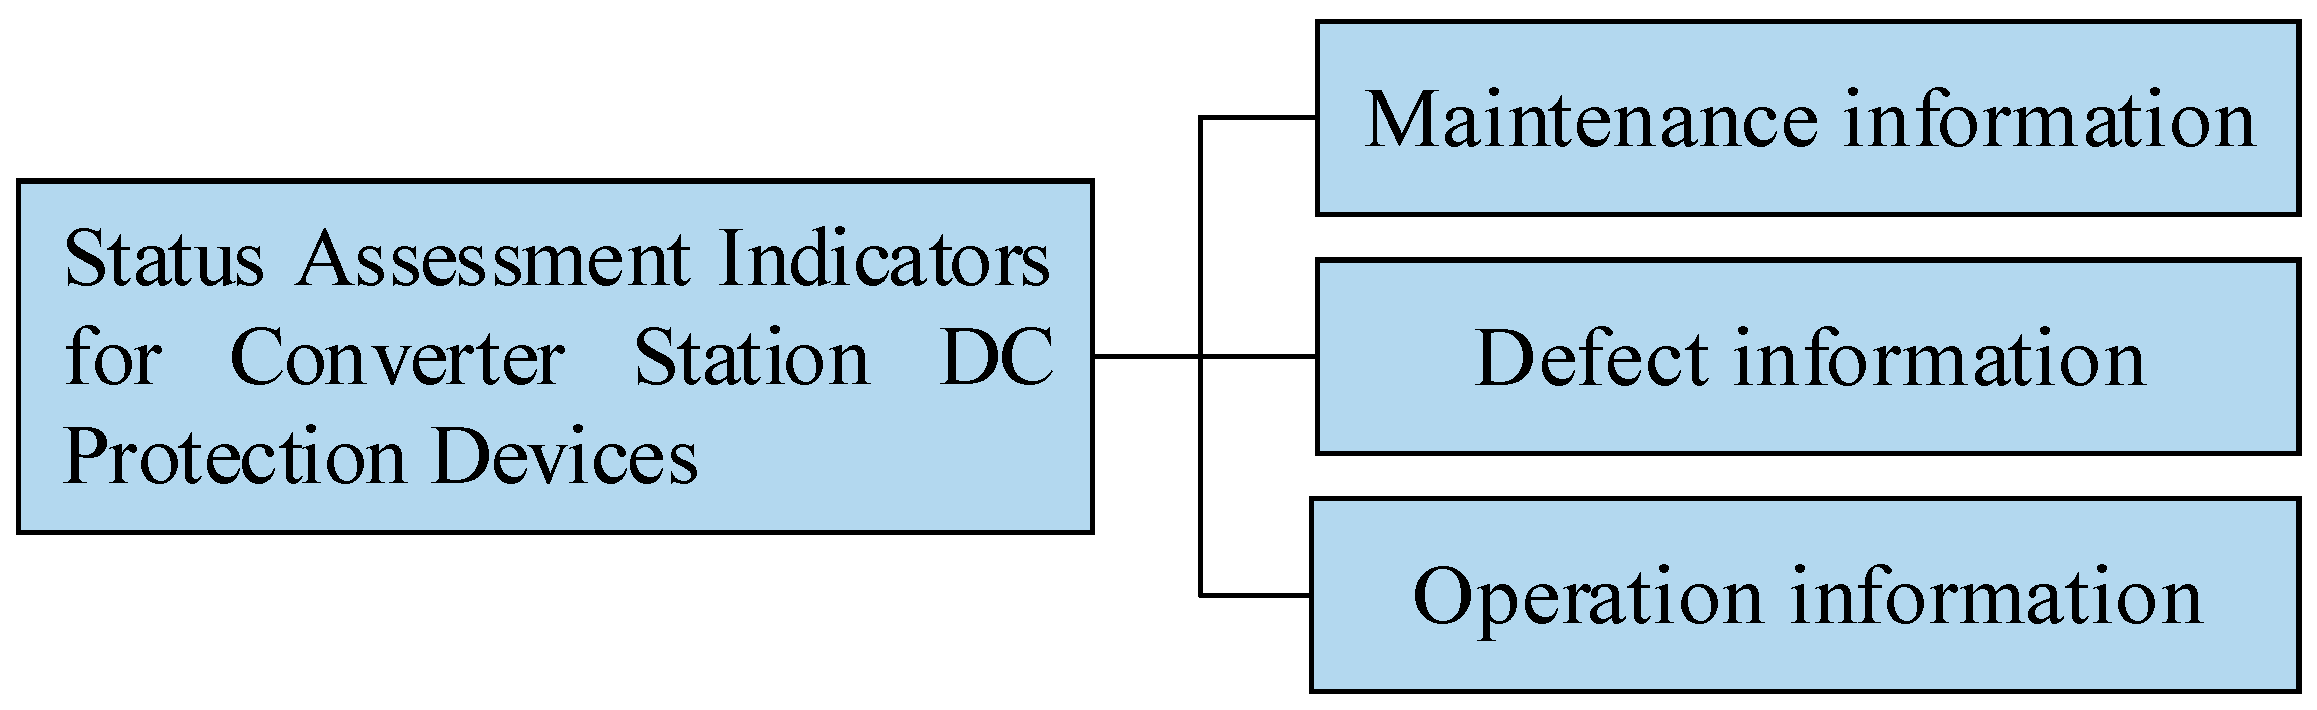
Compared to other protection devices in power systems, DC protection devices require faster response speeds to handle sudden faults in DC transmission systems. Therefore, it is necessary to construct status assessment indicators for DC protection devices that meet application requirements, based on their operational characteristics. The operation of DC protection devices is influenced by multiple factors such as their environment, maintenance cycles, and operating time. Reasonable status assessment indicators are the basis of status assessment research, and the selection of status assessment indicators for DC protection devices directly determines whether the actual operating status of converter station DC protection devices can be accurately represented. Starting from the practical operational characteristics of DC protection devices, this paper screens status assessment indicators by comparing relevant standards such as guidelines for DC protection device status evaluation and technical requirements for DC protection devices, as well as relevant standards like guidelines for relay protection equipment status evaluation and operational evaluation procedures. Based on the nature of the indicators, they are divided into maintenance information, operation information, and defect information. The constructed status assessment indicators for converter station DC protection devices are shown in Figure 1.
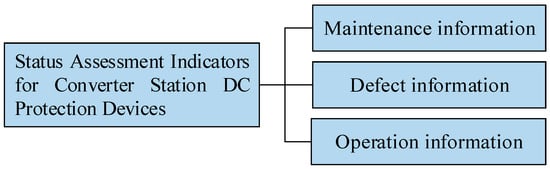
Figure 1.
Indicators for status assessment of DC protection devices in converter stations.
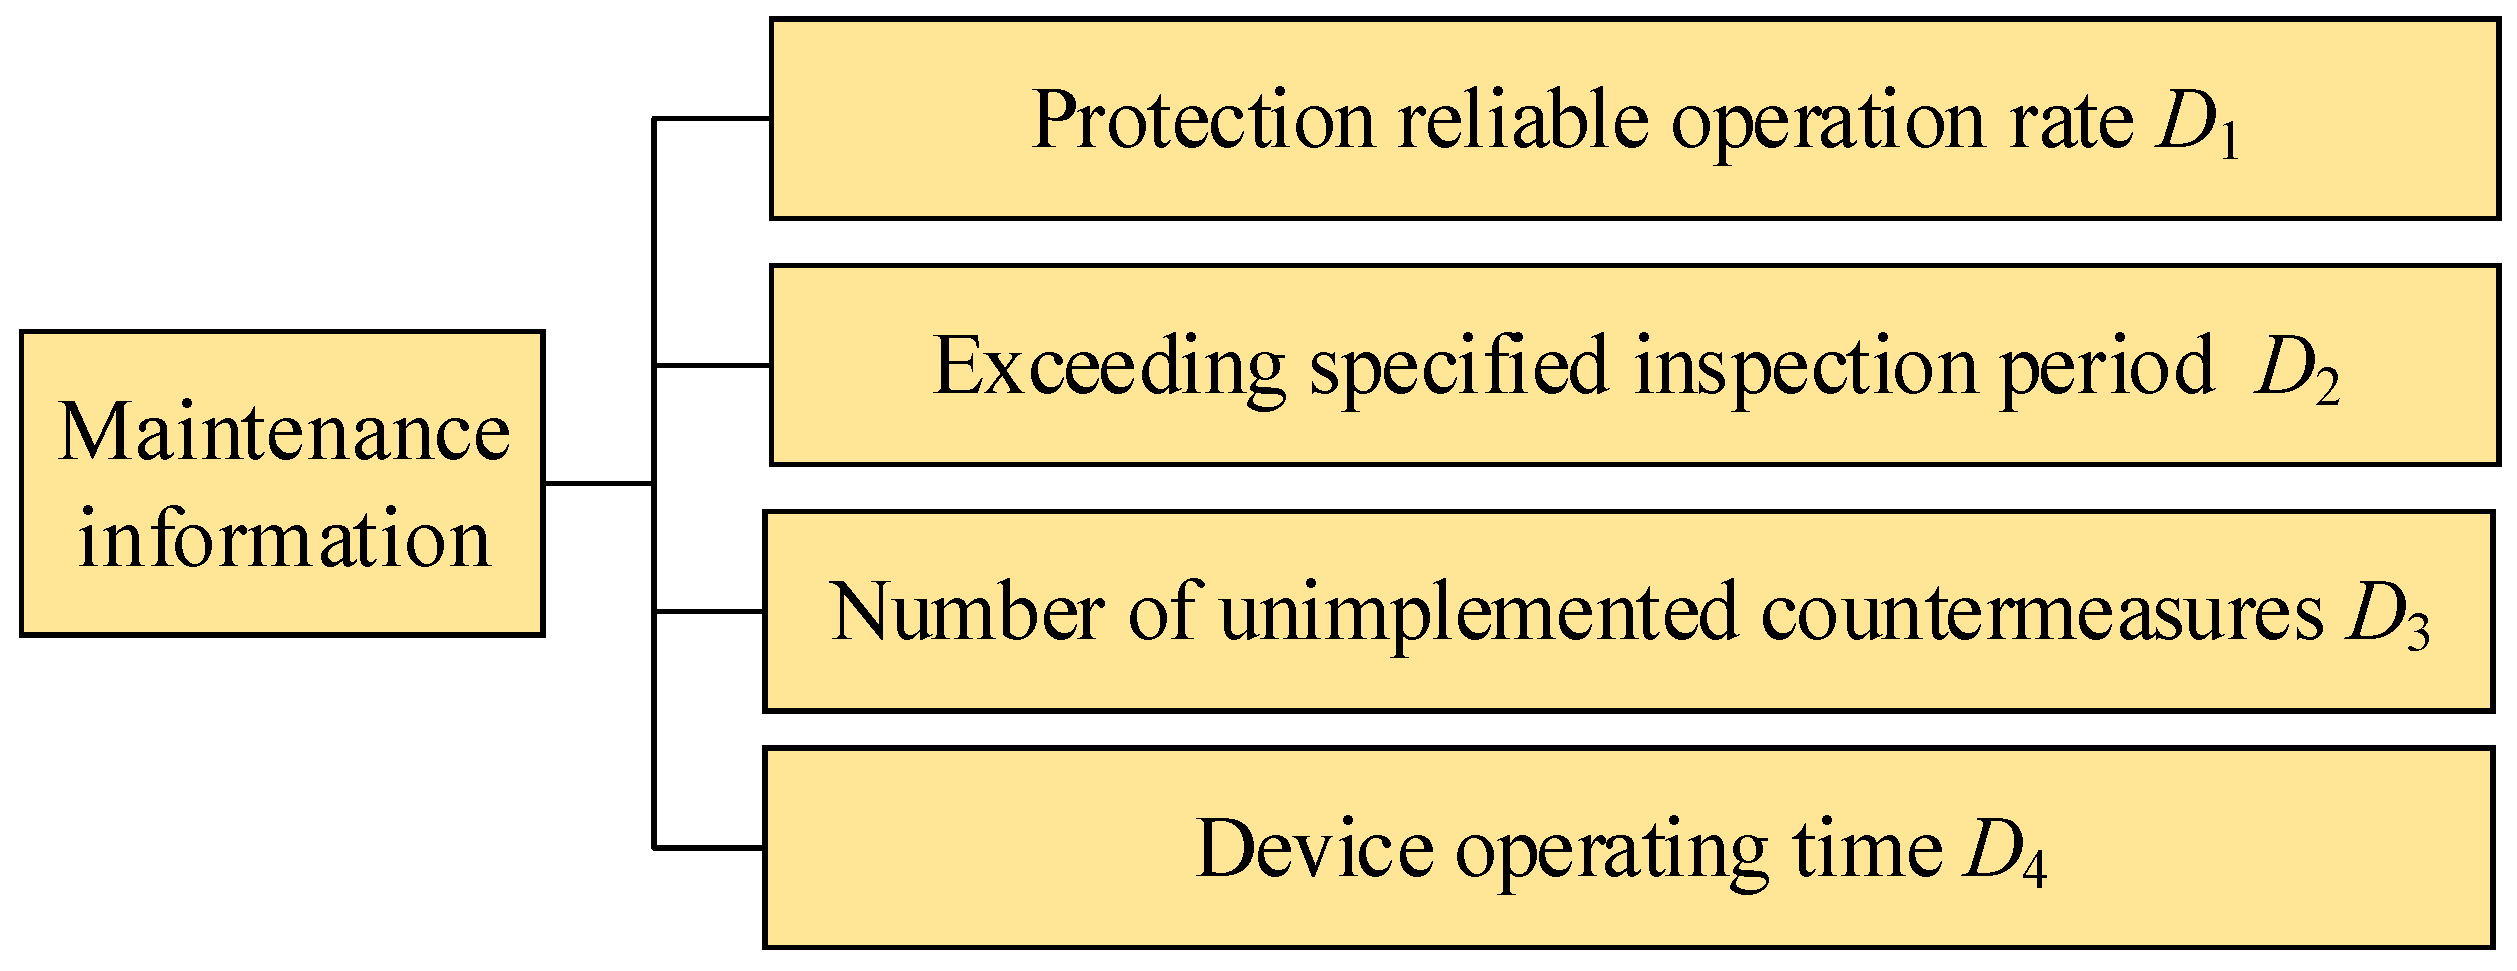
(1) Maintenance information
The maintenance information of the DC protection devices in converter stations is shown in Figure 2.
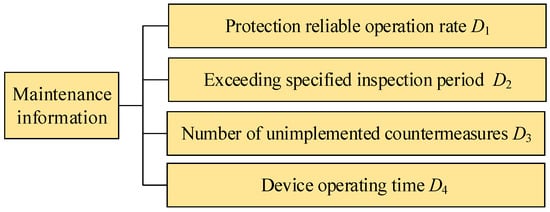
Figure 2.
The maintenance information of the DC protection devices in converter stations.
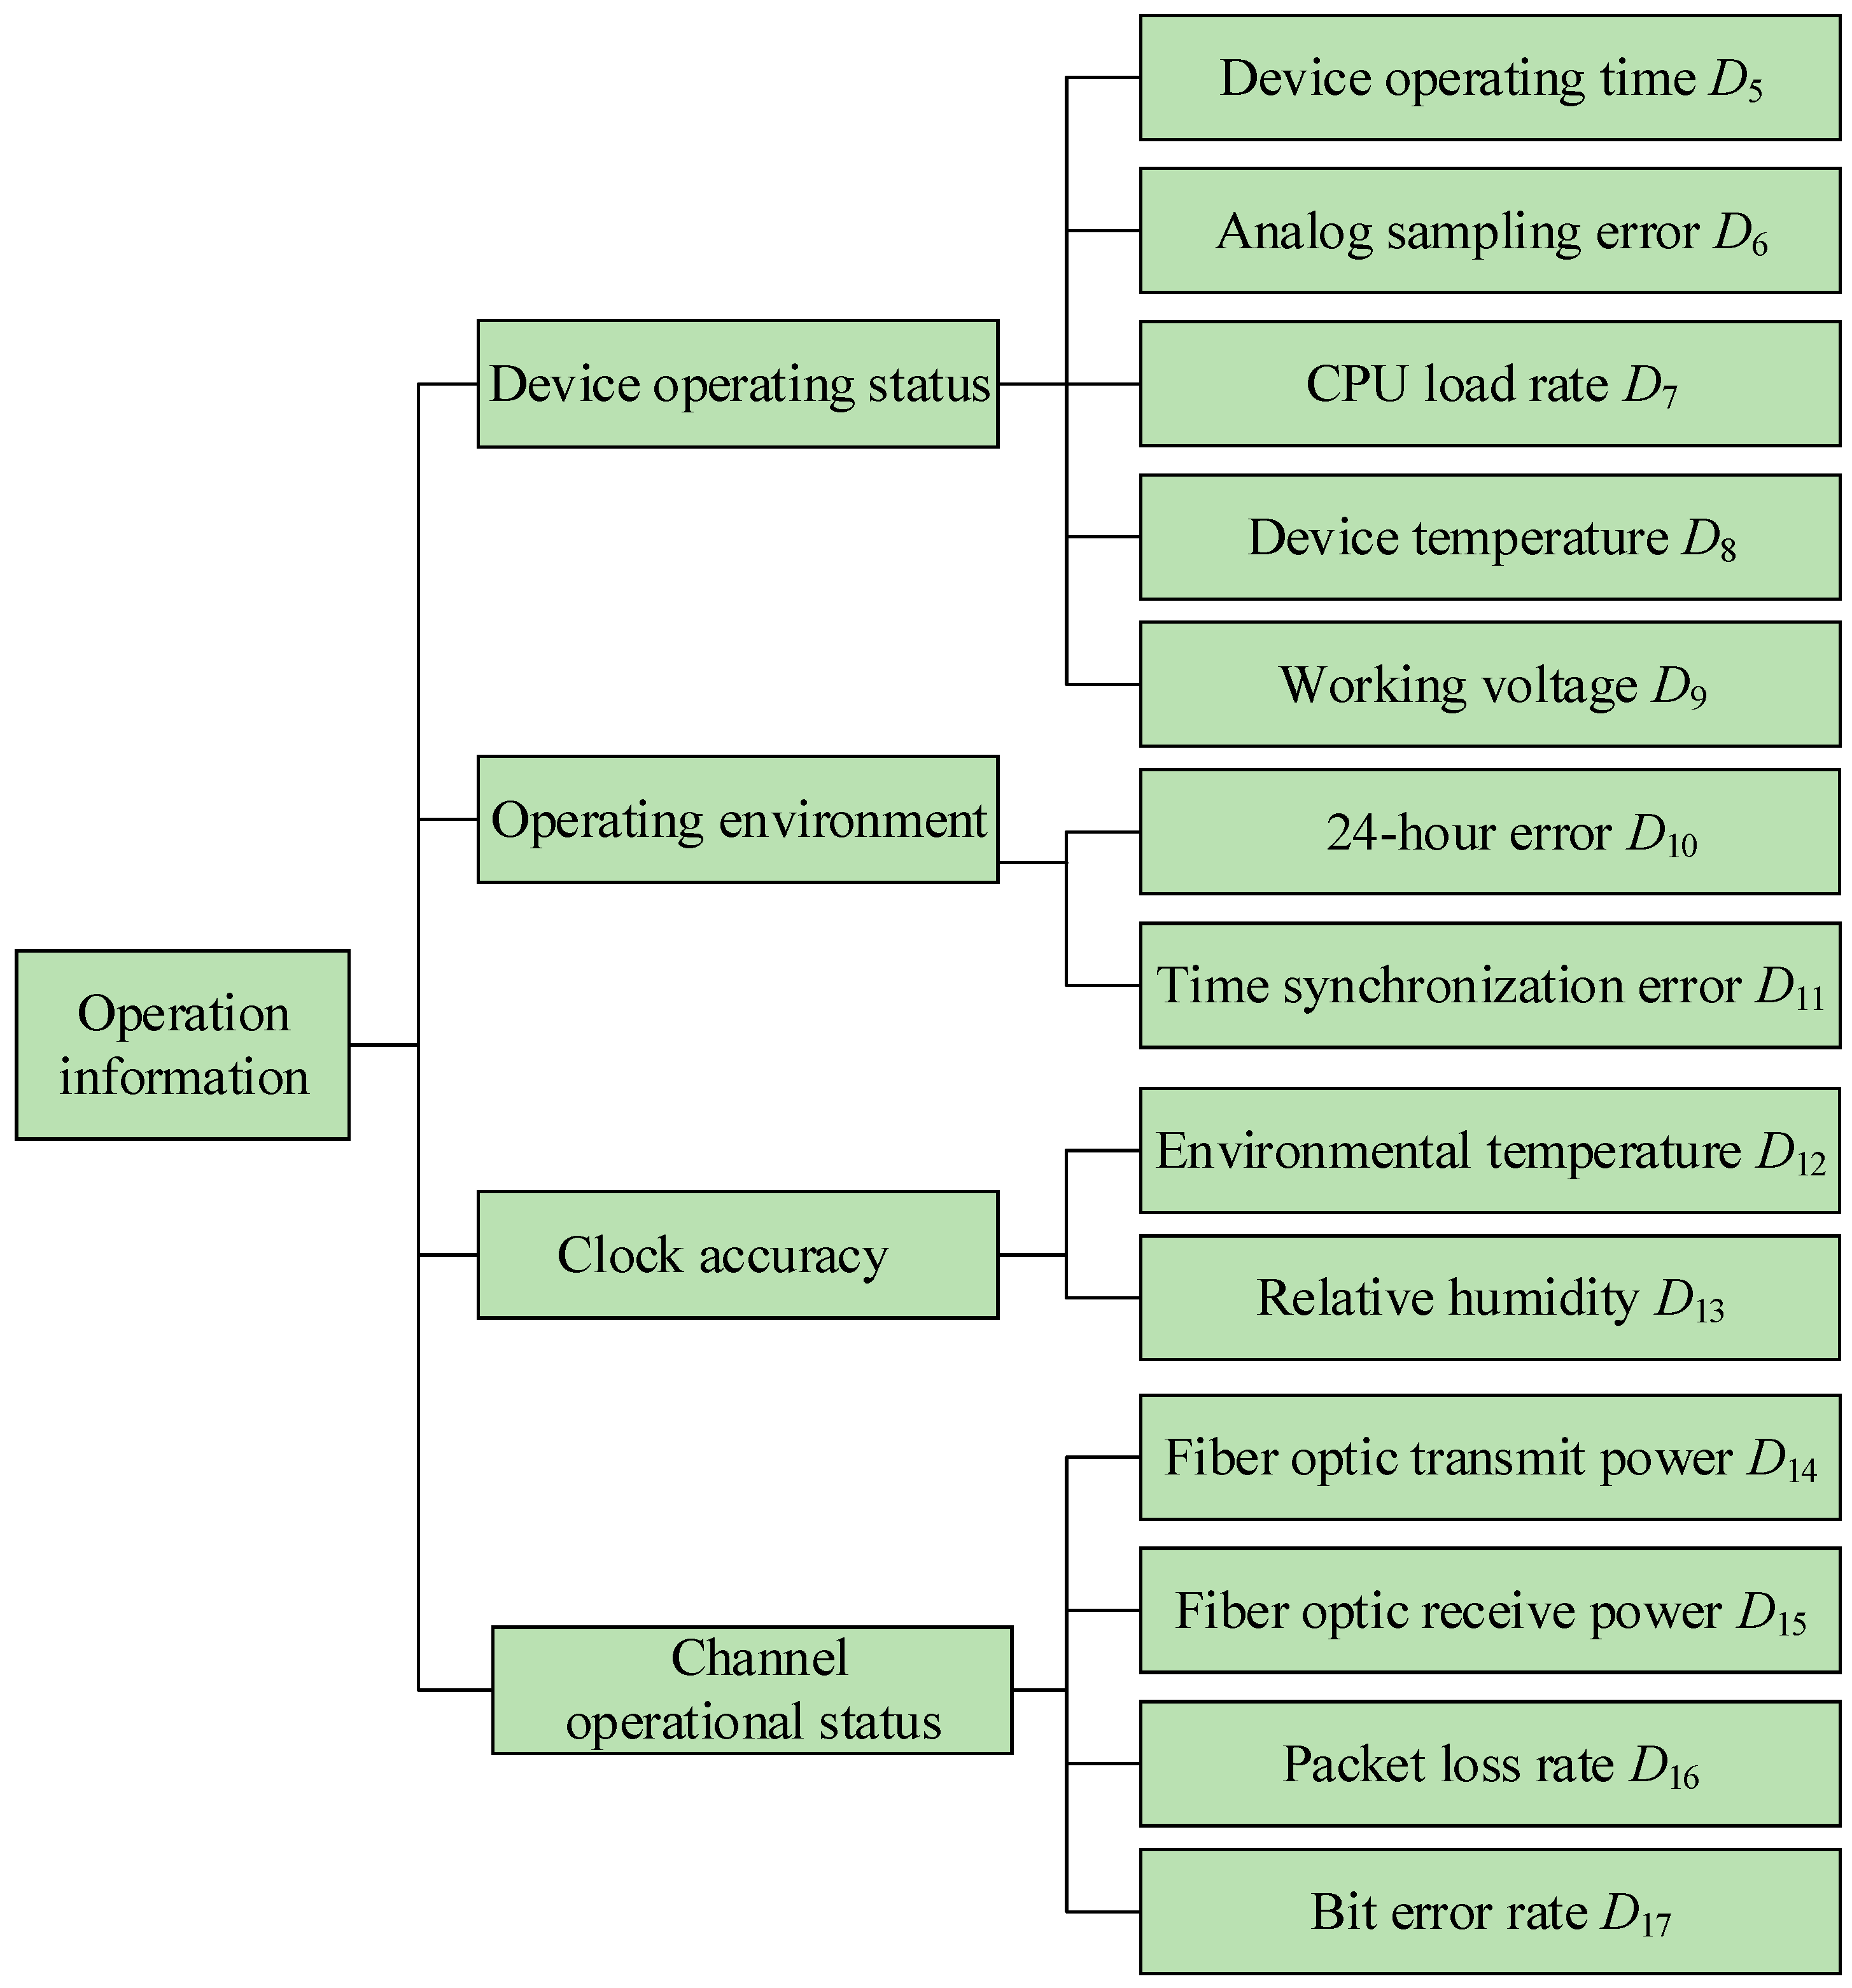
(2) The operation information of the DC protection devices in converter stations has 13 indicators, as shown in Figure 3. This mainly includes information on the device’s operating status, operating environment information, device channel operating information, etc.
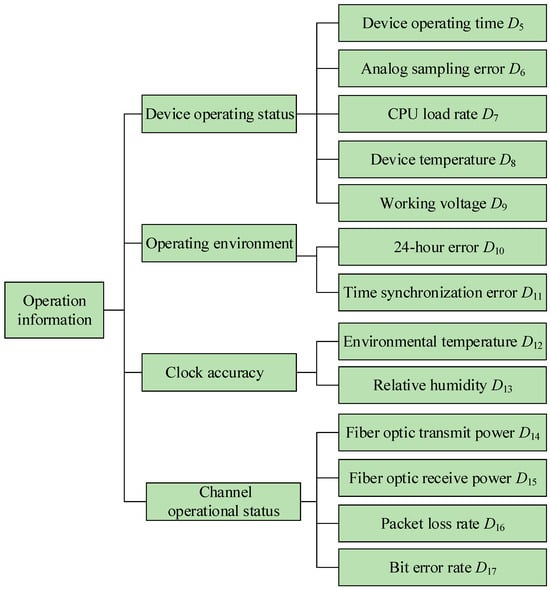
Figure 3.
The operation information of the DC protection devices in converter stations.
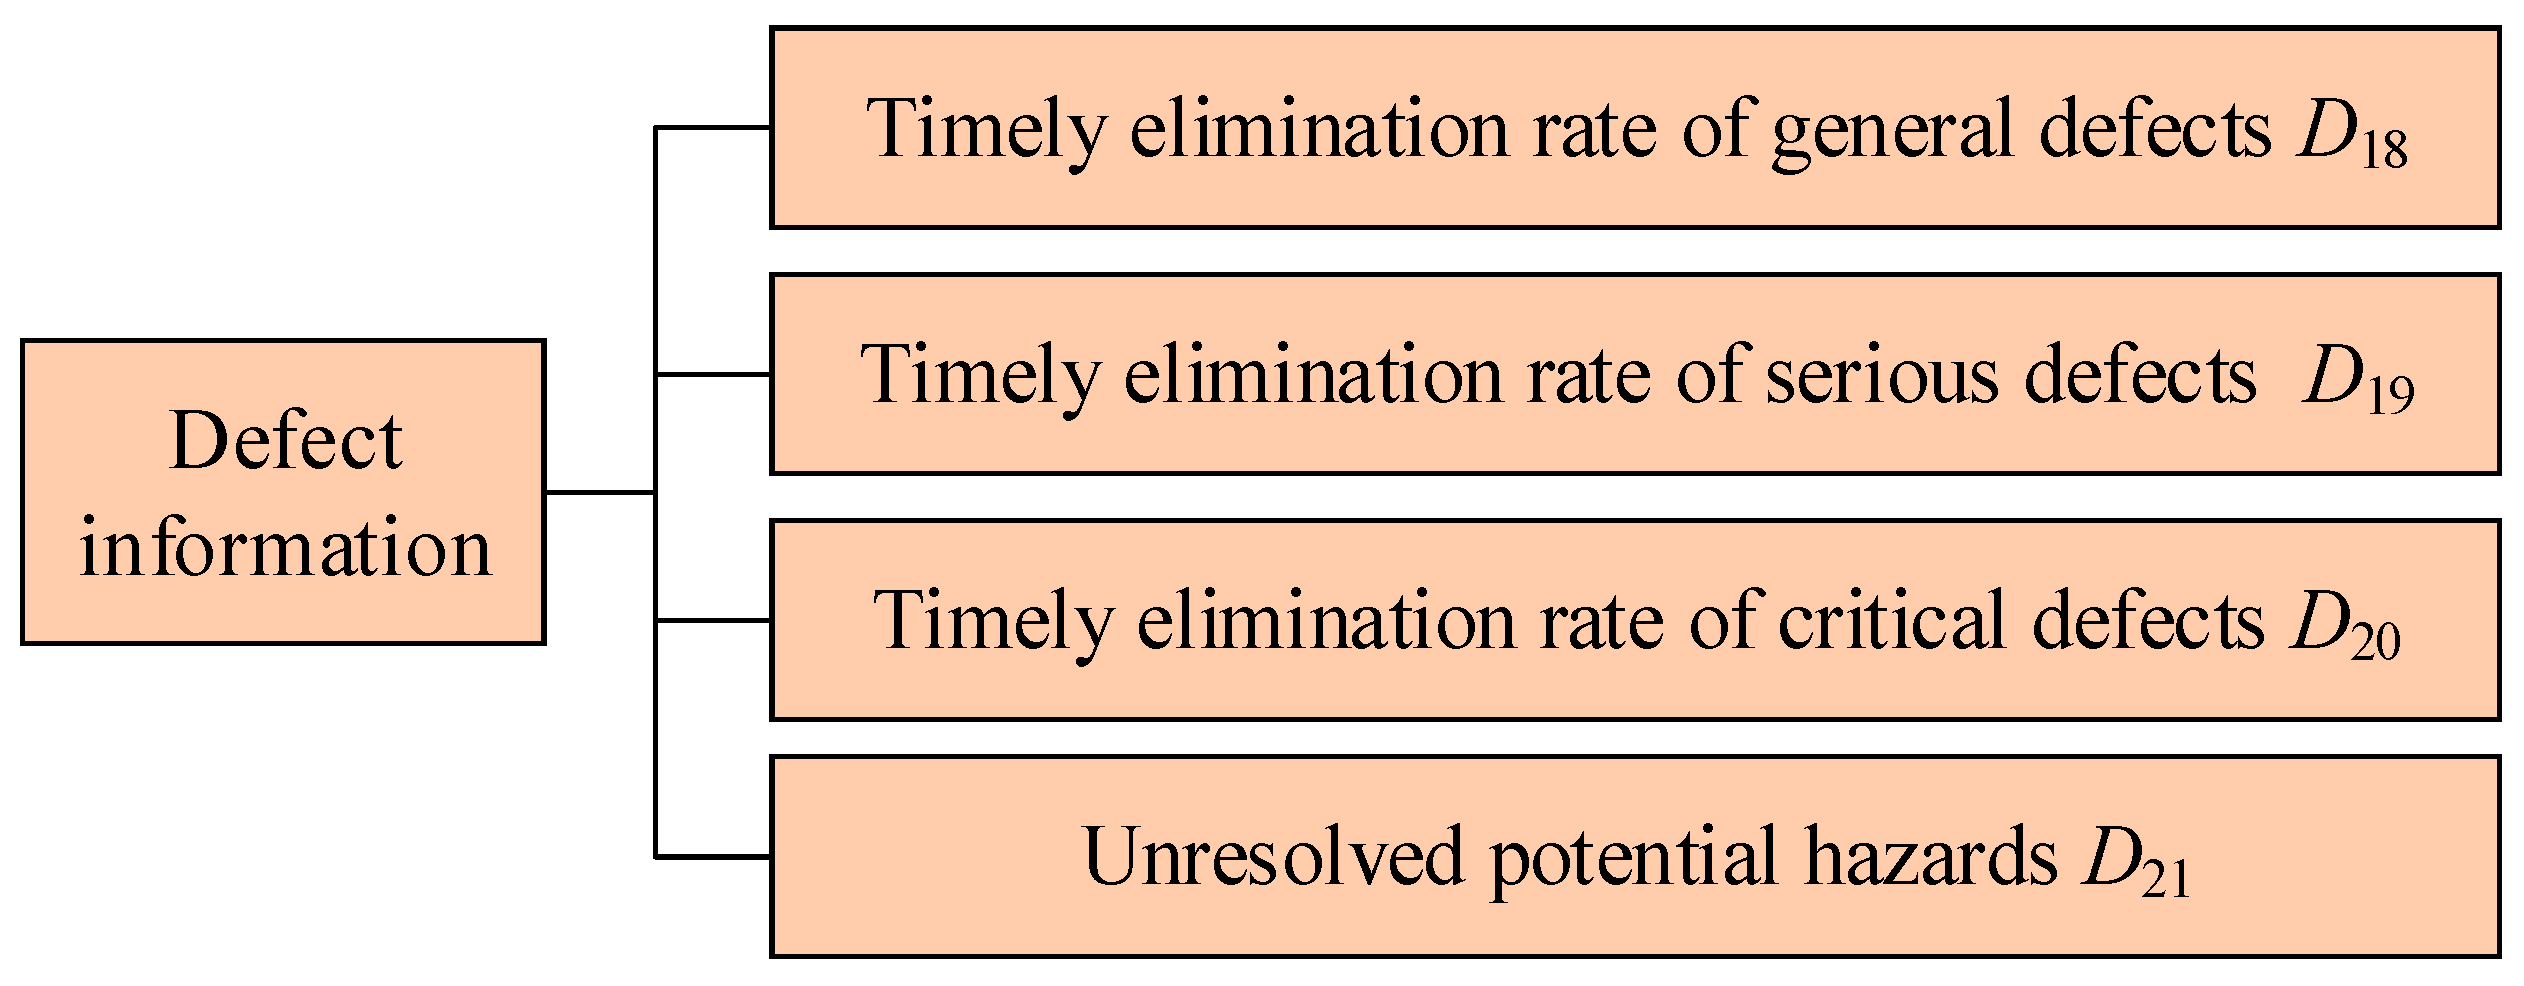
(3) Defect information
The defect information of the DC protection devices in converter stations has four indicators, as shown in Figure 4. Defect information mainly includes operational defects and defect rectification records. Its key indicators are introduced in the following subsections:
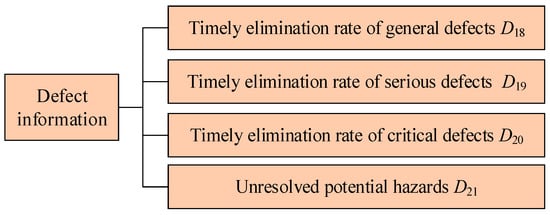
Figure 4.
The defect information of the DC protection devices in converter stations.
(1) Timely elimination rate of general defects D18
The timely elimination rate of general defects D18, which is expressed as:
where Tgd is the number of general defects, and Tgdt is the number of general defects completed within the specified time limit.
(2) Timely elimination rate of serious defects D19
The timely elimination rate of serious defects D19, which is defined as:
where Tsd represents the number of serious defects, and Tsdt represents the number of general defects completed within the specified time limit.
(3) Timely elimination rate of critical defects D20
The timely elimination rate of critical defects D20 is expressed as:
where Tcd is the number of critical defects, and Tcdt is the number of critical defects completed within the specified time limit.
Specifically, general defects should be resolved within a month, serious defects should be resolved within seventy-two hours, and critical defects should be resolved within twenty-four hours.
2.2. Classification of Status Levels for DC Protection Devices
The operational status of DC protection devices can be classified into levels based on the State Grid Corporation’s regulations and standards for evaluating the condition of protection equipment, as well as expert opinions in the field. The operational status of converter station DC protection devices is divided into five levels [18]: I-Good, II-General, III-Attentive, IV-Serious, and V-Alarm. When a DC protection device is in a Good state, it indicates that all its status indicators are within the good range, and the DC protection device can operate continuously and stably. When a DC protection device is in a General state, it indicates that the value of a single or multiple status assessment indicators for the device has slightly exceeded the good range, but is still within the specified range. The device can still operate normally, but monitoring during operation should be strengthened. When a DC protection device is in an Attentive state, it indicates that the values of multiple status assessment indicators for the device have significantly exceeded the good range, but are still within the specified range. Operation should be monitored, and maintenance should be arranged in due course. When a DC protection device is in a Serious state, it indicates that the values of multiple status assessment indicators for the device are very close to the specified boundary of the indicator values. Maintenance should be arranged as soon as possible at this point. When a DC protection device is in an Alarm state, it indicates that the value of a single or multiple status assessment indicators for the DC protection device has exceeded the specified range of the indicators. Maintenance should be arranged immediately.
3. Calculation of State Evaluation Indicator Weights for Converter Station DC Protection Devices
3.1. Calculation of Initial Weights
State evaluation of DC protection devices is a hierarchical, multi-indicator, comprehensive assessment. Objectively and reasonably allocating the weight of each indicator based on its relative importance is the key to quantitative evaluation. This paper adopts the Analytic Hierarchy Process (AHP) to determine the weights of indicators at each level. The calculation of initial indicator weights using AHP is divided into the following 3 steps:
(1) Construct the comparison judgment matrix
A 1–9 scale method is adopted to represent the relative importance between indicators. Multiple experts are invited to score the state evaluation indicators for the DC protection device selected to obtain the comparison judgment matrix . The specific scale and its meaning are shown in Table 1.

Table 1.
Meaning of scales 1 to 9.
(2) Calculate the initial relative weight vector
Calculate the eigenvector corresponding to the maximum eigenvalue of the comparison judgment matrix A. Then, normalize this eigenvector to obtain the initial relative weight vector of the state evaluation indicators .
(3) Consistency check
To eliminate the differences in judgment on the relative importance of various factors by different experts and the influence of the matrix order on the matrix, a consistency check needs to be performed on the normalized weight vector. If the consistency check is passed, the weight vector obtained in step (2) is the initial weight vector, and each element in the vector is the initial weight of the corresponding indicator. If the consistency check is not passed, the comparison judgment matrix needs to be rebuilt, and then steps (2) to (3) should be repeated until the consistency check is passed [19].
3.2. Calculation of Variable Weights
The weights of the state evaluation indicators determined by the Analytic Hierarchy Process (AHP) are fixed weights and do not change with the actual values of the state evaluation indicators. In the state evaluation of converter station DC protection devices, if the value of a certain state evaluation indicator for a DC protection device severely deviates from the good value, but only the fixed weight of the indicator is used for the DC protection device’s operating state evaluation, the overall assessment might still indicate a good level because the weight of this indicator is small relative to the total. This would prevent personnel from timely detecting potential hidden dangers in the DC protection device, leading to the inability of the DC protection device to respond promptly to faults occurring in the DC transmission system. Variable weight theory was proposed by Academician Peizhuang Wang [17] in 1985 to address the issue where fixed weights can sometimes be too small and affect the final state evaluation result. Variable weight theory not only considers the relative importance of each evaluation indicator but also takes into account the changes in the actual values of the indicators, allowing the effects of both aspects to be reflected in the variable weights simultaneously. To solve the problem where fixed weights cannot reflect the true operating state of a DC protection device when an indicator with a small fixed weight severely deviates from its good value, this paper introduces the variable weight theory [12]. In addition to the state variable weight functions for benefit-type and cost-type indicators already proposed in the existing variable weight theory, a state variable weight function for interval-type indicators is added to achieve real-time correction of the initial weights of the state evaluation indicators. The specific implementation steps are as follows:
(1) Calculate the state variable weight coefficients for state evaluation indicators
The state evaluation indicators for the converter station DC protection system selected in this paper can be divided into benefit-type, cost-type, and interval-type according to their nature.
For benefit-type indicators, a larger indicator value indicates a better equipment state, such as protection, reliable operation rate:
For cost-type indicators, a smaller indicator value indicates a better equipment state, such as analog sampling error:
For interval-type indicators, the equipment state is considered good when the indicator value is within a certain range, such as protection device temperature and operating voltage:
where is the actual value of the indicator, and are the maximum and minimum limits of the state evaluation indicator, respectively, and are the good values for benefit-type indicators and cost-type indicators, respectively, and are the upper and lower limits of the good value range for interval-type indicators.
(2) Combining the variable weight coefficients of the state assessment indicators, calculate the variable weight of each state assessment indicator according to the definition formula of the indicator variable weight:
where refers to the variable weight value of indicator i.
Through the aforementioned processing, the weights of indicators deviating from optimal values can be revised on the basis of fixed indicator weights. This enables a more accurate status assessment of the converter station’s DC protection device and allows for the timely detection of potential abnormalities within it.
4. Correlation Degree Analysis of State Evaluation Indicators for Converter Station DC Protection Devices
4.1. Determination of the Prescribed Value Range and the Value Ranges for the First Four State Levels for State Evaluation Indicators
The state of the DC protection device can be reflected by the actual values of the selected state evaluation indicators. When the actual values of all indicators are within their prescribed range, the correlation degree between each state evaluation indicator and the first four state levels is calculated based on the actual values of the state evaluation indicators. Then, the state of the DC protection device can be obtained by the weighted sum of the correlation degrees of all indicators with their corresponding weights. To calculate the correlation degree between each state evaluation indicator and the first four state levels, it is first necessary to determine the prescribed value range for the protection equipment state evaluation indicators and the value ranges belonging to the first four state levels. Due to the different characteristics of each state evaluation indicator, their prescribed value ranges are also not entirely the same.
According to relevant national standards, the matrix of the prescribed value ranges for the state evaluation indicators of converter station DC protection devices can be determined and is denoted as :
where are respectively the prescribed value ranges for n state evaluation indicators, and are respectively the lower and upper bounds of .
Based on relevant national standards and the literature, the value range matrix for the j-th state level (among the first four: ‘I-Good, II-General, III-Attentive, and IV-Serious’) corresponding to the state evaluation indicators for converter station DC protection devices can be determined and is denoted as :
where refers to the value range for the n-th state evaluation indicator belonging to the j-th state level, and are respectively the lower and upper bounds of .
4.2. Calculation of the Correlation
A correlation function can be used to describe the linear correlation between two variables. Its value ranges from −1 to 1. When the value of the correlation function is 1, it indicates the maximum correlation between the two variables. When the correlation function is equal to −1, it indicates the minimum correlation between the two variables. The correlation function expresses the degree to which things possess a certain property. Reference [20] defines the calculation formula for the correlation function on the real axis. The concept of distance in real variable functions is extended to “distance interval” (ju), and the distance between a point x on the real axis and the interval X0 = (a, b) is defined as:
Based on this, a correlation function for the state evaluation indicators of the converter station DC protection devices was established:
In the formula, and are defined respectively as the distance from the actual value of the i-th indicator to the value range of its first four status levels, and the length of the indicator’s prescribed value range. They are calculated by the following formula:
Based on the established correlation function, combining the actual value of the state evaluation indicator with its specified value range and the value range corresponding to the j-th state level allows for calculating the correlation value between the state evaluation indicator and the j-th state level among the first four state levels.
4.3. DC Protection Device Status Assessment Process
The status assessment flowchart for the DC protection device is shown in Figure 5. First, the actual values of the indicators are obtained. It is then determined if any indicator’s actual value exceeds its prescribed range. If any indicator exceeds its specified range, the status of the DC protection device is directly judged as “alarm.” If no indicator exceeds its prescribed range, the initial weight of each indicator is first determined based on the Analytic Hierarchy Process (AHP). Then, according to the actual values of the indicators and variable weight theory, the variable weight of each indicator is determined. The correlation degree function is used to determine the correlation degree of the indicators with the first four status levels. Subsequently, the correlation degrees of the status assessment indicators belonging to the same status level and their corresponding indicator weights are subjected to a weighted sum to obtain the comprehensive correlation degree of the DC protection device with the first four status levels:
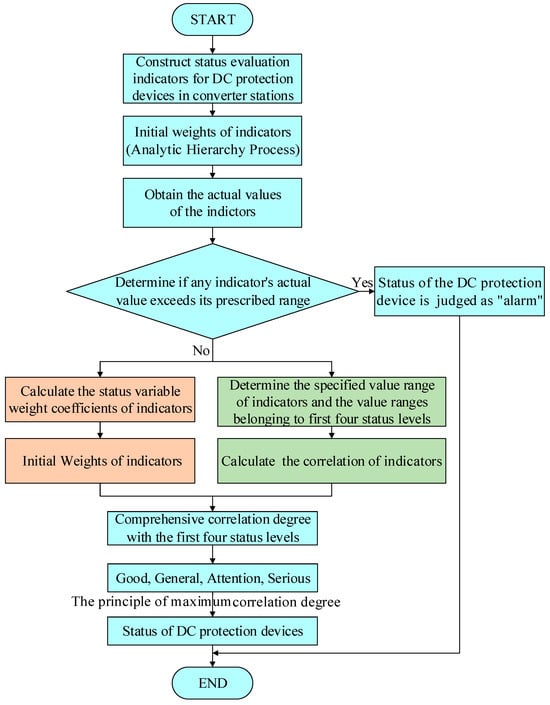
Figure 5.
Flowchart of DC protection device status assessment of the converter station.
Finally, according to the principle of maximum correlation degree, the maximum value is selected from the comprehensive correlation degrees of the converter station DC protection device with the first four status levels. The status level corresponding to this maximum value is determined as the status of the converter station’s DC protection device.
5. Case Study Analysis
To verify the effectiveness of the proposed method, multiple DC protection devices within a converter station were selected as evaluation objects. These devices were assessed based on the state evaluation index system constructed in this paper and the proposed method. The state information of these DC protection devices, the evaluation results obtained using the proposed method, and the actual operational status of the devices are in Table 2. Compared to the specified ranges for the DC protection device status evaluation indicators in Table 3, the value of indicator D14 for DC protection device B falls outside its prescribed range. According to the method in Figure 5, this DC protection device is in an “alarm” state. For the other DC protection devices, all their status evaluation indicator values are within their specified ranges. Following the method in Figure 5, the status of these other DC protection devices can be determined by calculating the weighted sum of the correlation degrees of all indicators with their corresponding weights.
Table 2.
The state information of multiple DC protection devices within a converter station.
Table 3.
A converter station DC protection device state assessment indicators belong to the first four state levels of the value range and the prescribed value range.
5.1. Calculation of Variable Weights for State Evaluation Indicators
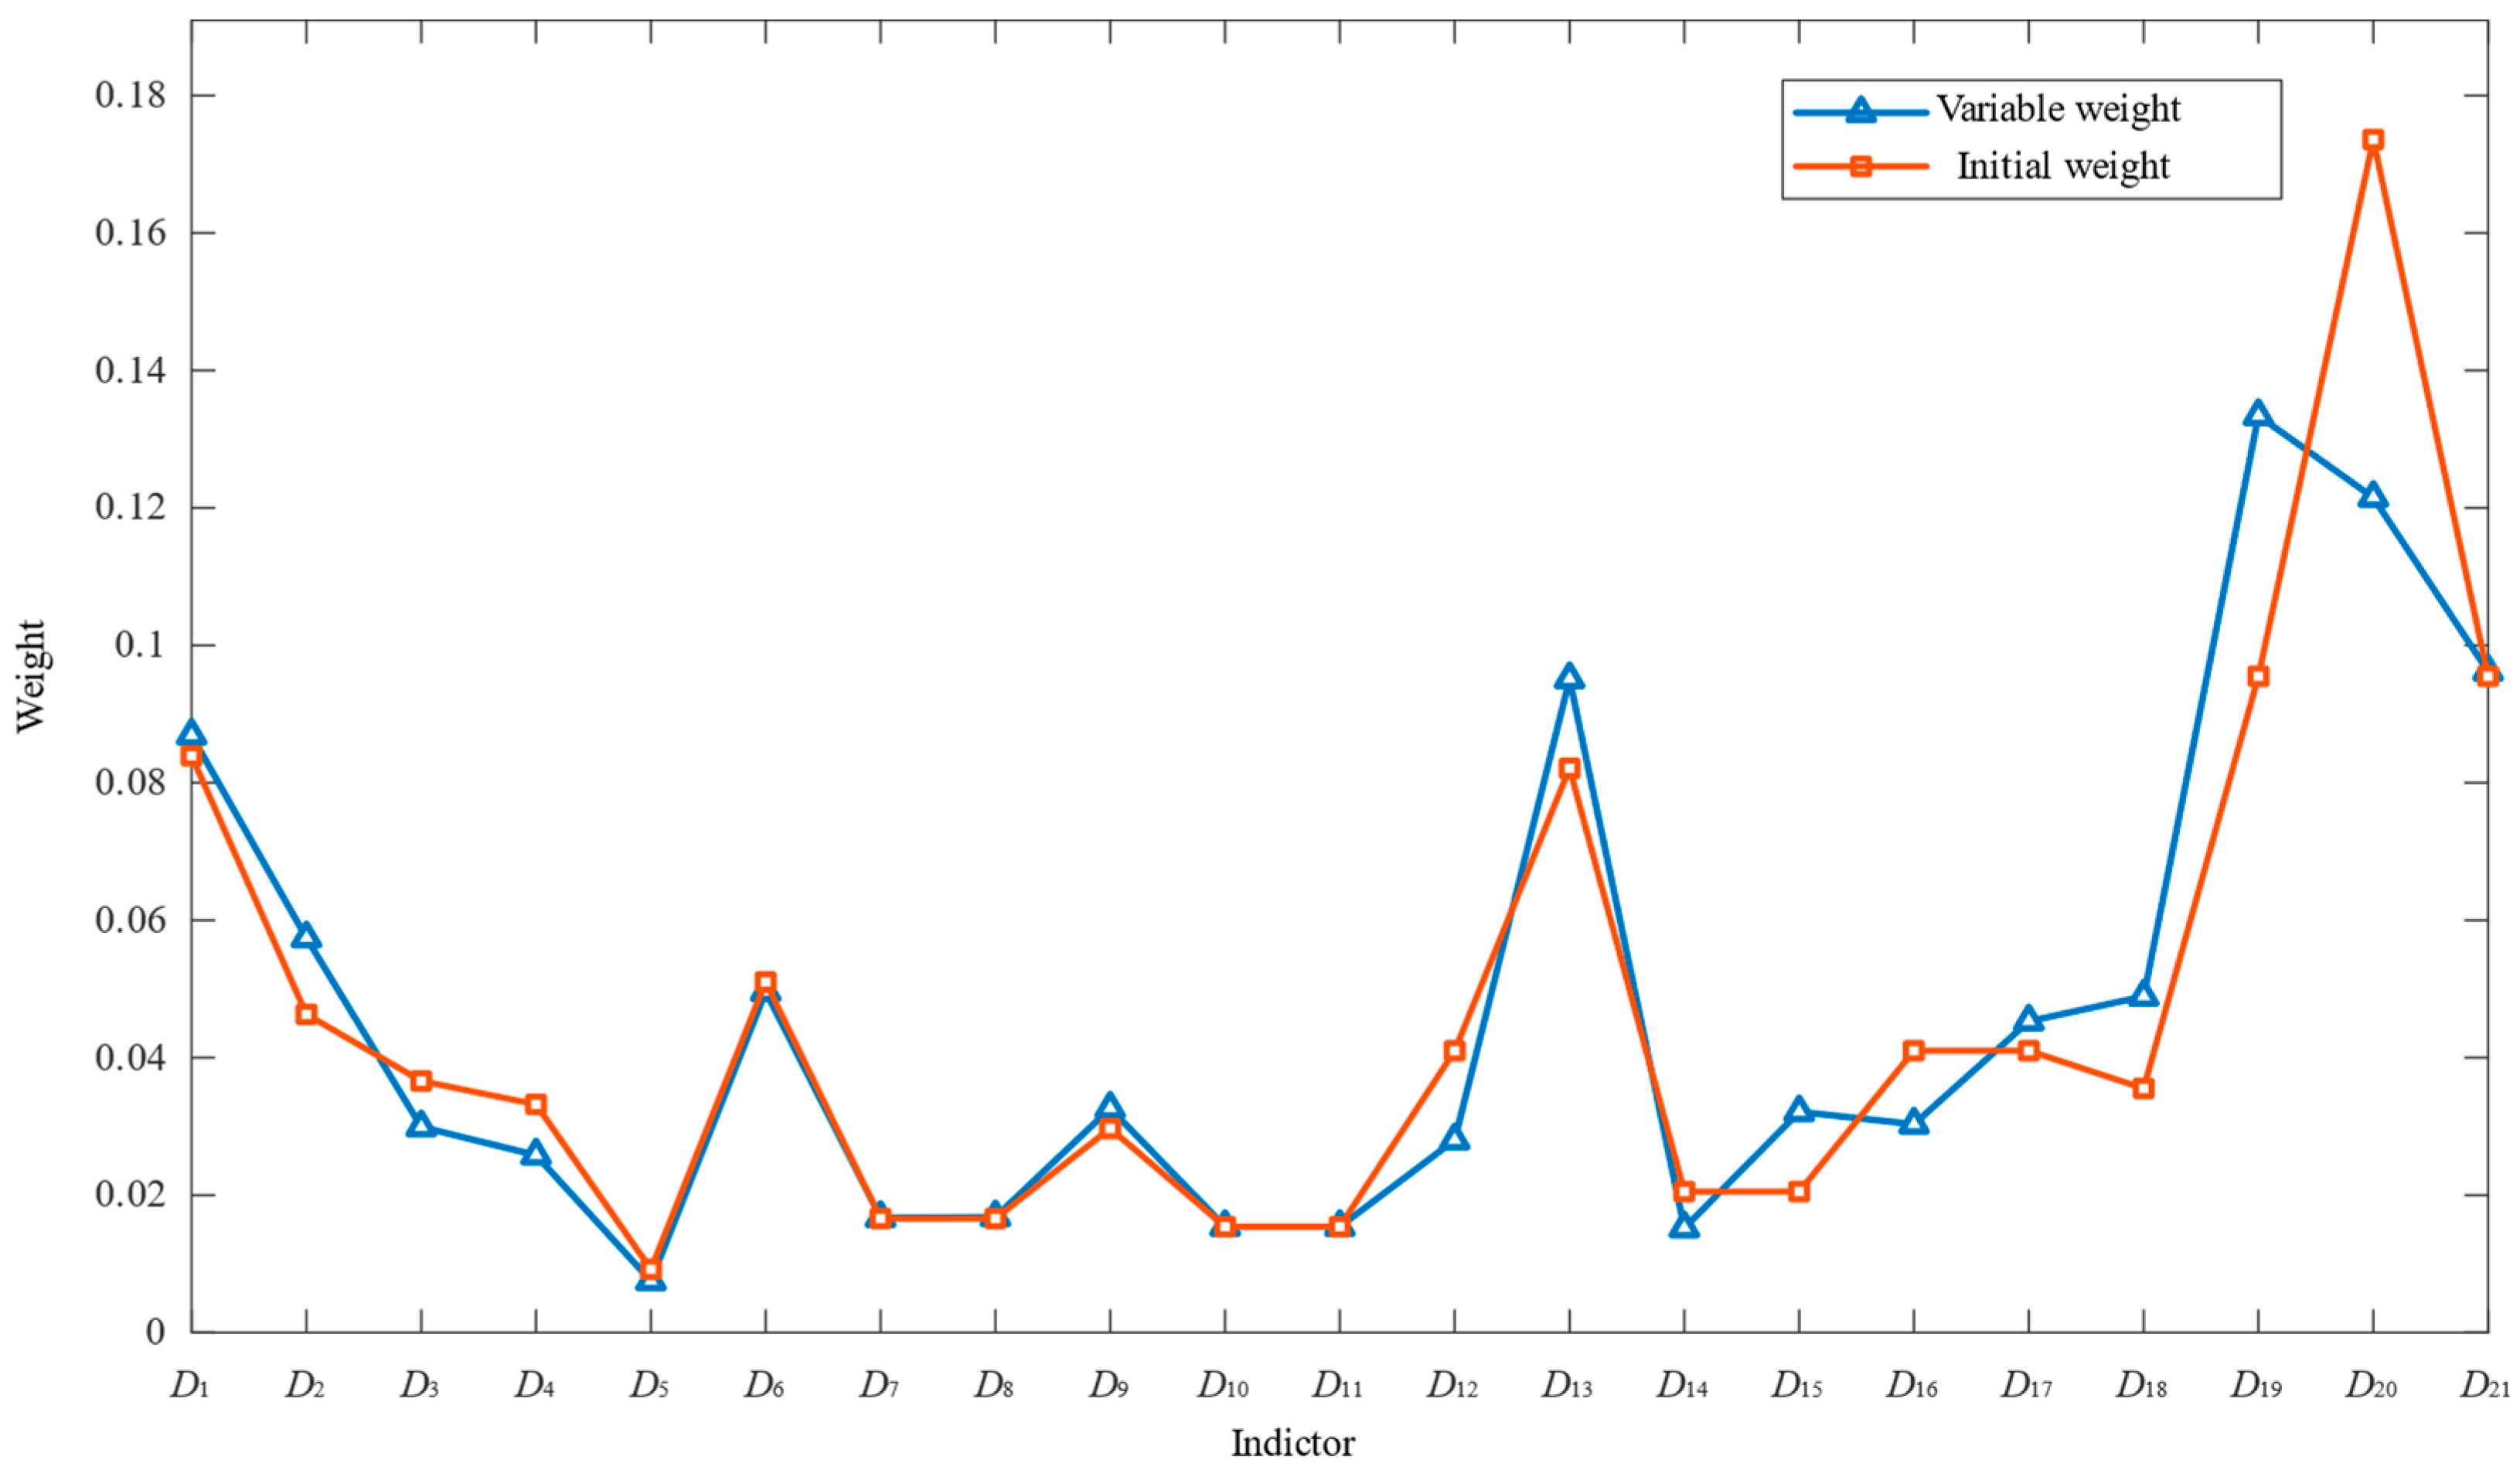
For DC protection device D in Table 2, using the Analytical Hierarchy Process (AHP), the initial weight matrix for the DC protection device D can be obtained as , the initial weight matrix for the maintenance information is , the initial weight matrix of operational information indicators is , the initial weight matrix for the equipment operational status , the initial weight matrix for the operating environment indicators is , the initial weight matrix for the clock accuracy indicators is , The initial weight matrix for the channel operational status indicators is , the initial weight matrix for defect information indicators is . The last-level indicators are processed with variable weighting based on formulas (4) to (7), the variable weight matrices are , , , , .
Since the state variable weighting coefficients for the operating environment indicators are all 1, there is no need to apply variable weighting to these indicators, meaning their weights do not change. The weights of the indicators before and after the change are shown in Figure 6.
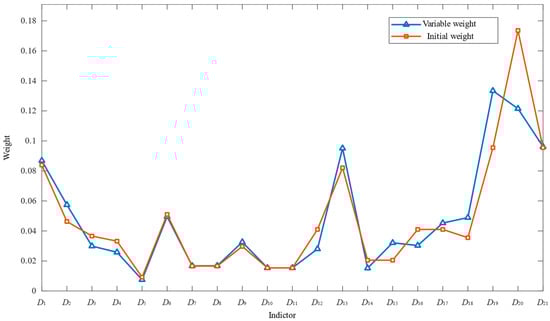
Figure 6.
Comparison of indicator weights before and after adjustment.
As can be seen in Figure 6, when the indicator values are within their good range, the difference in the weights of the indicators before and after the weight adjustment is not significant. However, when the equipment status assessment indicators show abnormalities, such as D19, the weights of these indicators are greater after the adjustment. This is because the weights established by the variable weight method are related to the values of the indicators. For example, D19 has a large value, while D14 has a small value. This demonstrates the sensitivity of the variable weight method to information about abnormal states, which is conducive to identifying hidden equipment problems.
5.2. The Calculation of the Correlation Between State Evaluation Indicators and the First Four State Levels
(1) Determine the value ranges for the first four status levels and the specified value range of the status assessment indicators.
The value ranges for the first four status levels and their prescribed value range for the status assessment indicators (D1–D21) of converter station DC protection devices are determined based on relevant national standards [18,21,22,23,24,25] and the related literature [2,9,26,27]. The determined value ranges for the first four status levels and the indicator specified value range for the status assessment indicators of a certain converter station’s DC protection device are shown in Table 3.
(2) Calculate the correlation between the status assessment indicators and the first four status levels.
First, respectively, calculate the distance between the status assessment indicators and the value ranges for the first four status levels and the specified value range. Then, obtain the correlation degree between the status assessment indicators and the first four status levels, as shown in Table 4.
Table 4.
Indicator variable weights and correlation values with the first four status levels.
As can be seen from Figure 7, most of the indicators with larger correlation values for DC protection device D fall into Level III. This indicates that the values of most indicators for the DC protection equipment are primarily within the attention range, suggesting that the overall status of the DC protection equipment is not very good. This finding is consistent with the final evaluation result of DC protection device D in Table 5.
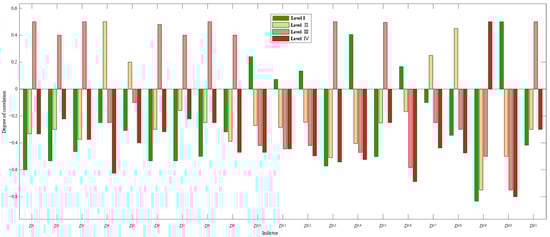
Figure 7.
Indicator correlation values with the first four status levels.
Table 5.
The comprehensive correlation degree for the multiple DC protection devices belonging to the first four state levels and assessment results.
5.3. Determination of the State of the DC Protection Device
By performing a weighted summation of the correlation values of the indicators belonging to the same state level and their corresponding weights, the comprehensive correlation degree for the multiple DC protection devices belonging to the first four state levels and assessment results are shown in Table 5.
From Table 5, it can be seen that the DC protection equipment status evaluated using the method proposed in this paper is consistent with the actual status of the DC protection equipment. This demonstrates that the proposed method can accurately assess the status of DC protection equipment.
5.4. Evaluation of Assessment Method Comparison
To verify the effectiveness and advanced nature of the evaluation algorithm proposed in this paper, three other evaluation models were selected for comparative experiments. The evaluation results of DC protection device D are shown in Table 5. Since the relevance values of the method in this paper range from −1 to 1, while the relevance values of the fuzzy logic method and cloud model method range from 0 to 1, conversion is required using Equation (14). The relevance values obtained after conversion with the first four state levels are shown in Table 5.
where refers to the converted correlation value, and refers to the original correlation value.
From Table 6, based on the results of the first two sets of comparative experiments, it’s evident that the Analytic Hierarchy Process (AHP) method for calculating indicator weights has limitations, often leading to evaluation results that are inconsistent with actual conditions. While the assessment method based on the cloud model and fuzzy logic can yield evaluation results consistent with actual conditions, the correlation value to “General” and “Attentive” status levels is almost the same. This makes the identification of equipment status rather ambiguous and can easily lead to incorrect judgments.
Table 6.
Comparison of different assessment method results.
6. Conclusions
To accurately grasp the operational status of DC protection devices in converter stations, a status assessment indicator system for these devices, incorporating their operational information, has been established in accordance with relevant technical specifications and standards. When the actual value of a single indicator or multiple indicators of a DC protection device exceeds its specified range, the device’s status is directly determined as “alarm.” Conversely, when the actual values of all indicators are within their prescribed ranges, variable weight theory is introduced to achieve real-time correction of indicator weights. This accurately reflects the impact on the protection device’s status assessment when some indicators seriously deviate from their optimal values. Furthermore, a correlation degree function is utilized to calculate the correlation between the status assessment indicators and the status levels of the DC protection device, thereby making the determination of the degree to which the DC protection device belongs to a certain status level, based on its actual indicator values, more objective. Taking multiple DC protection devices in a certain converter station as an example, this approach has achieved accurate assessment of its operational status, solved the problem of initial indicator weights being too small and thus affecting assessment results, and can provide timely and effective scientific guidance for the condition-based maintenance of DC protection devices in converter stations.
Author Contributions
Conceptualization, Q.Y. and L.L.; methodology, Z.M.; software, Z.M.; validation, X.L., Z.M. and L.L.; formal analysis, Q.Y. and Z.M.; investigation, M.L.; data curation, Z.M.; writing—original draft preparation, Z.M., Q.W. and S.L.; writing—review and editing, Z.M., X.L., Q.W. and S.L.; visualization, Z.Z.; supervision, X.L., K.W. and X.Y.; project administration, L.L. and X.L.; funding acquisition, M.L. All authors have read and agreed to the published version of the manuscript.
Funding
This research was supported by Research on Condition Monitoring of DC Protection Equipment and Fault Diagnosis Technology for Converter Stations Based on Multi-Source Information (Grant number: 521997230026).
Data Availability Statement
The original contributions presented in this study are included in the article. Further inquiries can be directed to the corresponding author.
Conflicts of Interest
Authors Qi Yang, Min Li, Zihan Zhao, Ke Wang and Xiangfei Yang were employed by State Grid Sichuan Electric Power Co., Ltd., with technology project “Research on Condition Monitoring of DC Protection Equipment and Fault Diagnosis Technology for Converter Stations Based on Multi-Source Information” (Grant number: 521997230026). The remaining authors declare that the research was conducted in the absence of any commercial or financial relationships that could be construed as a potential conflict of interest.
References
- Lyu, P. Research on HVDC Operation Characteristics Under Influence of Hybrid AC/DC Power Grids. Power Syst. Technol. 2020, 46, 503–510. [Google Scholar]
- Zhang, L.; Guo, P.; Li, Z. A comprehensive evaluation method for relay protection adapted to new electric power system. Power Syst. Technol. 2024, 48, 1633–1645. [Google Scholar]
- Jin, L.; Zhou, Z.; Zhan, R. Temperature simulation analysis and life evaluation for components of relay protection equipment. Power Syst. Prot. Control 2023, 51, 159–168. [Google Scholar]
- Tavakoli, M.; Nafar, M. Human reliability analysis in maintenance team of power transmission system protection. Prot. Control Mod. Power Syst. 2020, 5, 270–282. [Google Scholar] [CrossRef]
- Ye, Y.; Li, D.; Xie, M. A state evaluation method for a relay protection device based on SSA-SVM. Power Syst. Prot. Control 2022, 50, 171–178. [Google Scholar]
- Liu, Y.; Zhang, J.; Yang, X. Construction method of evaluation index system of relay protection based on macroscopic and microcosmic view. Power Syst. Technol. 2020, 44, 3090–3096. [Google Scholar]
- Liu, Y.; Zhang, J.; Yang, X. Comprehensive Evaluation of Relay Protection Based on Expert Investigation and G1 Method. Power Syst. Technol. 2020, 44, 3533–3539. [Google Scholar]
- State Grid Corporation of China. Q/GDW 10395-2022 Operation Regulation for Power System Relay Protection and Safety Automatic Devices; China Electric Power Press: Beijing, China, 2022. [Google Scholar]
- Ye, Y.; Huang, T.; Xie, M. A state assessment method for intelligent substation secondary equipment based on multi-model ensemble learning. Power Syst. Prot. Control 2021, 49, 148–157. [Google Scholar]
- Ye, Y.; Xie, M.; Huang, T. A state assessment method for intelligent substation secondary equipment based on grey theory and cloud model. Power Syst. Prot. Control 2019, 47, 105–111. [Google Scholar]
- Xiong, N.; Rao, Y.; Song, Y. Research on relay protection status evaluation method of intelligent substation based on improved cloud model. Power Syst. Big Data 2021, 24, 74–82. [Google Scholar]
- Zhou, Y.; Ou, R.; Li, D. Health status assessment of secondary equipment based on interval PCA and fuzzy comprehensive evaluation. Manuf. Autom. 2023, 45, 104–109. [Google Scholar]
- Li, L.; Chen, Q.; Yang, R. Fuzzy Comprehensive Evaluation Method for Substation Automatic Secondary Equipment Status Based on Hamacher Operator. Hubei Electr. Power 2022, 46, 45–49. [Google Scholar]
- Yang, G.; Li, H.; Guo, P. An Operation Status Perception Method for Relay Protection Device Based on Fuzzy Comprehensive Evaluation. Electr. Power Inf. Commun. Technol. 2020, 18, 74–83. [Google Scholar]
- Sun, H.; Zhang, G.; Gao, B. Fuzzy comprehensive evaluation of relay protection equipment status in intelligent substations based on combination weighting method. Electr. Meas. Instrum. 2020, 57, 23–28. [Google Scholar]
- Nan, D.; Wang, W.; Zhang, L. Risk assessment of the operation state of power grid secondary equipment based on association rule mining and combination weighting-cloud model. Power Syst. Prot. Control 2021, 49, 67–76. [Google Scholar]
- Yang, X. State Evaluation of Secondary Equipment in Smart Substations Based on Cloud Models. Master’s Thesis, Guangxi University, Nanning, China, 2021. [Google Scholar]
- National Energy Administration. DL∕T 2377-2021 Technical Regulation for State Evaluation of HVDC Transmission Control and Protection System; China Electric Power Press: Beijing, China, 2021.
- Ye, D.; Zheng, J.; Dai, Y. Health Status Grading Evaluation Method of Subway Power Supply Equipment Considering Index Importance. Urban Rapid Rail Transit 2024, 37, 116–123. [Google Scholar]
- Yang, C.; Cai, W. Extension Engineering; Science Press: Beijing, China, 2007. [Google Scholar]
- State Grid Corporation of China. Q/GDW 700.5-2012 ±800kV UHV DC Transmission Control and Protection Equipment Part 5: DC System Protection Equipment; China Electric Power Press: Beijing, China, 2012. [Google Scholar]
- National Energy Administration. DL/T 587-2016, Operation Management Regulation for Relay Protection and Automatic Safety Devices; China Electric Power Press: Beijing, China, 2016.
- National Energy Administration. DL/T 995-2016, Testing Regulation for Relay Protection and Power System Automatic Safety Devices; China Electric Power Press: Beijing, China, 2016.
- State Grid Corporation of China. Q/GDW 11285-2022, Guideline for Relay Protection State Evaluation; China Electric Power Press: Beijing, China, 2022. [Google Scholar]
- National Energy Administration. DL/T 364-2019, General Technical Requirements for Fiber Channel Transmission Protection Information; China Electric Power Press: Beijing, China, 2019.
- Zhang, L.; Lv, P.; Zhang, H. Analysis on Protective Relaying and Its Operation Conditions of SGCC AC Systems of 220kV and above in 2018. Power Syst. Technol. 2020, 44, 217–222. [Google Scholar]
- Shi, Y.; Jiang, Z.; An, C. Research on practical state evaluation of protection device in smart substation. Power Syst. Prot. Control 2016, 44, 119–125. [Google Scholar]


Disclaimer/Publisher’s Note: The statements, opinions and data contained in all publications are solely those of the individual author(s) and contributor(s) and not of MDPI and/or the editor(s). MDPI and/or the editor(s) disclaim responsibility for any injury to people or property resulting from any ideas, methods, instructions or products referred to in the content. |
© 2025 by the authors. Licensee MDPI, Basel, Switzerland. This article is an open access article distributed under the terms and conditions of the Creative Commons Attribution (CC BY) license (https://creativecommons.org/licenses/by/4.0/).